Article

Induction Heating of a Fluidized Pebble Bed: Numerical and Experimental Analysis

Institute of Engineering Thermodynamics, German Aerospace Center (DLR), 70569 Stuttgart, Germany
*
Author to whom correspondence should be addressed.
Appl. Sci. 2023, 13(4), 2311; https://doi.org/10.3390/app13042311
Submission received: 4 December 2022 / Revised: 2 February 2023 / Accepted: 2 February 2023 / Published: 10 February 2023

Abstract

:
The development of energy-efficient Power-to-Heat (PtH) technologies with high power density on a utility scale is a key element in the future of flexible energy systems. Although existing solutions for electric flow heaters (EFH) based on resistance heating have a high efficiency, the process outlet temperature and power output are limited by the lifetime of the contact heating elements. Inductively heated packed bed heaters can achieve higher gas outlet temperatures with a higher power density, which is essential for an efficient process. This paper focuses on the modeling, experimental validation and numerical analysis of inductively heated pebble bed gas heater. Foremost, a model that is based on a 3D finite volume method approach is introduced. After that, an experimental setup for different sphere arrangements is used to obtain results for concept verification and model validation. With the model validated, the design space for the PtH concept is investigated by varying the heat transfer area and material properties of the pebble bed. Design solutions with high energy efficiency above 90% and power density over 5.5 MW/m3 are presented for magnetic as well as non-magnetic materials at laboratory and utility scale.

Graphical Abstract

1. Introduction

The development of Power-to-Heat (PtH) technologies with high power density and high efficiency on a utility scale is a key element for coupling the electricity and the heat sector [1,2]. There are currently two candidates for PtH technologies worth considering for the electric flow heater (EFH) with high power density, efficiency and temperature: resistance heating and induction heating. Both technologies are widely used for high-temperature industrial material treatment (hardening, forging and melting of metal) [3,4,5], where megawatt scale process heat is required. For the industrial application of the EFH, however, resistance heating has become generally established, as this technology has lower capital costs and higher efficiency compared to the induction heating technology [3].

1.1. Applications of Electric Flow Heaters

Various electric flow heaters are used industrially at different power levels. On a megawatt scale, the most common type is the flanged immersion heater. This configuration offers a large heat transfer area and is mostly used in plant engineering for drying and air-conditioning with gaseous media [6]. To this end, the gaseous heat transfer fluid (HTF), which is typically air, flows in direct contact along the tubular heating elements providing high-temperature process heat. The heating element usually consists of a Ni-Cr resistance wire, which is embedded in a MgO metallic jacket tube. Low cost solutions for resistance wires reach operating temperatures up to 1200 °C [6]. However, the MgO layer limits the heat transfer to the jacket tube. As a result, the maximum achievable gas temperatures are in the range of 600–700 °C [6,7]. Despite the large heating area, the poor heat transfer properties of the HTF and the limited jacket temperatures limit the heating application to temperatures lower than 700 °C on a utility scale.
EFH based on induction heating has the potential to achieve process temperatures above 700 °C for industrial scale applications due to the typically high induced power rating of more than 1 MWel per m2 [8]. However, its equipment costs cannot compete with the costs of fossil gas fired heater systems. Therefore, for high process temperatures above 700 °C, natural gas heaters are preferred.
Additionally, the induction fluid heater can be used for power plant applications in so called Carnot batteries (CB). In these batteries, electric power is converted to high-temperature (HT) heat that is first stored in a thermal energy storage (TES) system and then converted back to electricity in a thermal power cycle as needed. The EFH is mostly integrated into the charging cycle of the CB to raise the maximum temperature and hence the energy density of the system [9]. As a result, component size and thus the equipment cost are reduced [10].
A promising application of EFHs is the Brayton battery [10,11,12], which is a subcategory of CBs. In a Brayton battery, the HT heat from the EFH is stored in a sensible TES while charging and converted back to electricity using the Brayton gas turbine cycle while discharging. The EFH is integrated into the charging heat pump cycle downstream of the air compressor to increase the inlet temperature of the sensible TES up to 1050 °C [10] and beyond [12]. Benato [10] first showed that additional HT heat from EFHs increases the energy density of the system by 105% and reduces its costs by 35%. However, the author omitted details of PtH technology and of the EFH concept that enables such high process temperatures to be achieved. In addition to Benato’s work, Belik [12] presented an increase in energy density of 70% accompanied by a cost reduction of 23% applying a 17 MW EFH component. To fill the research gap of the missing EFH solution, the author proposed an induction air heater comprising an inductively heated pebble bed (PB) to generate HT process heat with a conversion efficiency of 85% and at temperatures above 1000 °C. The purpose of this work is to verify this PtH concept for the application in a Brayton battery and to provide a validated design tool along with suitable materials for energy-efficient HT operation.

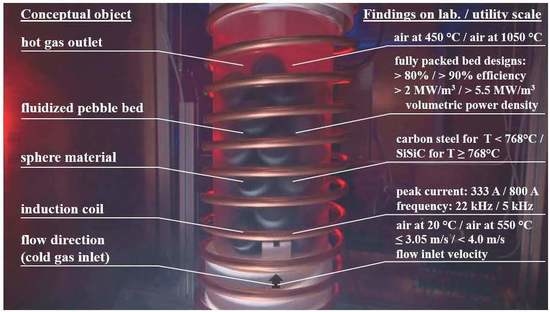
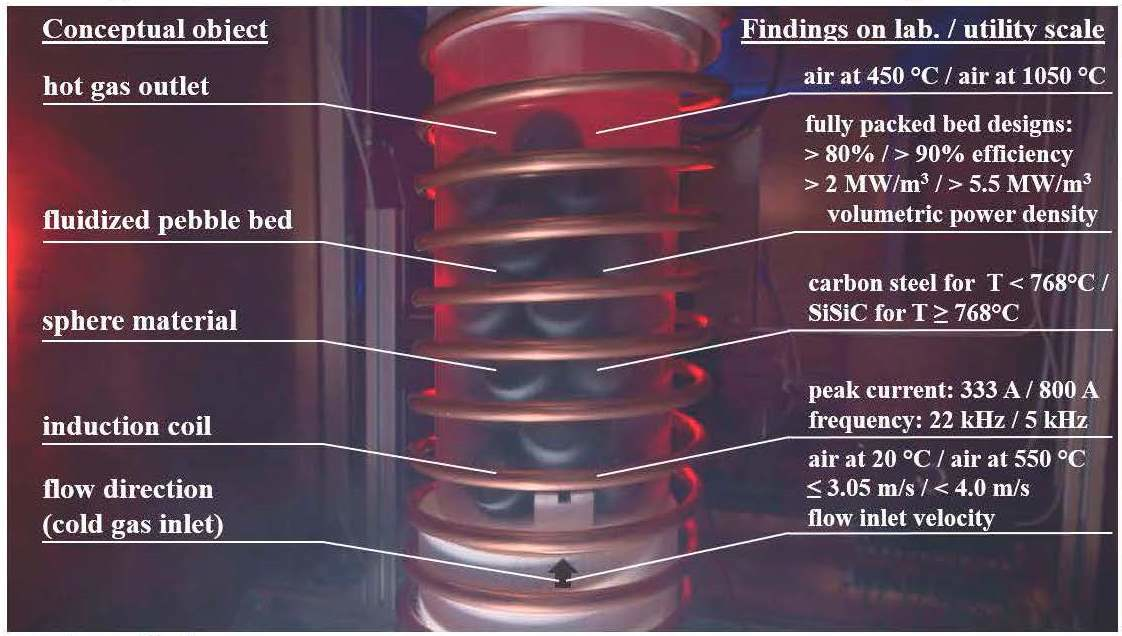
1.2. Conceptual Arrangement of the Induction Gas Hater

The concept of such an inductively heated pebble bed (PB) gas heater is illustrated in Figure 1. It comprises a PB located inside of an insulated induction heating coil. On the one hand, the insulation and the ceramic tube prevent a direct short circuit between the induction coil and the PB. On the other hand, they minimize the heat loss from the hot packed bed to the ambient. In addition to this loss, Figure 1 shows ohmic losses of the induction coil, which are removed as waste heat by the water-cooling system. Furthermore, the illustrated heat balance indicates the volumetric heat q ˙ i n d induced inside the PB which is further transferred as HT heat Q ˙ t h to the upflowing air stream. This PtH concept enables a high and uniformly distributed power density within the granular bed, as eddy currents are induced in each sphere and heat them up according to the Joule effect. In addition, the packed bed provides a high specific heat transfer area that is often accompanied with a turbulent fluid flow which leads to an efficient heat transfer to the air flow. Both these conceptual advantages allow the efficient generation and transport of HT heat to achieve gas outlet temperatures up to 1050 °C [10] required for an application of the induction gas heater concept in a Brayton battery.
Few authors have studied induction heating concepts for heating applications with different HTFs. Curran et al. [8] were the first to present a tubular PtH concept of an induction heater to heat an oil flow. The laboratory setup uses a mild steel tube that is shrunk on to a stainless liner to heat the oil stream by 30 °C to temperatures far below 70 °C. The tubular concept achieves a process efficiency above 80% with an input power of 888 W. Another tubular concept in a similar power range was proposed by Unver et al. [13] to heat up an air flow to 50–60 °C for the purpose of drying fruits and vegetables. The authors studied two induction air heater prototypes These prototypes respectively achieved efficiencies of 77% and 87%, using insulated carbon steel tubes. In addition, the authors observed the significant influence of the flow rate on efficiency, which increases by approximately 17% for a doubling in the flow rate. In another work, Unver [14] modified the tubular concept using five additional carbon steel disks, which are arranged perpendicular to the air flow. This measure resulted in a decline in efficiency from 29% to 16% due to the presence of the disks. Unver’s tubular heater concepts aim to generate heat far below the Curie point of steel (768 °C) where carbon steel tubes with a small specific heat transfer area are sufficient to ensure high efficiency. The application in a Brayton battery, however, requires outlet temperatures far above the Curie point of steel, where a large specific heat transfer area is required to ensure a small temperature difference between solid and fluid.
In contrast to the tubular concepts, the inductively heated PB concept from Figure 1 offers a significantly higher specific heat transfer area. Therefore, various scientific studies used the inductively heated PB as a volumetric heat source to predict heat transfer rates for various HTFs [15,16,17,18]. Baumeister et al. [15] and Eichorn et al. [16] reported linear temperature distribution for packed beds with induction heating. Xu et al. [17] used induction heating to study flow boiling heat transfer effects of inductively heated packed bed. Leininger et al. [18] used an induction heating coil to generate heat inside the spheres in an effort to simulate conditions which are present in a fluidized nuclear reactor. However, these studies determined the electrically generated heat inside the randomly-packed bed exclusively through experiments either by means of an oscilloscope measurement at coil terminals or by the measurement from the power converter. In contrast, Duquenne et al. [19,20] introduced a simplified modeling approach for the calculation of the electrically generated heat using the analogy between a regular pile of spheres and a cylinder. The authors used the electromagnetic solution applied in [21] for the cylinder in an alternating magnet field to calculate the heat generation of a rod bundle. This solution corresponds to that of the well-ordered PB if the electrical resistance and the mass of both systems are equivalent [20]. Although this modeling approach gives an accurate and time-efficient prediction of the equivalent bed resistance, it is only valid for particle diameters below 5 mm [20]. Altogether, with the exception of reference [20], all of the mentioned works determined the induced heat source inside the PB by means of electrical measurements.

1.3. Contributions

Although many induction heating studies have been conducted, whether for drying with air using the tubular heater concept or for heat transfer studies using the packed bed, the concept of the inductively heated PB for heating air to temperatures above the Curie point of steel has not been addressed. Moreover, the heat generation and heat transfer through the packed bed has been determined only experimentally. However, the prediction of the power density and process efficiency requires detailed modeling of the PtH process. Therefore, the objective of this paper is to present a model which calculates the induced heat sources and the temperature distribution resulting from the induction heating of a fluidized monodisperse PB.
This paper contributes to the field of high-temperature (HT) PtH solutions. We propose and investigate a novel PtH concept that has the potential to generate and to transfer HT heat to the HTF under conditions beyond the Curie point of steel. To this end, this work addresses the modeling, concept verification, experimental model validation, and finally the numerical analysis of the inductively heated pebble bed PtH concept. Foremost, we introduce a model that is based on a 3D finite volume method. For the verification of the novel PtH concept and for model validation we use a HT resistant experimental setup consisting of various PB arrangements. The experimental study presented shows an overall high process efficiency and high power density for fully packed bed arrangements even at high temperatures. The conducted numerical studies support these findings and provide recommendations for energy-efficient design solutions with maximum power density on both laboratory and utility scale. Finally, this study identifies suitable material solutions for an energy-efficient HT operation in a Brayton battery.

2. Numerical Model

The objective of the numerical model is to provide an approximation for the spatial distribution of induced heat sources inside the pebble bed (PB) and for the convective heat transport to the gaseous HTF for different particle sizes and arrangements.

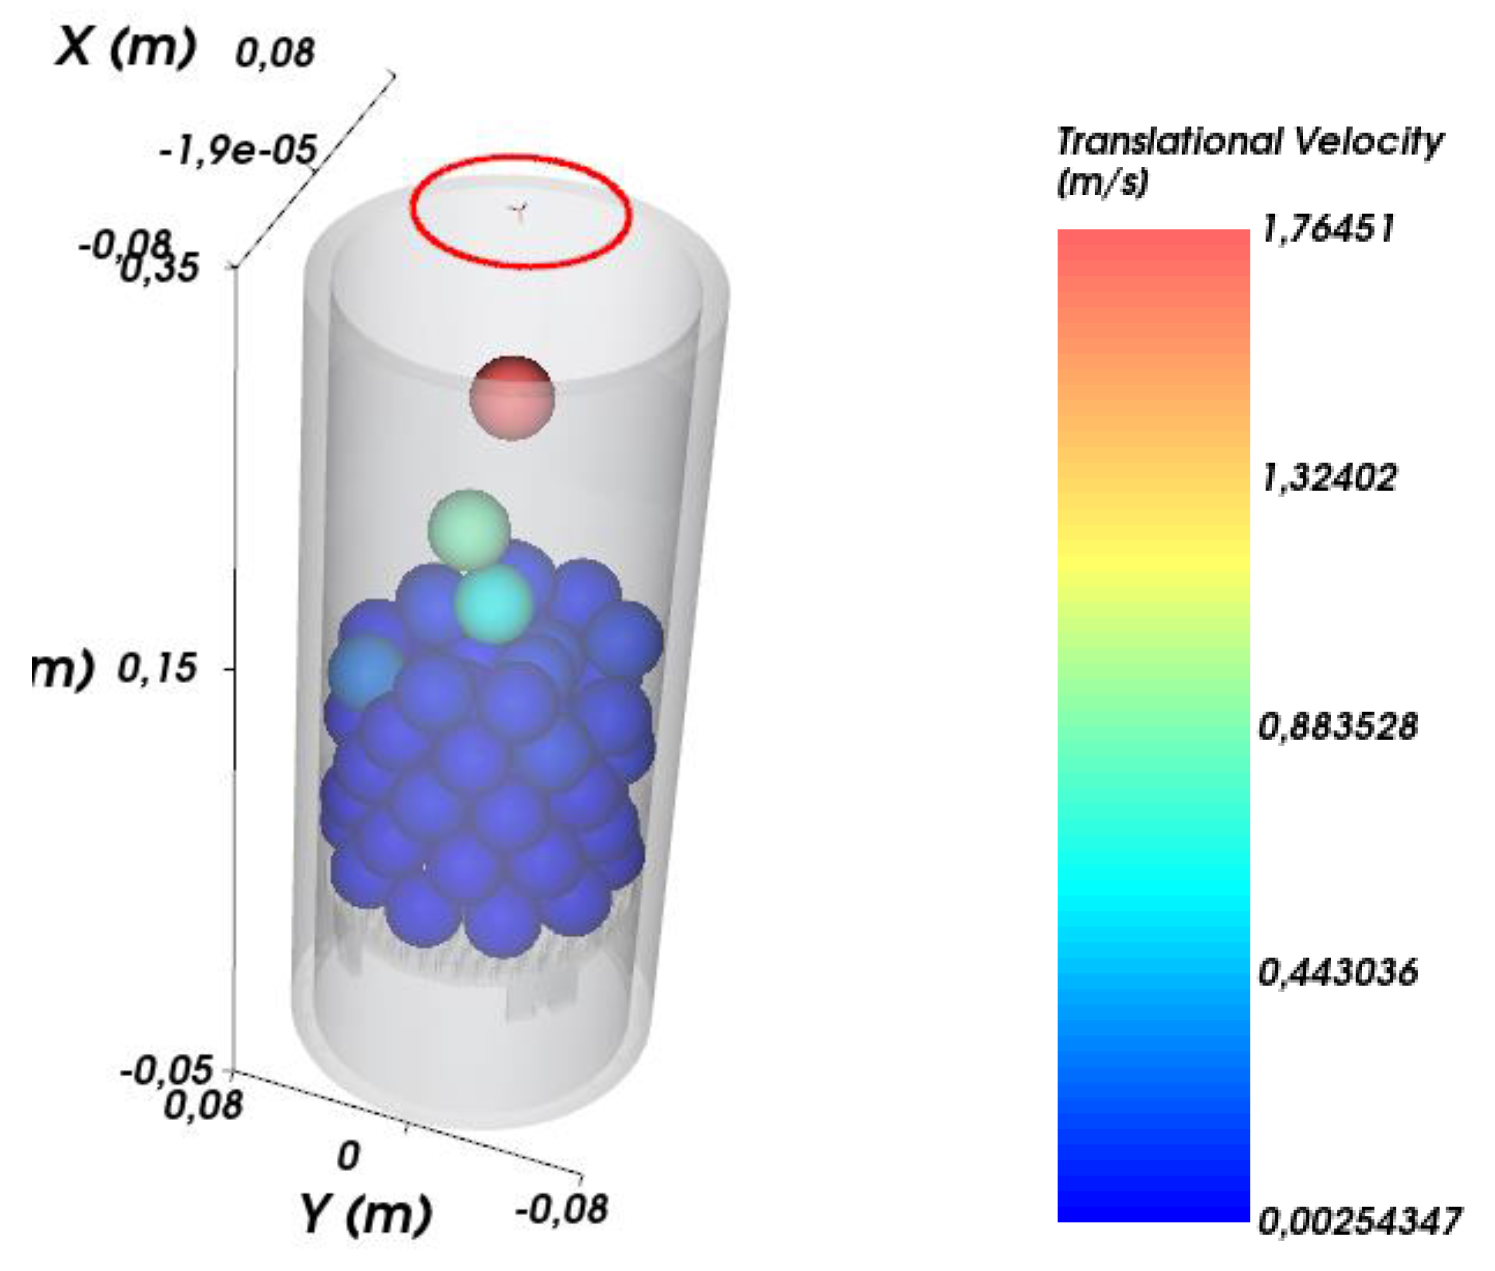
2.1. Particle Model: Electromagnetic Field Solution

The electromagnetic analysis is described by Maxwell’s equations evaluated in a frequency domain. We examine the case of a single sphere plunged into a given uniform harmonic magnetic field B oriented parallel to the inductor axis, adopting spherical coordinates ( r , φ , θ ), neglecting displacement currents [3] and assuming linear constitutive relations. Maxwell’s equations are thus written as
r o t   H = σ E       with   d i v   B = 0
r o t   E = j ω μ μ 0 H   with     l a p l   E = 0
The solution is analogous to Lupi’s [3] and Poritsky’s approach [22] with the implementation of Bessel functions to Equation (2), assuming that the amplitude of the field strength H 0 outside the sphere is deduced from the inductor length l i , its windings N i , the current   I i and the applied factor 0.4 π [22].
H 0 =   I i   N i   0.4 π l i   K i
considering Nagaoka’s correction factor for inductors with finite length-to-diameter ratio [23].
K i = 1 + 0.44   d i / l i
The electric field   E is then calculated in circumferential direction using the unit vector i φ from Equation (5) inside the sphere
E φ = C sin θ r   ( ψ + 1 ) i φ  
where C is a constant finally given by Equation (11), which has to be determined by the initial and boundary conditions. In this case, the boundary conditions are specified as continuous tangential components of H and E at the boundary of the sphere. This returns a value for ψ as a function of the sphere radius r and of the damping coefficient k from Equation (9)
ψ = ( 2 μ 1 ) F ( k r ) ( μ + 1 ) + F ( k r )             ψ  
with   μ being the relative magnetic permeability and F ( k r ) given by the function
F ( k r ) = k r   S 1 ( k r ) S 1 ( k r )
The function S 1 ( k r ) is related to the J Bessel function using the following equation
S 1 ( k r ) = r 1 / 2 J 1.5 ( k r )
The constant k is the damping coefficient of the electromagnetic wave [3], which describes the skin effect in an electrically conducting body:
k = δ 1 + j δ 1
According to this effect, the current density decreases from the surface of the sphere toward its center. Consequently, the induced power is concentrated in the surface layer which is called the skin depth and calculated by Equation (10)
δ = 1 π   f   σ   μ   μ 0  
with f being the frequency and σ the electrical conductivity.
For a harmonic field solution with a uniform magnetic field, the value of the integration constant C is given in SI-units as
C = j π f μ 0 H o
with the magnetic field constant μ 0 = 4 π 10 7 N A 2 .
Since the distribution of the electric field in circumferential direction E φ is determined inside the sphere, one can calculate energy dissipation per unit volume by the Joule effect:
p i n d = 1 2 σ E φ 2  
As a result, the total electric power generated inside n spheres is calculated by integrating over the sphere volume:
P i n d , t o t = i = 1 n V p i n d d V  
Equation (13) reflects the core assumption of this model, which was also employed by Duquenne et al. [12]. It indicates that each sphere is electrically insulated from other spheres. In addition, the bulk of power induced inside a sphere comes only from the interaction with the external magnetic field and not from neighboring spheres. Therefore, each sphere is treated as electromagnetically independent.

2.2. Two-Phase Electrothermal Model: Coupled Electromagnetic and Thermal Analysis

The prediction of the induced heat sources and of the resulting temperature field requires a multi-physical and iterative process simulation. Figure 2 illustrates the first step of the geometry modeling of the monodispersed packed bed that is further divided into several subdomains for meshing. The specified subdomains are presented together with the mesh in the following Section using Figure 3 and Figure 4. Finally, the coupled electromagnetic and thermal solution procedure is introduced in Section 2.2.2.

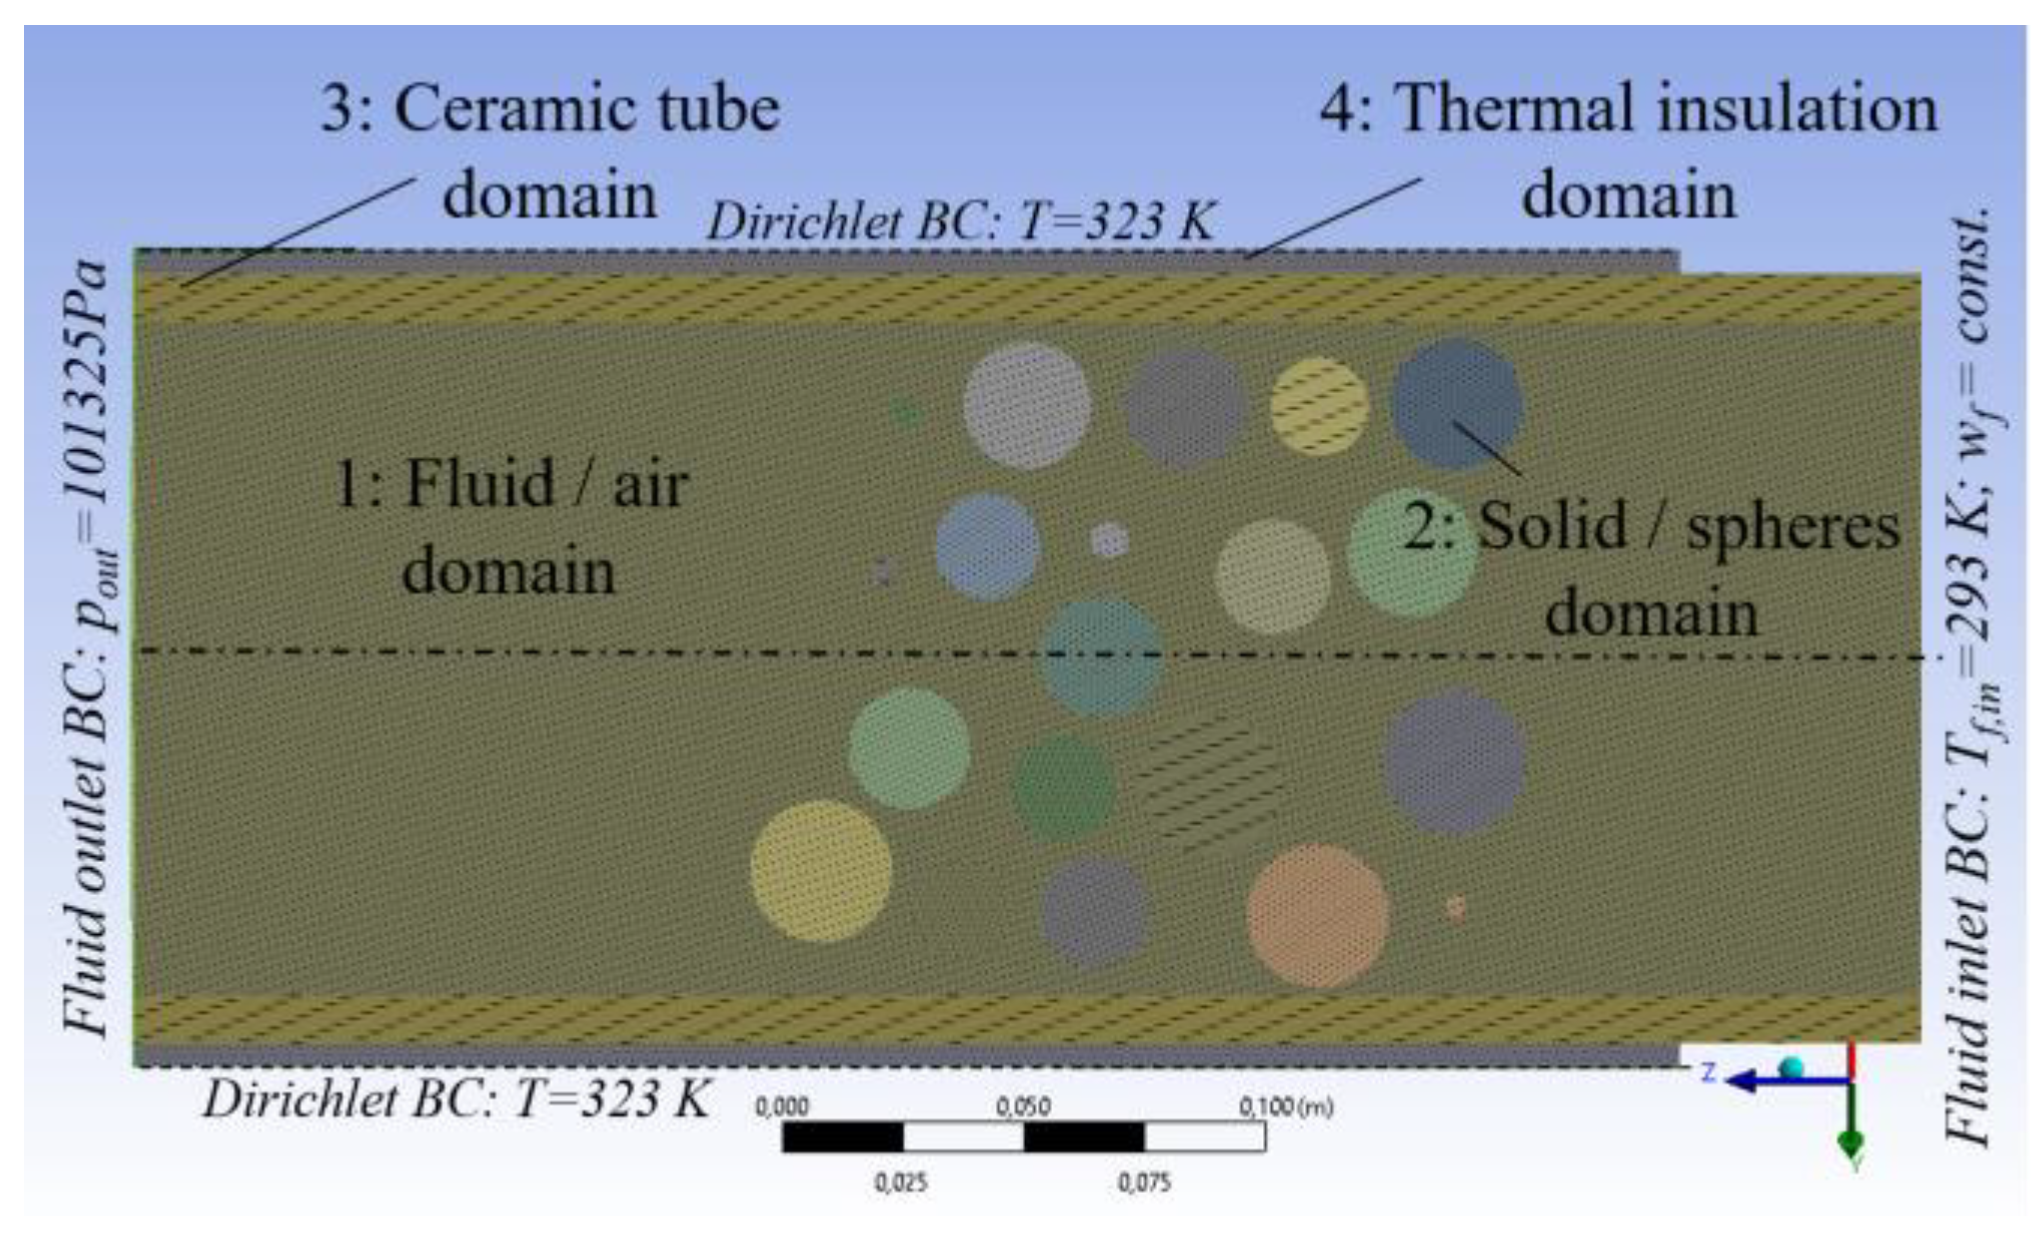
2.2.1. Geometry Modeling and Meshing

DEM software [24] was used to obtain the arrangement of the particles in the randomly-packed monodispersed bed. Table 1 summarizes the input parameters for the DEM calculations. In this simulation, the particles randomly fall under the action of gravity from the upper inlet to the grating of the heating zone, as illustrated in Figure 2. Each particle position was determined for every time step (5 × 10⁻⁷ s) using linear spring models. Specifically, the hysteretic linear spring model and linear spring coulomb limit model were applied to model the normal force and the tangential force, respectively [24]. In addition, the linear spring rolling limit is used as rolling resistance model neglecting adhesive force. This simulation procedure ends after reaching convergence at 1 × 10⁻⁹ Joule for the pebble bed’s kinetic energy. The obtained sphere center coordinates O c e n t e r were then extracted and passed to the ANSYS SpaceClaim geometry modeler to first generate the geometry using a custom script. The geometry was then transferred to the FLUENT solver for thermal initialization and further simulation work, as shown in Figure 5.
The resulting three-dimensional domain comprised of cylindrical and spherical subdomains. The hollow cylindrical subdomains represent the insulation and the outer ceramic tube whereas the spherical subdomains represent the solid spheres as shown in Figure 3. The application of Equations (5)–(12) for the spherical subdomain removes the need to model the induction coil thus eliminates the computations associated with the solution of the Maxwell Equations (1) and (2) over the entire simulation domain.
The induced heat sources in each sphere (Joule effect) was calculated using Equation (12) as the volumetric power input to each cell inside every spherical subdomain. The calculation of induced volumetric power input was based on the coordinates of every cell centroid in the mesh. Thus, the accuracy of the solution for Equation (12) and for the total electric power input by using the volume integral from Equation (13) depends on the mesh resolution. Therefore, a grid refinement study was conducted on the one hand to ensure a convergence of the solution for the induced power and on the other hand to obtain a minimum number of mesh elements necessary for a time-efficient and accurate solution process. The results from the grid refinement study, presented in Appendix A, show convergence attained for more than 55 Mio. elements. We applied 57 Mio. mesh elements using 30 inflation layers for time-efficient numerical calculation process of the simulation study from Section 4.2.
The results for the grid study further indicate that to obtain a sufficiently accurate solution for the distribution of heat sources in the surface layer, the numerical mesh size needs to be at a significantly smaller order of magnitude than the penetration depth δ in both the radial and latitudinal directions. Therefore, 15 layers starting from a height of 10 5 m were used in the surface region of each sphere. In a similar fashion, the same number of layers was added to the sphere walls to account for the boundary layers of the HTF flow. These inflation layers are shown on the mesh in Figure 4. Outside of these layered regions, the mesh is unstructured. Near the spheres, the unstructured mesh is refined to accurately resolve volumes in between spheres.

2.2.2. Coupled Electromagnetic and Thermal Solution

The solution for electromagnetic field was calculated based on the harmonic analysis described by Equations (5)–(12) and coupled with the temperature field solution according to Figure 5. The solution for the temperature field of the solid and fluid phase was obtained numerically using a commercially available fluid dynamics package FLUENT 21.1. The calculation for the solid phase relies on steady state condition of the heat Equation (14) formulated in spherical coordinate system and extended by the source term from Equation (12). This expression was implemented into the solving process as a custom volumetric heat source using a user defined function. The volumetric power density p i n d is fully converted into heat and replaces the right-hand side of Equation (14) as the Joule heat volumetric power density q ˙ i n d :
1 r 2 r ( λ s r 2 T s r ) + 1 r 2 sin 2 θ φ ( λ s T s φ ) + 1 r 2 sin θ θ ( sin θ λ s T s θ ) = p i n d = q ˙ i n d
The fluid phase is calculated by solving the steady state incompressible Navier Stokes Equations using a pressure-based solver. Turbulence is modeled using the κ-ω-turbulence model. Gravity effects are disregarded for the fluid phase, since the conceptual investigation is carried out using air flow with high Reynolds numbers. Thermal properties for dry air are taken from the FLUENT material database considering a temperature dependence for the specific heat capacity and for the density. But constant values for viscosity (1.7894 × 10⁻⁵ kg m−1 s−1) and thermal conductivity (0.0242 W m−1 K−1) are applied. In addition, radiation is neglected since the investigation is conducted at temperatures significantly below the Curie point of carbon steel (768 °C).
To obtain sufficiently accurate simulation results, temperature dependences of the solid material are incorporated into the electromagnetic solver. The temperature dependency of the electrical conductivity σ and the magnetic permeability μ were considered via empirical models obtained from [3,25]. In addition, magnetic field dependence of μ was considered based on the external field H o [5]. Finally, the total induced power density given by Equation (13) and the averaged fluid outlet temperature were set as convergence criteria for the solution process. Thus, the simulation finishes after reaching convergence at 10−5.
The boundary conditions (BCs) are illustrated in Figure 3. The BC for the inlet is an isothermal mass flow at a constant ambient temperature of 293 K. The wall temperature of the outer domain wall directly borders the water-cooled induction coil. Therefore, the wall temperature is set to be isothermal at the 323 K as measured in the setup from Figure 6. Finally, the outlet boundary condition is a simple pressure outflow.

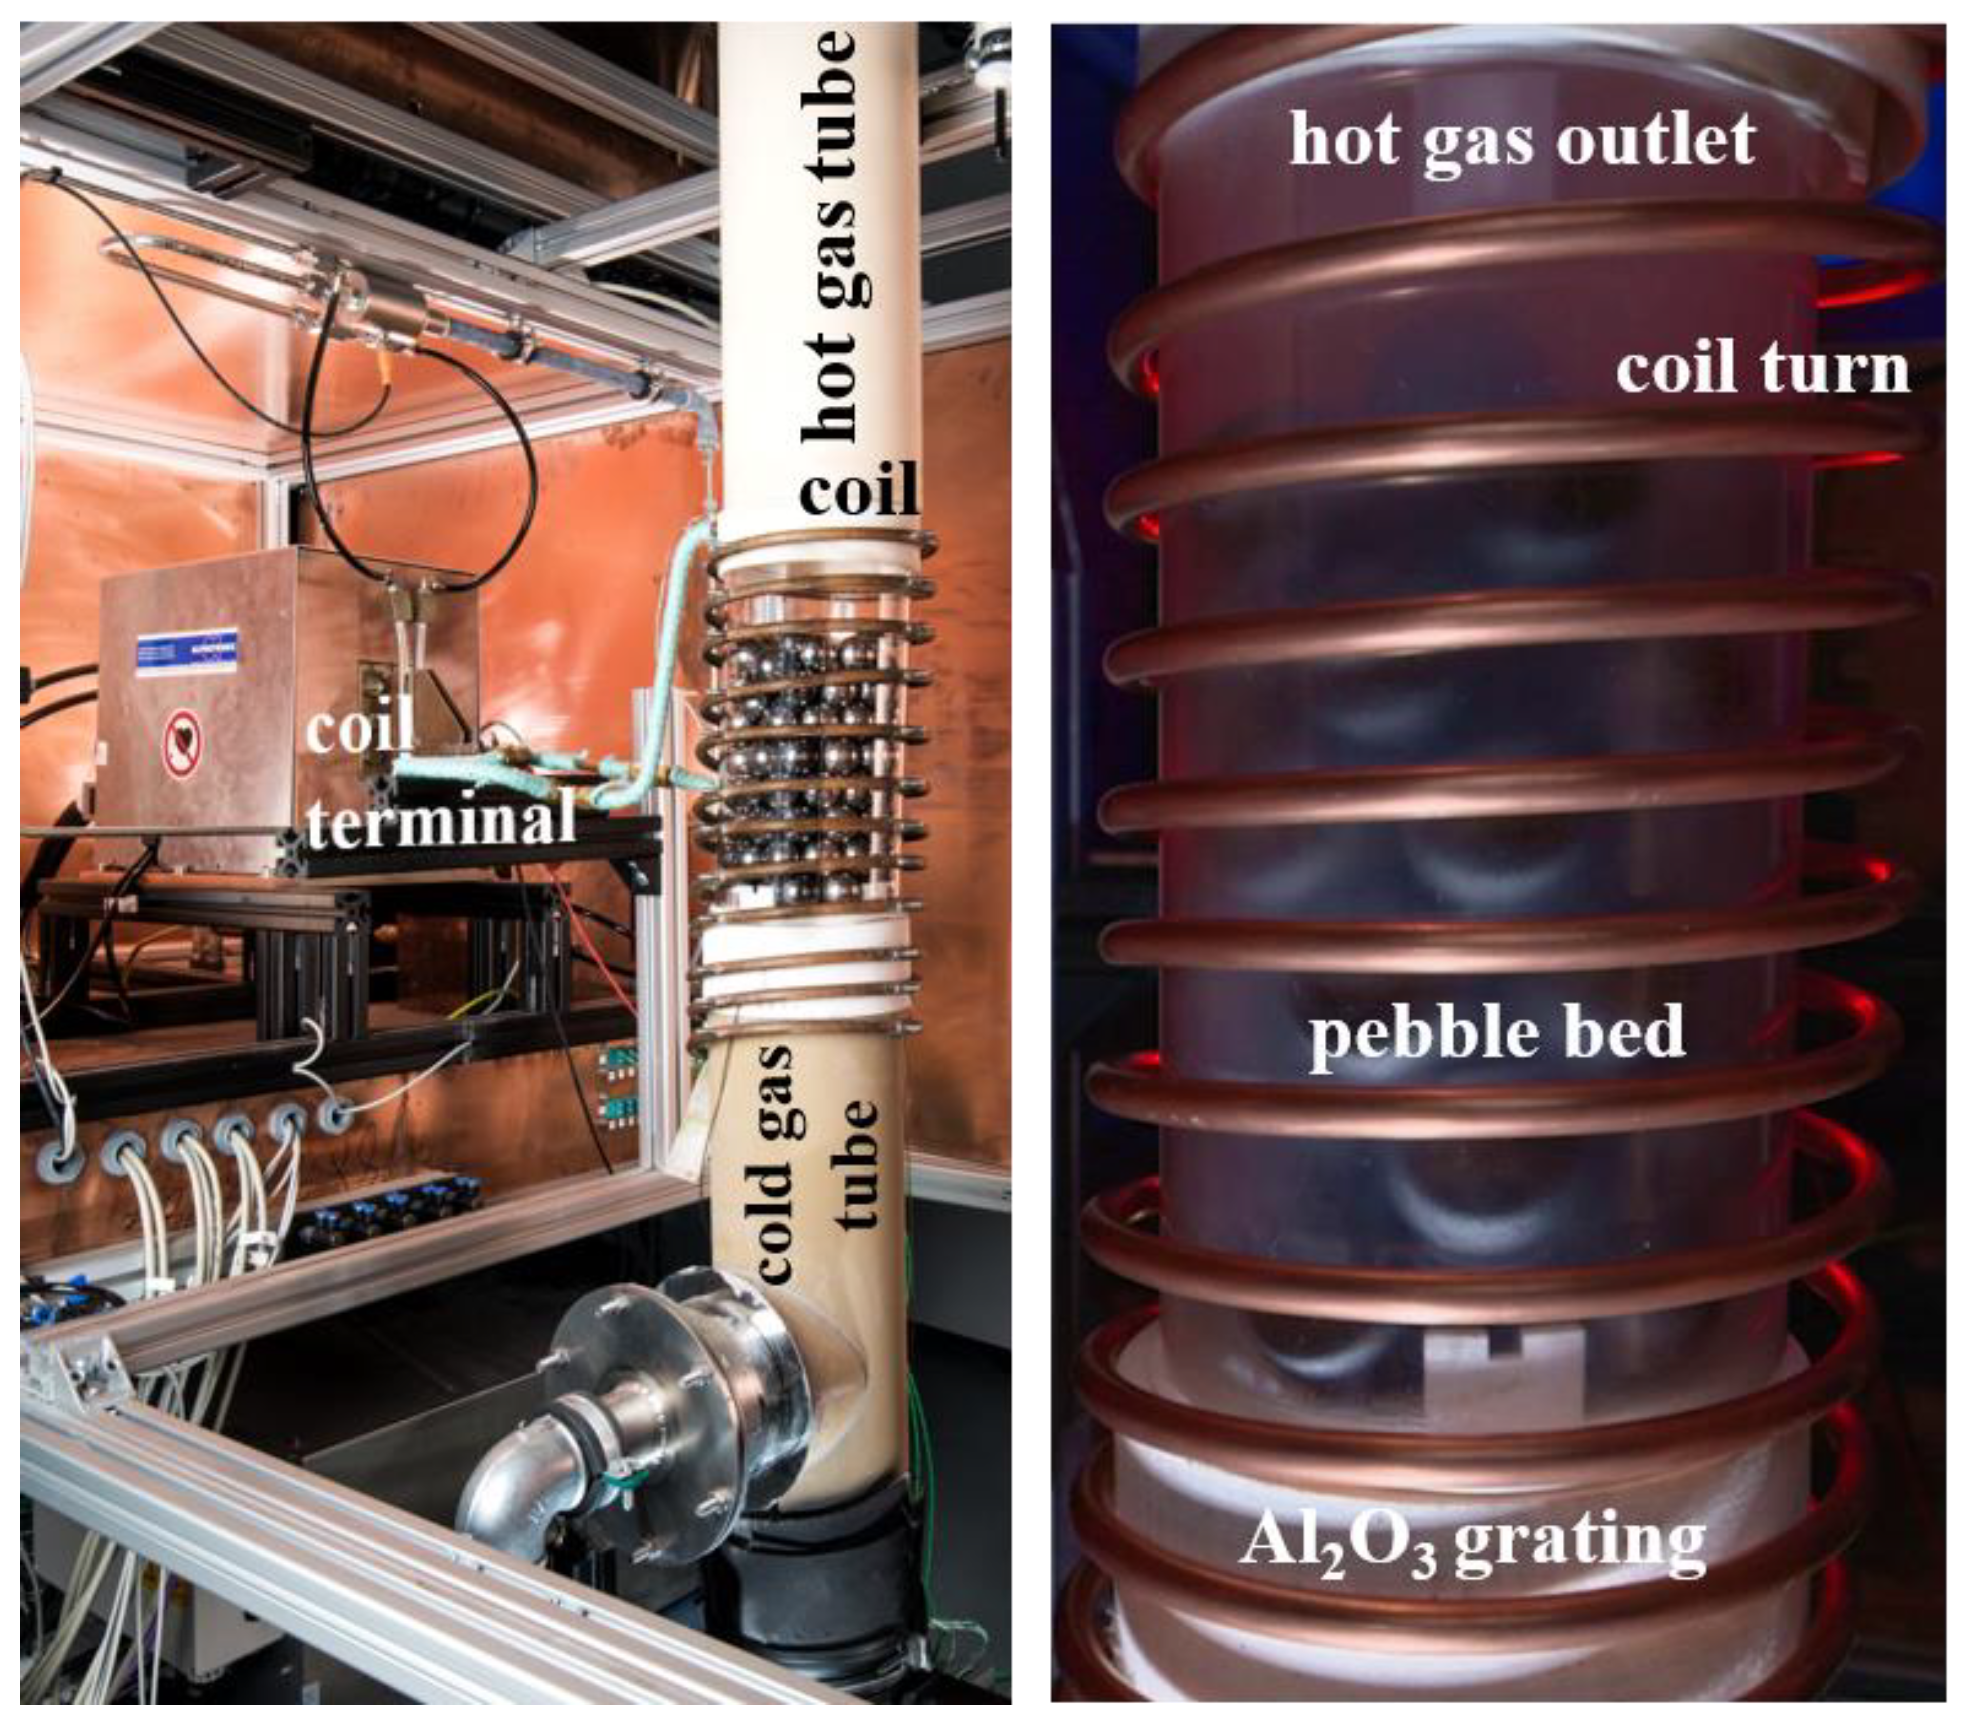
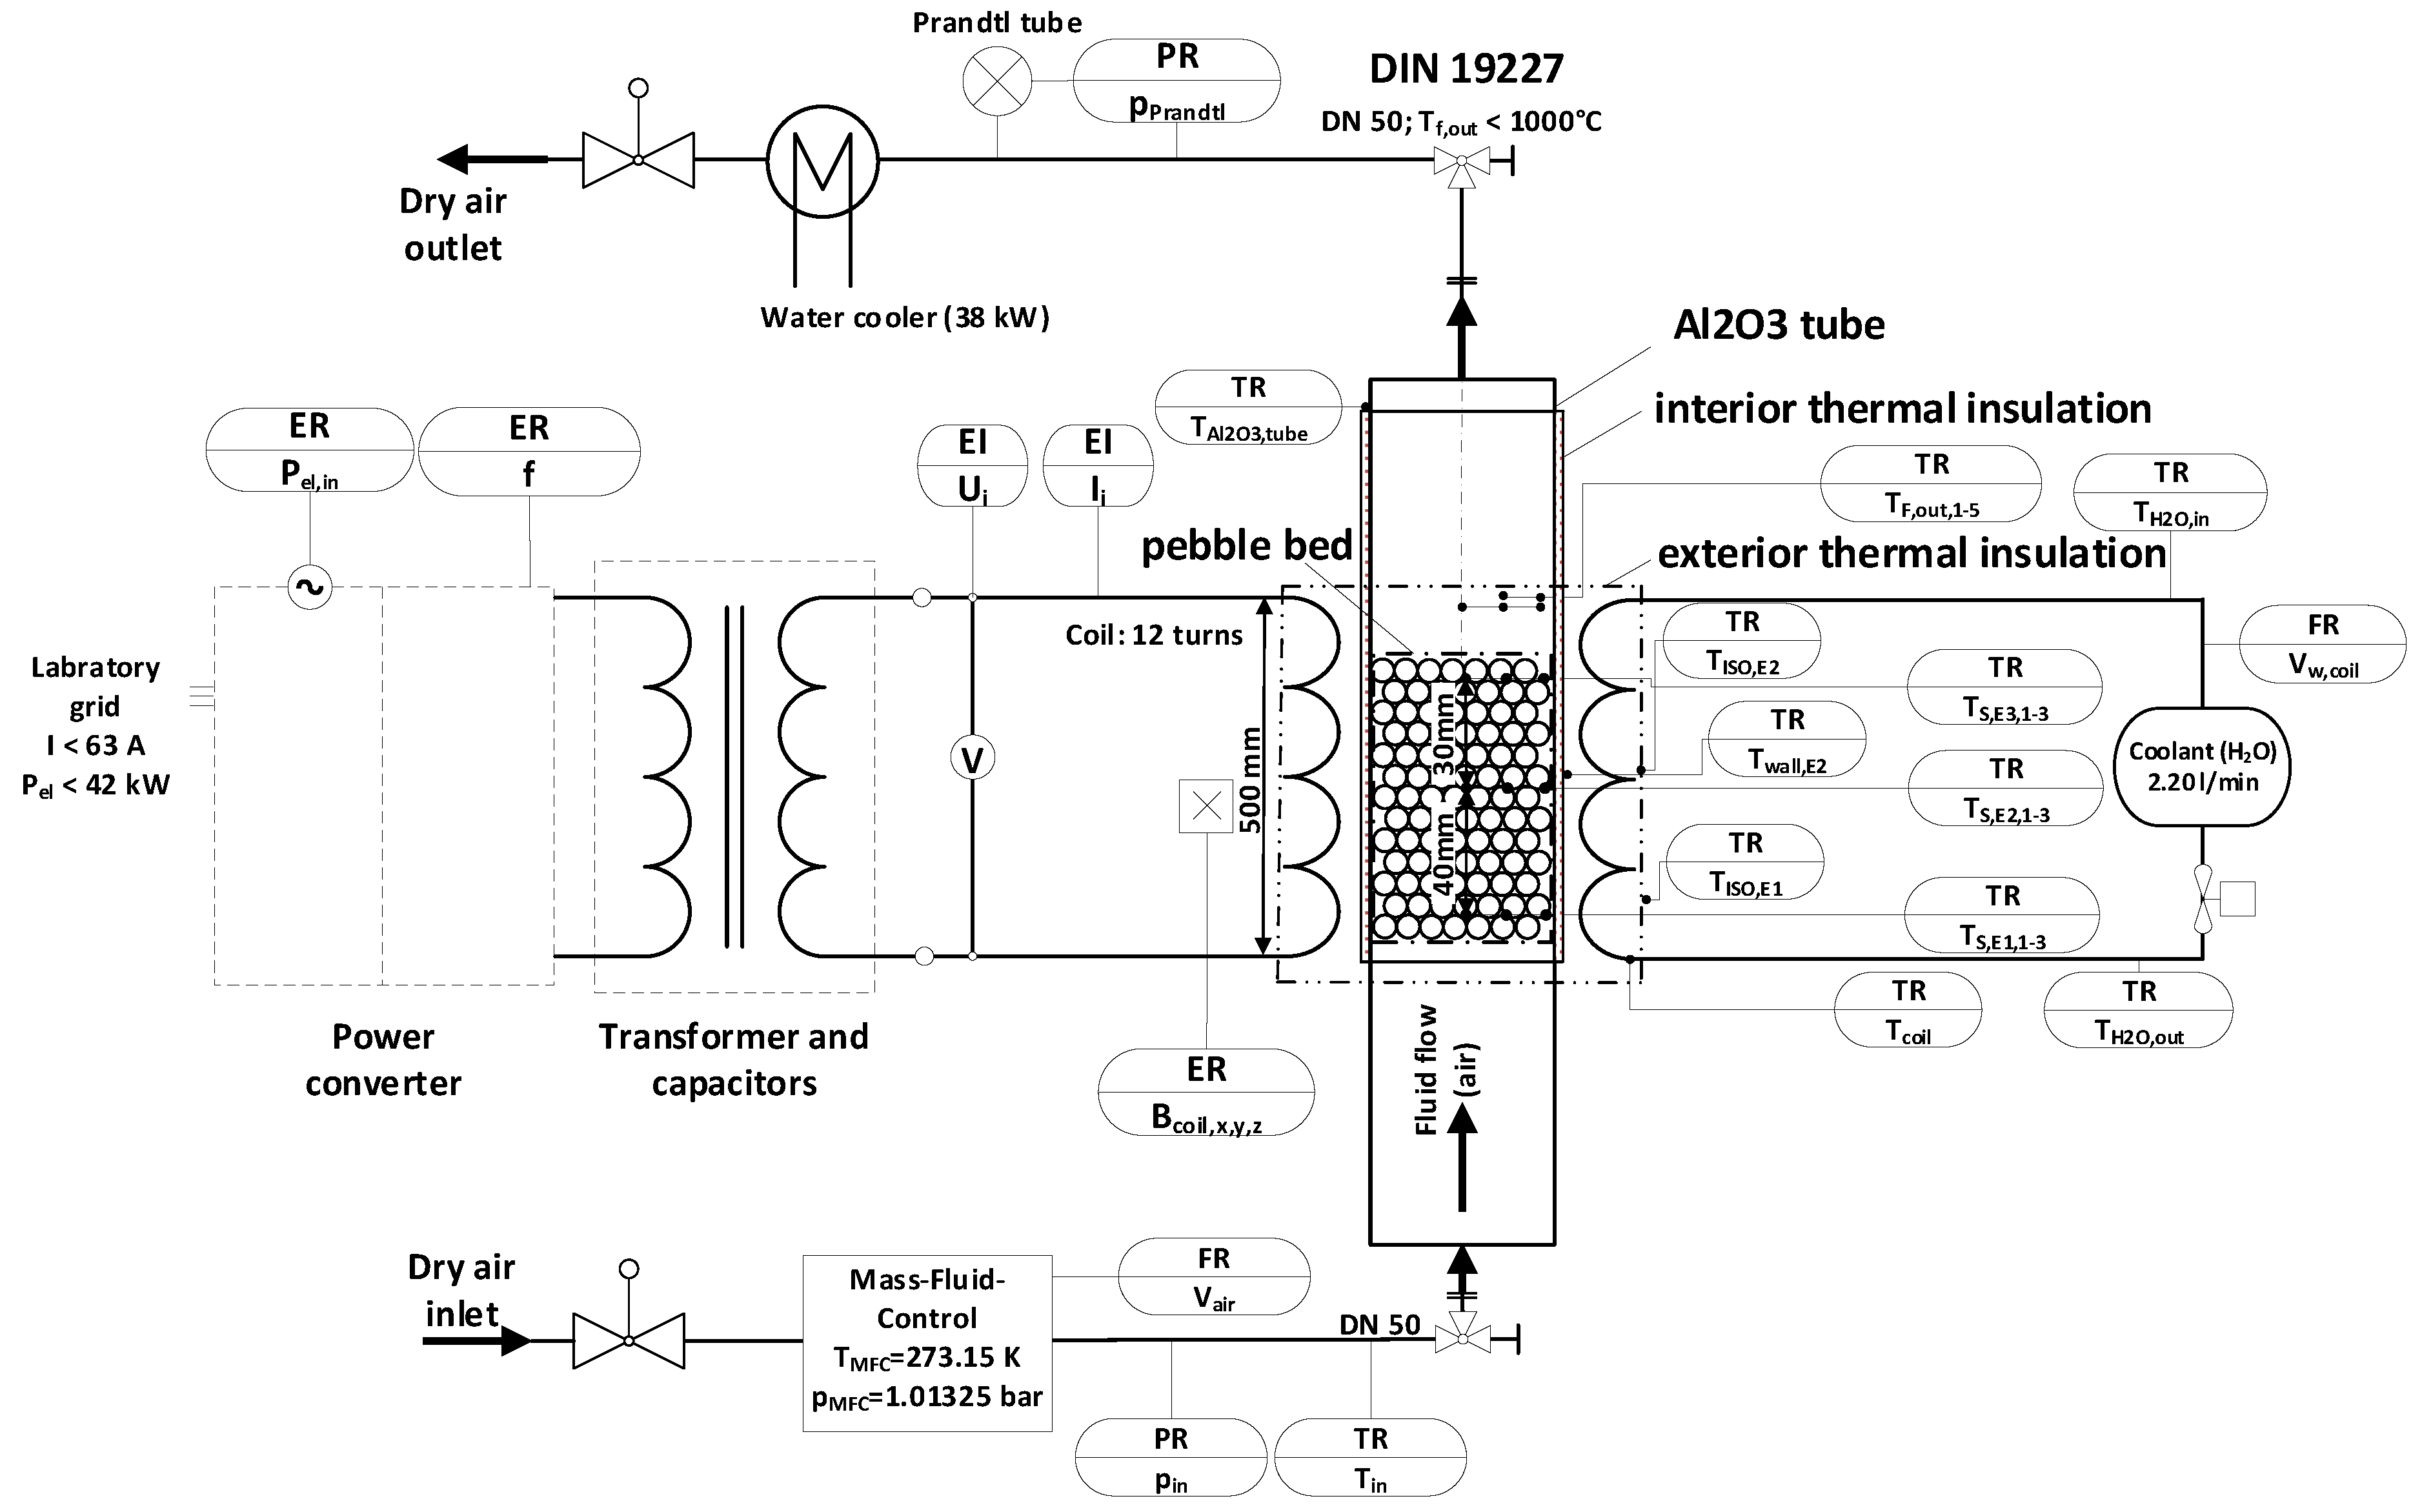
3. Experimental Setup

The objective of the experimental study is on the one hand to verify the performance of the proposed PtH concept for the application in a Brayton battery. On the other hand, to provide the data for the validation of the introduced electrothermal model. The concept verification, model validation and investigation is accompanied with numerical parameter studies presented in Section 4.
A testing facility was designed and setup to investigate the PtH concept of inductively heated packed bed in a vertical fluidized column. The experimental test rig consists of a middle-frequency converter, a transformer, an induction heating coil and a flow system for circulating air through the test section. A schematic of the testing facility and the measuring points is shown in Figure 7. The test section assembly is depicted in Figure 6.
The experiment makes contradictory demands on the materials to prevent parasitic heating of the surrounding components. Therefore, only ceramic insulators made of Al2O3 were used inside and outside the test section, see Figure 6. Only the spheres in the test section were made of electrically conductive material to promote heating. Different configurations of sphere diameter and total number of spheres were tested in this setup. The geometries and materials used for individual components of the test section are summarized in Table 2. To prevent an electric current between spheres and to address the assumption made for Equation (13), the spheres were additionally coated in an electrically insulating and HT resistant coating.
This experiment is subject to losses which can be categorized into leakage losses, thermal losses, and electrical losses. To minimize leakage, a HT gasket [30] was used to fill in axial gaps in the construction. Additionally, the facility was designed to benefit from additional sealing pressure when heated through thermal expansion of the mid-section in the vertical direction.
Thermal losses were minimized by adding two layers of insulation material [26] between the tube walls and the coil as well as between the coil and the environment. Moreover, the temperature increase of the cooling water inside the inductor coil was measured with thermocouples at the inlet and outlet.
Finally, the power loss to the coil was evaluated via direct voltage and current measurement at the coil terminals shown in Figure 6. The frequency was returned by the power converter, which is an input parameter for the electromagnetic simulation.
Five thermocouples were installed at the outlet of the test section. All the other thermocouples inside the packed bed structure were located according to Figure 7. These were spread out in the radial and vertical directions to capture the distribution of temperature as it varies in the pebble bed. Furthermore, three thermocouples were placed at the outer wall of the facility to determine heat loss to the environment.
This measurement is introduced in Table 3, where uncertainties of the measuring instruments are additionally reported. The highest measurement uncertainties were caused by the current measurement of the Rogowski coil (±2.5%) and from the power measurement at the converter (±2.0%). The output error for the measured key performance indicators (KPIs) in Figure 8 and Figure 9 was estimated using the common Gaussian error propagation method.

4. Results and Discussion

In the following sections, experimental and simulation studies based on the laboratory setup and the model from Chapter 2 are conducted. The following both sections present the obtained experimental data and compare those with simulation results for validation purpose. Using the validated model, three parameter studies are conducted investigating key performance indicators (KPIs) of the PtH concept which are the volumetric power density, the heat flux density and the PtH efficiency. In the first study, geometry parameters are varied for the used carbon steel to identify energy-efficient designs with high power density in laboratory scale. The second study discusses the introduced KPIs using dimensionless parameters independently from the setup. This discussion reveals maxima for energy efficiency and power density. The final study aims at the identification of HT resistant and efficient materials for the application in Brayton battery below and far beyond the Curie point of steel.

4.1. Experimental Results for PtH Efficiency and Heat Flux Density

To verify the proposed PtH concept and to provide experimental data for the model validation, the experiments have been conducted with a constant input power of P e l . P C = 5.3   k W at the power converter and an air flow rate that is regulated from V ˙ f = 25   N m 3 h 1 to V ˙ f = 150   N m 3 h 1 (at reference conditions: T N = 273.15   K and p N = 101,325   P a ). A correction factor proposed by Hänchen et al., of 0.85 is used for the flow rate to address the near-wall channeling effect, indicating that 15% of the flow rate does not thermally interact with the pebble bed [31]. In addition, Table 2 gives an overview of the geometry variation and the materials used for the test section.
The experimental investigation and verification of the inductively heated pebble bed concept is conducted at steady state conditions. The concept evaluation focuses on the energetic efficiency η P t H   and heat flux density q ˙ t o t . The definition of the PtH efficiency is based on First Law considerations taking into account electrical and thermal power input and heat output introduced in Figure 1
η P t H = Q ˙ t h , o u t P e l , P C   η P C   = Q ˙ t h , o u t P e l , i n   = m ˙ f ( h f , o u t ( T f , o u t ) h f , i n ( T f , i n ) ) P e l , c o i l + P i n d , t o t  
where m ˙ f is the mass flow rate of the air flow and h f the temperature dependent enthalpy at the inlet and the outlet of the heater. The electrical power P e l , i n at the inductor terminals is measured to be approximately constant at 5 kW during all experiments. The heat flux density q ˙ t o t is given in W / c m 2
q ˙ t o t = Q ˙ t h , o u t A H T F   = m ˙ f ( h f , o u t ( T f , o u t ) h f , i n ( T f , i n ) ) n   π   d 2  
which is the thermal output related to the heat transfer area A H T F   that is in direct contact to the total number of spheres n .
The Reynolds number R e = d   w f ν f 1 containing the particle diameter d , flow velocity w f and kinematic viscosity ν f is an appropriate parameter since it contains information about the geometry and the flow conditions, which both influence the heater performance. The key performance indicators q ˙ t o t and η P t H presented in Figure 8 increase with growing Reynolds numbers and with larger sphere diameters. The main reason for this increase is the improved convectional heat transfer to the air due to the higher Reynolds and thus higher Nusselt numbers.
The investigation of the particle diameter shows an improvement of heat flux density and PtH efficiency for larger particle diameters. Results for the PtH efficiency from [12] support this finding demonstrating a higher electrical resistance of the pebble bed and thus a higher efficiency for growing particle size (1.8 mm < d < 7.65 mm). Larger spheres have a higher electrical resistance to the induced eddy currents due to the larger circumference of the equator. According to Joule’s law, a higher resistance results in a higher electrical power induced inside the sphere. The discussion from Section 4.4 further explains the relationship between particle size and efficiency, accounting for the effects of temperature dependence.
Altogether, the achieved efficiency above 80% at a high heat flux density shows the potential of this PtH concept and proves the applicability for gas heating applications. In particular, high Re numbers above 8000 are favorable for the energy-efficient operation of this PtH concept at high power density.

4.2. Numerical Results and Validation

For the simulation study, the particle diameter d and the flow velocity w f were varied analogously to the experimental investigation from previous section. These parameters are summarized in Table 4 together with measured values for frequency f and inductor’s peak current I i . Both values are influenced by the system’s inductance that varies with changing packed bed geometry and its temperature dependent material properties σ and μ . Therefore, these electrical inputs were also reported for calculating the electromagnetic field solution.
Figure 9 shows the comparison of simulation and experimental results for the total induced power and the outlet temperature. The curve characteristics of both comparison criteria show a matching progression with respect to the Reynolds number. The characteristic of P i n d , t o t shows a maximum at moderate Re numbers. This maximum is caused by temperature dependent electrical material properties μ and σ , which vary with flow conditions inside the pebble bed. Accordingly, low Re numbers result in high solid temperatures near the Curie point at 768 °C and high Re numbers lead to an improved convective heat transport along with a decrease in solids temperature to 200 °C. In this temperature range, there is a significant variation in the electrical material properties as illustrated in Figure 10 influencing the heat generation inside the solid. This figure shows a maximum of the function μ / σ , which causes the maximum in the induced power of Figure 9. The discussion in the following section points this effect further out.
The quantitative comparison between experimental and simulation results in Figure 9 shows a good agreement for the induced power P i n d , t o t of the pebble bed and the resulting averaged outlet temperature T f , o u t . The maximum deviation is below 15% for Reynolds numbers above 2000. For smaller Re numbers, however, the solid temperature approaches the Curie point at T C = 768   ° C of the used carbon steel where the magnetic permeability μ changes non-linearly as illustrated in Figure 10. The uncertainty of this μ ( T S ) function is the major reason for resulting deviations in the electromagnetic field solution and consequently in the obtained temperature field solution. Moreover, the assumption of a homogenous external magnetic field as well as negligible radiation effects at high solid temperatures are additional causes for the deviations from the experimental data. Despite these causes and the small dimensions of the test rig, a satisfactory agreement is obtained between the calculated and the measured data, hence the introduced modeling approach can be treated as a solid basis for the following numerical studies.

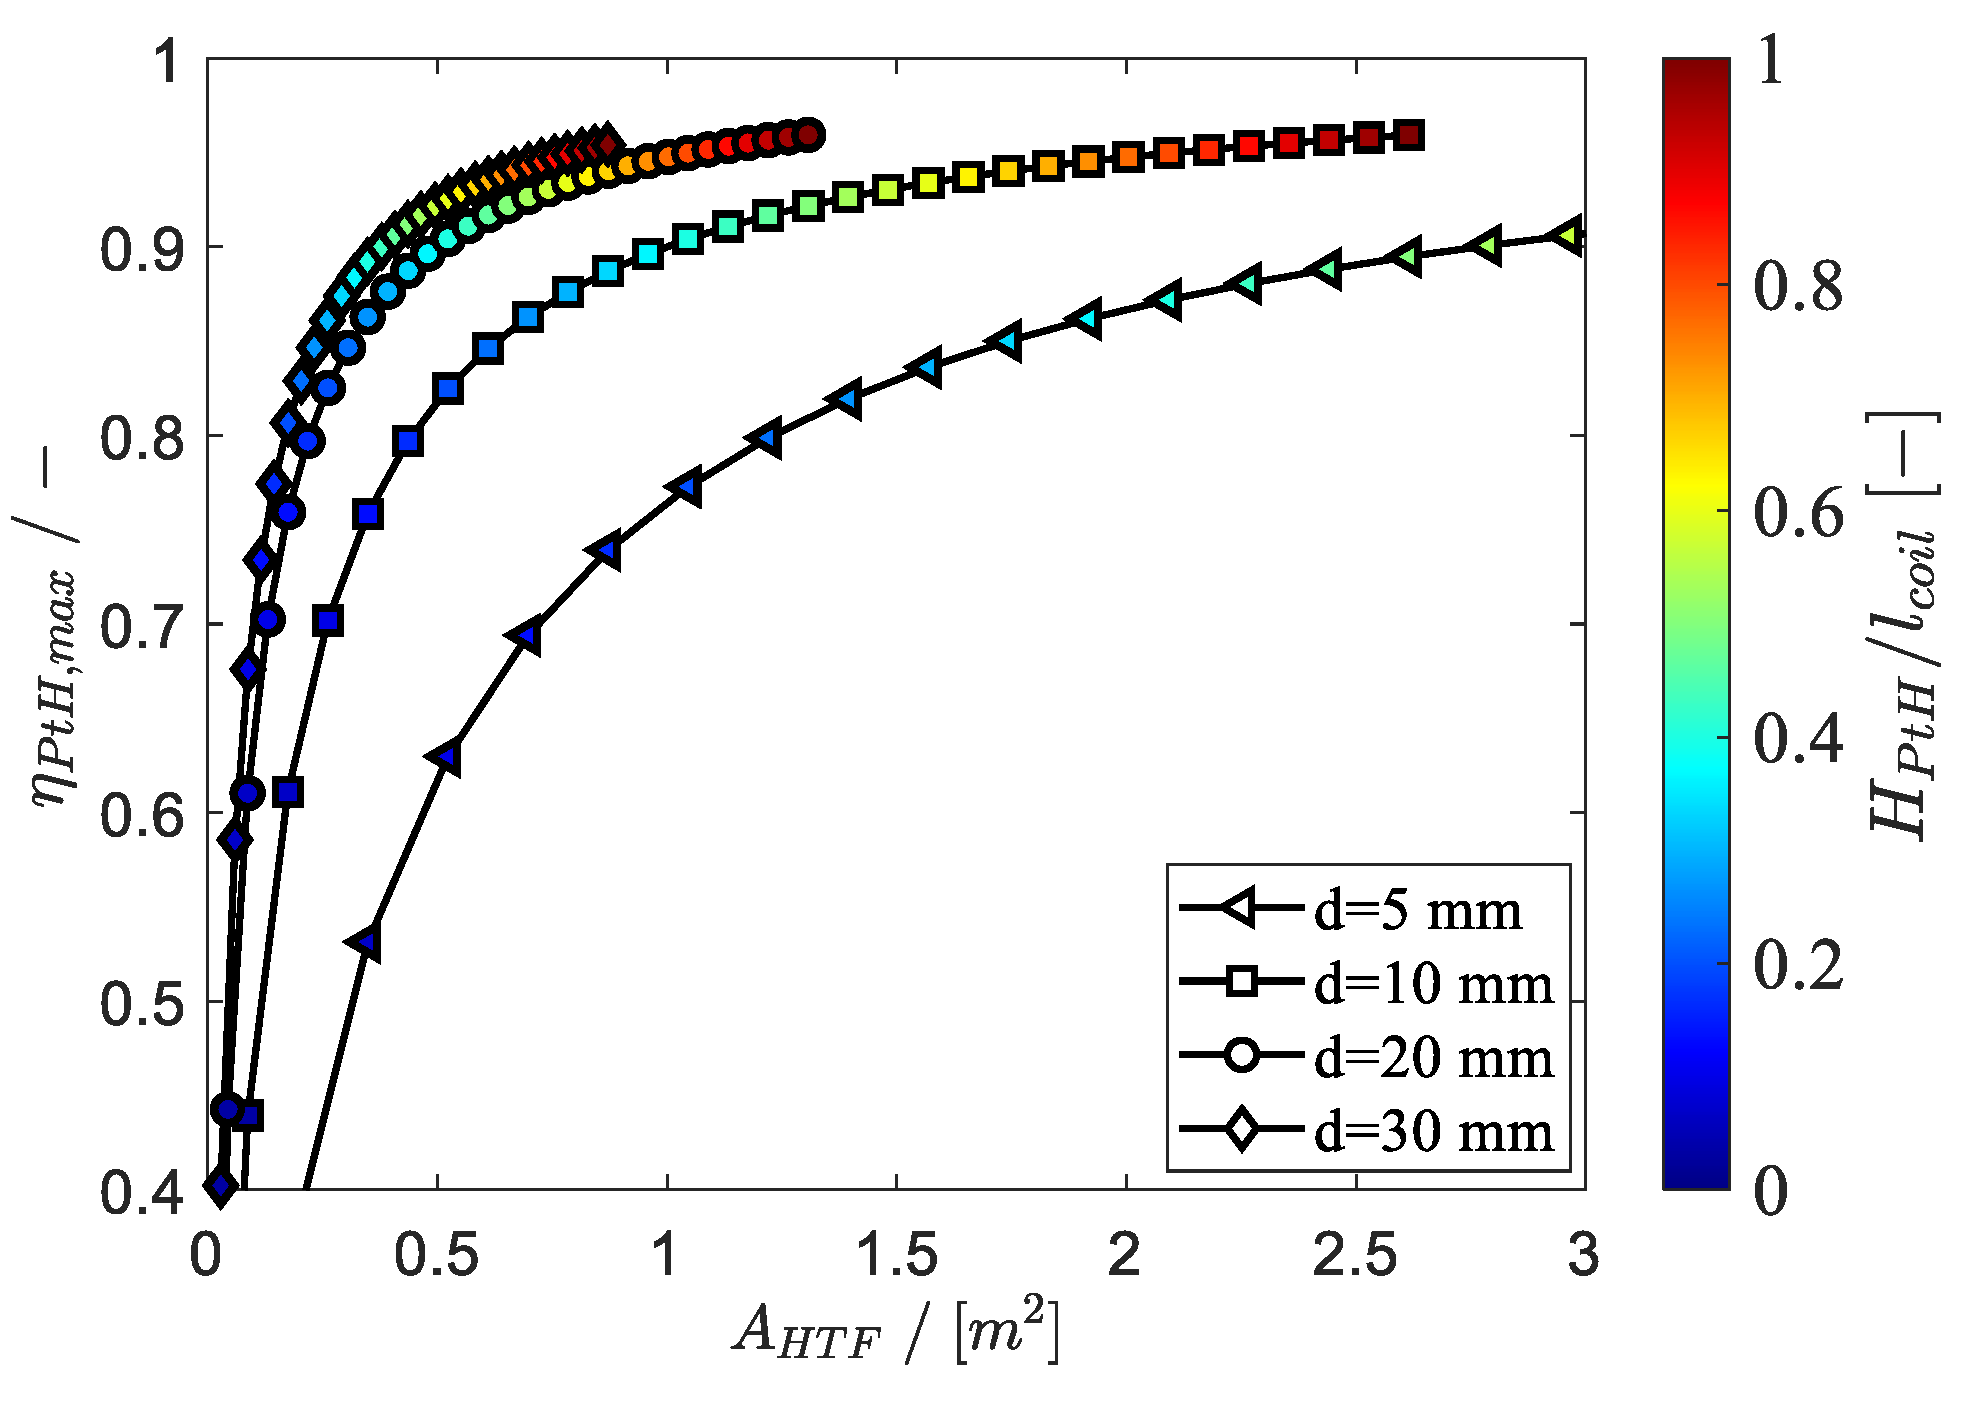
4.3. Idealized Parameter Study for μ ( T S )

With the validated model, the design space for the inductively heated pebble bed concept can be explored using only the electromagnetic model deduced in Section 2.1 by neglecting thermal losses by convection and radiation ( η t h = 1 ). The objective is to identify energy-efficient designs with high volumetric power density for the inductively heated pebble bed concept. In contrast to Section 4.1, this study is idealized, which means that it discusses the maximum achievable heat flux density with the associated PtH efficiency.
The maximum PtH efficiency is obtained when thermal losses to the ambient are neglected and consequently the entire induced heat inside the PB is transferred to the air flow ( Q ˙ t h , o u t = P i n d , t o t ):
η P t H , m a x = η i n d η t h , m a x = η i n d = P i n d , t o t P e l , c o i l + P i n d , t o t  
The formulation for P e l , c o i l is obtained from Kennedy et al. [21]. Under the assumption η t h , m a x = 1 , Equation (16) becomes
q ˙ t o t , m a x = P i n d , t o t A H T F  
Instead of using quantities given in Equation (16), a simple procedure to implement the formulation for P i n d , t o t has been found without loss of accuracy. This formulation applies scalar quantities for the power density in the bulk q ˙ i n d , P B together with the volume of the pebble bed V P B and is expressed as:
P i n d , t o t = q ˙ i n d , P B V P B
The volumetric power density is given using Equations (3) and (6) as:
q ˙ i n d , P B = 0.75 H o 2 ω μ 0 F
where ω is the angular frequency given by ω = 2 π f and F is the power transmission factor characterizing the effectiveness of energy dissipation in the spheres by using the imaginary part of the ψ function from Equation (6):
F = Im { ψ }
Finally, the volume of the pebble bed is expressed as:
V P B = π 4 D P B 2 H P B ( 1 ε )
using the void fraction ε , the outer diameter D P B and the height of the pebble bed H P B , which are both specified in Table 2. For the void fraction the common value of ε = 0.40 is applied for further calculations.
To investigate the performance of the PtH concept in relation to changing geometry and material properties of the used ferromagnetic steel, the heat transfer area A H T F and the solid temperature T S o l i d have been chosen as variables for the first parameter study. The heat transfer area A H T F = n m a x   π   d 2 includes both, the number of spheres and their diameter d as geometric parameters, whereby the maximum number of spheres n m a x is predetermined to fill the entire bed height H P B . The solid temperature is a suitable variable parameter for the material since both, electrical material properties σ and μ are functions of temperature which have been already shown in Figure 10.
Figure 11 shows results for the PtH efficiency η P t H , m a x and for the power transmission factor F from Equation (21) as functions of bed temperature and HTF area. The temperature dependence of the electrical material properties during heating has a significant influence on the factor F, which expresses the power density given by Equation (20). The power density q ˙ i n d , in turn, dictates the PtH efficiency according to Equation (17). This is the reason for the strong relationship between F and η P t H , m a x from Figure 11 for the influencing variables T S o l i d and d . The influence of the temperature reveals maxima at 580 °C for diameters larger than 10 mm. These maxima are typical for ferromagnetic steel due to opposing temperature curves for σ and μ from Figure 10 where the abrupt drop in magnetic permeability prevails near the Curie temperature. This dominating effect at T S o l i d > 580   ° C results in a rapid fall of F and consequently of the PtH efficiency. The comparison of the analyzed diameters and HTF areas show lowest efficiencies for particles with d = 5 m m . The chosen frequency of 22 kHz is insufficient to heat them up efficiently at those small diameters. The highest efficiency results are achieved for 20 mm particles due to highest F values and the high power   P i n d , t o t induced in the large number of spheres.
In contrary to the study from Figure 11, for the analysis in Figure 12 the bed height H P B is varied for constant bed temperature, which is set to 580 °C where previously the highest efficiency is obtained. The PtH efficiency is presented in Figure 12 with respect to HTF area. Moreover, the influence of the ratio between the bed height and the coil length is here presented using the color bar. The PtH efficiency increases for all sphere diameters because the number of spheres increases as well with a higher bed and so does the induced power according to Equation (13). Therefore, induction heating of a fully packed bed results in maximum efficiency, in particular, when ferromagnetic steel is used at bed temperatures close to 580 °C.

4.4. Idealized Parameter Study for μ = c o n s t

The next parameter study aims at the identification of optimal design solutions for the PtH efficiency and volumetric power density. In contrast to the previous investigation from Section 4.3, the magnetic permeability μ is independent from bed temperature and is varied from paramagnetic property at μ = 1 to the ferromagnetic property at μ = 50 . In addition, the penetration depth δ from Equation (10) is used as variable parameter that imply the frequency and the ideally considered temperature independent material properties σ and μ . This technological parameter is varied from 1 m to 10−4 m and is set in relation to the sphere diameter x δ = δ / d to consider on the one hand the varied geometry of the fully packed bed and on the other hand to obtain a dimensionless technological parameter referred to as the relative skin depth x δ .
In contrast to the results presented in Figure 12, the maximum PtH efficiency and volumetric power density q ˙ i n d , P B from Figure 13 are related to the ratio δ / d for different μ values. For the non-magnetic material with μ = 1 maxima for q ˙ i n d , P B   and η P t H , m a x occur at x δ = 0.20 . These both KPIs first increase reaching x δ = 0.20 due to the pronounced skin effect at low skin depth. After this optimum value, the drop results from the dominating decrease of the material utilization caused by large sphere diameters. This effect has been discussed by many authors for inductively heated cylinders and plates. In contrast to this investigation, they use the reciprocal quantity m = x δ 1 , which is for cylinders at m o p t , μ = 1 = 3.5 [3] and for plates at m o p t , μ = 1 = 1.75 [4]. For a ferromagnetic material with μ > 1 the maxima in Figure 13 increase for both KPIs as they shift from x δ , o p t , μ = 1 = 0.20 to x δ = 0 . Altogether, the optimal values x δ , o p t are decisive for a high power density and a high efficiency. This means that materials at high-temperature operation beyond their Curie point as well as non-magnetic materials have the potential to achieve high efficiencies by, for instance, adapting the frequency to x δ , o p t .

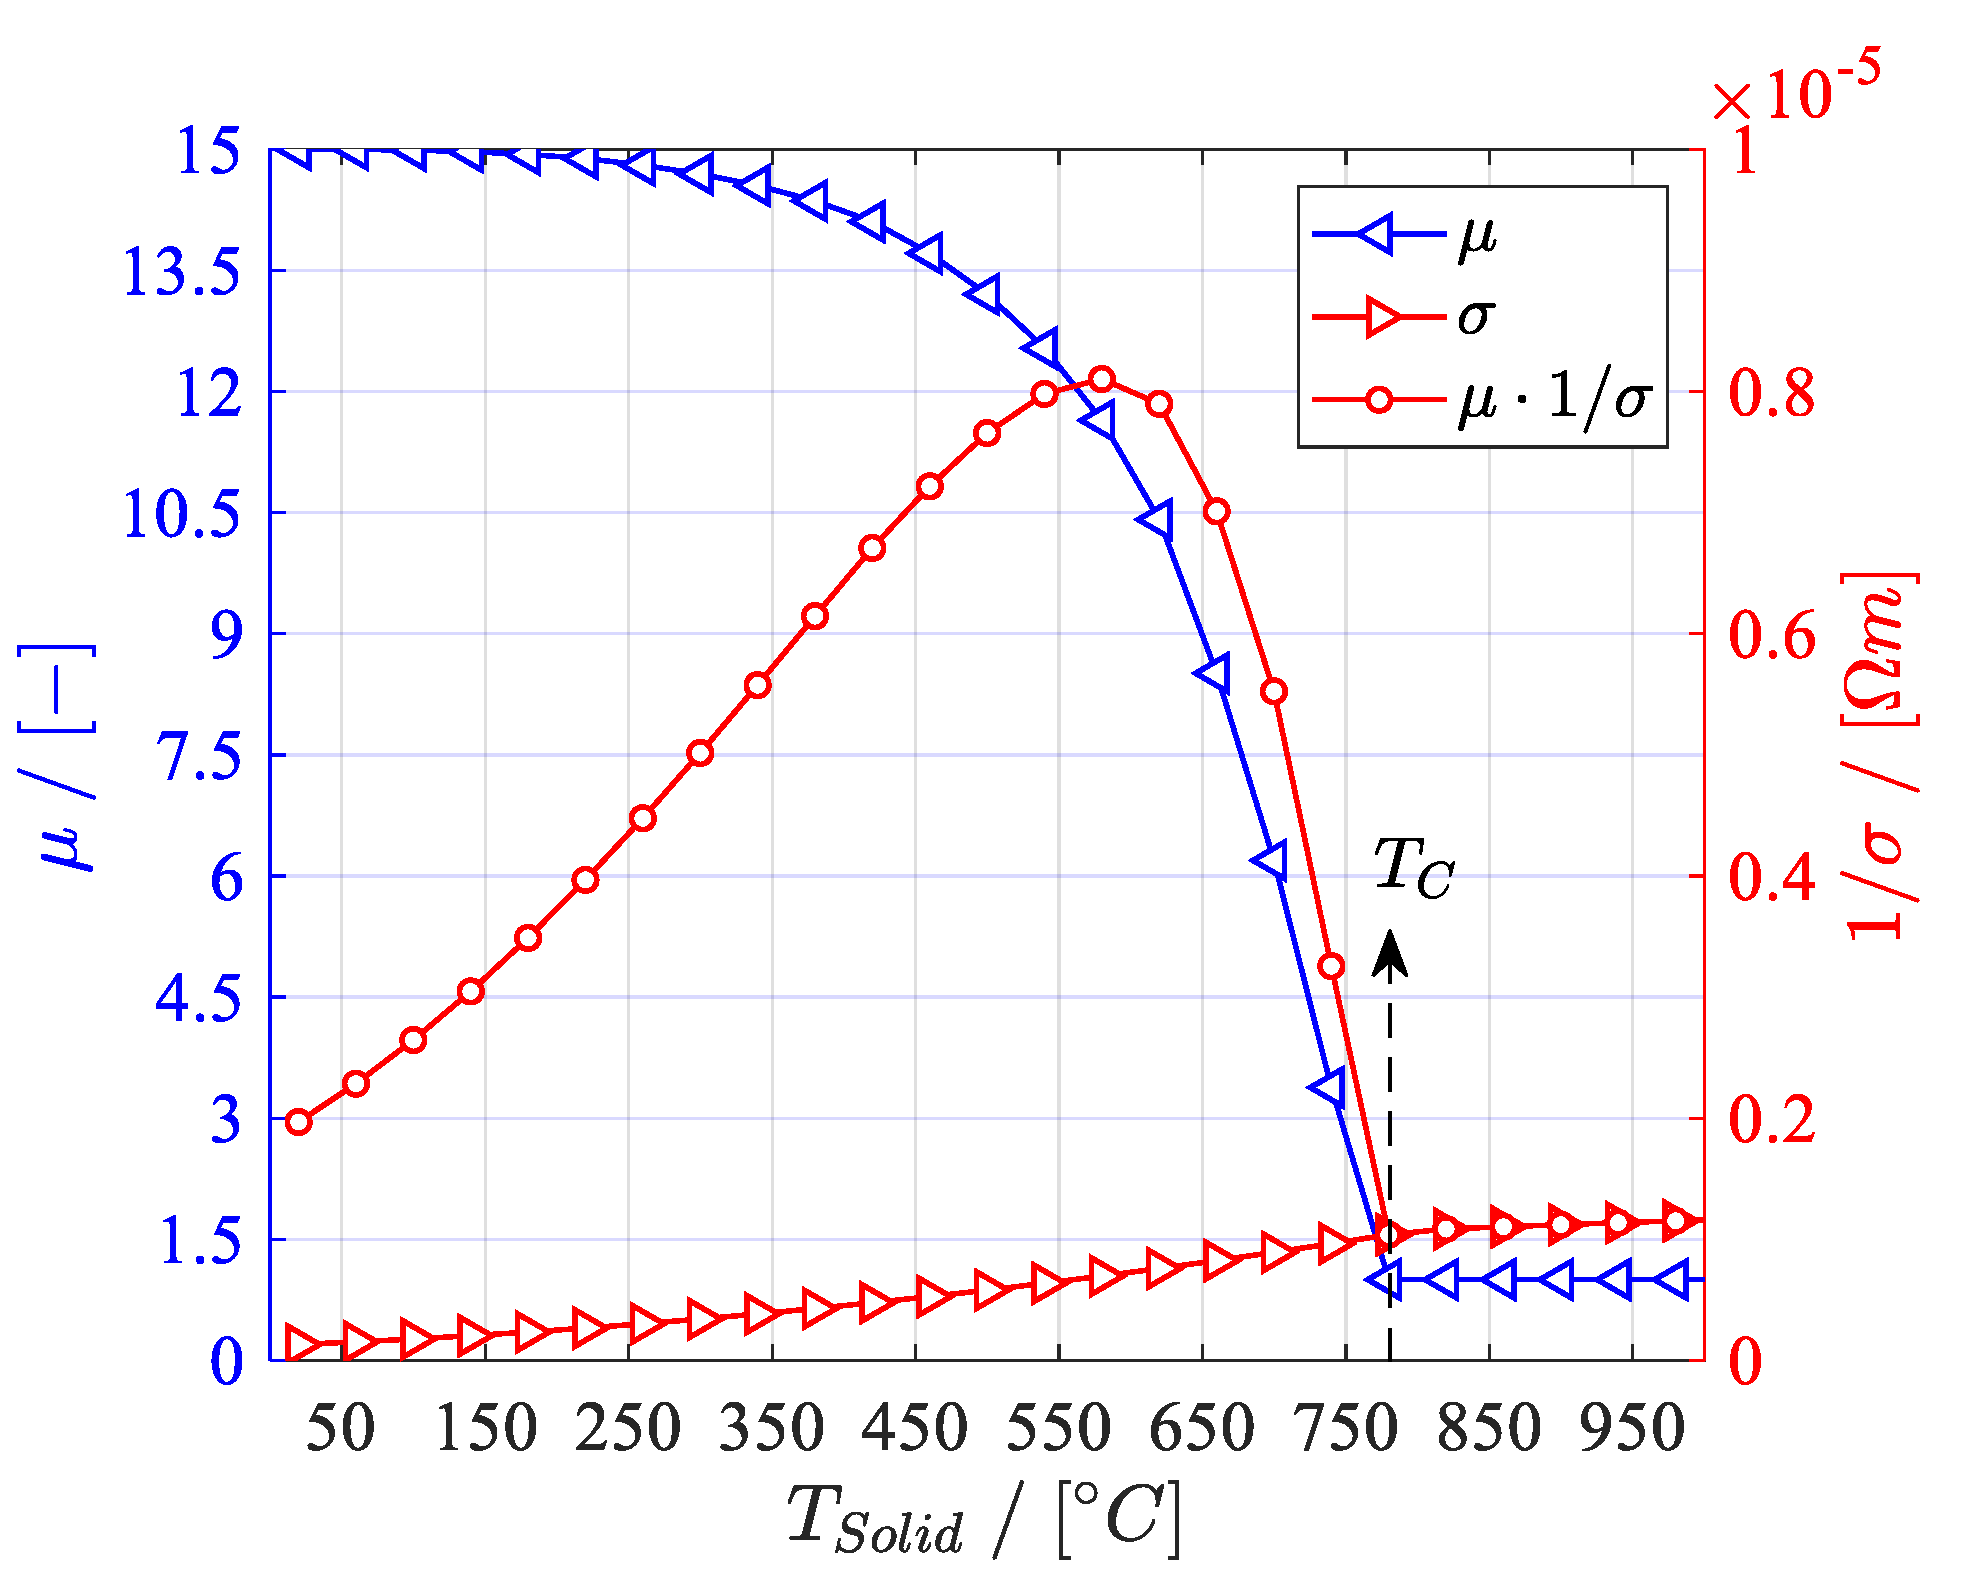
4.5. Identification of Efficient High-Temperature Materials

The final parameter study aims to identify suitable material solutions, which ensure high efficiencies and power densities under high-temperature operation beyond T C . Such process temperatures are required for industrial high-temperature applications using EFH and for power plant processes with PtH extension. For the second use case, air outlet temperatures up to 1050 °C are needed, for instance, to reduce the capital expenditures of a Brayton battery system [10,12].
The approach is similar to the one from Section 4.4. The magnetic permeability μ is again independent from bed temperature and is varied from non-magnetic property at μ = 1 to consider the mentioned applications at T S o l i d > T C to the strong ferromagnetic property at μ = 10 2 for low temperature applications at T S o l i d < T C . In addition, the electrical conductivity, which is temperature independent in this analysis, is varied in a wide range from 102−1m−1 to 108−1m−1 to consider electrical semiconductors and conductors as well. For practical reasons, the frequency is maintained constant throughout the process. For industrial applications the frequency is usually below 10 kHz to minimize ohmic losses in the power converter. Therefore, we assume f = 5 kHz and an electrical current of 800 A. Furthermore, geometrical conditions for such an application in the Brayton battery on the megawatt scale are summarized in Table 5.
Figure 14 illustrates results for the PtH efficiency as contour lines in relation to both varied material properties where the optimal values for x δ , o p t from Section 4.4 are additionally illustrated. Contour lines for specific PtH efficiency show the optimal range for both material properties in terms of energy efficiency. Hence, to achieve a high efficiency of η P t H , m a x > 0.95 for low temperature applications ( T S o l i d < T C ) the magnetic permeability might be in the range 10 < μ < 100 for ferromagnetic conductors with an electrical conductivity in the range 2.0 × 10 6 < σ < 15.0 × 10 6   Ω 1 m 1 for steel. For high-temperature applications at T S o l i d > T C , this contour plot reveals the required electrical conductivity for non-magnetic materials at μ = 1 in between 40 , 000 < σ < 190 , 000   Ω 1 m 1 . A similar contour plot of the induced volumetric power density from Figure 15 additionally reveals values above 5.5 MW/m3 for q ˙ i n d , P B in a similar σ range at μ = 1 . Since the electrical conductivity of steel is normally higher ( σ C S > 1.0 10 6   Ω 1 m 1 for carbon steel), semi-conductive materials are required that are correspondingly high-temperature resistant. Considering these both criteria, electrically conductive ceramics are suitable material options within the identified σ -range. In particular, silicon-infiltrated silicon carbide (SiSiC) has a suitable electrical conductivity between 1000   Ω 1 m 1 and 50 , 000   Ω 1 m 1 at T S o l i d = 1000 K. Therefore, this carbide ceramic solution is proposed for the application of inductively heated PB gas heater in high-temperature industrial processes and particularly as PtH extension in the Brayton battery.

5. Conclusions

The purpose of this article is to verify a novel Power-to-Heat (PtH) concept for the induction gas heater and to provide a validated design tool along with deduced material solutions for an energy-efficient operation at high temperatures beyond the state of the art solutions with 700 °C. To this end, an experimental study with associated simulations based on a finite volume method modeling approach is conducted for the inductively heated and fluidized pebble bed (PB) concept. A coupled electromagnetic and thermal model is implemented and validated using data from the experimental study. Acceptable deviations less than 15% occur for the air outlet temperature at Reynolds numbers larger than 2000 due to the assumptions of a homogenous external magnetic field and due to the neglected radiation effects. Therefore, the introduced modeling approach can be applied as a solid basis for the identification of inductively heated PB gas heater design solutions with high efficiency and power density.
Parameter studies are conducted based on the validated model to identify energy-efficient designs with high power density for high-temperature application below and far beyond the Curie point of carbon steel at T C = 768   ° C . Key performance indicators such as volumetric power density, PtH efficiency and heat flux density have been chosen to evaluate the performance of the PtH concept. In case of T S o l i d < T C , results for the PtH efficiency and power density reveal that the optimal operation range for the ferromagnetic steel UNS G10060 PB is around 580 °C using a fully packed bed design with small particles ranging from 10 mm to 30 mm. Such design solutions enable PtH efficiencies above 90% at heat flux densities over 2.0 W/cm2. For high-temperature applications with T S o l i d > T C , where only non-magnetic materials can be used, an exemplary Brayton battery use case is considered. In that case, efficiencies above 95% and power densities higher than 5.5 MW/m3 are found for the first time in the electrical conductivity range of 40,000 Ω−1m−1 and 190,000 Ω−1m−1. Silicon-infiltrated silicon carbide (SiSiC) offers candidates in this range. Therefore, the semiconducting SiSiC is proposed as a suitable material solution for the application beyond the Curie point of steel.
Altogether, this investigation has led to a greater process understanding of the novel PtH concept and has verified its applicability demonstrating high efficiencies along with high power densities for temperatures below the Curie point of carbon steel. However, for temperatures above this Curie point only theoretical outcomes have been discussed, thus experimental proof of the concept under the working conditions of a Brayton battery is pending. Therefore, further work aims at testing the induction air heater inside a pressure vessel at temperatures far beyond the Curie point of steel.

Author Contributions

Conceptualization, S.B.; methodology, S.B.; software, S.B. and O.K.; experiments, O.K.; validation, S.B.; formal analysis, S.B.; investigation, S.B.; resources, S.B.; data curation, S.B.; writing—original draft preparation, S.B.; writing—review and editing, S.B., O.K. and S.Z.; visualization, S.B.; supervision, S.Z.; project administration, S.Z.; funding acquisition, S.Z. All authors have read and agreed to the published version of the manuscript.

Funding

This research received no external funding.

Conflicts of Interest

The authors declare no conflict of interest.

Nomenclature

A H T F area provided by the pebble bed for heat transfer (m2)
B magnetic flux density (T or kg s−2A−1)
c p specific heat capacity (J kg−1 K−1)
d sphere diameter (m)
D P B bed diameter (m)
E electric field strength (V m−1)
f frequency (Hz)
F power transmission factor of a sphere (-)
H magnetic field strength (A m−1)
H P B bed height (m)
I i inductor’s peak current (A)
k   damping coefficient (m−1)
K Nagaoka’s correction factor (-)
l length (m)
m ˙ f mass flow rate (kg s−1)
n number of spheres (-)
N i number of inductor turns (-)
P e l , i n electric power input at coil terminals (W)
p i n d specific electric power per unit volume (W m−3)
P i n d , t o t total electrically induced power input (W)
q ˙ i n d Joule heat power density (W m−3)
q ˙ t o t total heat flux density to HTF (W cm−2)
r sphere radius (m)
R e Reynolds number (-)
T temperature (°C)
t time scale (s)
V volume (m3)
V ˙ f volume flow rate (m3 s−1)
w f free flow velocity (m s−1)
x δ relative skin depth x δ = δ / d (-)
x   ¯ averaged quantity x
X vector quantity X
Greek symbols
δ skin depth (m)
ε void fraction (-)
η energetic efficiency   η P t H = Q ˙ t h , o u t / P e l , i n
λ thermal conductivity (W m−1 K−1)
μ 0 magnetic field constant 4 π 10 7 (N A−2)
μ relative magnetic permeability (-)
ρ density (kg m−3)
σ electrical conductivity ( Ω 1 m 1 )
ω angular frequency (Hz)
Subscripts and Superscripts
CCurie point/Curie temperature
EFHelectric flow heater/electric fluid heater
HThigh-temperature
HTFheat transfer fluid
PBpebble bed
PtHpower-to-heat
SiSiCsilicon-infiltrated silicon carbide
TESthermal energy storage
s/fsolid/fluid phase
iInductor/induction coil

Appendix A

The solution of Equation (12) requires the spatial distribution of the electric field E ϕ   as given by Equation (5). The integration of these equations bases on the assumption that the electric field distribution is constant throughout every cell in the mesh of the steel spheres. As an approximation, this constant value is taken at the centroid of every cell. Consequently, to accurately represent the induced heat flux, the cells need to be sufficiently small as compared to the spatial gradient of the electric field.
To evaluate the numerical scheme, a grid refinement study is conducted by increasing the number of layers added at the internal surface of the spheres. The case of 30 mm spheres and the highest flow inlet velocity of 3.05 m/s is chosen as it represents the highest energy dynamics. This translates to the highest Reynolds number, which implies the smallest thermal boundary layer thickness. Similarly, since the skin depth δ is constant, the largest sphere has the smallest energy input depth as compared to its diameter. Therefore, this case represents the worst-case scenario for mesh density requirements at the interface between the spheres and the flow for both the internal heat generation and the external heat transfer. The volumetric power density and the total power is plotted as a function of mesh elements in Figure A1. As shown in the figure, for increasing number of mesh layers, the total induced heat input to the system converges with a relative error of less than 0.5% at above 57 Mio. elements, which corresponds to 30 inflation layers.
Figure A1. Grid refinement study presented for case 1 with 30 mm particle diameter and 3.05 m/s air velocity at the inlet.
Applsci 13 02311 g0a1

References

  1. Böttger, D.; Götz, M.; Lehr, N.; Kondziella, H.; Bruckner, T. Potential of the power-to-heat technology in district heating grids in Germany. Energy Procedia 2014, 46, 246–253. [Google Scholar] [CrossRef]
  2. Välilä, K.; Laing-Nepustil, D.; Nepustil, U. Power-to-Heat—Wo könnte es hingehen? Z. Energ. 2020, 44, 247–259. [Google Scholar] [CrossRef]
  3. Sergio, L. Fundamentals of Electroheat. In Electrical Technologies for Process Heating; Springer: Cham, Switzerland, 2017. [Google Scholar]
  4. Lucía, O.; Maussion, P.; Dede, E.J.; Burdío, J.M. Induction heating technology and its applications: Past developments, current technology, and future challenges. IEEE Trans. Ind. Electron. 2014, 61, 2509–2520. [Google Scholar] [CrossRef]
  5. Lupi, S.; Michele, F.; Aleksandr, A. Induction and Direct Resistance Heating; Springer: Cham, Switzerland, 2015. [Google Scholar]
  6. Ohmex, Electrical Process Flow Heaters Datasheet. 2021. Available online: https://www.ohmex.de/en/wp-content/uploads/sites/3/2020/03/electric-process-heater_STR_2020-03.pdf (accessed on 25 April 2022).
  7. Schniewindt, Flow Heaters. 2021. Available online: https://www.schniewindt.de/en/csn-flow-heaters/ (accessed on 25 April 2022).
  8. Curran, J.S.; Featherstone, A.M. Electric-induction fluid heaters. Power Eng. J. 1988, 2, 157–160. [Google Scholar] [CrossRef]
  9. Vecchi, A.; Knobloch, K.; Liang, T.; Kildahl, H.; Sciacovelli, A.; Engelbrecht, K.; Li, Y.; Ding, Y. Carnot Battery development: A review on system performance, applications and commercial state-of-the-art. J. Energy Storage 2022, 55, 105782. [Google Scholar] [CrossRef]
  10. Benato, A. Performance and cost evaluation of an innovative pumped thermal electricity storage power system. Energy 2017, 138, 419–436. [Google Scholar] [CrossRef]
  11. Chen, L.X.; Hu, P.; Zhao, P.P.; Xie, M.N.; Wang, F.X. Thermodynamic analysis of a high-temperature pumped thermal electricity storage (HT-PTES) integrated with a parallel organic Rankine cycle (ORC). Energy Convers. Manag. 2018, 177, 150–160. [Google Scholar] [CrossRef]
  12. Sergej, B. Techno-economic evaluation of a Brayton Battery configuration with Power-to-Heat extension. J. Energy Storage 2023, 62, 104570. [Google Scholar]
  13. Unver, U.; Yuksel, A.; Kelesoglu, A.; Yuksel, F.; Unver, H.M. Analysis of a novel high performance induction air heater. Therm. Sci. 2018, 22 (Suppl. 3), 843–853. [Google Scholar] [CrossRef]
  14. Unver, U. Efficiency analysis of induction air heater and investigation of distribution of energy losses. Teh. Vjesn. 2016, 23, 1259–1267. [Google Scholar] [CrossRef]
  15. Baumeister, E.B.; Bennett, C.O. Fluid-particle heat transfer in packed beds. AIChE J. 1958, 4, 69–74. [Google Scholar] [CrossRef]
  16. Eichorn, J.A.C.O.B.; Robert, R.W. Particle to Fluid Heat Transfer in Fixed and Fluidized Beds. Chem. Eng. Progr. Symp. Ser. 1952, 48, 11. [Google Scholar]
  17. Xu, G.; Sun, Z.; Meng, X.; Zhang, X. Flow boiling heat transfer in volumetrically heated packed bed. Ann. Nucl. Energy 2014, 73, 330–338. [Google Scholar] [CrossRef]
  18. Leininger, S.; Kulenovic, R.; Rahman, S.; Repetto, G.; Laurien, E. Experimental investigation on reflooding of debris beds. Ann. Nucl. Energy 2014, 74, 42–49. [Google Scholar] [CrossRef]
  19. Duquenne, P.; Deltour, A.; Lacoste, G. Application of inductive heating to granular media: Temperature distribution in granula bed. Int. J. Heat Mass Transf. 1993, 36, 2473–2477. [Google Scholar] [CrossRef]
  20. Duquenne, P.; Deltour, A.; Lacoste, G. Application of inductive heating to granular media: Modelling of electrical phenomena. Can. J. Chem. Eng. 1994, 72, 975–981. [Google Scholar] [CrossRef]
  21. Kennedy, M.W.; Akhtar, S.; Bakken, J.A.; Aune, R.E. Review of classical design methods as applied to aluminum billet heating with induction coils. In Proceedings of the EPD Congress 2011-TMS 2011 Annual Meeting and Exhibition, San Diego, CA, USA, 27 February–3 March 2011; pp. 707–722. [Google Scholar]
  22. Poritsky, H. Conducting sphere in alternating magnetic fields. Trans. Am. Inst. Electr. Eng. Part I Commun. Electron. 1960, 78, 937–942. [Google Scholar] [CrossRef]
  23. Nagaoka, H. The inductance coefficients of solenoids. J. Coll. Sci. Imp. Univ. Tokyo Jpn. 1909, 27, 1–33. [Google Scholar]
  24. Rocky 4.4 DEM Technical Manual; Engineering Simulation and Scientific Software: Florianópolis, Brazil, 2020.
  25. Rothman, M. (Ed.) High-Temperature Property Data: Ferrous Alloys; ASM International: Almere, The Netherlands, 1988. [Google Scholar]
  26. Silca Refractory Solutions. “Thermal Insulation, Non-Ferrous Meatal Casting & Fire Protection” Catalogue 2018. Available online: https://www.silca-online.de/fileadmin/2.pdf/04.produktdatenblaetter-ht-en/PDB-SILCAFELT_EN.pdf (accessed on 15 July 2022).
  27. BCE Special Ceramics. “Comparison Table for Technical Ceramics” 2021. Available online: https://www.bce-special-ceramics.com/comparison/bce-material-table.htm (accessed on 15 July 2022).
  28. Lucks, C.; Deem, H. Thermal Properties of 13 Metals; Special Technical Publication No. 227; ASTM: West Conshohocken, PA, USA, 1958. [Google Scholar]
  29. Harvey, P. (Ed.) Engineering Properties of Steel; ASM: Almere, The Netherlands, 1982. [Google Scholar]
  30. Frenzelit GmbH. Novamica®—Phlogopite Mica Gaskets. Available online: https://www.frenzelit.com/fileadmin/produkte/dichtungen/novamica/de_en/Brochure_novamica_en.pdf (accessed on 16 July 2022).
  31. Hänchen, M.; Brückner, S.; Steinfeld, A. High-temperature thermal storage using a packed bed of rocks–heat transfer analysis and experimental validation. Appl. Therm. Eng. 2011, 31, 1798–1806. [Google Scholar] [CrossRef]
Figure 1. Conceptual arrangement under investigation and heat balance of the inductively heated pebble bed concept.
Applsci 13 02311 g001
Figure 2. Simulation procedure of the filling process with d = 30 mm spherical particles into the Al2O3 container using Rocky multibody DEM software [24].
Applsci 13 02311 g002
Figure 3. Cross-section of the computational domain for case 1: pebble bed with d = 30 mm; subdomains: 1-fluid; 2-solid; 3-tube; 4-insulation.
Applsci 13 02311 g003
Figure 4. Cross-section of case 1 mesh (d = 30 mm) with 15 layers for the sphere subdomain and for its boundary layer inside the fluid subdomain.
Applsci 13 02311 g004
Figure 5. Coupled electromagnetic and thermal analysis with feedback of the temperature field for update of electromagnetic material properties.
Applsci 13 02311 g005
Figure 6. Experimental setup without exterior insulation layers and a glass tube instead of used Al2O3 ceramic tube between induction coil and pebble bed.
Applsci 13 02311 g006
Figure 7. P&ID flow chart for the experimental test rig based on DIN 19277.
Applsci 13 02311 g007
Figure 8. Experimental results for thermal output, the associated heat flux density and the PtH efficiency of the laboratory induction heater at flow rates V ˙ f = 0.85 [ 25 , 56 , 87 , 118 , 150 ]   Nm 3 h 1 .
Applsci 13 02311 g008
Figure 9. Comparison of simulation and experimental results of the total induced power P i n d , t o t and the HTF outlet temperature T f , o u t with one cross-sectional temperature profile solution for d = 30 mm, w f = 0.62 m/s.
Applsci 13 02311 g009
Figure 10. Relative magnetic permeability μ and electrical resistivity 1 / σ as a function of solid temperature TSolid for used steel UNS G10060 [5,25,29].
Applsci 13 02311 g010
Figure 11. Parameter study results for H P B = 0.10 , various sphere diameters and temperature dependent material properties for UNS G10060 from Figure 8 at constant electrical inputs: Ii = 333 A and f = 22 kHz.
Applsci 13 02311 g011
Figure 12. Results for various sphere diameters and bed heights for UNS G10060 at TS = 580 °C and at const. electrical inputs: Ii = 333 A and f = 22 kHz.
Applsci 13 02311 g012
Figure 13. Results for PtH efficiency and volumetric power density with respect to the varied diameter d = [0.005:0.05] m and δ = [1:10−4] m.
Applsci 13 02311 g013
Figure 14. Material properties study: contour lines for PtH efficiency η P t H , m a x using geometrical parameters from Table 5; Ii = 800 A and f = 5 kHz.
Applsci 13 02311 g014
Figure 15. Contour lines for induced power density q ˙ i n d , P B in MW/m3 using parameters from Table 5 at Ii = 800 A and f = 5 kHz.
Applsci 13 02311 g015
Table 1. Input parameter used for the DEM model.
ParameterMagnitude
particle diameter d
particle number n
case 1: 30 mm; case 2: 25 mm; case 3: 20 mm
case 1: 61; case 2: 91; case 3: 160
time step t 5 × 10⁻⁷ s
Young modulus
Poisson’s ratio
210 × 109 Pa
0.30
restitution coefficient0.20
Table 2. Geometries and materials used for components of the test section.
ParameterInductorInsulationCeramic TubePebble Bed
height [m]0.500.600.4700.07–0.10
outer/inner diameter [m]0.190/0.1700.170/0.1600.160/0.136d = 0.02/0.025/0.03 spheres
thickness [m]0.0100.0050.012≙ outer diam.
number [-]12 turns2 layers1 piece160/91/61pc.
heat transfer area [m2]-0.320.200.201/0.1787/0.1725
materialCu: 80% IACSAl. silica felt
140Z [26]
Al2O3
C799 [27]
UNS G10060
[25,28,29]
Table 3. Measurement devices used for the laboratory setup from Figure 7.
SensorMeasurementRangeAccuracy
Pt 100 class.1/3 B4 ladderTemperature of cooling water −50… +300 °C±0.27 °C for 0–100 °C
Thermocouple type K, class.1Temperature Solid−40… +1000 °C±1.5 °C or 0.4% m. v.
Multipoint Thermocouple
type K, Class 1 0.5   mm
Temperature air−40… +1000 °C±1.5 °C or 0.4% m. v.
Flow sensor IFM SM6050Volume flow rate for water 0–25 L/min.±(0.8% m. v. +0.5% m. e. v.)
Oscilloscope RTH1004Voltage Ui and Current output0…300 V,
f ≤ 60 MHz
Rogowski coil MA200 MiniflexCurrent Ii±2.0%
(f ≤ 1 MHz)
±(2.5% m. v. +0.7 A)
MF converterPower input and frequency0.5–40 kW±2.0%
BronkhorstF-206BI-PGF-99-VVolume flow rate for air V ˙ 0–350 Nm3/h ±0.5% m. v. +0.1%
Pitot TubeFlow velocity0–10 m/s±3.0% reading
Table 4. Input parameter for simulation study: frequency and electric current measured at coil terminals for the electromagnetic field solution, and inlet velocity boundary condition for coupled thermal analysis.
Air Inlet
Velocity w f
0.62 m/s1.27 m/s1.87 m/s1.46 m/s3.05 m/s
Ii [A]d = 20 mm347.89328.05323.14323.16311.62
d = 25 mm341.54331.33331.32326.21322.85
d = 30 mm341.05333.98328.74327.04323.53
f [kHz]d = 20 mm20.6821.2321.3621.3821.56
d = 25 mm20.8421.3021.4121.5721.57
d = 30 mm21.1621.6521.9722.0122.10
Table 5. Geometry parameter for application on the megawatt scale.
ParameterMagnitude
Particle diameter
Number of particles
Outer packed bed diameter
Packed bed height
Inductor and wire diameter
Inductor length
d = 0.12 m
n = 4688
DPB = 1.5 m
HPB = 4.0 m
Di = 1.875 m; si = 2.5 cm
li = 5.0 m
Number of inductor turnsNi = 144
Disclaimer/Publisher’s Note: The statements, opinions and data contained in all publications are solely those of the individual author(s) and contributor(s) and not of MDPI and/or the editor(s). MDPI and/or the editor(s) disclaim responsibility for any injury to people or property resulting from any ideas, methods, instructions or products referred to in the content.

