1. Introduction
Ellis describes graffiti as “someone’s urge to say something—to comment, to inform, entertain, persuade, offend or simply to confirm his or her own existence here on earth” [
1]. The identification of graffiti as art or crime has long been discussed from various social perspectives, such as culture, art, politics, and economics. There is still a significant disagreement in society, with some defending and supporting graffiti as a positive aspect and a form of artistic expression, while others consider it an act of vandalism [
2,
3].
Ross and Wright define the term graffiti as “words, figures, pictures, caricatures, and images that have been written or drawn on surfaces where the owner of the property has not permitted this activity”, and street art as “stencils, stickers, and wheat-pasted posters (e.g., non-commercial images) that are affixed to surfaces where the owner of the property has not permitted this activity” [
4], p. 2.
Both approaches are typically associated with acts of vandalism since the property owner usually does not permit the action in question [
4].
However, street art has shown great cultural importance in some cities, such as Lisbon. The Portuguese capital has also been slowly standing out in the world of urban art with the intense production of such works over the last year. Thus, Lisbon has been gradually positioning itself in this field worldwide and obtaining one additional motivation factor for tourism [
5]. Unlike many other cities, the Lisbon City Council provides specific spaces and walls spread around the city where the artists can apply to create street art, encouraging the creation of more of these works by making them legal and publishing them on the Lisbon urban art gallery’s website [
6].
As Campos states, “In international terms, street art has gradually become a city asset while at the same time it has grown in prestige and value for the contemporary art market” [
5], p. 1. For this reason, some studies, such as the one conducted by Novack et al. [
7], have already begun to focus on identifying and analyzing these works of art to support their mapping for tourism purposes. On the contrary, illegal graffiti, which does not add any value to the place, has become increasingly financially prejudicial due to the costs associated with its prevention and cleaning [
8,
9]. Besides that, illegal graffiti is known to cause a negative impact on the local economy: since general people associate it with dirtiness and insecurity, areas containing a wide presence of illegal graffiti are subject to a decline in consumer demand for products and services (such as restaurants, cafes, shops, houses, bus stops, etc.) [
10,
11].
To try to control and minimize damage, surveillance systems are often used. However, it is costly and impractical for surveillance personnel to monitor and detect graffiti simultaneously on multiple images and cameras [
8,
10]. For these reasons, more and more effort has been made to control and facilitate graffiti detection through automatic algorithms [
11].
The Lisbon City Council is interested in developing a system to automatically detect graffiti using real-time videos captured by cars that will navigate the city. Therefore, the process of supervision, identification, planning, and communication with the team of Urban Hygiene of the city and the removal of graffiti will be faster and more effective. This way, it will become easier to mitigate a significant problem in the town of Lisbon related to vandalism and damage to public spaces through graffiti.
The work developed in the context of this research work intends to be a proof of concept that aims to provide evidence of the feasibility of an automatic system for the identification and classification of graffiti using machine learning algorithms.
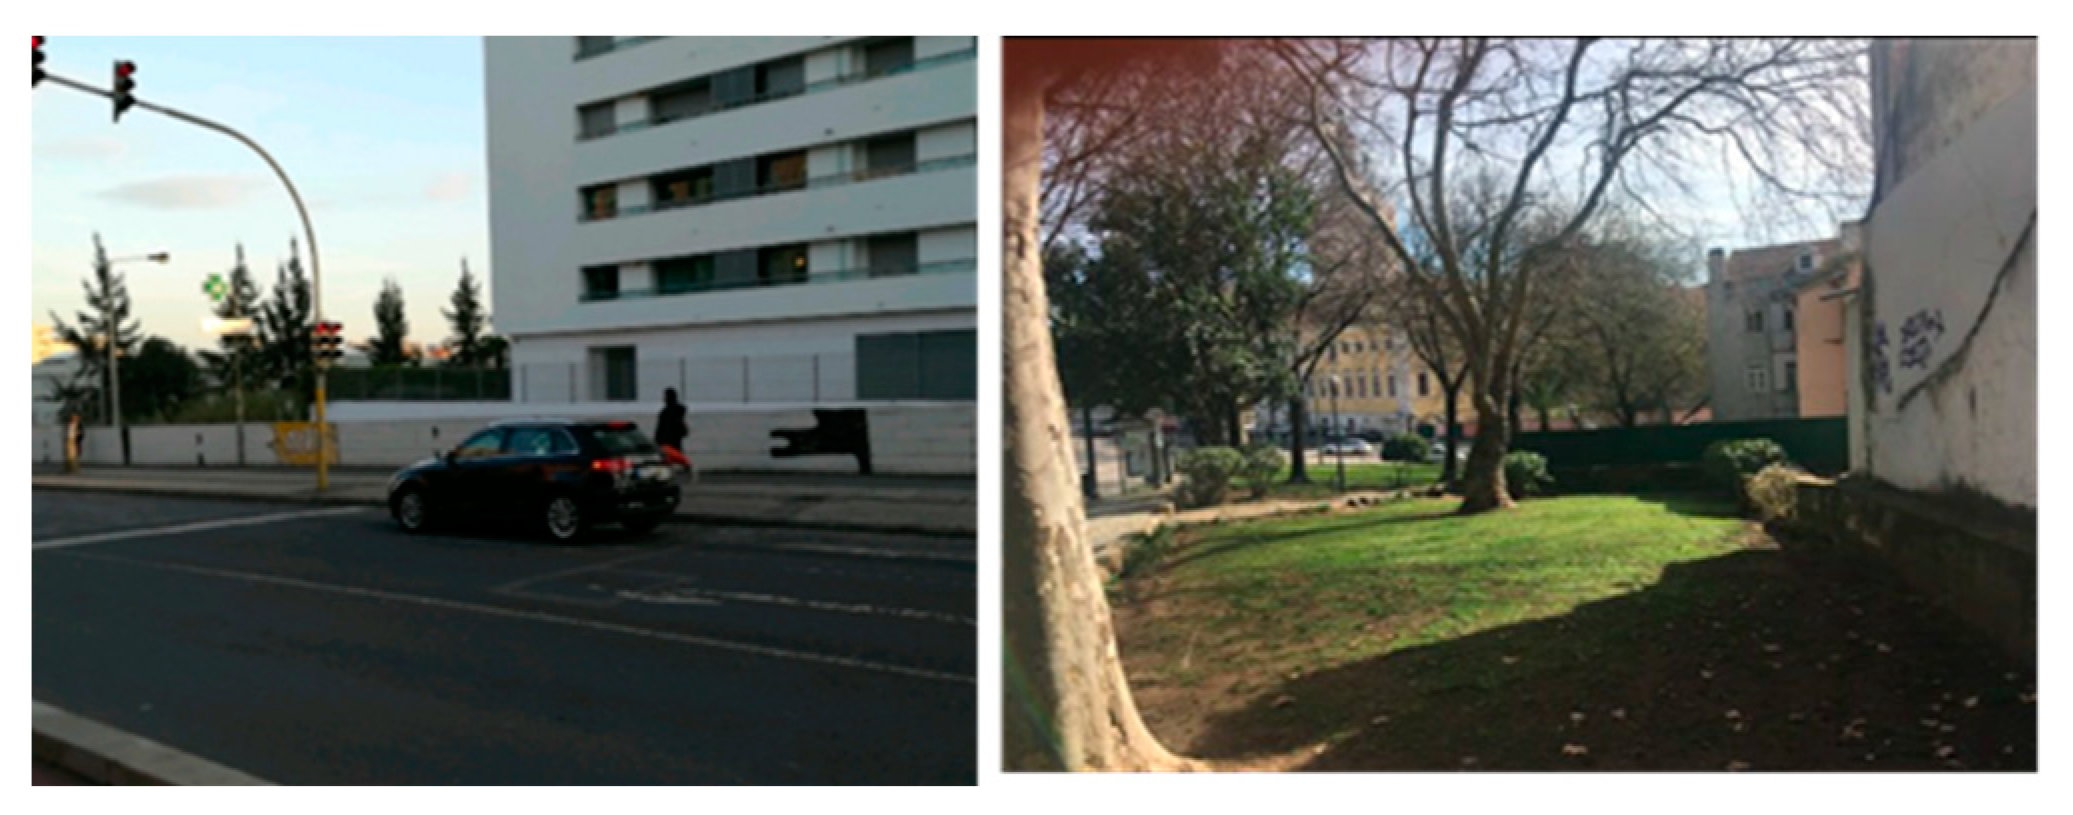
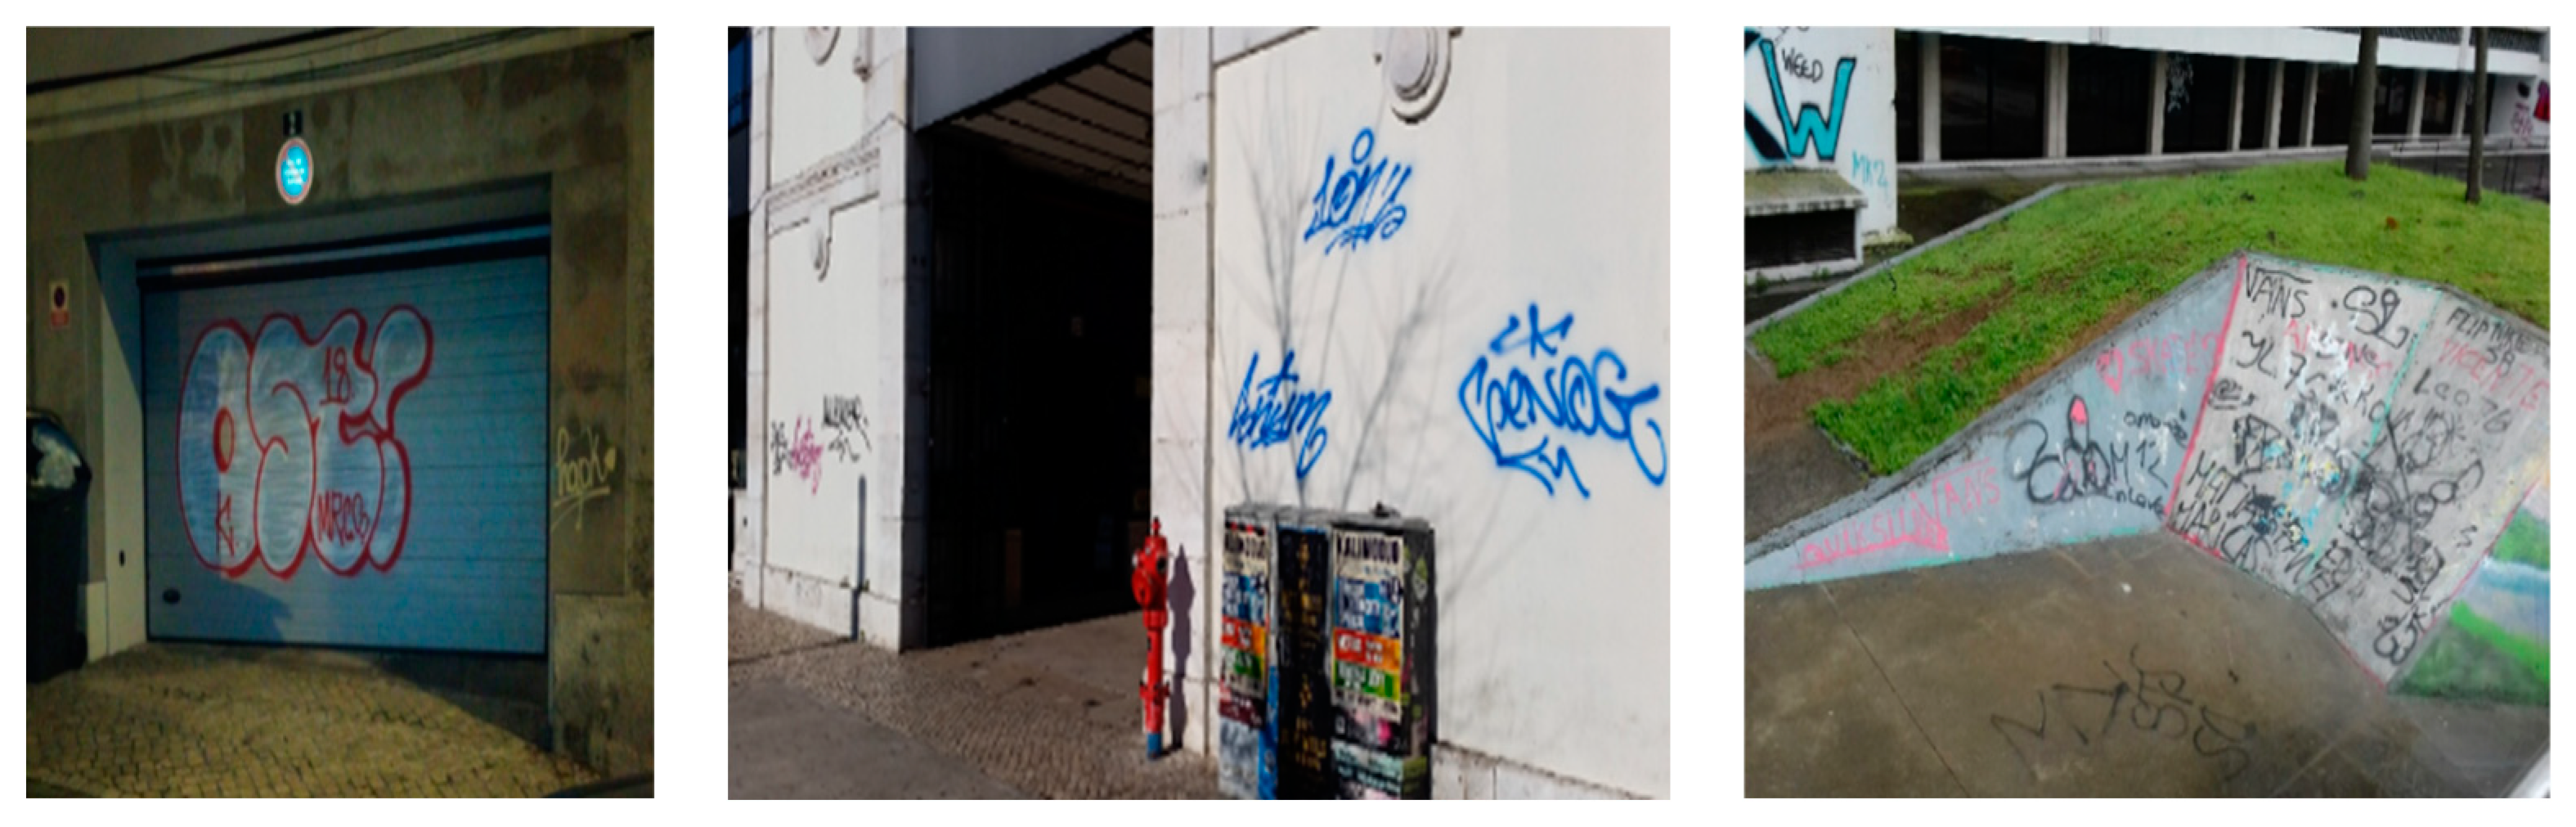
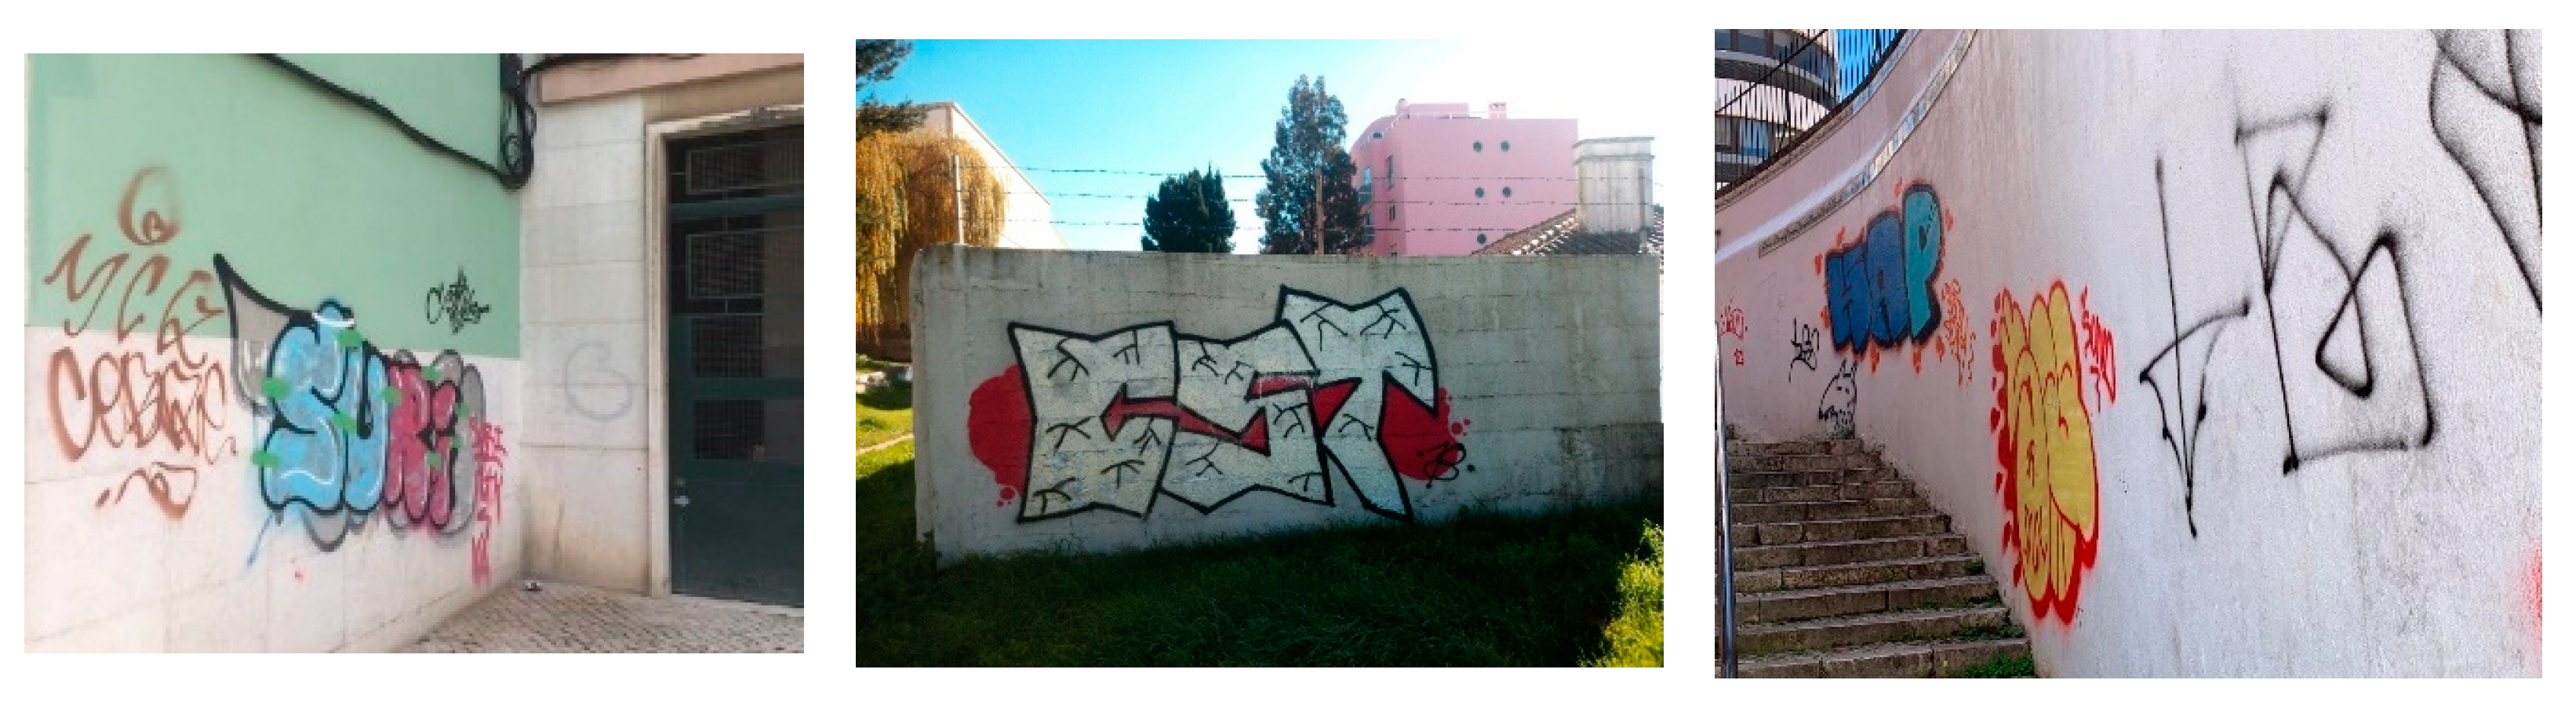
The primary objective of this study is to improve the process of detection and georeferencing of graffiti in Lisbon through a system that automatically identifies and classifies an image as having illegal graffiti (
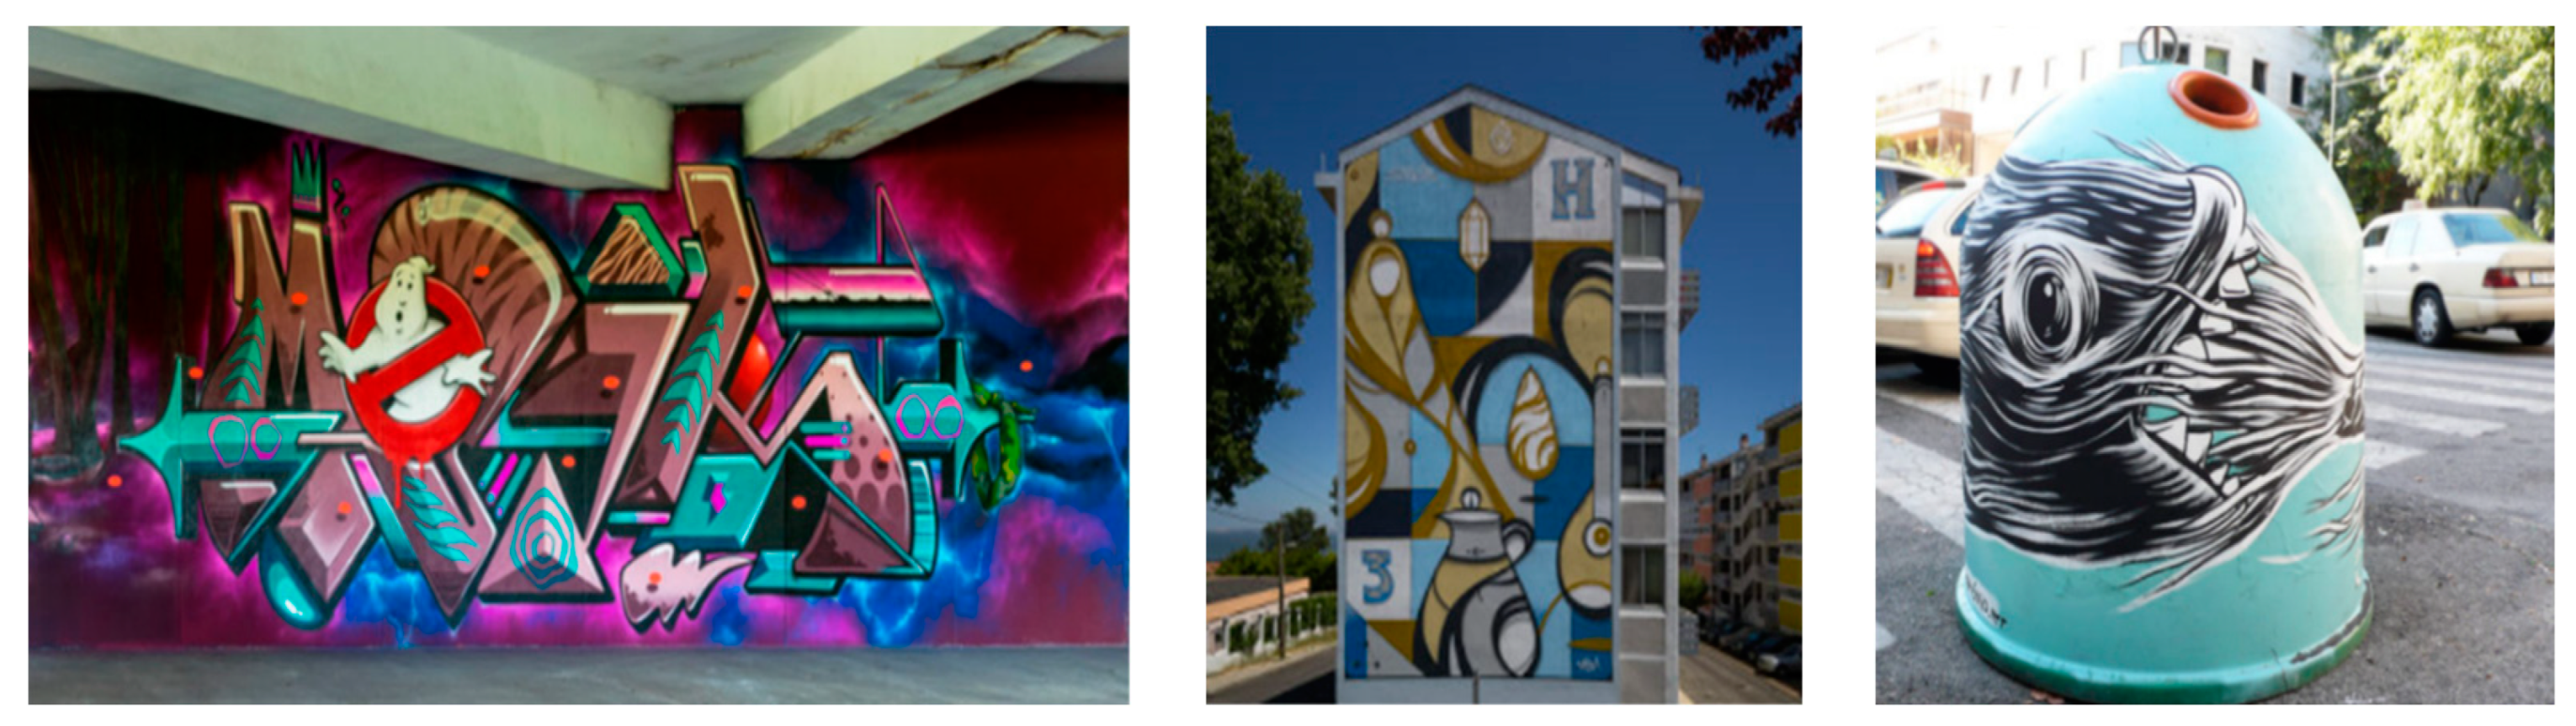
Figure 1), street art (
Figure 2), or no graffiti.
In addition, in cases where the image is classified as illegal, the system also detects the region of the image associated with the graffiti to notify the Urban Hygiene teams of which places need to be cleaned. This system would allow the allocation of the work done by the Lisbon City Council members in selecting the places to be cleaned to other more critical tasks. Thus, a tedious and time-consuming process can become a simple, easy, and effective process that only requires uploading images to an application. The grand ambition of the City Council is to develop a system that, through a camera system implemented in cars driving around the city, can detect walls that need cleaning and automatically notify the corresponding team of their location. This research work developed a contribution/proof of concept to understand the viability of the identification and classification of graffiti and, in this way, obtain the necessary certainty and confidence to determine whether it makes sense to invest in a system of automatic identification and classification in real time of the existing graffiti in the city of Lisbon.
Our major contributions are (1) a deep learning model that successfully discriminates the differences between street art and illegal; and (2) determining how accurate the automatic identification and location of illegal graffiti on images acquired in the streets of Lisbon under loose controlled conditions.
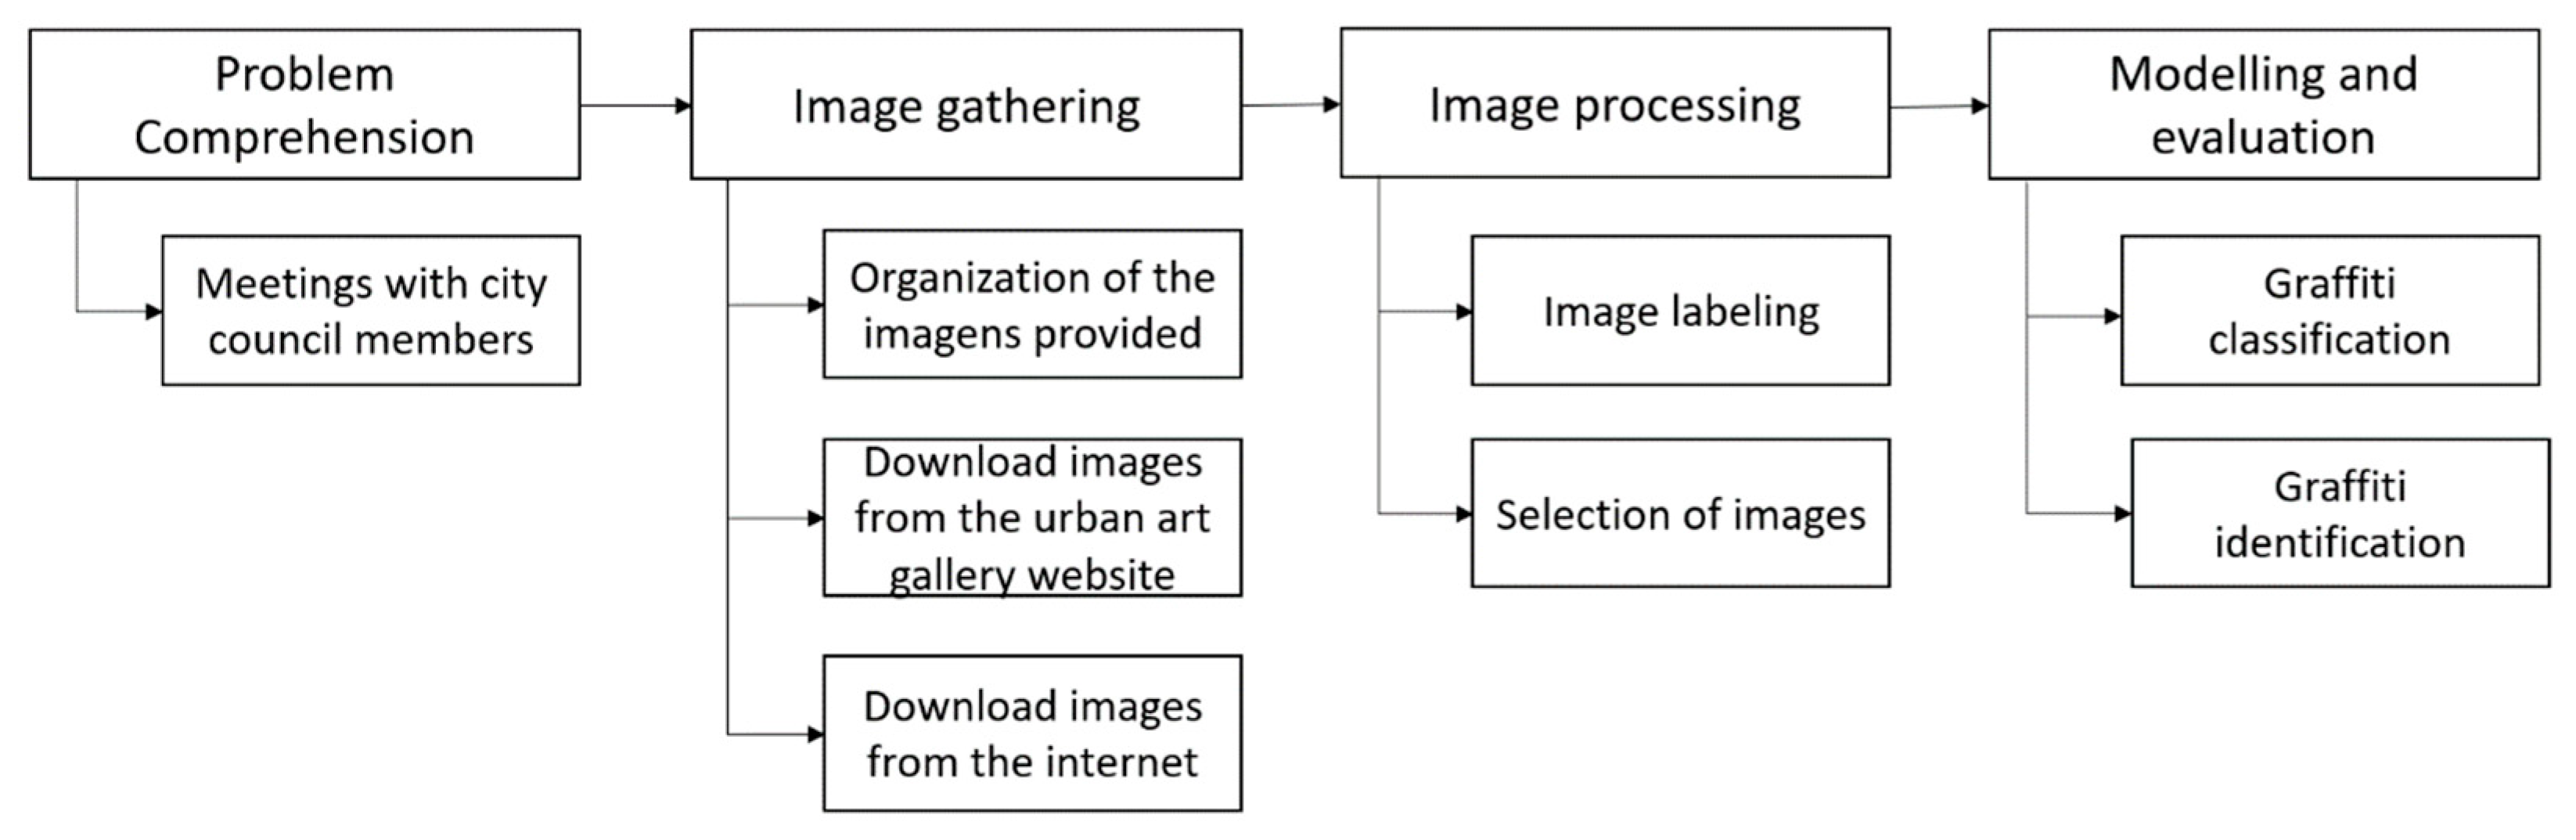
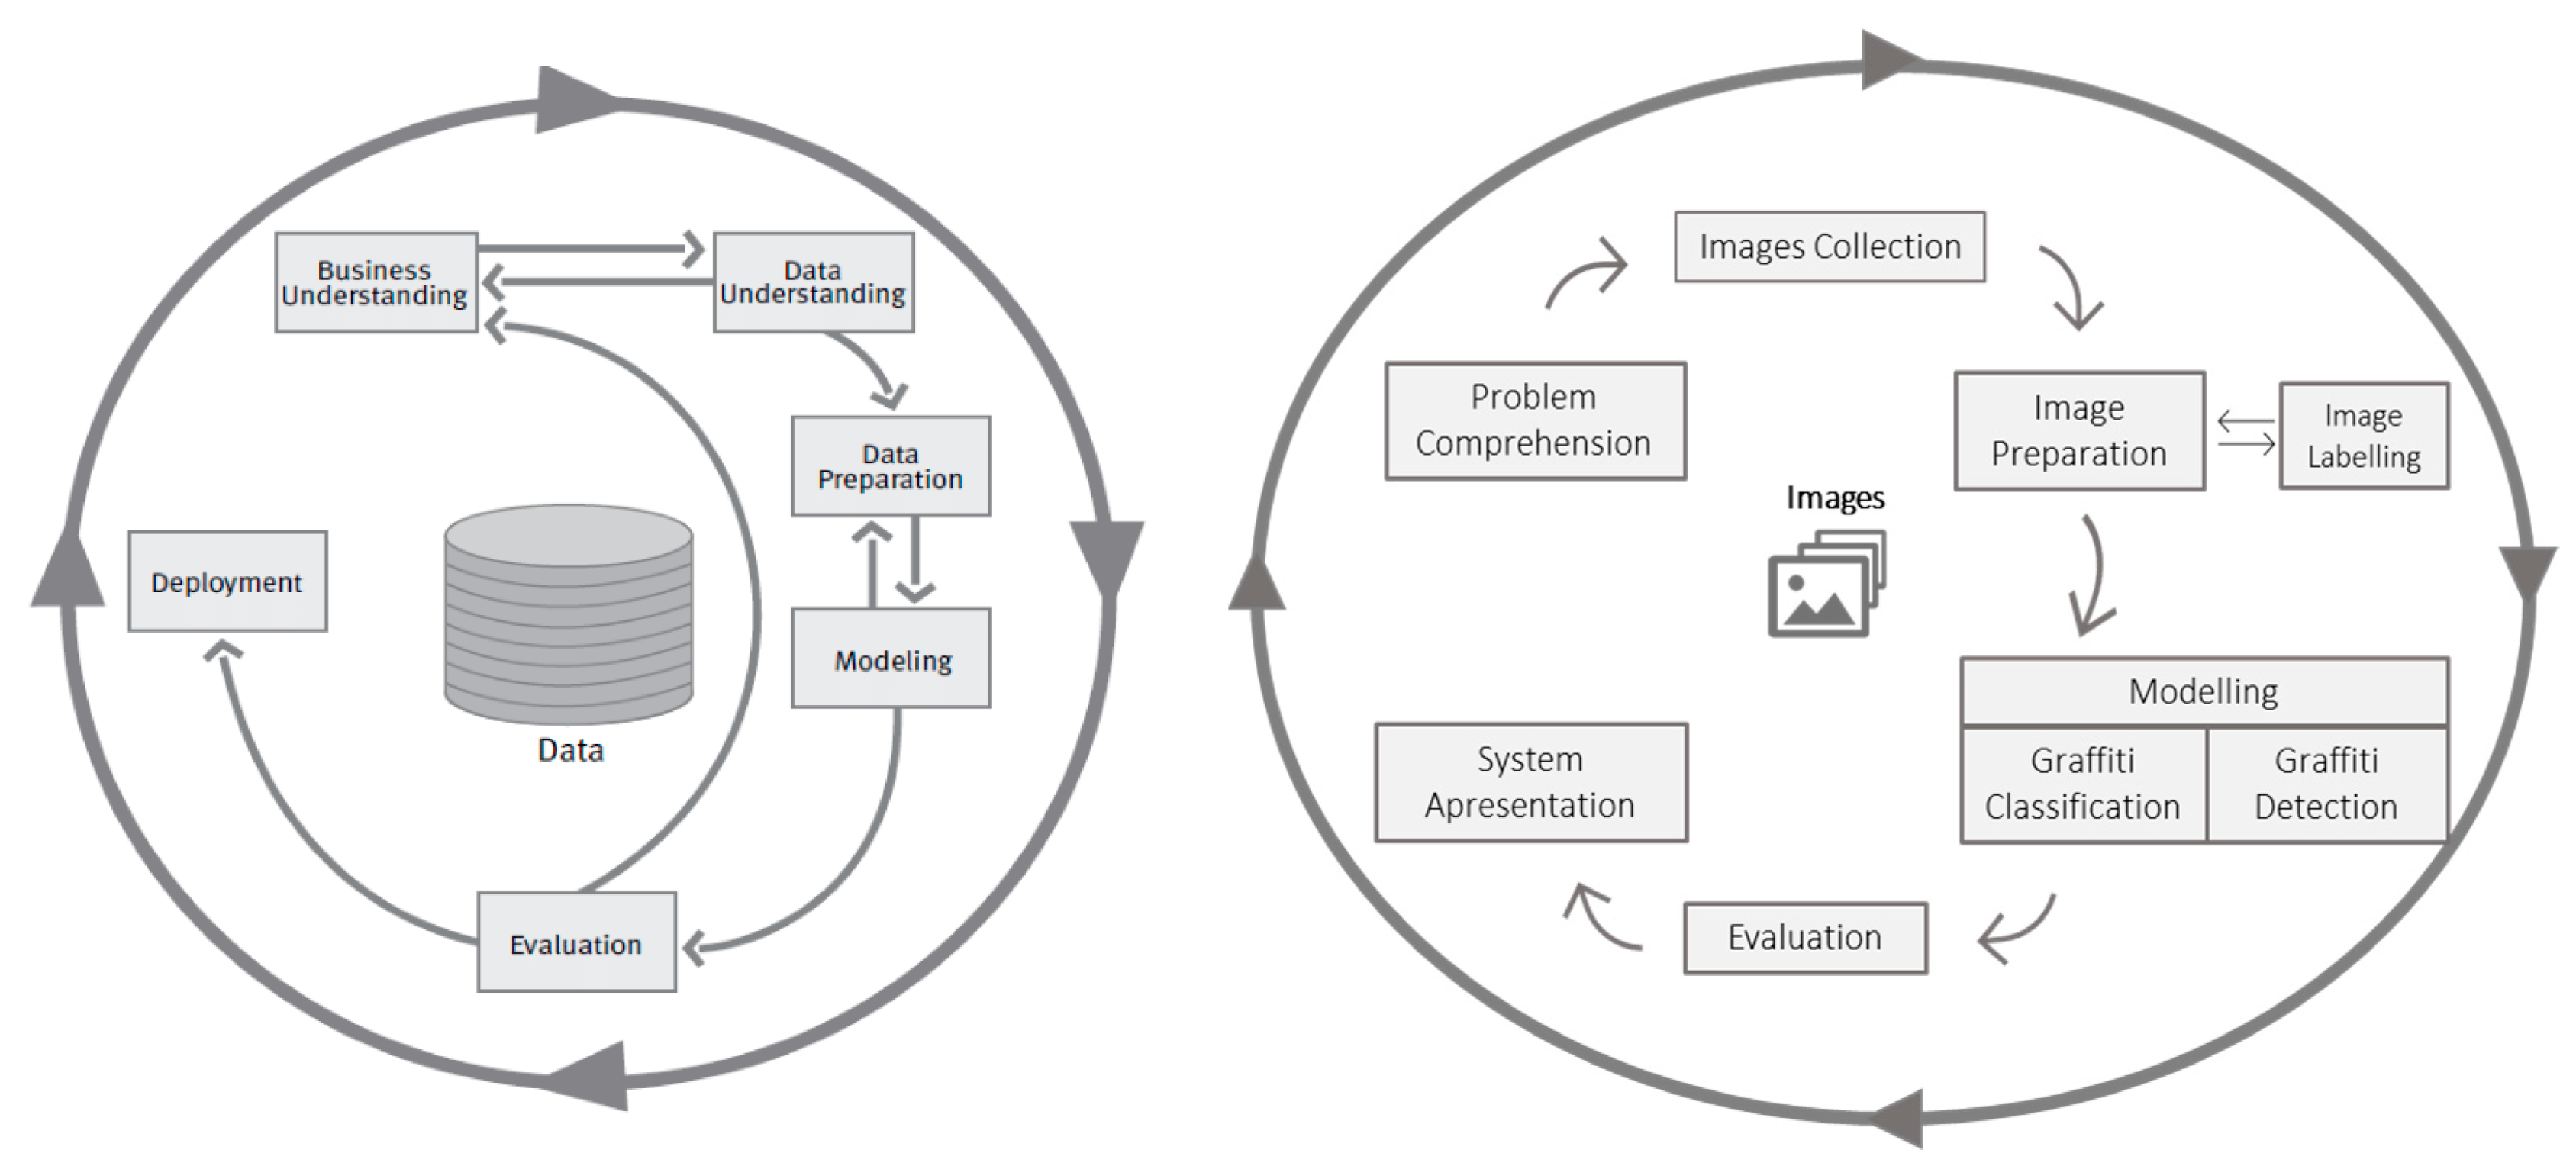
The system development methodology was based on the Cross Industry Standard Process for Data Mining (CRISP-DM). CRISP-DM is a methodology that provides an overview of the life cycle of a data mining project, describing all phases of the project [
12].
However, it was necessary to adjust the methodology to comply with the needs and characteristics of the problem and the data in question. The main difference to the problem at hand is the type of data. In this case, since it is a computer vision problem, the data consist of images, which require a different kind of processing and collection. These adjustments can be observed in
Figure 3.
2. Literature Review
This chapter will briefly introduce the literature review process, from the methodology used to the conclusions and algorithms used in similar projects related to identifying street art and illegal graffiti through video or images.
2.1. Systematic Review Methodology
The systematic literature review was based on the PRISMA methodology. The research methodology for the literature review started by gathering articles related to the theme through a joint search in the abstracts and citations from Scopus, web of science, and Google Scholar databases.
The query used to search the articles was the following:
(graffiti* OR street art OR (painting AND (wall* OR facades OR building*)) AND (“deep learning” OR “computer vision” OR “image analysis” OR “machine learning” OR “data science” OR “neural network” OR detection OR classification).
Different queries were considered and tested. However, this was the one that best suited the problem, resulting in articles covering the study’s two main themes: graffiti (of any kind) and data science. Additionally, the retrieved articles describe methods and models for detecting/analyzing paintings on walls using machine learning or image processing algorithms.
However, further filtering was necessary since, in addition to these articles, the results also present several related works from other fields, such as analyzing the best ways to remove graffiti, to detect the material of a surface covered with graffiti, and even duplicate articles. For this selection, in some cases, a simple analysis of the titles was enough, while others required a closer look at the abstracts.
At the end of the process, additional articles were removed from the list by further analysis of their contents. On the other hand, by inspecting the reference lists, additional articles were added to the selection. The included articles address not only other attempts of automatic classification and detection of graffiti but also their cultural impact, where discussions and opinions on the subject were debated.
This methodology generated a total of 20 articles, 15 of which are related to machine learning systems or image processing algorithms.
2.2. Related Work
Regarding the detection of acts of vandalism, there are some systems that, instead of only detecting graffiti, also detect the act of graffiti. An example is the work published in [
8], which implemented a system that aims to identify stationary visible changes based on the detection of modifications concerning a reference background that is stationary in space and time. However, since other objects, such as people standing still and parked vehicles, can also display stationary patterns in space and time, this system is prone to false positives.
Both [
10] and [
11] try to make the detection more effective by, in addition to analyzing visible changes due to variations of the appearance, also analyzing visible changes due to variations of the 3D geometry of the scene, i.e., the information relative to the depth. This way, this application can improve the results of [
8], since new objects in the scene will change brightness and depth; thus, the algorithm will be less prone to false positives. The work in [
10] was subject to the TOF (Time-Of-Flight) camera’s limitations, since the resolution of the camera used in the experiments was 64 × 64 pixels for both intensity and depth images, which did not allow a distance of more than 1.5/2 m between the camera and the wall under test. However, the experimental results of [
11] allowed us to verify the robustness of the method used in different situations, such as crowded scenes, abandoned objects, static intrusions, and illumination changes.
Nahar et al. [
13] proposed a system based on an autonomous Unmanned Aerial Vehicle (UAV) that can detect graffitied walls and cover them with spray paint if necessary. This was designed to clean hard-to-reach public places such as bridges and highways. The video stream of the UAV is sent to a machine-learning server containing a trained model developed from scratch for detecting graffiti images. This neural network model was built using the machine learning library TensorFlow. However, the article does not mention any results obtained, thus making it impossible to compare with other algorithms regarding their performance.
Similarly, Wang et al. [
9] also proposed a semi-autonomous UAV graffiti detection and removal system, but this time based on the SSD MobileNetV2 transfer learning model pre-trained on the COCO dataset from the tensor flow API (Application Programming Interface). However, in this case, two different models were developed, one for graffiti detection on traffic signs and another for graffiti detection on walls. The model for detecting graffiti on walls also recognizes some graffiti styles. The graffiti are classified into Throw up Graffiti, Wildstyle Graffiti, Cartoon Graffiti, Throw up Alphabet, Wildstyle Alphabet, or Cartoon Eye. The tests performed on both models showed an accuracy of up to 99%. However, the authors also state that the system needs to be further tested in more complex environments.
In [
14], the subject is also the detection of illegal graffiti. The paper proposes the creation of a graffiti map based on the amount of graffiti. Its purpose is to tackle vandalism in places with high concentrations of graffiti and discourage future acts. The model was trained using 632 images acquired in São Paulo City, using a ResNet101 backbone model pre-trained on the Coco dataset. The results from this transfer learning method showed an average precision of about 0.57.
Studies focused on detecting other types of graffiti, such as murals or street art, can provide information and methods that help in the creation of maps with the exact locations of the artworks for their divulgation to the interested community, as in the study conducted by Tessio Novack et al. [
7]. This study uses the VGG16 convolutional neural network (CNN) model pre-trained on the ImageNet dataset, with three fully connected layers and a dropout rate of 0.5. Using the binary cross-entropy loss function and the AdaGrad optimization algorithm, an overall accuracy of 93% was achieved. This algorithm allowed the production of a density map containing the graffiti artworks found in the central part of London.
Munsberg et al. [
15] try to investigate how a CNN model performs in the detection of art graffiti. The main contribution of this paper is to demonstrate that, when using transfer learning, instead of removing the last fully connected layer for a layer containing the desired number of final classes in the neural networks, it is more efficient to maintain it. Munsberg et al. argue that removing the last layer may result in a loss of relevant information for the new task, and, with this approach, they were able to achieve the results faster, with a smaller number of epochs.
Besides the previously mentioned works, there was one article whose goal was the detection of any type of graffiti, whether it was considered art or not, such as the approach applied to Medellín City [
3] that used the PyTorch library to implement an R-CNN, the ResNet50 classifier, already pre-trained on the ImageNet dataset. This research allowed the construction of a visualization tool through heat maps that, besides helping define measures to improve sectorial policies, also allow better control and definition of efforts to preserve the areas rich in art graffiti and restore those with a negative aspect. As future work, the paper mentions a possible improvement to a more in-depth graffiti classification based on their form or purpose.
In addition to graffiti detection, a new topic is being increasingly discussed with graffiti data: gang identification by segmenting the graffiti based on their similarities. The analysis and interpretation of gang graffiti can help law enforcement better understand their activities and where they need to operate to respond and have an idea of the gang’s intentions [
16,
17,
18,
19].
The system implemented by Wei Tong et al. [
17] assumes that two graffiti are more likely to be created by the same graffiti artist if they have high similarities in visual and contextual aspects. This system starts by extracting visual features (such as letters, numbers, and symbols) through OCR (Optical Character Recognition) and selecting the most similar images. Then, the similarities between the images are calculated, and, this way, it is possible to identify the most similar photos, which will correspond to those with a higher probability of having been drawn by the same individuals. The results obtained achieved an accuracy of about 64%.
Graffiti-ID [
20] was a research project conducted at Michigan State University that aimed to return similar graffiti from their database. For this, the Scale Invariant Feature Transform (SIFT) was used to extract the most relevant visual features (which are referred to as critical points). Then, the graffiti association was based on calculating the similarities via Euclidean distances between the critical points of the two images. Local geometric constraints were added to try to reduce false associations.
A CNN model was adopted by He Li et al. [
16] to classify graffiti into different classes based on a set of graffiti components. The model was composed of five convolutional layers followed by three fully connected ones and a final softmax layer that achieved an overall accuracy of 87%.
Parra et al. [
21] proposed a model-based system that, by analyzing graffiti images, can present relevant information about the gangs associated with the graffiti. This system is composed of three methods: color recognition (taking advantage of the capabilities of the modern mobile device’s touch screen and the user’s help to trace the path along the color region), segmentation of the color image based on Gaussian thresholding, and content-based retrieval of the graffiti to detect the graffiti and identify its components as objects and shapes (such as stars, pitchforks, crowns, and arrows). From here, a hierarchical k-means clustering is used to create vocabulary trees. As the authors of the article state, “the main advantage of using a vocabulary tree for image retrieval is that its leaves define the quantization, thus making the comparison dramatically less expensive than previous methods in the literature” [
21], p. 3.
2.3. Research Outcome
The documents selected for this research came from various sources such as articles, newspaper reports, and books, but most came from conference papers. Furthermore, the areas associated with each article present a wide variety of results, with computer science presenting the highest percentage of articles, as shown in
Table 1.
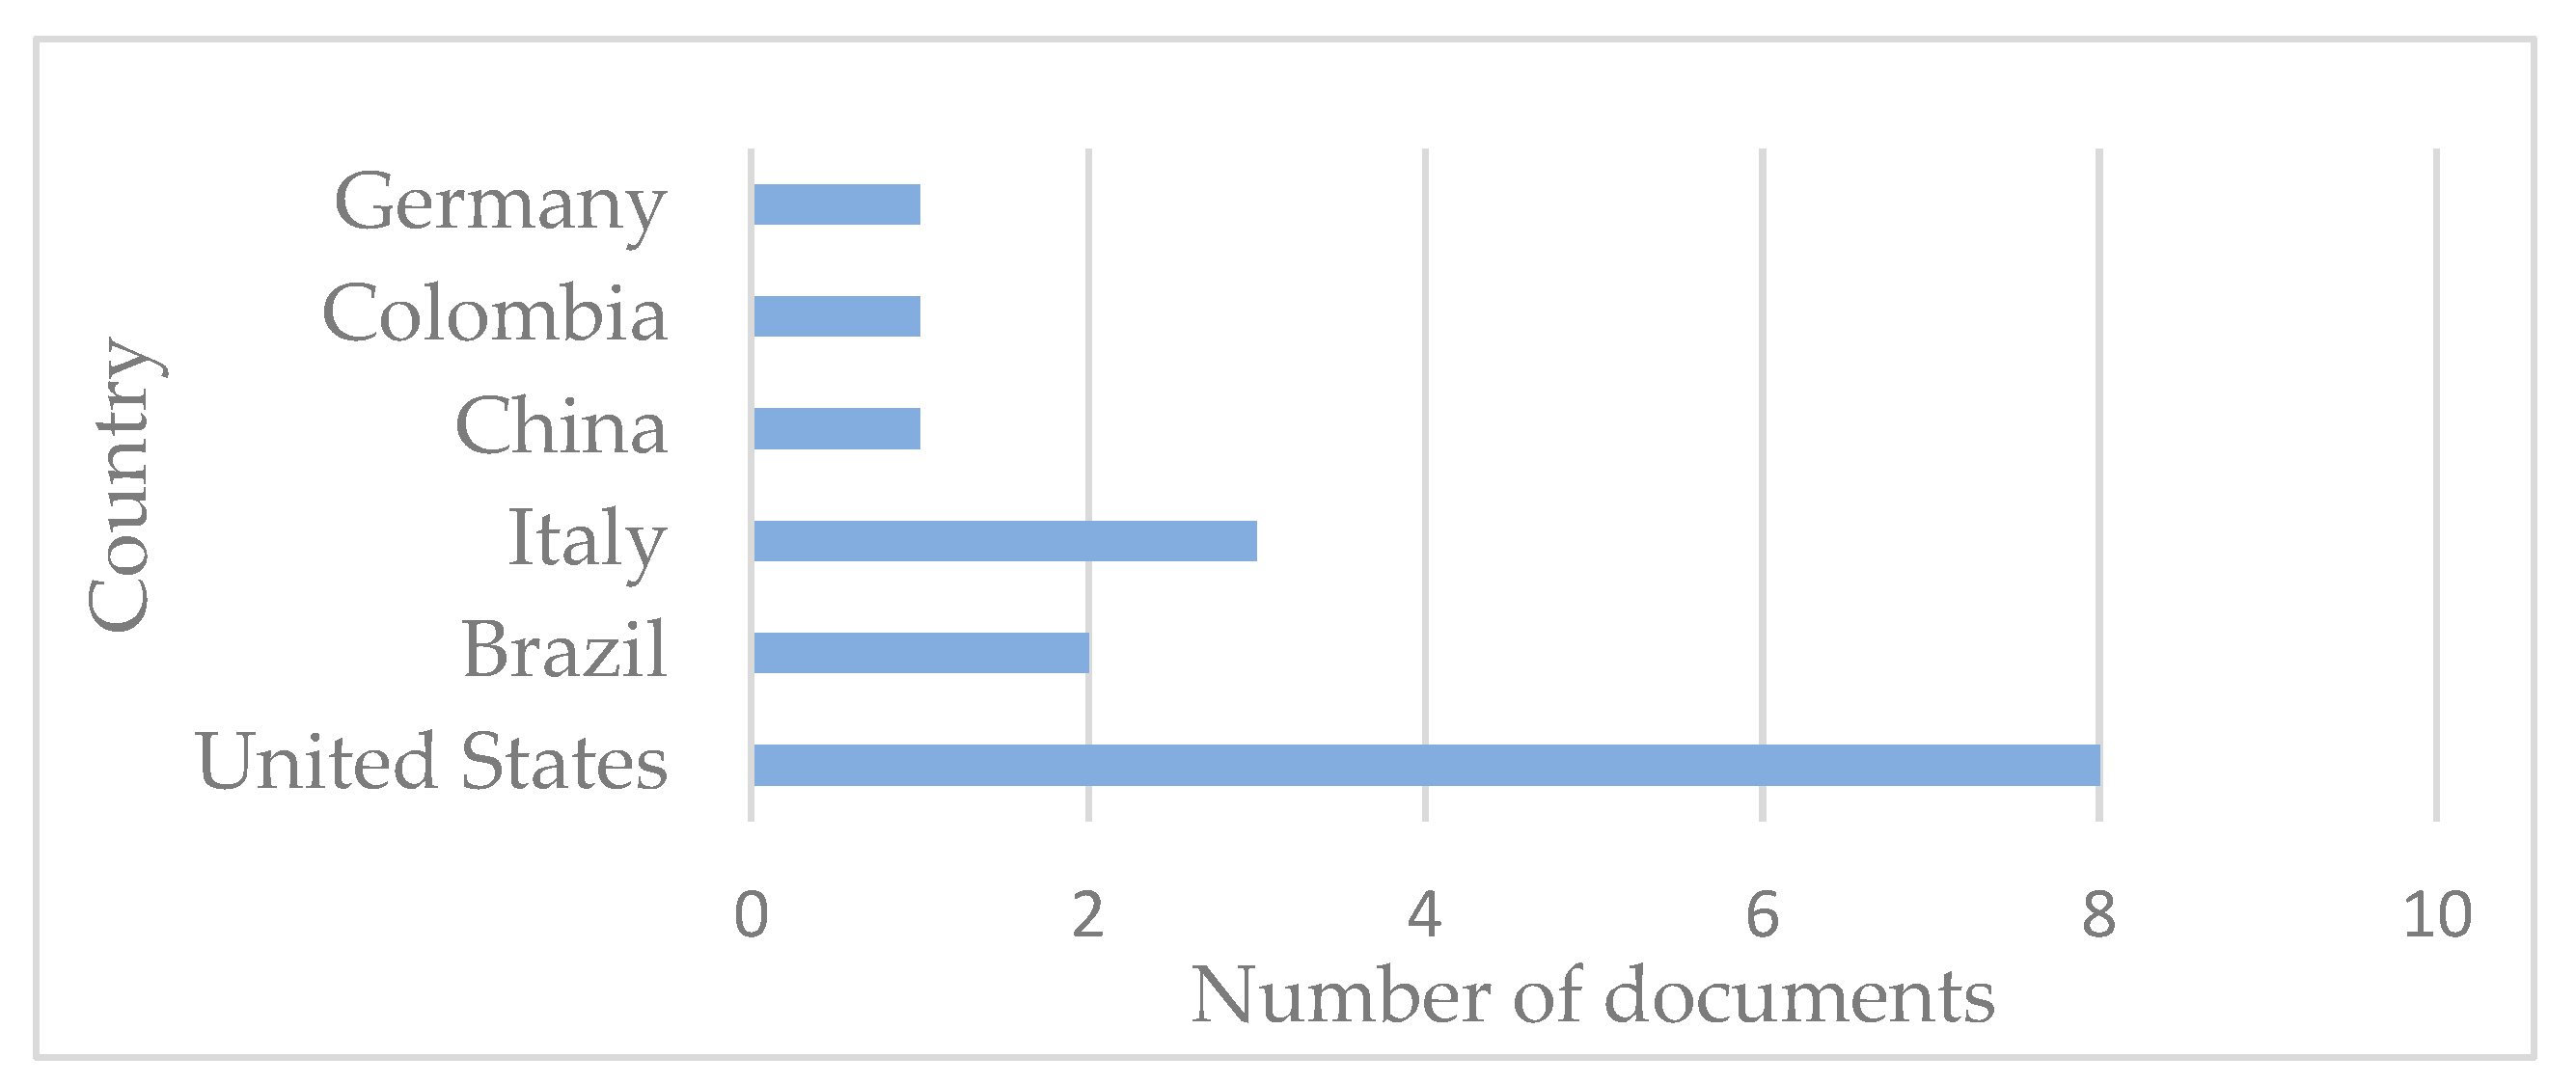
Figure 4 displays a bar plot with the number of articles per country. It is possible to observe that the United States is the country that has contributed the most to the advancement of systems in this field. It is mainly related to the segmentation of graffiti for a better understanding of some gangs’ behaviors, locations, roots, and ambitions, since the number of gang-related crimes has increased in the US [
21]. None of the selected articles were written by Portuguese authors.
Although the detection and classification of graffiti is a topic that can help not only to minimize the damage related to illegal graffiti but also to spread the benefits of urban art, the literature review allowed us to realize that this subject has not yet been sufficiently explored in terms of technology. Of the selected articles, only 15 articles are related to graffiti identification or classification methods.
From the reviewed articles, the most frequent target is the detection of illegal graffiti, as can be observed in
Table 2. This can be justified by the importance of the negative connotation associated with legal graffiti, which brings discontent from the population and associated costs [
8,
9,
10,
11]. As stated by Angiati et al., “for many people, graffiti’s presence suggests the government’s failure to protect citizens and control lawbreakers” [
8], p. 1, and, for this reason, the need to find alternatives to control and minimize the costs related to the issue has become more and more certain.
In addition, the segmentation of graffiti based on their similarities for the purpose of detecting gangs has also shown to be very valuable in this area because it helps law enforcement agencies understand the activities and territories of each gang [
18,
21].
Of the selected articles, only two focus on classifying street art graffiti (only classifying as street art or no graffiti), and only one report [
3] covers the detection of both types of graffiti without distinguishing them.
Table 2 shows the number of articles based on each detection type.
Regarding graffiti detection (illegal or art), the two most studied and developed methods were image processing, where detection was based on videos from surveillance cameras, and neural networks. The CNN (convolutional neural network) architecture appears to be the most thorough in this area, since it has been proven to be the best algorithm for image understanding and to provide very successful results in segmentation, classification, tagging, detection, and retrieval tasks [
22,
23].
A total of 83% of the cases that used neural networks for detection were through transfer learning. Transfer learning is used to enhance the machine learning process of a domain by transferring information from a related problem instead of starting and learning from scratch [
24].
2.4. Research Discussion
As mentioned above, graffiti can be damaging or beneficial to the location in question. In the case of illegal graffiti, it is essential to control and act quickly on it to avoid giving the author notoriety, thus discouraging this act. In addition, the graffiti components and their details can also provide important information about how and where some graffiti artists or gangs operate. In the case of urban art, publicizing it can help attract people to the area, thus improving the local economy.
The 20 articles selected for the elaboration of this literature review allowed us not only to understand the concerns and disagreements within the theme but also to know and comprehend some of the algorithms implemented both for the detection of graffiti and for the segmentation and classification of the creators of the graffiti.
The study made it possible to understand that, although interest and importance of this field have been growing, there are still few implementations for these purposes. Moreover, no artificial intelligence system in Portugal has yet been developed to address this issue. Another verified gap was the lack of algorithms that distinguish between street art and illegal graffiti. There are already some systems for detecting illegal graffiti and others for detecting street art. However, a system that integrates both concepts was not found in the literature. Only one study [
3] addresses this type of classification, and only as future work.
Considering this literature review, we raise two research questions: RQ1—“can a deep learning model successfully discriminate the differences between street art and illegal graffiti?” and RQ2—“how accurate is the automatic identification and location of illegal graffiti on images acquired in the streets of Lisbon under loose controlled conditions?” In addition, we label a graffiti dataset, which we have provided for the scientific community on the request of a graffiti image dataset.
3. Graffiti Identifier
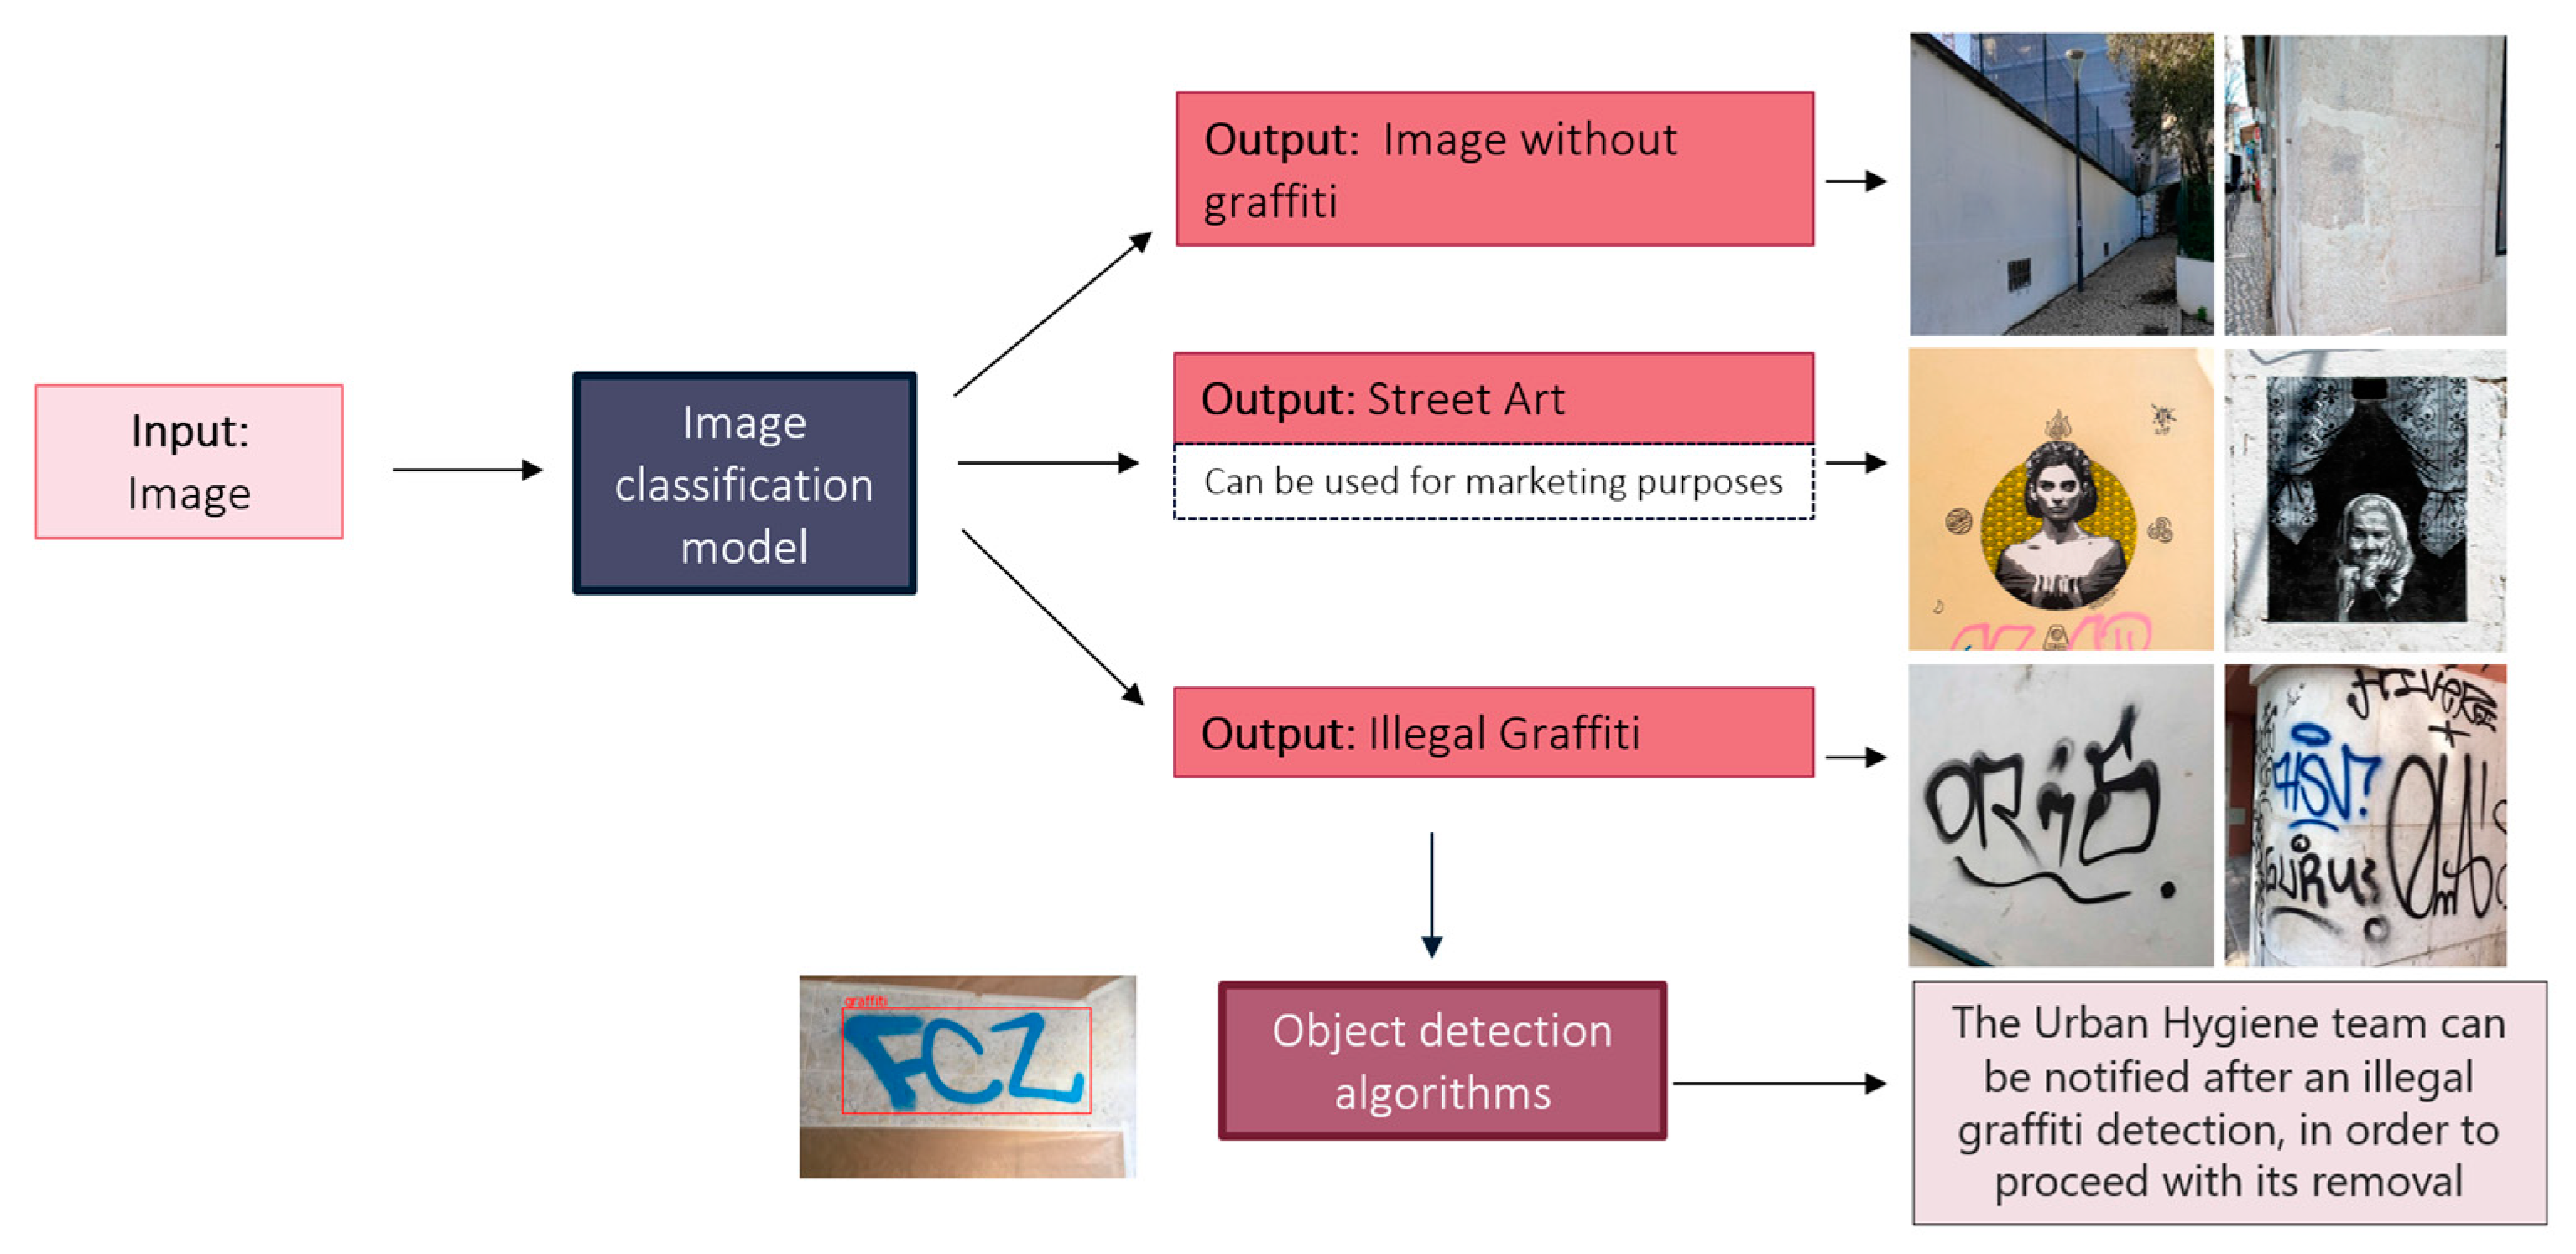
The proposed system, the graffiti identifier, uses two deep learning models to automatically classify the type of graffiti in an image (between street art, illegal graffiti, or no graffiti at all) and to localize it for the illegal graffiti case.
Initially, the images go through an image classification model that tries to identify the type of graffiti in the pictures. Through this classification, the City Council department is allowed to plan how to proceed. If the output class is street art, the image and its geographic location can be used for marketing purposes, since there is also a particular target niche of tourists interested in this type of art. The image and its geographic location can, for instance, be included in a map for its disclosure or be added to the website of the urban art gallery, where several urban arts of the city of Lisbon are featured, thus keeping the site constantly updated.
For the case where the graffiti is classified as illegal, the image will go through a second deep learning model, but, in this case, the objective is the automatic detection of the coordinates of the graffiti in the image. Once an illegal graffiti is detected, an alert can be sent to the corresponding cleaning and sanitation team to proceed with its cleaning.
This pipeline allows us to automate and facilitate a process currently done by members of the Lisbon City Council as soon as they receive images that report the presence of new graffiti in Lisbon.
Two deep learning-based models were developed to respond to the two different objectives. First, a classification model that identifies the type of graffiti (or absence of it) in an image. Secondly, a detector of illegal graffiti that locates it in the image.
Both models were developed using pre-trained machine learning models through transfer learning. Using a pre-trained model for a larger-scale image classification problem, we can take advantage of some learned feature maps that allow us to start at a more advanced point of learning, already with some generally valuable features that will enable a faster and more advanced model creation.
Figure 5 shows a diagram of the developed system.
3.1. Graffiti Classifier
As mentioned, the graffiti classifier aims to classify an image into one of three classes: image with illegal graffiti, image with street art, or image without graffiti.
Since transfer learning involves the use of a pre-trained neural network, several architectures previously trained for image classification problems were tested, adding only four new training layers at the end:
A Flatten layer to transform the multi-dimensional output from the Keras application model into a single-dimension tensor.
A Dense layer. Three different activation functions were tested (‘linear’, ‘relu’, and ‘tanh’). A Dense layer has a deep connection. In other words, all neurons in this layer are connected with all neurons from the previous layer, allowing it to learn information from all combinations of features from the previous layer.
A Dropout layer to prevent overfitting.
A Dense layer with a SoftMax activation function that allows the output to be converted into a probability distribution over the predicted output classes: illegal, street art, or without graffiti.
The weights used in the tested architectures were obtained using the ImageNet dataset, a large dataset organized according to the WordNet hierarchy, comprising over 14 million images categorized into about 22 thousand different object categories. Although the images included here exhibit considerable differences relative to the images used in this research work (regarding graffiti), pre-trained networks with weights optimized for this large dataset can be useful as feature extractors. For example, a network that can already identify walls correctly can be a valuable contribution to the problem at hand, since graffiti is usually present on them.
The pre-trained architectures tested on the scope of this research work were Resnet, EfficientNet, VGG, DenseNet, Xception, and InceptionResNet.
The Resnet architectures use residual blocks (or “skip connections”) to solve a problem often related to deeper networks, as a result of the vanishing gradient, as the number of layers in the neural network increases, the accuracy becomes saturated and starts to degrade after a certain point. These residual blocks behave as shortcut connections that perform identity mapping [
25]. Two residual neural network architectures from this family were tested: ResNet50 and ResNet15V2.
EfficientNet is a convolutional network architecture that uses a new scaling approach that uniformly scales all depth/width/dimensions using a composite coefficient [
26]. The EfficientNetV2L and EfficientNetB7 architectures were used in the tests.
The VGG network family is mainly characterized by its simplicity, which uses 3 × 3 convolutional layers stacked on top of each other [
27]. From this family, VGG19 was the pre-trained neural network evaluated.
DenseNet201 was also compared with the remaining architectures. DenseNet uses dense interlayer connections via Dense Blocks. Each layer receives extra inputs from all previous layers and passes its own features to all following layers.
InceptionResNetV2 is a convolutional neural architecture based on the Inception family of architectures, which incorporates residual connections [
28]. Finally, Xception is also inspired by Inception architectures, but, instead of using full convolutions, it replaces the standard Inception modules with depth-wise separable convolutions [
29].
In summary, eight neural networks were tested and compared:
ResNet50
EfficientNetV2L
EfficientNetB7
VGG19
DenseNet201
Xception
ResNet15V2
InceptionResNetV2
These network architectures were tested because they are all available in Keras applications and because of their good performance on general image classification problems. They usually have a strong capability of generalization for images and problems outside the ImageNet dataset [
30].
Additionally, multiple experiments were performed for each tested model architecture to test different parametrization for the last dense layers placed in the network (in a transfer-learning context).
3.2. Illegal Graffiti Detector
The goal of this model is to correctly identify the coordinates where illegal graffiti is located in a figure. As input, the model receives a picture, and, as output, it returns the coordinates of the bounding boxes identified as graffiti locations.
Similarly to the classifier, different architectures were tested. These three architectures were tested as they were the supported architectures for the python library used, the detecto. This way, its implementation and evaluation were simpler and more straightforward.
The architectures tested were:
Faster R-CNN ResNet50 FPN
Faster R-CNN MobileNetV3 large FPN
Faster R-CNN MobileNetV3 large 320 FPN
All tested architectures correspond to faster R-CNN architectures, short for region-based convolutional neural networks. Fast R-CNN tries to overcome some issues in R-CNN, one of them being, as the name suggests, its speed. These architectures are composed of two networks: a Region Proposal Network (RPN) and a Fast R-CNN detector.
As Ren describes in [
31], a region proposal network “is a fully convolutional neural network that simultaneously predicts object boundaries and objectivity scores at each position”. In other words, the purpose of the RPN is the generation of region proposals with various scales and aspect ratios that will be passed to the Fast R-CNN to guide it into where to look for the detection in the image.
Then, the Faster R-CNN detection network will implement object detection using the proposed regions. The output of the RPN, the feature map, is fed to an RoI Pooling layer that uses the max pooling operation on the RoI (Regions of Interest) to extract a fixed-length feature vector from each region proposal. This vector is then passed through Fully Connected (FC) layers, and its output is split into two branches: (1) the SoftMax layer—to predict the class scores and (2) the FC layer—to predict the bounding boxes and detected objects.
All the tested architectures use Feature Pyramid Networks (FPN), which, in short, are feature extractors that generate multiple layers of feature maps with better quality information instead of just one [
32]. The most important feature of this type of architecture is that, at each level of an image pyramid, it produces a multi-scale feature representation, which introduces more robustness to scale differences in the objects to be located. This feature improves accuracy and speed in most cases.
Two different model architectures were tested: ResNet and MobileNet. Unlike ResNet, MobileNet are neural networks with a smaller size, lower latency, and lower power, hence, they are considered suitable for mobile devices [
33].
The weights used in either architecture come from the use of the COCO dataset. COCO stands for ‘Common Objects in Context’ and is mainly used for object detection and segmentation due to its large-scale labeled dataset.
3.3. Data Description
This section describes the three sets of images used for training, evaluating, and testing the models: Images with illegal graffiti (mainly tags), pictures with street art graffiti, and images without graffiti. The selection of images in each class was established based on the images provided by the members of the Lisbon camera.
The first set of images (examples in
Figure 6), with illegal graffiti, were collected by various means and sources, such as members of the City Council’s urban hygiene and inspection teams or images submitted by Lisbon residents through the “Na minha rua” application. This set of images was used for both purposes: illegal graffiti location and classification of graffiti into illegal or street art.
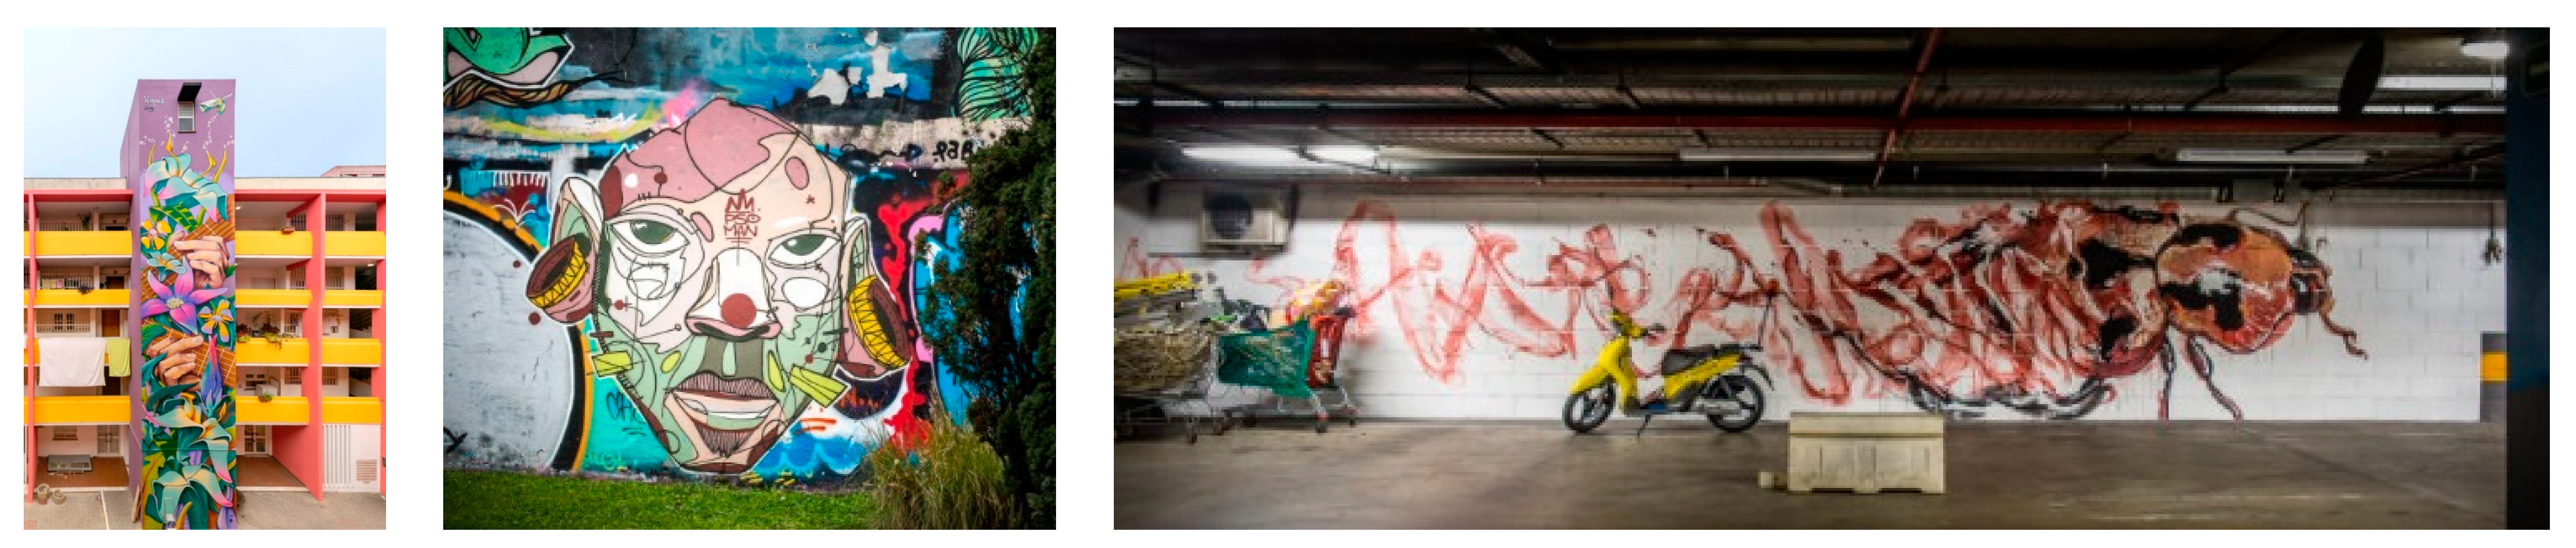
The second set of examples, depicted in
Figure 7, contains street art graffiti images extracted from the urban art gallery website from the Lisbon City Council. This set was used for the classification model.
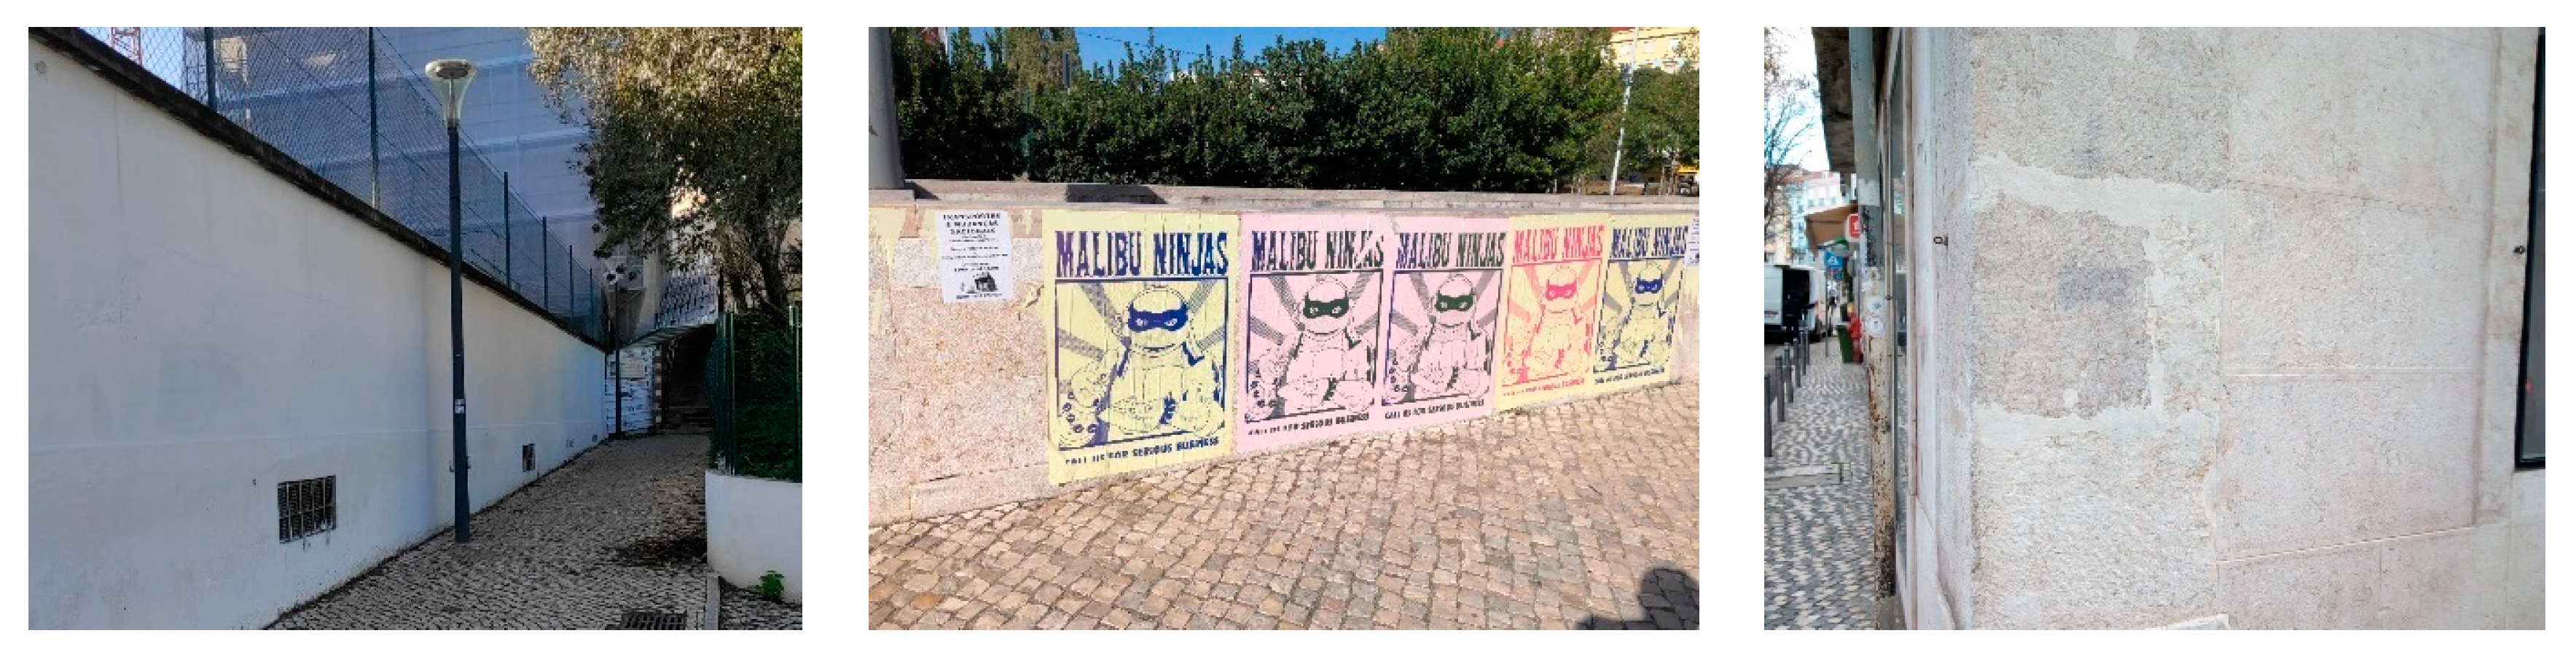
Lastly, the set of images without graffiti (examples in
Figure 8) were obtained from two sources: some of them were downloaded from the internet, and others were provided by the Lisbon City Council and correspond to images captured after the removal of some graffiti from walls and streets in Lisbon.
3.4. Data Preparation
Initially, due to the great diversity of types and formats of images shared by the Lisbon City Council, a great deal of work was required in filtering and processing the images to obtain a set of images suitable for the training of the initial graffiti detection model. From the initial set, several images were removed for the object detection model image set because they seemed to cause confusion and bias to the model, such as images where the graffiti delimitation was almost impossible, images with low quality, or images with minimal graffiti hardly visible, such as the examples shown in
Figure 9.
To standardize the types of images obtained, all pictures of the set were converted to .png before the labeling process.
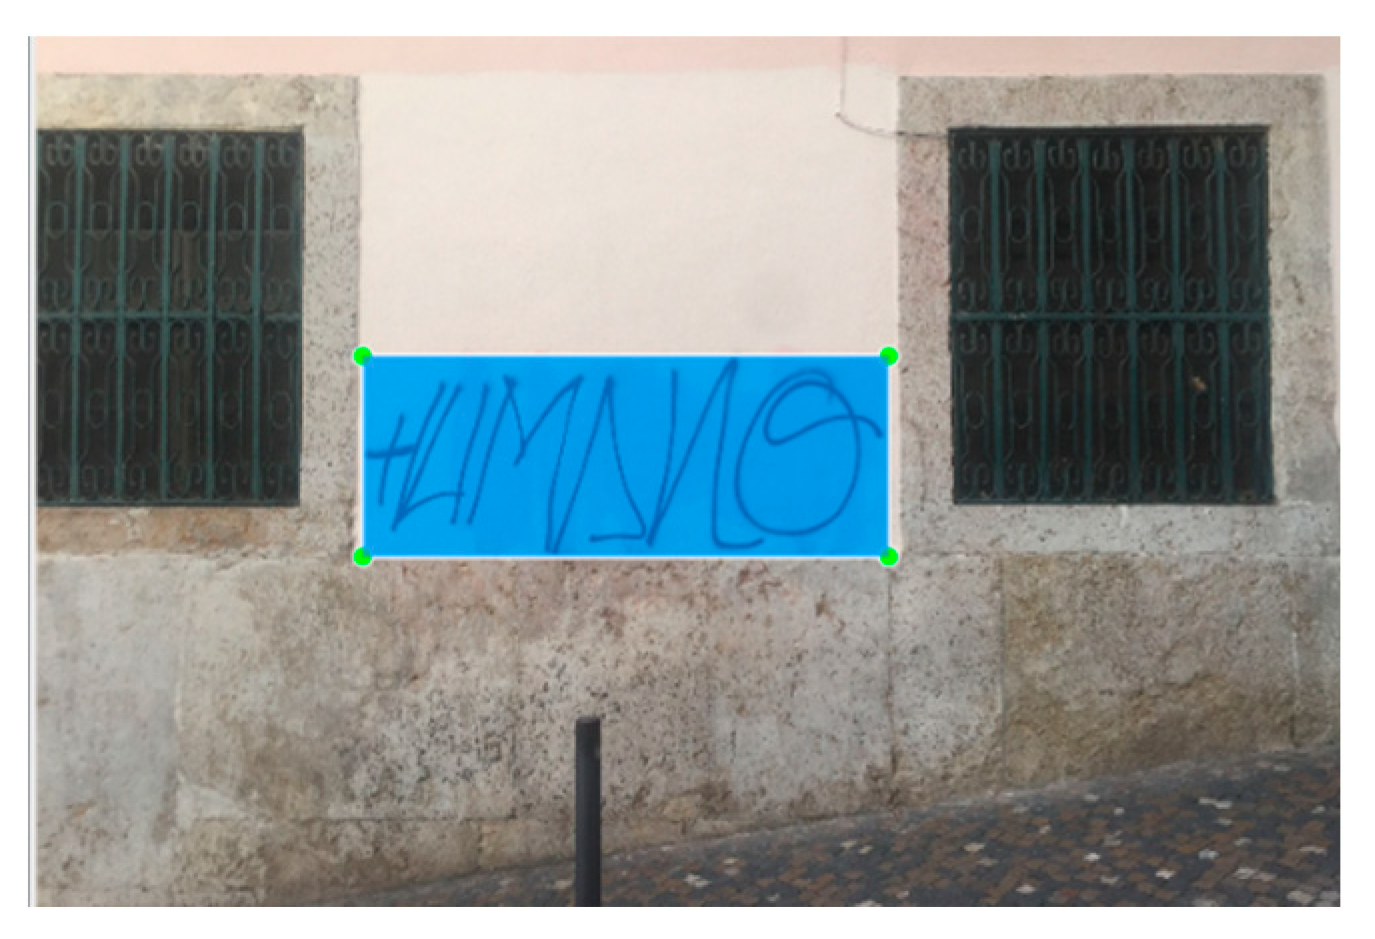
Subsequently, the images containing illegal graffiti were labeled using the LabelImg tool. LabelImg is a graphical image annotation tool that allows the definition of the bounding boxes referring to the graffiti and saves the annotations as XML files.
Figure 10 represents a labeled image after using the labeling tool. The initial dataset was split into three sets: 70% images for the training set, 15% for validation, and 15% for the test set.
3.5. Data Augmentation for Classification
In an effort to increase the accuracy of the graffiti classification task, data augmentation techniques were used. These techniques allow the creation of new images based on existing ones and thus increase the size of the dataset and its diversity, this way, decreasing the chances of overfitting [
34].
Two different types of data augmentation were used: horizontal flips and random rotations of 20 degrees. Since graffiti can have various shapes and orientations, using new images from their rotations will increase diversity and generalize the problem regarding the position of the graffiti.
Figure 11 represents four outputs of the same image when the data augmentation techniques are used repeatedly.
Table 3 represents the number of images used to train, evaluate, and test each model after increasing the number of images in the dataset with the augmented versions.
4. Experimental Setup and Results
As mentioned earlier, after the image pre-processing and selection process, several experiments were conducted. Different models were trained to reach two reliable and practical models. One is to classify the image based on the type of graffiti present, and the other is to detect the coordinates of the graffiti in the image.
Since we have a pre-trained model, it is not necessary to train the entire model. Only the final layers are trained with the images in question so that the model understands the specifics of the problem at hand.
4.1. Classification between Street Art and Illegal Graffiti
To identify the type of graffiti more quickly and therefore define the following steps, an image classification algorithm was developed to classify an image into the following categories: illegal graffiti, street art graffiti, or no graffiti.
First, different pre-trained models available in Keras Applications were tested with similar conditions and parameters to understand which model better suited the problem. For all these first tests, only four new training layers were added to the end of the model in question (explained in
Section 3.2).
The models were trained for 50 epochs, with the Adam optimizer having a learning rate of 0.01. The
ReduceLROnPlateau tool was used to reduce the learning rate when the validation loss stopped improving, i.e., when it reached a plateau. According to
Table 4, we can see that the ResNet50 architecture was the one that presented the best results overall, and that InceptionResNetV2 presented the worst performance, with only 39% accuracy.
It is also worth noting that, for any of the architectures, the results for the F1-score metric always presented worse results in the “without graffiti” class, most likely due to the dataset balance regarding the number of images used to train this class compared to the others, or due to the vast diversity of images that can be labeled as “without graffiti” (images of houses, buildings, roads, benches, walls with posters, streets, etc.). However, the “street art” class showed the best F1-score metric values in all architectures tested except for ResNet15V2.
Table 4 presents the classification metrics obtained for each tested model.
Once the initial best architecture model was found, the Resnet50, a fine-tuning was performed to find the best parameters and optimizers for the classification. The fine-tuning was done using a python library called “Keras Tuner”, which allows the definition of the hyperparameters and their values to be tested. These hyperparameter combinations are used for training and verifying which combination provides the best metrics.
Table 5 presents the different parameters tested. Among the combinations tested in the random search of the Keras tuner, the parametrization that achieved the best results is the one presented in
Table 6.
4.1.1. Results from the Classification Model
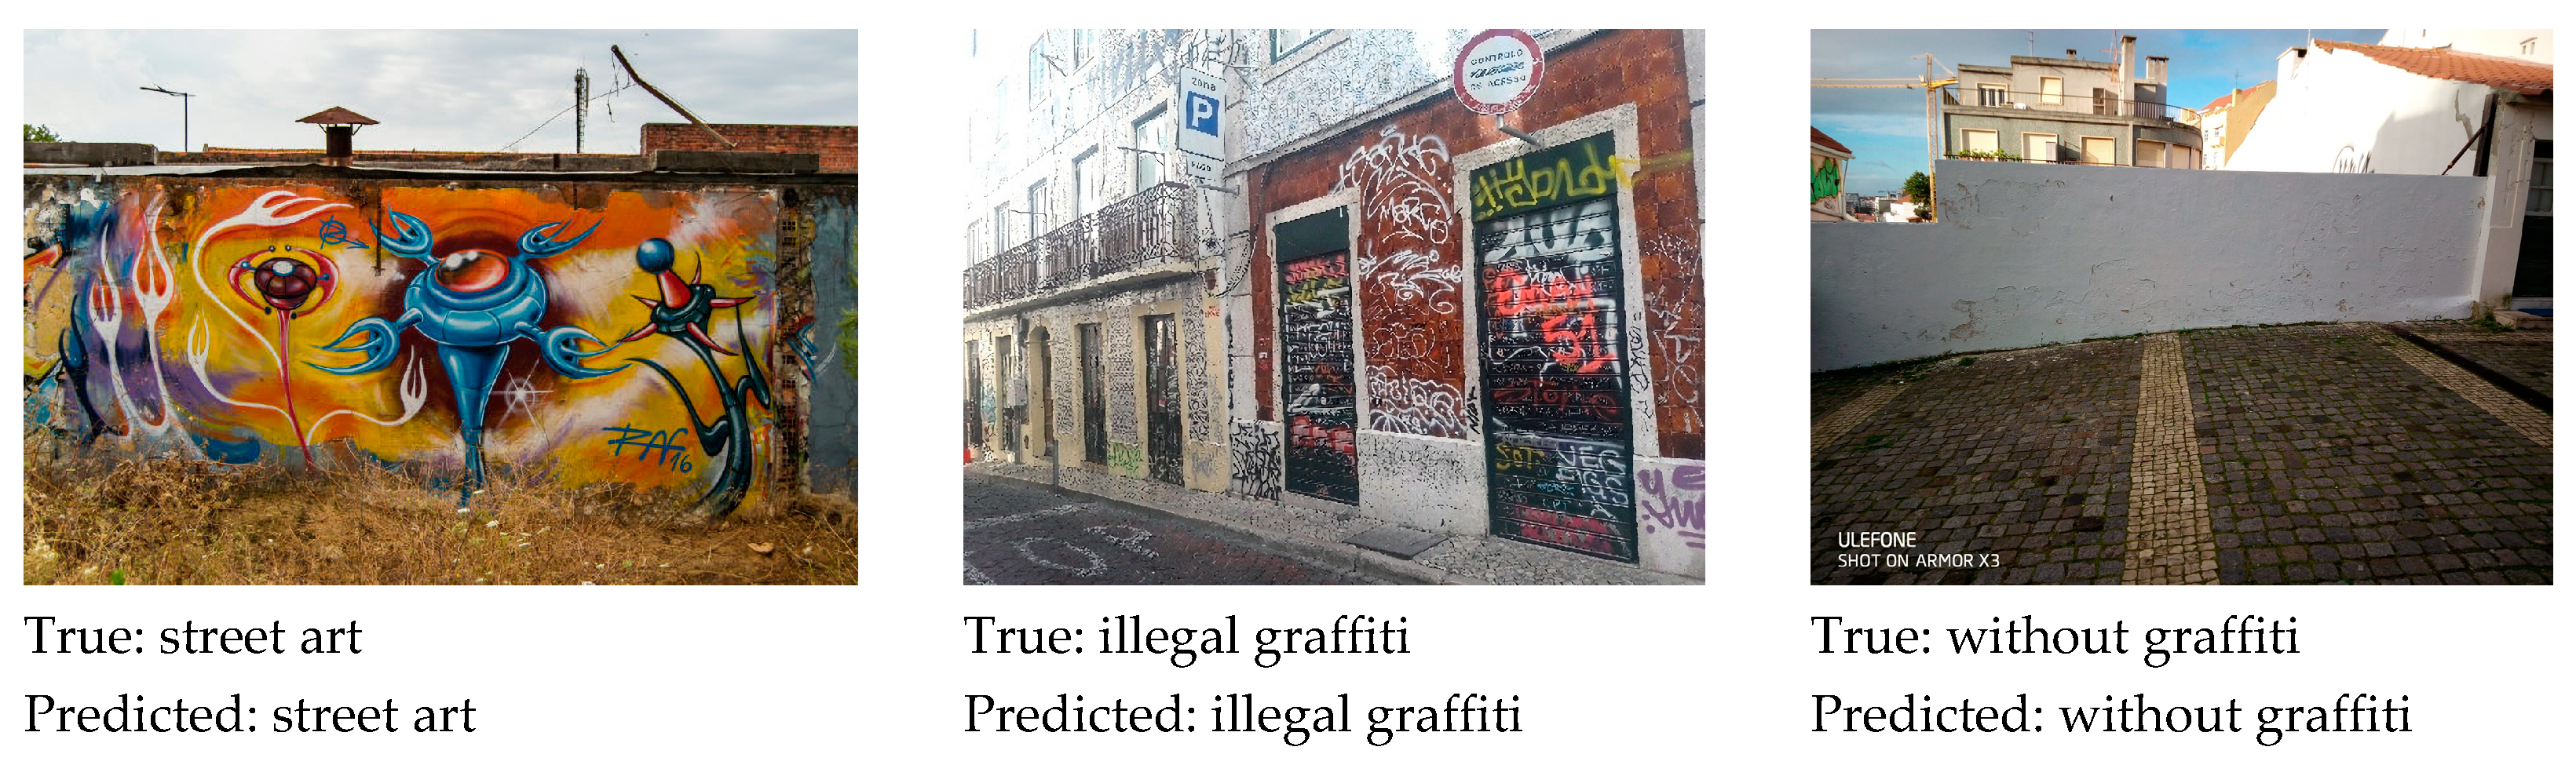
Figure 12 presents some cases correctly classified using the trained model. Two metrics were measured and tracked to evaluate the results: accuracy and categorical cross-entropy. The accuracy calculates how often predictions are equal to the labels. The categorical cross-entropy is one of the most commonly used functions for deep learning multi-class classification problems [
35] because it computes the cross-entropy loss between the labels and predictions, i.e., it measures the difference between the two probability distributions (predicted and actual).
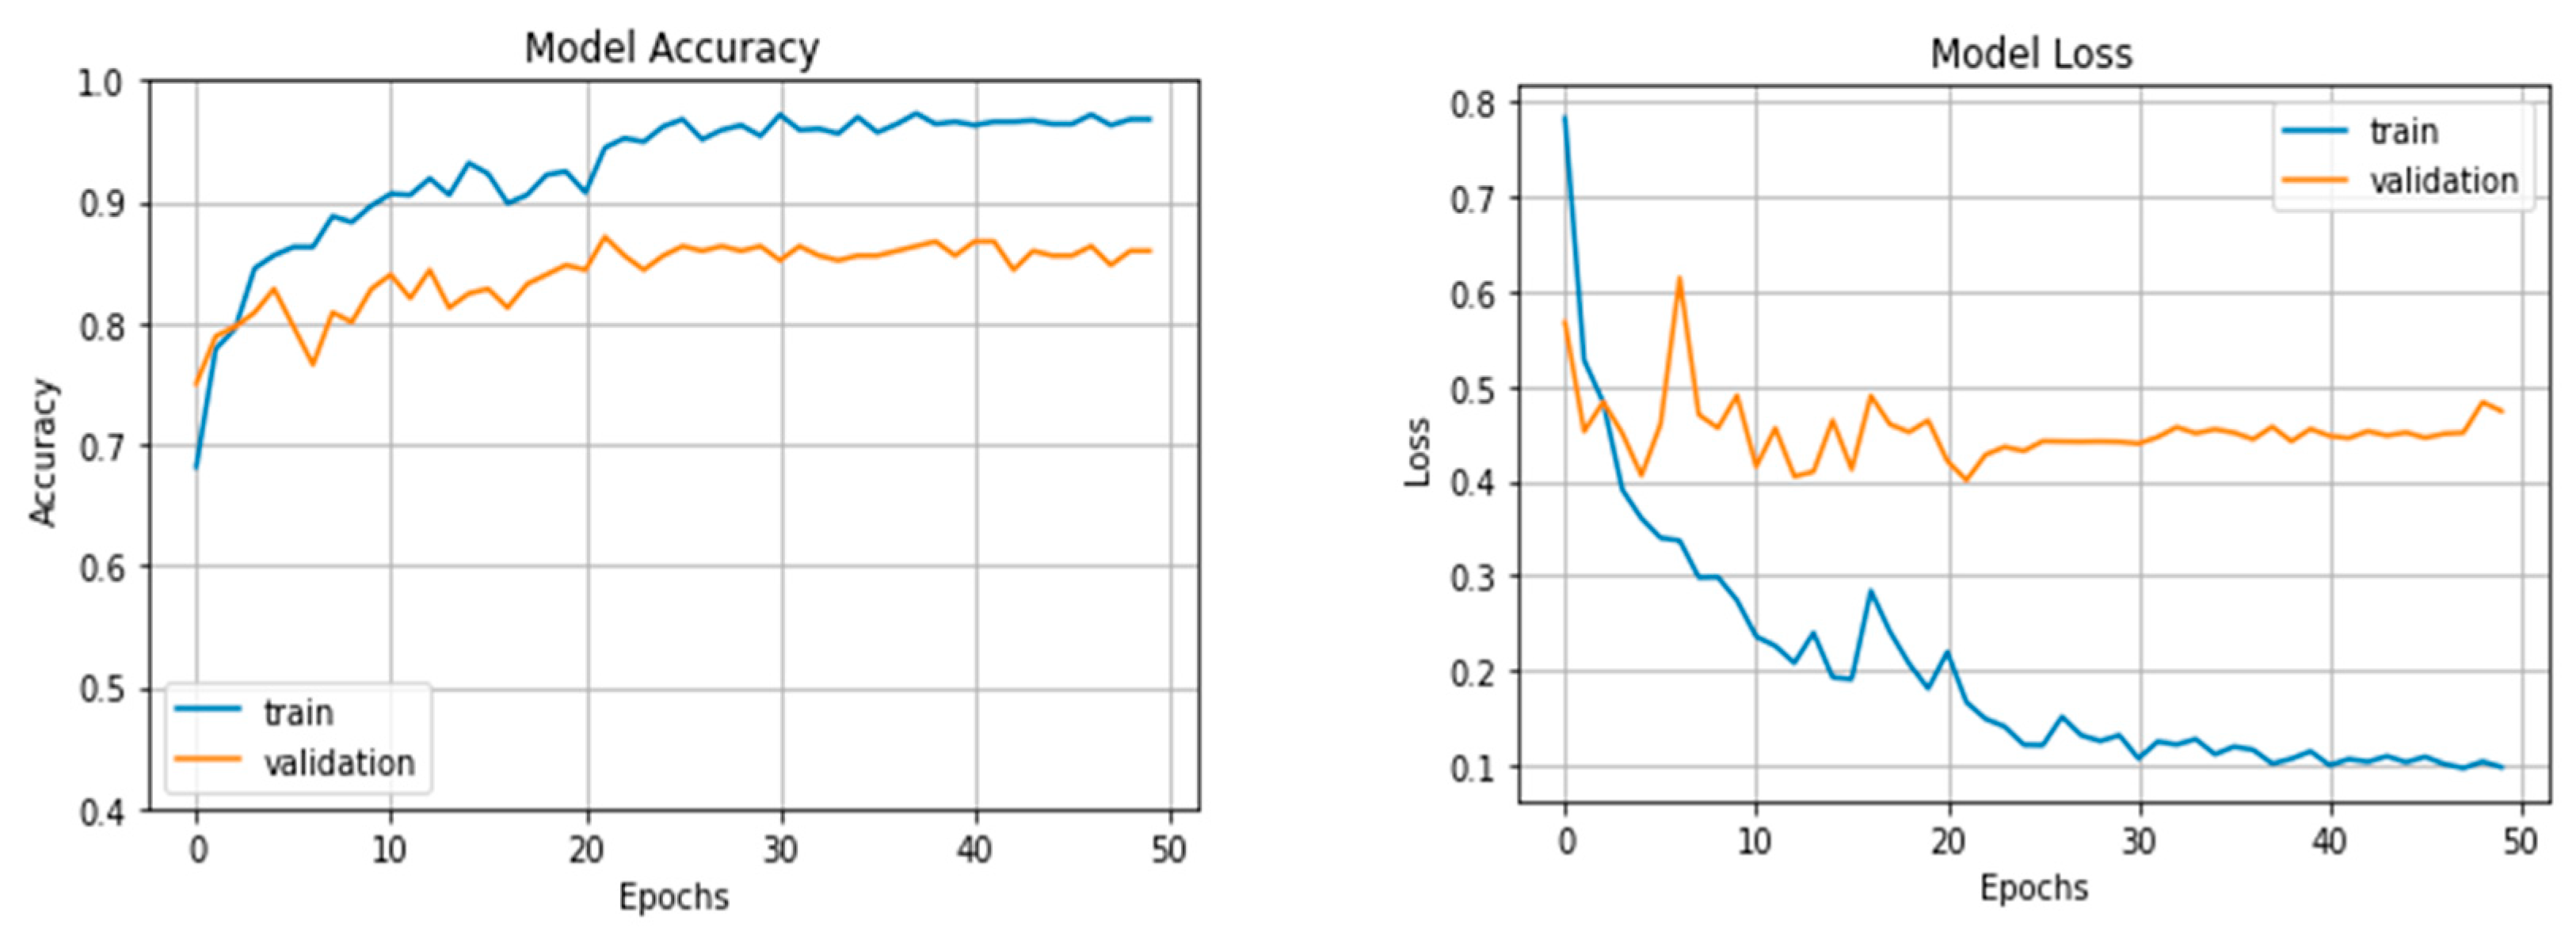
Figure 13 shows the accuracy and categorical cross entropy for the training and validation sets over the fifty epochs used for training. As shown in the figure, the metrics stabilize, and the best values for the validation set (lowest loss and highest accuracy) are observed at epoch 21. The weights corresponding to this epoch were saved and used for testing the model and calculating the following metrics.
After training the model, the model was tested with new images (the test set), and the confusion matrix in
Table 7 was obtained. This matrix allows a deeper analysis of the types of errors made by the classifier and the number of incorrect images misclassified in each class.
Table 8 shows the classification metrics obtained for the trained model. Overall, the model achieved an accuracy of 81.4%. However, since the dataset is imbalanced due to the much lower number of images without graffiti, the balanced accuracy, which corresponds to the average recall obtained in each class, has slightly decreased to 77.2%.
The precision explains how many images predicted with a positive class were correctly classified. This metric indicates that the class ‘illegal graffiti’ is the one that is more times mispredicted, and the class with the lowest false positive rate is ‘street art’.
The recall metric corresponds to the ratio between correct predicted positive observations and the total number of observations. This metric indicates that, from all the images without graffiti, only 56% were correctly classified. The pictures with illegal graffiti have the highest proportion of true positives.
However, the metric that considers false positives and false negatives is the F1-score, the harmonic mean of precision and recall. We can see that the class with the best predictions overall is ‘street art’, and the worst are the images without graffiti, most likely due to the smaller number of pictures used without graffiti in the model training.
4.1.2. Image Classification Limitations
Due to the subjectivity concerning the differences between illegal graffiti and street art, this distinction sometimes becomes a bit blurred and contradictory. Sometimes, the distinction between these two groups of graffiti is already difficult to classify by a human. Usually, it depends on the person and their idea of art, which can vary considerably.
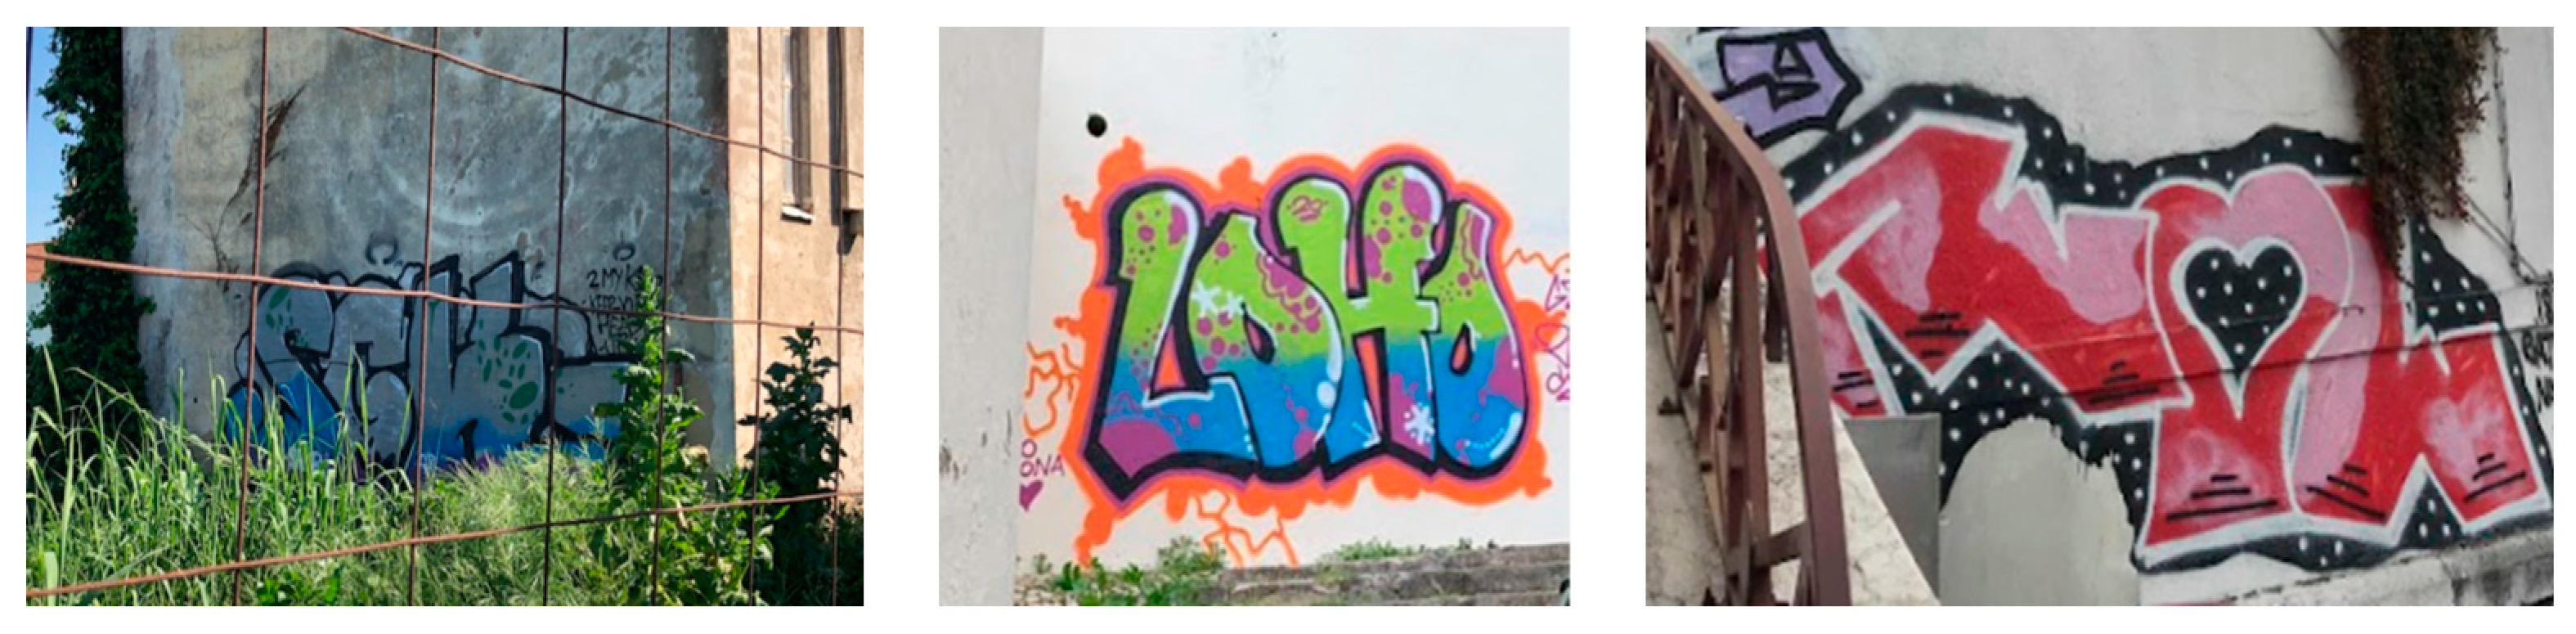
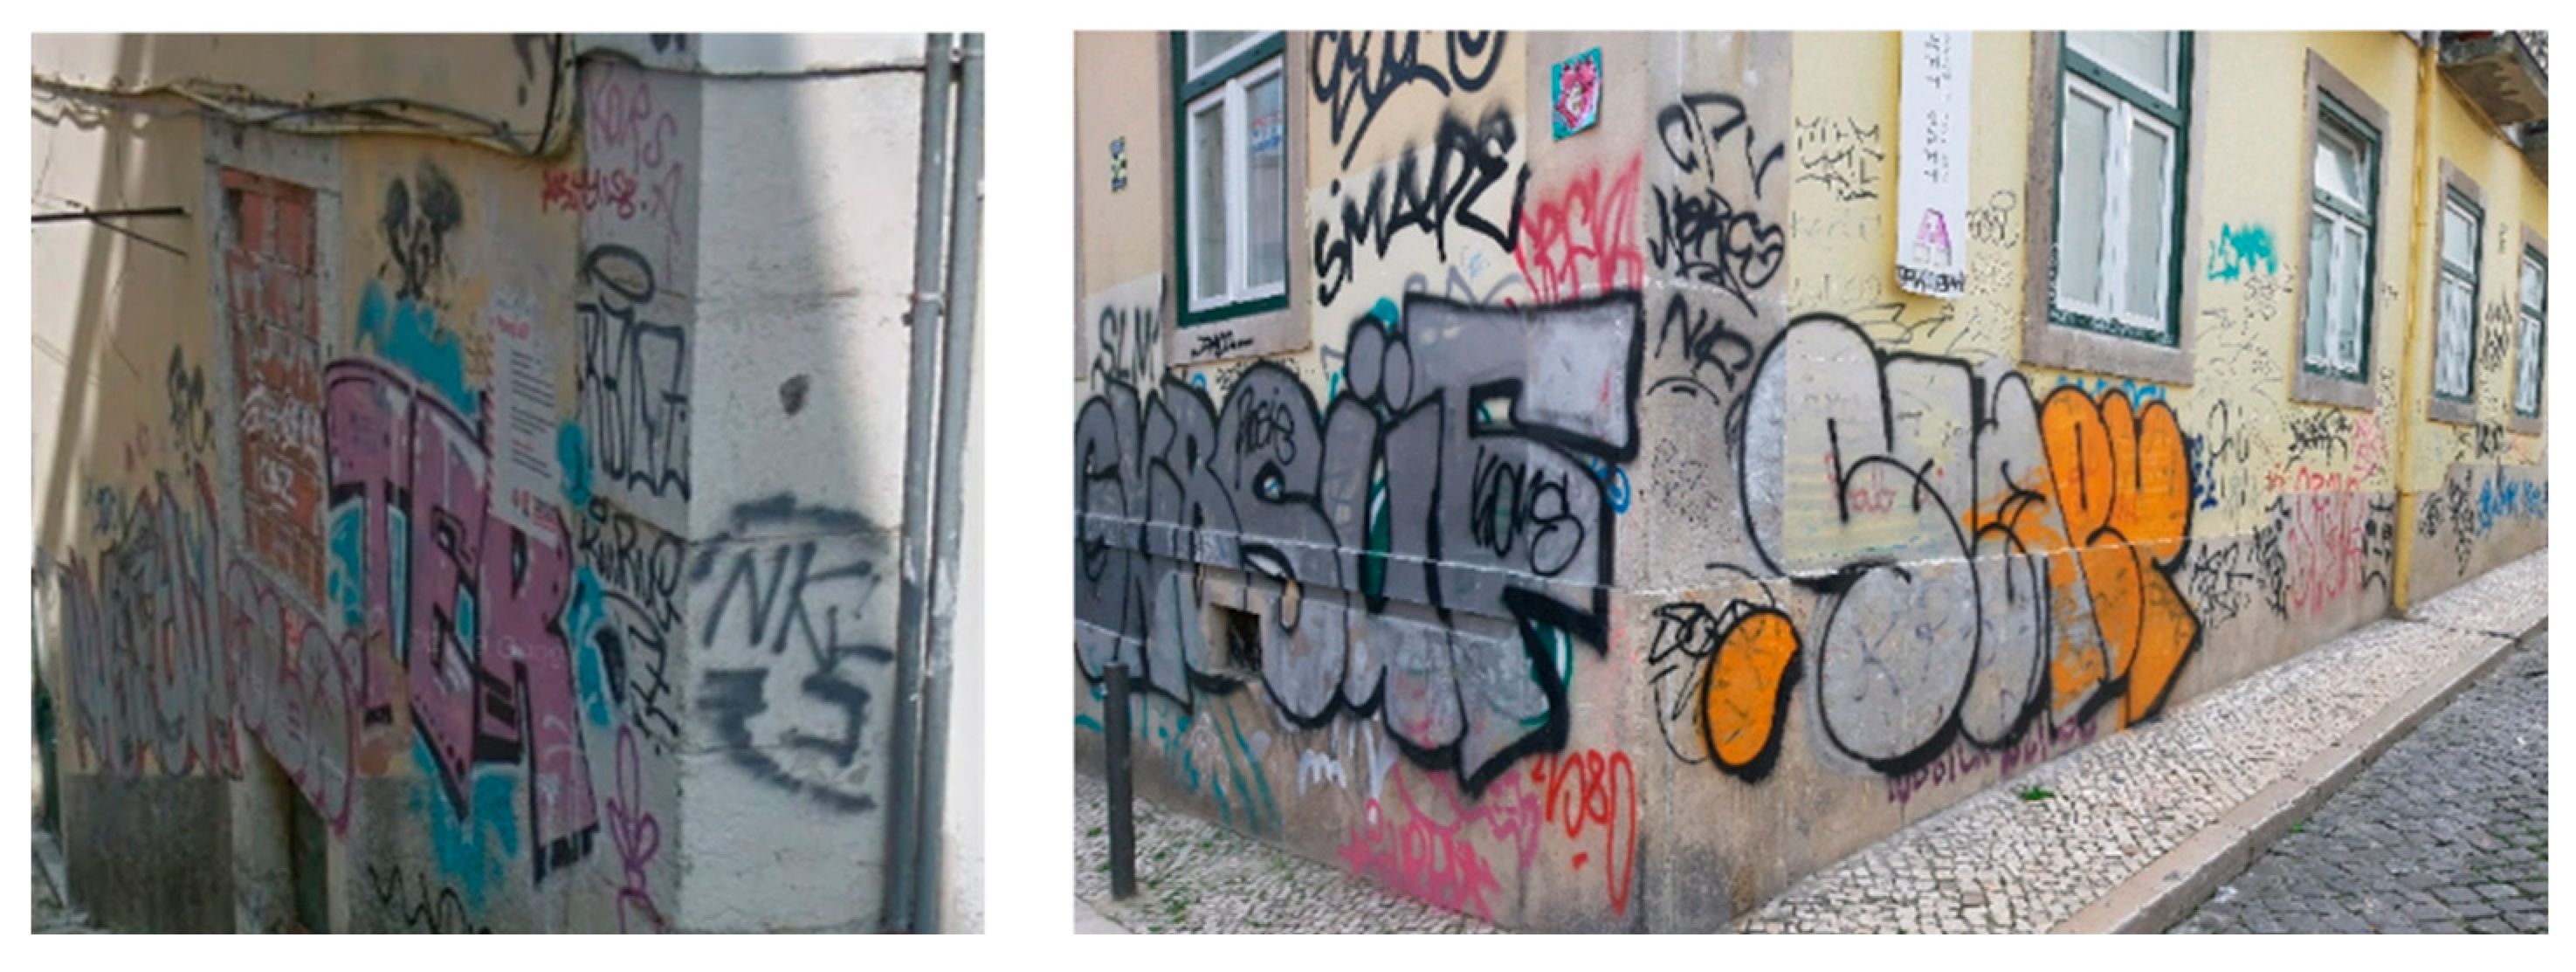
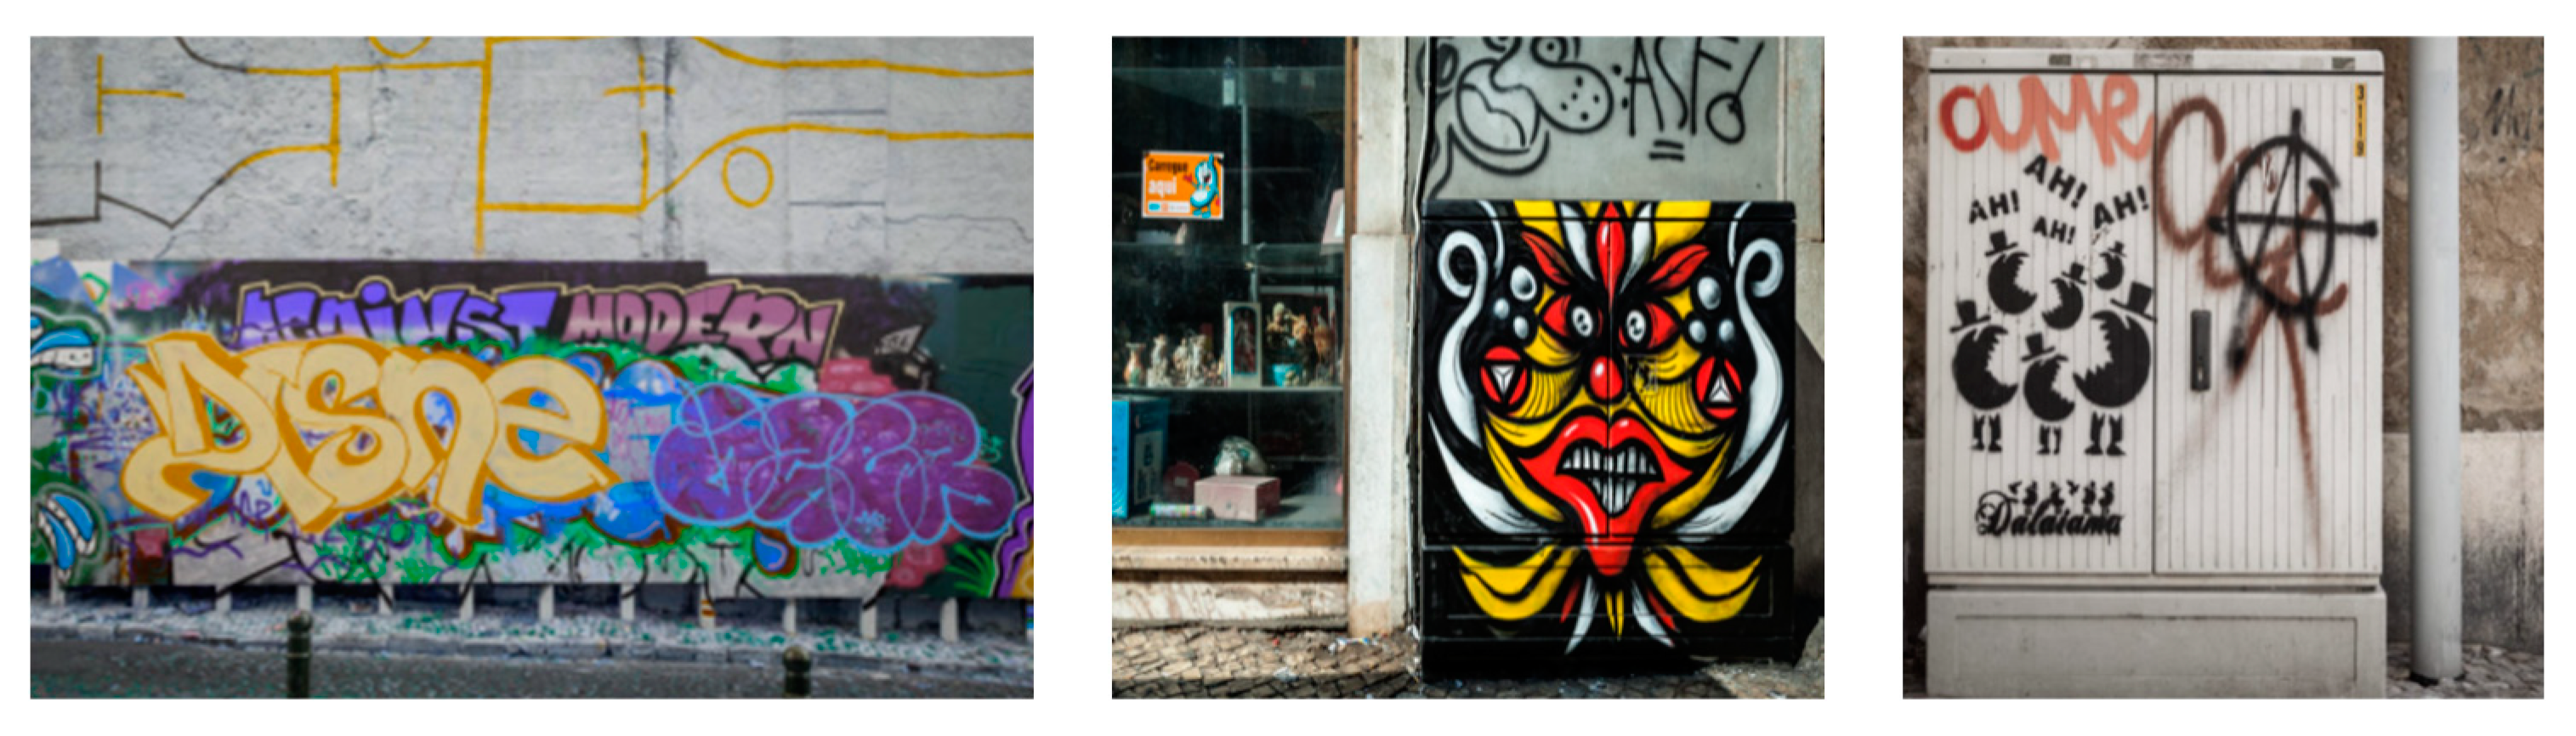
Some images belonging to the set of street art (for example, the ones in
Figure 14), taken from the website of the urban art gallery, may raise some doubt due to their resemblance to some images defined as illegal graffiti, as in the examples displayed in
Figure 15.
Since the model is trained based on the classes of these images, it is expected that there will be some misclassifications in some cases, as in
Figure 16 (left image). Other images, such as those in
Figure 16 (central and right image), contain street art elements and illegal graffiti. However, since they were images taken from the Lisbon urban art gallery, they were classified as street art.
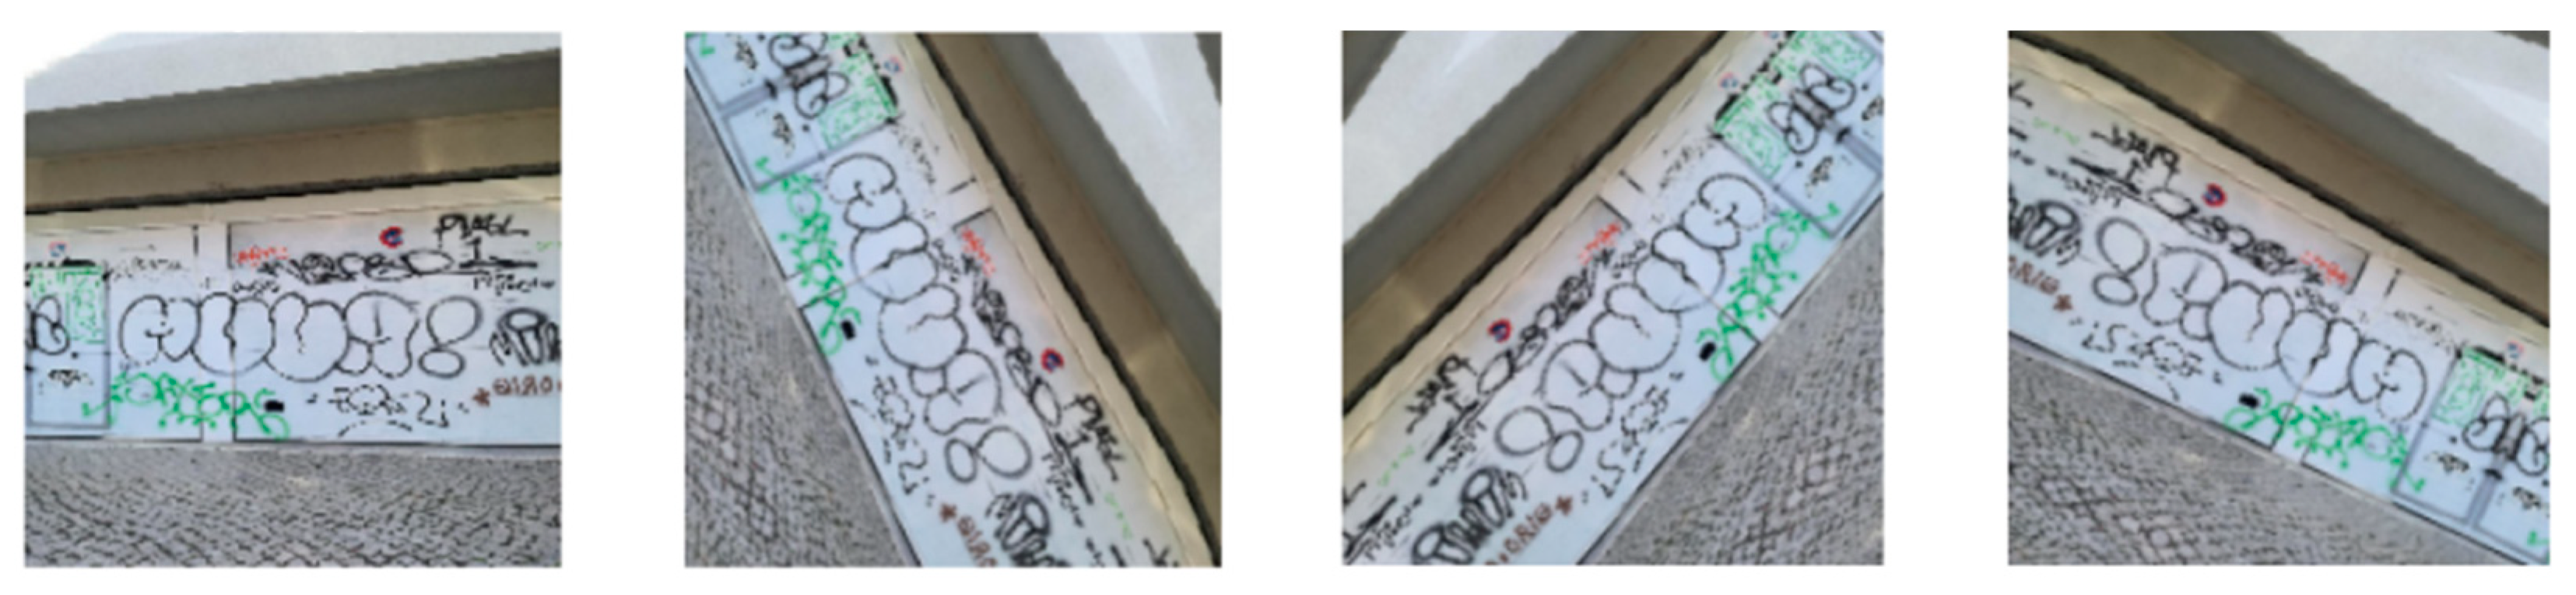
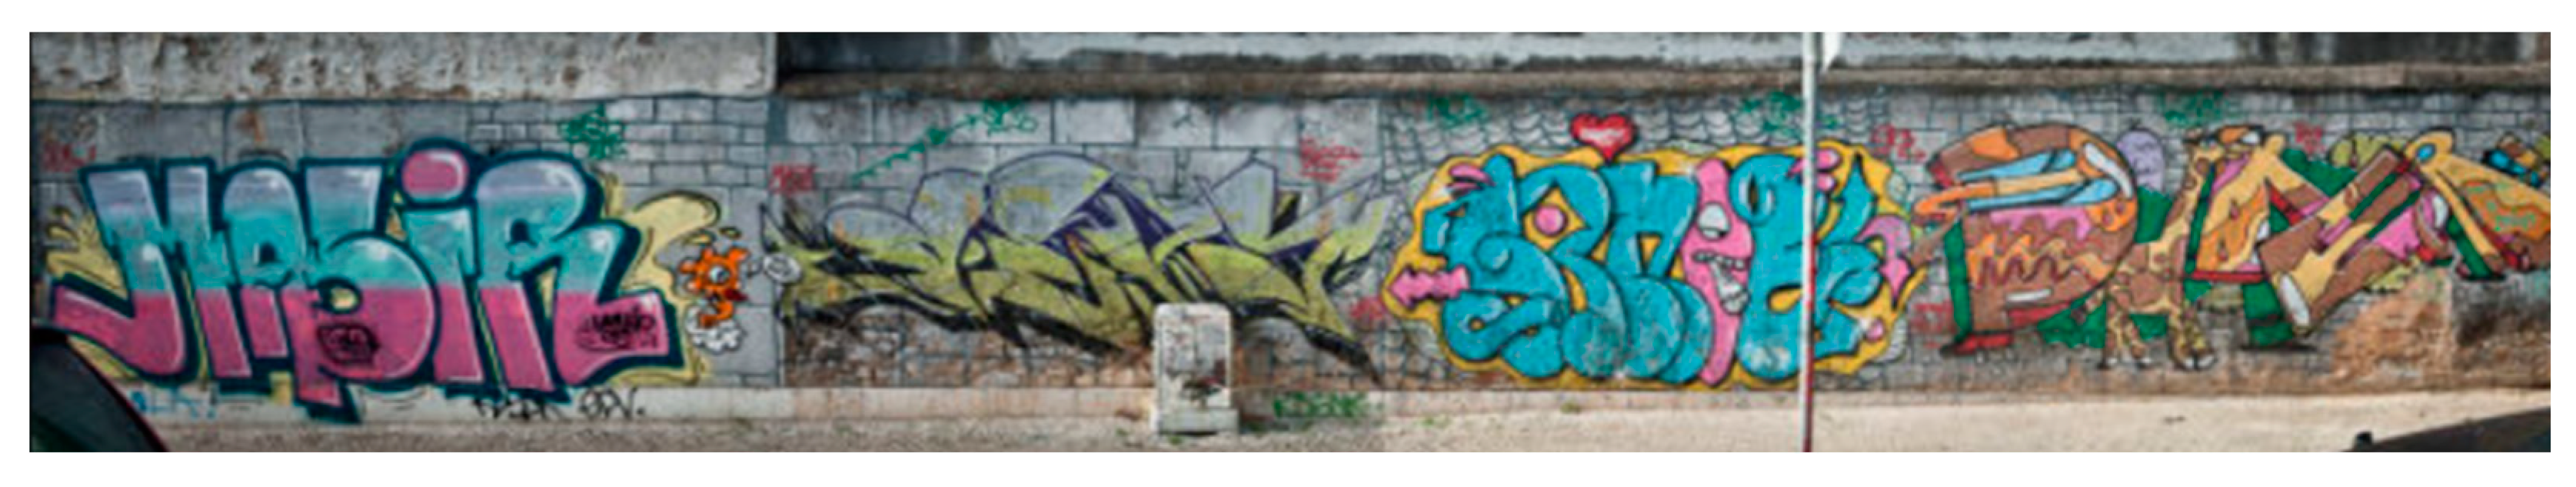
There are also other cases where the image has a significant amplitude and the graffiti is at a considerable distance, and therefore may go unnoticed, as the pictures in
Figure 17.
Furthermore, the relevant difference between the number of images containing graffiti (street art and illegal) and without graffiti is quite significant, as displayed in
Table 3, which may justify the differences between the performances obtained for these classes.
4.2. Illegal Graffiti Detector
In cases where the classifier’s output is ‘illegal graffiti’, the image goes through a new model, but, in this case, to detect the coordinates of the graffiti in the picture. This model gives an idea of the feasibility of a graffiti detector through videos taken around the city.
Thus, the goal is to obtain a model that can identify, as accurately as possible, the coordinates of the graffiti present in an image. For this purpose, a python library called “detecto”, created on top of PyTorch, was used to build a graffiti detection model.
Three different Faster R-CNN model architectures (Faster R-CNN ResNet50 FPN, Faster R-CNN MobileNetV3 FPN, and Faster R-CNN MobileNetV3 large 320 FPN) were tested for different hyperparameters.
Table 9 presents the parameters that retrieved the minimum validation loss.
4.2.1. Bounding Box Predictions Post-Processing
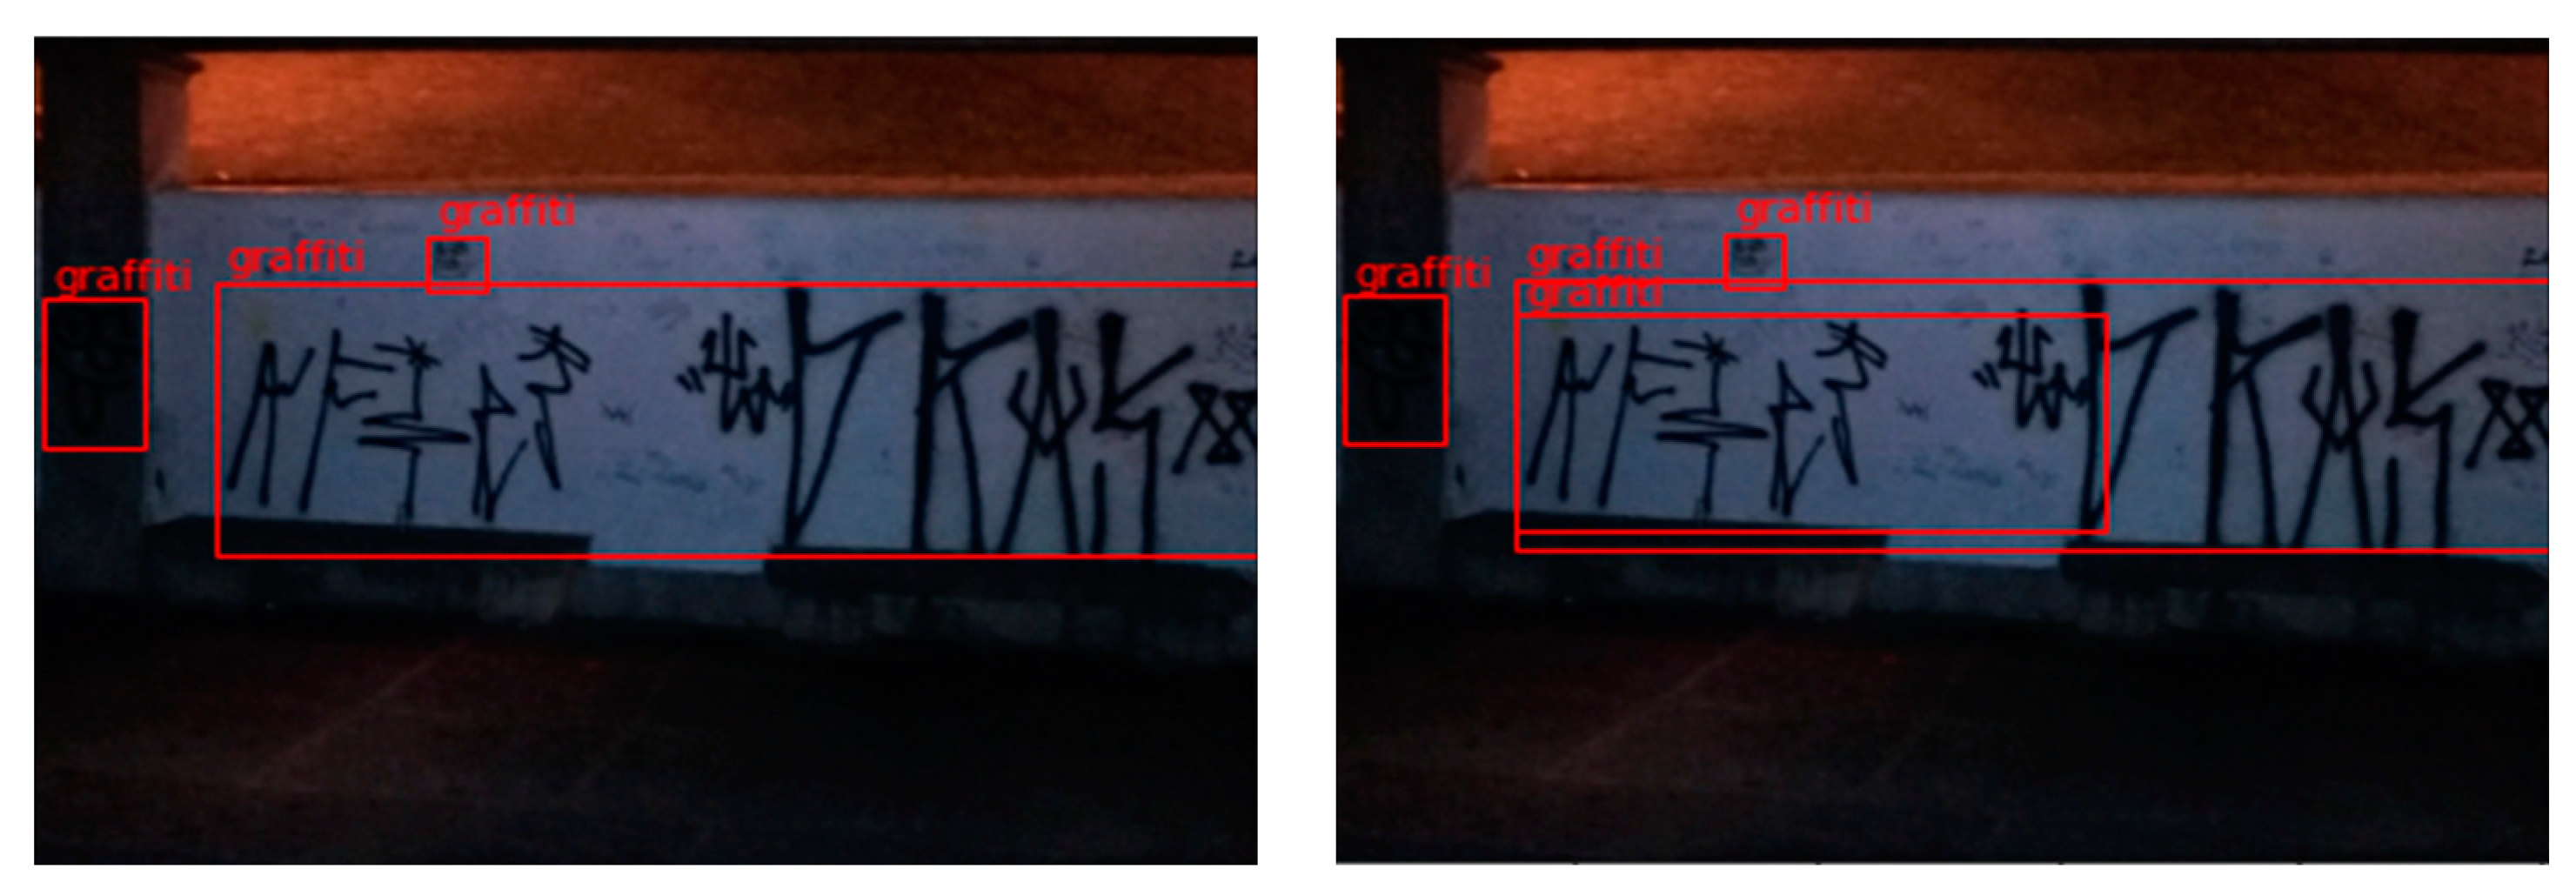
After the identification of the graffiti coordinates in the image, in the cases where more than one bounding box is identified in the same image, it is necessary to check if the bounding boxes need to be grouped.
It was found that the model often separates graffiti into more than one bounding box, thus decreasing the intersection area with the coordinates of the actual bounding boxes, even if the prediction is correct. To tackle this, the bounding boxes are grouped when the intersection area between two bounding boxes is greater than or equal to 0.35 times the area of one of the two bounding boxes in question. For example,
Figure 18 exemplifies a case where it was necessary to combine two bounding boxes because the model detected two different bounding boxes for the same graffiti. As these overlapped, they were merged.
4.2.2. Results from the Graffiti Detection Model
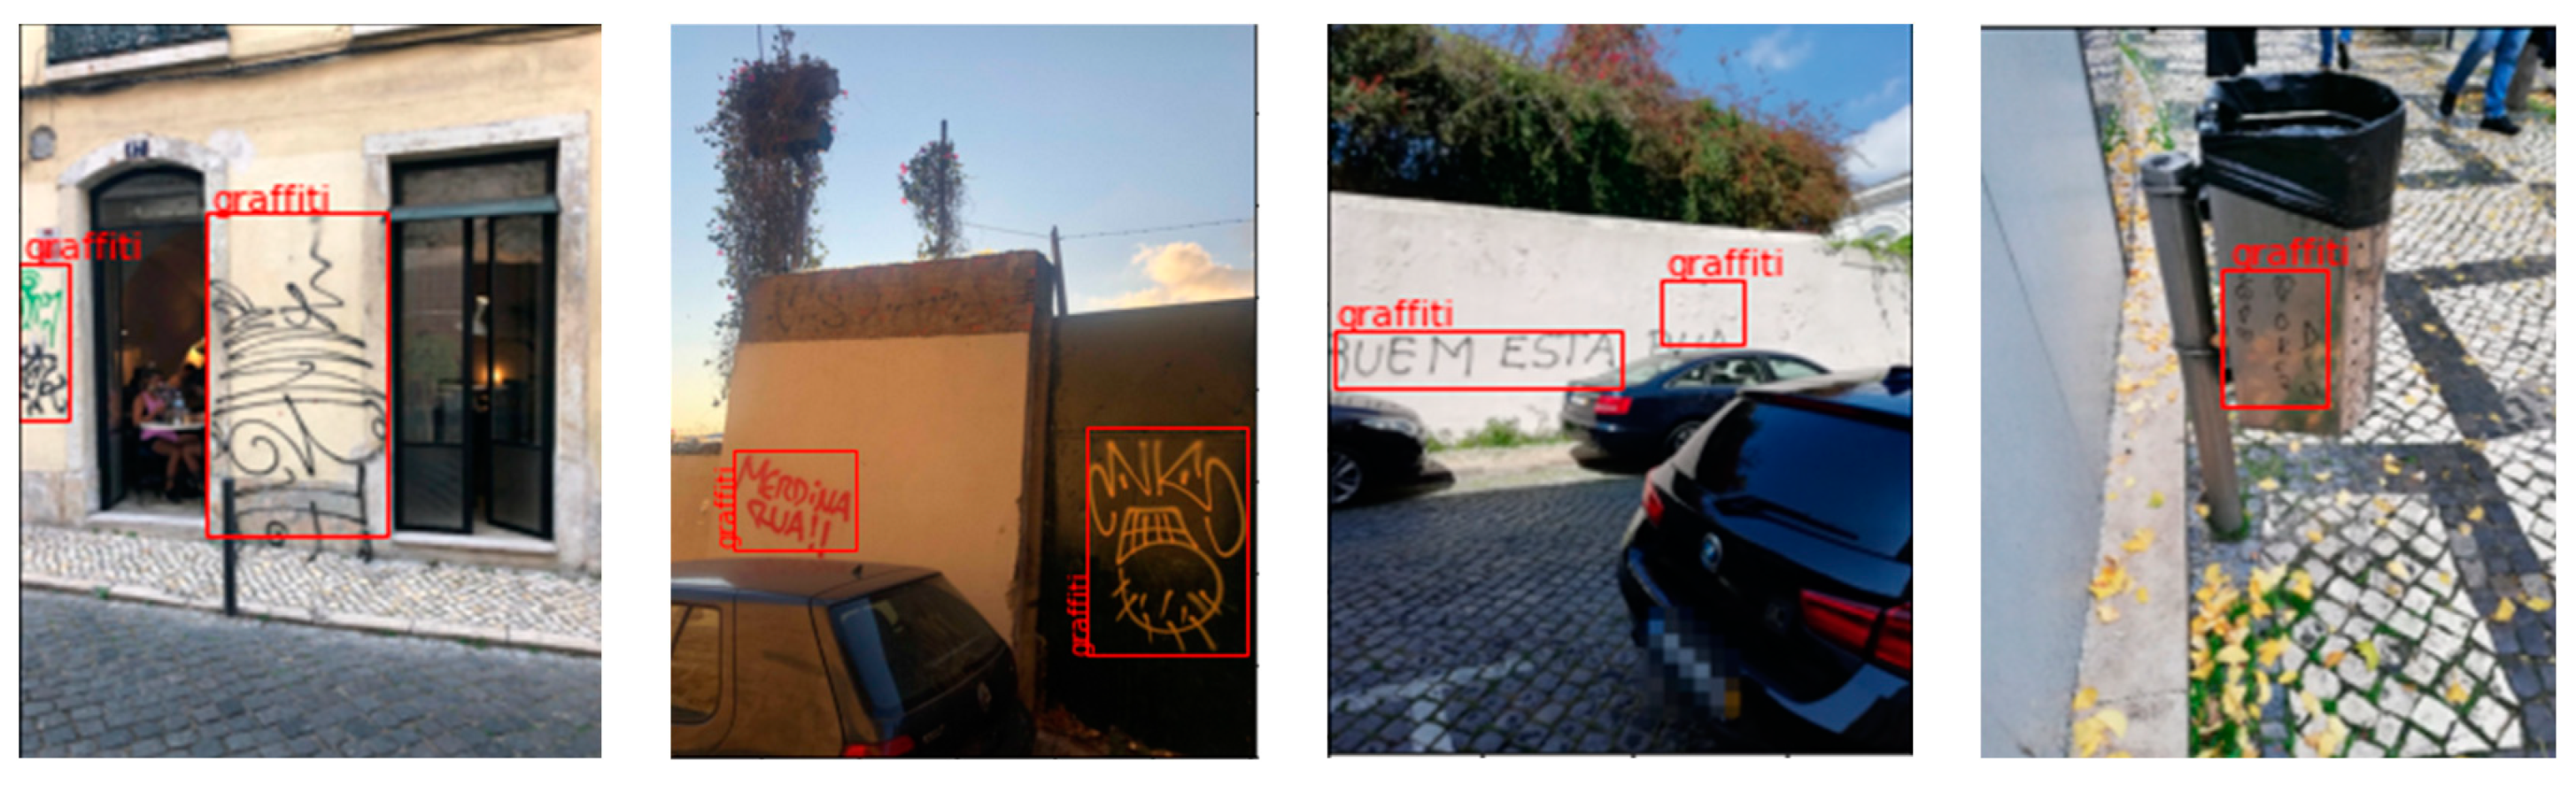
Figure 19 displays some successful graffiti detections through the model.
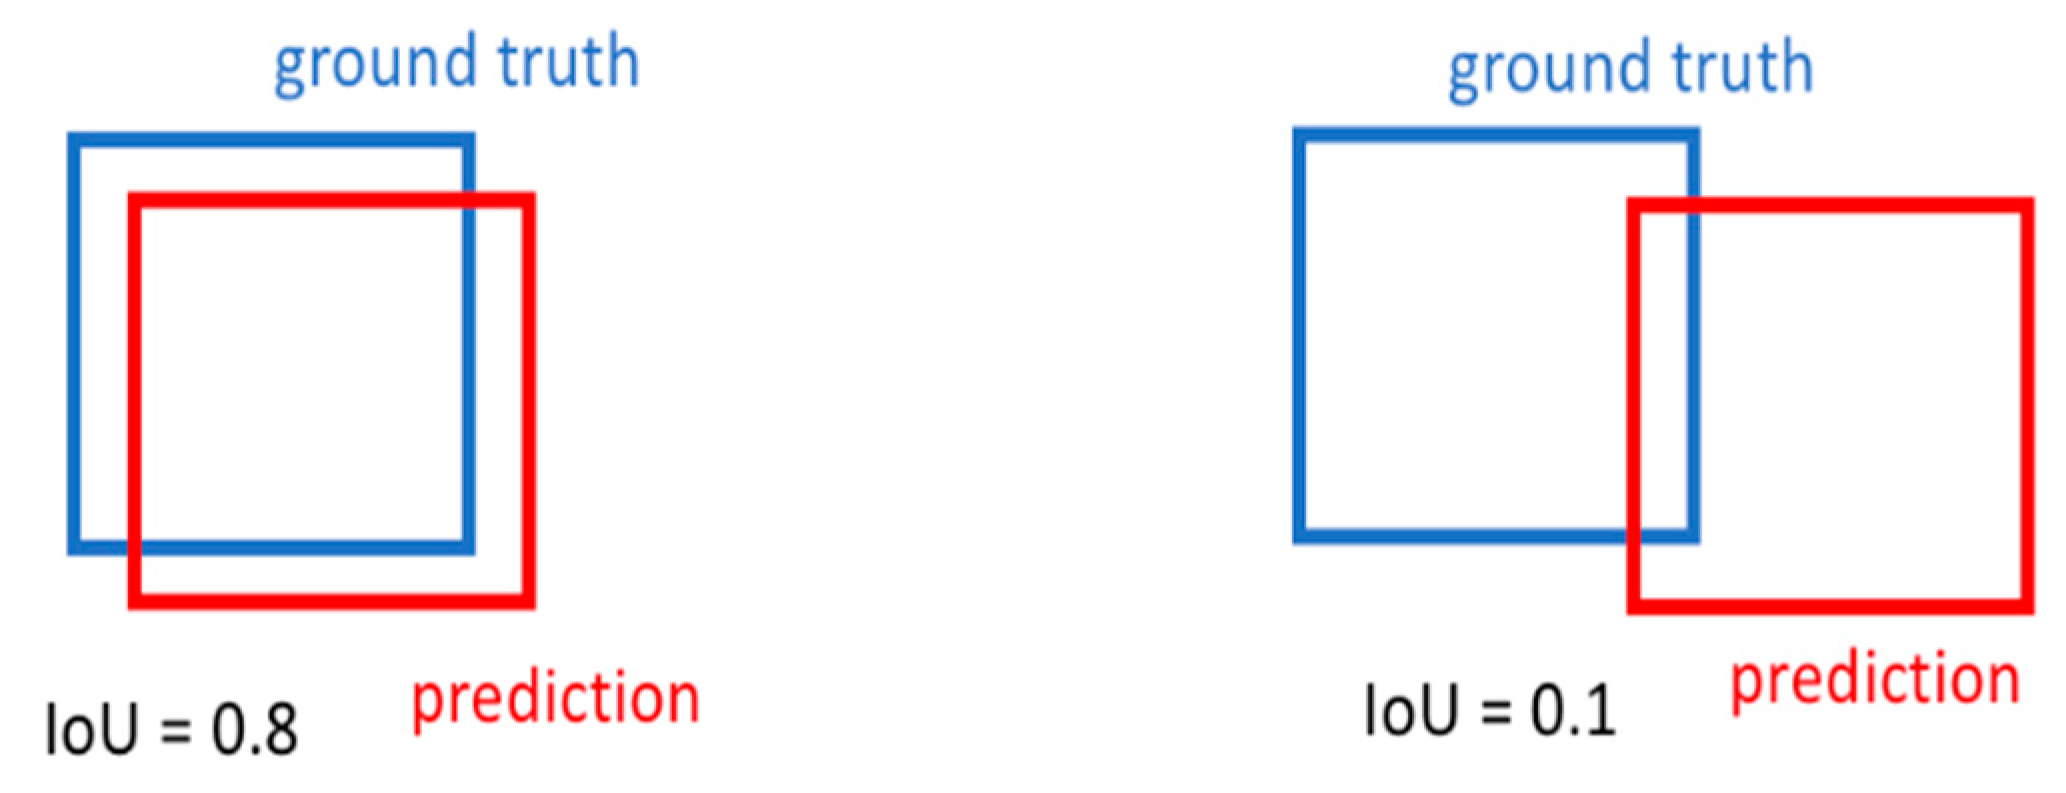
The Intersection over Union (IoU) was used to evaluate the model’s performance. This metric is used to measure the accuracy of an object detector because it is calculated by dividing the overlap area by the union area between the predicted bounding box and the ground-truth bounding box.
The closer this metric is to 1, the greater the overlap between the prediction and the actual coordinates of the object. Therefore, the better the prediction, and, hence, the model are, as exemplified in
Figure 20. As shown in
Table 10, the IoU reported a value greater than 70% for all image sets.
4.2.3. Graffiti Detection Limitations
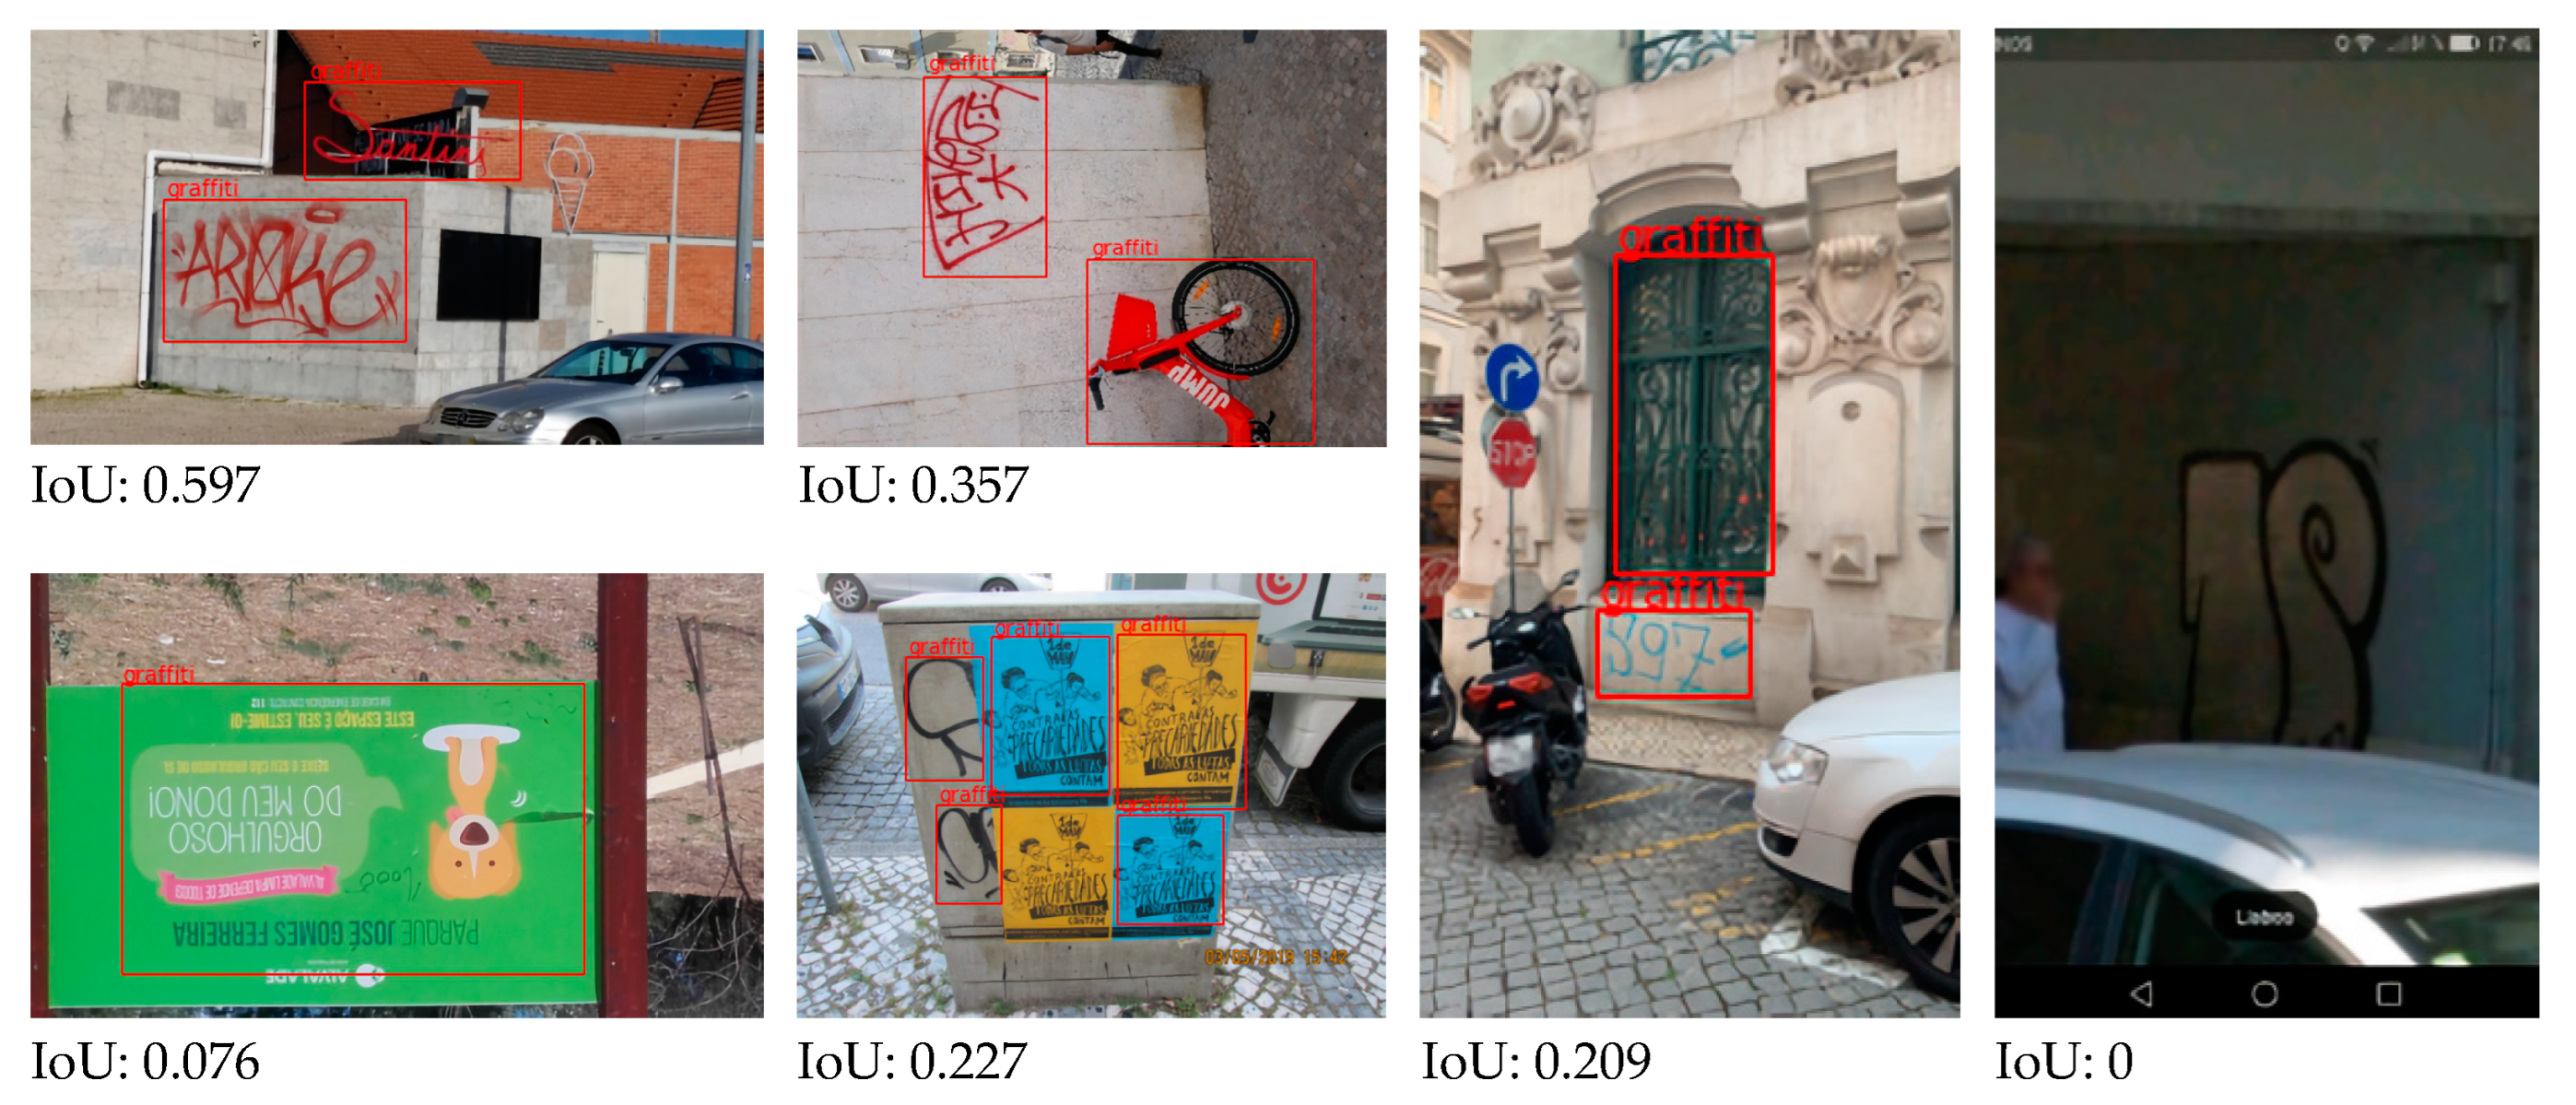
In
Figure 21, it is possible to observe some images with low IoU scores. Sometimes, it is due to the presence of words or posters in the picture that are easily confused with possible graffiti. Others correspond to the false detection of objects (usually when they present a more irregular shape) or images with low quality or with more distant graffiti.
The diagram depicted in
Figure 22 synthesizes the workflow followed in this research work. It reached the most suitable models for the problem previously described within those tested with the help of transfer learning and data augmentation.
The workflow allowed the development and training of two models: (1) an image classification model that classifies an image according to three classes: street art, illegal graffiti, and no graffiti classes; and (2) a graffiti identification model that provides the location of illegal graffiti identified by the classification model. For the image classification problem, ResNet50 showed the best results, presenting an overall accuracy of 81% and an F1-score of 86%, 81%, and 66% for the street art, illegal graffiti, and no graffiti classes, respectively. Meanwhile, for the illegal graffiti identification model, the best performance was obtained using a Faster R-CNN architecture ResNet50 FPN, having 0.703 of the IoU in the test set.
5. Conclusions
This research work proposed a machine learning-based protype to automatically detect, classify, and annotate graffiti from the input images. It can support the process, currently done manually by the Lisbon City Council’s staff, of identifying walls that require painted for removing illegal graffiti. Furthermore, it also identifies graffiti that may be considered as street art and, consequently, a potential cultural asset to the city.
Answering the first research question elaborated, “can a deep learning model successfully discriminate the differences between street art and illegal graffiti?”, the results showed that the proposed deep learning-based architecture successfully discriminates the differences between street art and illegal graffiti. Among the 435 images in the test set, an accuracy of 89% has been achieved. Furthermore, we observed that most of the misclassified images were illegal graffiti whose characteristics were quite similar to other street art images registered on the Lisbon Urban Art Gallery website. In other words, the image databases used for model training and testing contain images that a human himself may have difficulties in distinguishing between the street art and the illegal graffiti cases. Regarding the second research question, “how accurate is the automatic identification and location of illegal graffiti on images acquired in the streets of Lisbon under loose controlled conditions?”, the IoU metric of the illegal graffiti object detector achieved an average value of about 70%, using test images containing a wide diversity of graffiti samples and locations.
As for the limitations of our study, all tested image classification models showed poor performance when dealing with images without the presence of graffiti. The best configuration achieved an F1-score of 66%. This behavior is most likely due to the relatively small number of images without the presence of graffiti used during the training process and the great variety among them. For the illegal graffiti detection model, it was verified that its performance was negatively affected by spurious detections due to objects whose patterns somewhat resemble illegal graffiti tags, such as words on billboards and posters. In addition, lower-quality images on the dataset were prone to flaws in the detection of graffiti.
As for further research, a different approach could be followed by using an integrated solution for a street art and illegal graffiti object detection model (instead of using a separate image classification model for this task). Regardless of the approach followed, it would also be important to increase the number of images in the dataset, especially of images without the presence of graffiti. A larger image dataset is expected to improve the training of the models and, subsequently, to achieve better achieve results. Considering the achieved results, it is worth to invest in a more complete system that will the use video cameras mounted in the City Council vehicles already navigating in the city, as well as georeferencing data, to produce automatic annotations for registering and locating the walls subject to graffiti removal and to identify potential street art graffiti.


