Featured Application
Results of the presented work could be potentially used as evidence of long-term exposure to low-frequency magnetic field effects on the growth of cell cultures.
Abstract
This article is focused on the in vitro experimental verification of the basic necessary conditions for valid interpretation of an ion parametric resonance prediction model of biological reaction on an externally applied, extremely low-frequency magnetic field. Experiments are performed on model organism Saccharomyces cerevisiae strain BY4741, with the intention to target calcium ions, which already produced interesting preliminary results within authors’ previous works, confirming specific magnetic field settings being bioactive. To study the nature and origin of biological reactions more exhaustingly, the research is aimed at two chosen physical aspects of ion parametric resonance theory. In the first part, experiments are set up to verify the resonance point validity for calcium ions and to perform a sensitivity analysis of the biological system response around this point. In the second part, the main attention is paid to the verification of the validity of maximum biological effect at specific BAC/BDC ratios, reflecting the ion parametric resonance theory as well as the current state of the art and knowledge. Both series of experiments have shown interesting results, confirming 29.89 Hz as a bioactive frequency for a BAC/BDC ratio of 1.8. These observations are in close correlation with the assumptions of the ion parametric resonance model for targeting calcium ions. The performed sensitivity analysis around the resonance point looks even more interesting, as conducted preliminary experiments resulted in two more pronounced bioactive frequencies of 24.89 and 34.89 Hz, in terms of biological response significance, than the resonance frequency assumed by an investigated prediction model. The narrow width of the peak, which is typical for physical phenomena of resonant nature, was not observed within this series of experiments, which would be addressed more precisely in future work of authors.
1. Introduction
Many organizations reject the evidence of the harmful non-thermal effects caused by low-frequency (LF) and radio frequency (RF) electromagnetic fields (EMF), arguing that there is no established mechanism whereby such low-energy EMF might cause reduced immunity, cancer, and other diseases. However, there is strong experimental evidence, that even weak EMF affects physiological processes in living organisms [1,2,3,4,5,6]. The biological reaction on applied EMF is dependent on multiple parameters such as intensity, frequency range, exposure duration, or the dielectric properties of the organism tissues. The possible long-term evolution and adaptation of biological systems to conditions incorporating unnatural levels of EMF should not be neglected, as well [7]. Current research is focused on potential associations between EMF exposure and various health issues. Research groups over the world study possible physical mechanisms of EMF action on biological structures and implement the knowledge to further beneficial investigations on the efficacy of anticancer drugs [8,9,10] related to EMF application. Furthermore, there are investigations concerning the risk of the growing appearance of childhood leukemia near the EMF sources [11,12], and various types of malignancies. On the other hand, the therapeutic effects of EMF [13], drug delivery, and gene expression [14] are also a big part of current research.
The question of whether the electric (EF) or magnetic field (MF) would play a dominant role in terms of the LF EMF-induced nonthermal biological effects, is yet to be clarified. Still, in some studies, there is a description of a threshold around 10−4 V·m−1 for an external EF intensity to elicit a biological reaction at the cellular level [15]. At the cellular and subcellular levels, there are already several theories published describing the effects of weak LF MF, i.e., on proteins located on the surface of the cell membrane responsible for ion channels opening/closing: the ion cyclotron resonance (ICR) theory [16]; the ion parametric resonance (IPR) mechanism [17,18]; the theory about reactive oxygen species and free radical pairs [19,20]. The mentioned physical models are almost exclusively focused on the nonthermal effects of LF MF. The theories have been the target of scientific discussion and investigations for several decades, constantly producing new findings and knowledge in this research field, but despite all of the effort, the generally accepted theory or mechanism of LF EMF nonthermal action on cells is yet to be found.
The IPR model proposed by Lednev is probably the most discussed model of the interaction of LF EMF and biological objects. This theory is an ion cyclotron resonance (ICR) theory interpreted in a new way—it considers the signal-to-noise ratio of EMF, which was neglected in ICR, and considers the effect of EMF on protein-bound ions. Both theories are based on the same physical conditions but have different interpretations. Although the experimental results [18,21] confirm the validity of these theories, they still have not reached general acceptance.
The basis of this theory is established on cyclotron resonance, described by Liboff [22], considering that the physiological activity of specific essential ions may change when the frequency of the applied time-varying MF equals the ion motion frequency in a static MF. The ion in the IPR theory is estimated as a harmonic oscillator, which is bound to a specific location on the cell membrane’s surface and the application of parallelly combined MF should affect its oscillations [18]. However, this physical model was criticized by Adair in [23,24], pointing to the problem of thermal noise and signal-to-noise ratio.
Work [25] by Engström defended the IPR model, and these shortcomings were addressed by Lednev [26,27]. Halgamuge et al. [28] state:
“… the models based on electric interactions have difficulties obtaining a high enough signal-to-noise ratio at low field strengths. The fields needed to explain the opening of a membrane channel protein are unrealistically high. On the other hand, models based on magnetic interactions can easily obtain a large enough signal-to-noise ratio because the level of magnetic thermal noise in tissue is low. The reason these models work is the same reason that makes the MRI technique possible.”
Lednev’s IPR model as a plausible mechanism of LF MF action on biological structures inspires many experimental works [18,23,24,25,28,29]. The principle is in the application of a parallel combination of static and time-varying MF, represented by their magnetic flux densities BDC and BAC. The IPR postulates that in living cells a protein-bound ion of mass m and charge q can be targeted by the correct application of static and time-varying MF with a corresponding frequency (cyclotron frequency of the targeted ion), which is calculated as:
where q represents the ion’s electric charge, m represents the molecular mass of the target ion, and the magnetic flux density of static MF, for the purpose of this paper the geomagnetic one, is represented by the value BDC. Within the scope of the presented paper, the targeted ion is calcium 40Ca2+ with a cyclotron frequency of 29.89 Hz. In accordance with IPR predictions, the strongest reaction should be expected at the BAC/BDC ratio of 1.8.
In mentioned work by Belova [18] two facts supported by visual material should be verified:
- the dependence of the biological system reaction on the frequency of alternating the components of a combined magnetic field (CMF); i.e., the most pronounced response of the biosystem is achieved at the CMF tuned to the resonance frequency fc of the given bound ion, and as the frequency recedes from the fc, the response rate of the biosystem also decreases, Figure 1 (left).
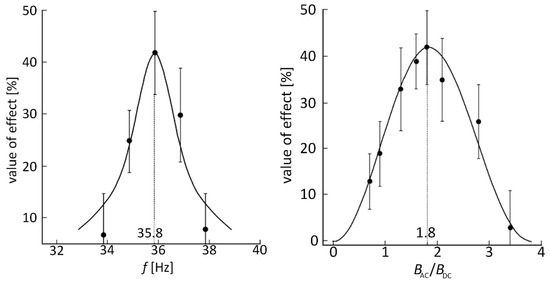 Figure 1. The gravitropic reaction of flax stem segments dependent on the frequency of alternating components of Ca2+ CMF (left) and the magnetic flux density ratio BAC/BDC of Ca2+ CMF (right)—adapted from [18].
 - dependence of the biological system response on magnetic flux density magnitude ratio BAC/BDC of CMF, i.e., the most pronounced response of the biosystem appears at a BAC/BDC ratio of 1.8, and as the ratio recedes from this value, the response rate of the biosystem also decreases, Figure 1 (right).
From presented state-of-the-art studies it is clear, that investigations within this scientific area often provide contradictory results. Quite a large number of cited research works suffer from insufficient methodology description leading to the inability of independent replication of experiments and thus lack of reproducible and scientifically acceptable evidence. The complexity of problematics focused on nonthermal biological effects of LF EMF is another strong limitation and a possible reason for the ambiguities even within the experiments focused on physical mechanisms of LF EMF, or more accurately LF MF action on biological objects at the cellular or molecular level. To successfully verify any of the proposed mechanisms a lot of effort should be placed not only on a precise setup and control of input physical quantities, but also on ambient conditions, especially on the temperature stability of the experiment, background field stability, or at least monitoring. On the other hand, the mentioned limitations could be understood as a strong motivational factor, to provide scientifically acceptable and reproducible research, which would be accepted as valid evidence of time-varying LF MF effects on biological samples.
Therefore, the presented work is focused on the precise establishment of experiments based on chosen conditions, which are in accordance with the postulates of the IPR model. One aim is to perform frequency sensitivity analysis around the predicted resonant point of Ca2+ ion at a stabilized ratio of CMF magnetic flux density to verify the relevance of the first condition. The second aim is to verify the influence of the magnetic flux density magnitude ratio BAC/BDC of CMF on the resulting biological response at the stabilized frequency of 29.89 Hz.
2. Materials and Methodology
2.1. Exposure Setup Configuration
The exposure system presented here is used as the field source [29]. The exposure system consists of two simple long cylindrical coils, an incubator, and shielding, Figure 2. The exposure system ensures a parallel experiment for 10 samples, five control and five exposed samples, identical ambient, experimental conditions for exposed and control samples, and uniform magnetic flux density field exposure for three middle samples at level 99%.
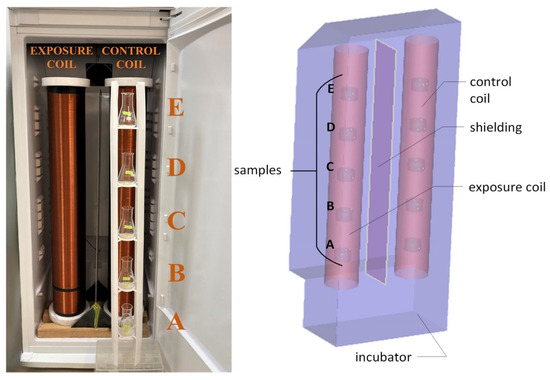
Figure 2.
Exposure system. Letters A–E indicate exact position of each investigated sample.
To power the exposure coil, an arbitrary wave generator, RIGOL DG 4162, is used. Signal amplification is performed by linear amplifier HUBERT KEYSIGHT Infinii Vision MSO-X 3012A. The sinusoidal driving current of RMS I = 79.5 mA, and frequency f = 29.89 Hz is continuously monitored using a digital multimeter Agilent 34401A during whole 8-h lasting exposure.
The non-powered control coil is shielded, representing the state without intervention, to enable investigations of the differences between the multiplication process without externally applied MF and the growth of yeasts treated by the application of MF with specific parameters.
2.2. Cell Cultures and Cultivation Conditions
The experimental biological samples are prepared from pure strain BY4741 yeast cells, Saccharomyces cerevisiae, stored in a refrigerator, and cultivated on yeast-peptone-dextrose (YPD) agar at 4 °C in a Petri dish. The samples are regularly reinoculated on a 2-month basis to maintain pure strain and living cells.
The experimental protocol comprises pre-cultivation, followed by dilution for sample preparation, cultivation during experimental irradiation, and finally quantification. For the pre-cultivation, a solution of YPD (1% yeast extract, 2% peptone, and 2% dextrose) medium is prepared and diluted with 95% distilled water. After the solution is prepared, the yeasts are inoculated into a 20 mL flask with prepared YPD. The final medium is cultured for 24 h on a shaker at 180 rpm, at an ambient temperature of 23 °C. Precultured yeast solution is pipetted (0.05 mL) into Erlenmeyer flasks (100 mL), producing five control, and five exposed samples containing 25 mL of experimental medium. To ensure air access, the closure of a cotton-wool plug is inserted on top of each flask. The prepared experimental samples are fixed into an exact place within the electromagnetic coil cavity and then transported into the incubator.
Cell counting method using Bürker chambers is performed to evaluate the proliferation reaction on applied LF MF. The microscopic pictures were taken by Axiocam ERc 5s mounted on an inverted microscope Zeiss Primovert (Oberkochen, Germany). Cell counting is performed before and after each experiment in every exposed and control sample, which is meant to establish a quantification procedure based on the growth dynamics ratio depicted in Figure 3.
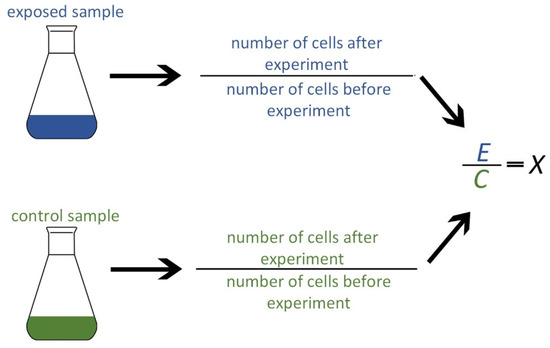
Figure 3.
The calculation method developed for quantification of the MF effect—representing a growth dynamics coefficient ratio.
If the growth coefficient X > 1, this indicates stimulation of cell growth as a reaction to the external field. If the coefficient X < 1, the applied field has an inhibitory effect on yeast reproduction.
The presented work focuses on a biological response expressed as a percentage. First, the response rate parameter S [%] is determined. It corresponds to:
The value X = 1 represents an unchanged state, the exposed and control samples reproduced equally, and the response rate parameter is S = 0%. If, for example, value X = 1.2, the cell counts in the exposed sample are 20% greater than in the control sample, the value of the response rate parameter is S = 20% and a stimulating effect is observed. On the other hand, at the value of X = 0.8, there are 20% fewer cells present in the exposed sample than in the control sample; the response rate parameter is S = −20%, and the inhibitory effect is observed.
The experiment performance reflects the common methods and practice for scientific work in laboratories, with main emphasis on precision and accuracy. Developed laboratory protocol incorporates a manual for the implementation of experimental procedures to ensure repeatability and further verification. In addition, the parameters such as conductivity and sample internal temperature are measured; records were archived for further comparison or repetition. Ambient temperature was also monitored during the whole experiment and is stored with corresponding microscopic photos of samples on the Bürker chamber, as well as the cell counts of each sample before and after the experiment.
2.3. Temperature Field
The basic confounders in the field of yeast research, in general, are temperature changes. Therefore, the stabilized ambient conditions with temperature monitoring are essential for credible results interpretation.
Incubator Q-cell 240 is used to achieve minimum temperature fluctuation and to assure identical ambient conditions for exposed and control sample cultivation. The incubator-forced air circulation maintains a temperature of 30 ± 0.5 °C. Nevertheless, the air temperature in the incubator is continuously measured during in vitro experiments. The monitoring is performed by our own temperature measurement system, which is designed on the Arduino UNO platform, with two temperature sensors, DS18B20. The temperature values are recorded in 10-min intervals, shown on an OLED display, and saved on an SD card.
The internal temperature measurement in exposed and control samples is performed by the conductometer PC 70 Vio, before and after each experiment.
2.4. Experiment Conditions
The experimental part of the work aims to verify the validity of the IPR theory described in the introduction. The following primary conditions should be met for proper verification:
- The primary target, a specific ion bound on a cellular membrane, would resonate in reaction to externally applied MF. Resonance occurs when the frequency of the BAC is equal to the cyclotron frequency fc of a given ion. The value of the cyclotron frequency is calculated according to the Formula (1), considering the value of the geomagnetic field’s induction as static component BDC within the calculations. The value was obtained by measurements using Vernier Labquest3 instrument with MG-BTA probe; the measured value is 39 µT. The calculations are performed with the aim to affect calcium ions 40Ca2+, which are involved in primary active transport in yeast cells. The energy required for this transport is obtained from adenosine triphosphate (ATP) by the action of membrane ATPase, which requires magnesium or calcium ions. The primary active transports are transmitted, e.g., potassium, sodium, magnesium, and calcium ions [30]. The following values were inserted into the Formula (1):
- ○
- ○
- kg
- ○
- ,
performing the necessary calculation, the resonance frequency of Hz is obtained. - The static BDC and alternating BAC component of magnetic flux density should be oriented in parallel—external application of parallelly combined static BDC and time-varying BAC magnetic fields.
- The strongest biological reaction is achieved when the amplitude of BAC is 1.8 times greater than the amplitude of BDC. Given the value of the static component above, the required value of the time-varying MF is . In accordance with [18] additional local maxima of biological effects were observed at the ratio BAC/BDC = 0.7; 0.9; 1.3; 1.6; 2.1; 2.8; 3.4.
Based on the hypothesis above, the theory of IPR is verified in two series of experiments. In the first series the validity of the resonance point for the calcium ion is verified, performing sensitivity analysis of the biological system response around the resonance point, as well. The validity of the maximum biological effect at given BAC/BDC ratios is verified in the second series of experiments.
2.4.1. Resonance Point Verification, Series 1 of the Experiments
As mentioned, experimental studies based on IPR theory assume a narrow width of the peak of the resonant response characteristic of the biosystem. Therefore, this assumption was verified in this series of experiments. The estimated resonance frequency of calcium ions 40Ca2+ is 29.89 Hz; increasing or decreasing the stated frequency value shows the decreasing response of the biological system. The range of ±5 Hz is chosen as the interval, and then this interval is divided in half and again in half—in this way, the ten values of the frequencies at which the experiments are performed are determined: 24.89; 27.39; 28.64; 29.26; 29.57; 29.89; 30.20; 30.51; 31.14; 32.39; 34.89 Hz. The BAC/BDC ratio is kept at the level of the expected maximum biological effect at 1.8. This value corresponds to the BAC value of 70.2 µT and a current of 79.5 mA. The response of the biological system is determined based on the parameter S according to the Formula (2).
The reasoning behind using such a narrow frequency range (29.89 ± 5 Hz) with the described step is in studying the resonant nature via increased sensitivity towards the assumed bioactive frequency. This would provide comparable results with the study [18] and enhance the understanding regarding the behavior of biological samples as a response to even small changes in the frequency of applied time-varying ELF MF.
2.4.2. Maximal Biological Effect Verification, Series 2 of the Experiments
In the second series of experiments, the dependence of the biological effects’ significance on the BAC/BDC ratio is verified. The maximum effect is assumed at a magnetic flux density ratio of 1.8. The individual ratios based on [31,32] are chosen BAC/BDC = 0.7; 0.9; 1.3; 1.6; 2.1; 2.8; 3.4. These values correspond to the decreasing response rate of the biological system, presented in Figure 1. The electric current change is used to achieve the desired ratio and the correct BAC value. The frequency value of the applied field remains the same as was estimated in the previous series of experiments (29.89 Hz).
The response of the biological system is determined based on the parameter S according to the Formula (2).
2.5. Statistical Analysis
One-Way Analysis of Variance (ANOVA) is performed for both series of experiments with a level of confidence at 95%. A post hoc Bonferroni test is performed to compare independent groups with each other at 95% confidence for all experiments. A probability of p < 0.05 is considered statistically significant. The appropriateness of using the ANOVA test is verified by the Kolmogorov-Smirnov and Bartlett test.
3. Results and Discussion
3.1. Temperature Field
The start of each experiment is affected by manipulation with samples and incubator opening, resulting in a chamber temperature of 24 °C occurrence. During the 8-h lasting experiment, the incubator opening is restricted, resulting in temperature stabilization at 30 °C approximately after 4 h (ΔT260). Anyway, the temperature differences between control and exposed samples do not exceed 0.5 °C and are not increasing during the whole experiment. Even the internal temperature of samples (measured with a conductometer) does not differ more than 0.5 °C, with the only exception in experiment number 14. In accordance with [33], achieved temperature differences should not affect the credibility of experimental results.
Graphical interpretation of temperature monitoring during 8-h of experiment duration for both the ambient temperature within the incubator and the internal temperature difference of control and irradiated samples is presented in Supplementary Materials (Figures S1 and S2).
3.2. First Series of the Experiment
As was already mentioned in previous parts of this article, the first series of experiments is focused on investigations of the frequency sensitivity analysis around the assumed resonance frequency. The observed biological reaction, in terms of response rate parameter S of individual samples depending on each of investigated frequencies, is graphically presented in Figure 4. The letters E–A indicate the corresponding location of the sample, which was shown in Figure 2. For better visual differentiation between the behavior of individual samples (based on their placement within the cavity of the MF applicator), each one is correspondingly color-coded. Furthermore, to support the graphical interpretation, the results of this series of experiments are also presented in Table 1.
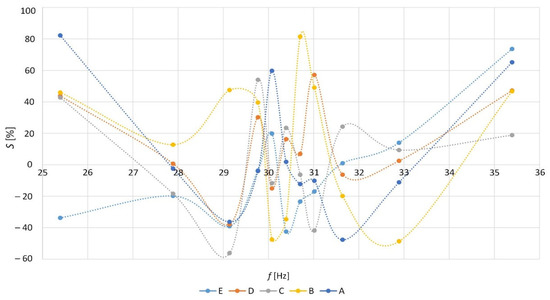
Figure 4.
Dependence of the response rate parameter S of a biological system on the change in frequency.

Table 1.
The percentual rate of a biological system response to a frequency change.
3.3. Second Series of the Experiment
The same experimental and quantification methodology, which was used in the first series of experiments, is also applied within the second series. The only difference is in changing the magnetic flux density ratio of applied time-varying LF MF at an unchanged, so-called bioactive frequency of 29.89 Hz.
The results of the percentual response rate S of this series of experiments are presented in Table 2, and graphically in Figure 5. The letters E–A indicate the location of the sample according to Figure 2.
Table 2.
The percentual response rate of a biological system on the change in the induction ratio.
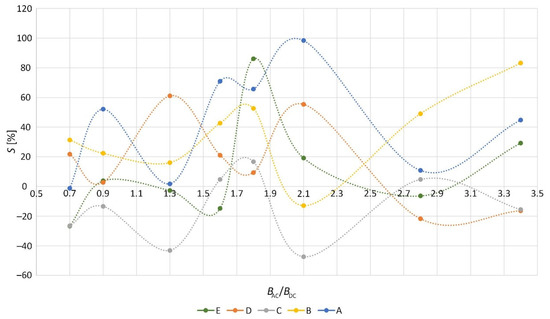
Figure 5.
Dependence of the response rate parameter S of a biological system on the change in magnetic flux density ratio.
3.4. Statistical Analysis
The results of the verification of the theory of IPR are presented in two parts. In the first part of the results, reporting are experiments set up to verify the validity of the resonance point for the calcium ion and to perform a frequency sensitivity analysis of the biological system reaction around the assumed resonance point. In the second part of the results, reporting are experiments set up to verify the validity of the maximum biological effect at given BAC/BDC ratios.
Two hypotheses are established:
- (a)
- the acting field achieves its maximum biological effect at a frequency referred to as the cyclotron resonance frequency, which corresponds to a frequency of 29.89 Hz for calcium ions.
- (b)
- the maximum biological effect occurs when the amplitude of the alternating component of CMF is 1.8 times higher than the value of the static component.
During statistical verification of the hypotheses, the numerical parameter of the response rate parameter S [%] is used as an absolute value, and the nature of the effect (inhibition, stimulation) is not considered. The statistical analysis was performed in the Department of Applied Mathematics, University of Zilina.
3.5. The Validity of Resonance Point
The experimental data achieved during the first series of experiments were initially analyzed using descriptive statistics. Considering the biological response of all five exposed samples to be affected by the same LF MF at a time (the same logic is applied to control non-affected samples), the average effect rate is calculated, resulting in the maximum average effect rate of S = 50.4 ± 9.2% at a frequency of 34.89 Hz. The minimum average effect rate of S is 10.8 ± 3.9% at a frequency of 27.39 Hz. The influence of the frequency on the response rate parameter S [%] can be addressed using a one-factor analysis of variance. The resulting p-value for the F-test is 0.0338, thus rejecting the null hypothesis, which means that variances are statistically significant. Based on the ANOVA results at the α = 0.05 significance level, it can be argued that different frequencies have a significant effect on the mean value of the response rate parameter S [%].
The Bonferroni method of multiple comparisons presented in Figure 6 and Figure 7, identified four homogeneous subgroups within which the response rate of the system shows no statistically significant differences in terms of biological effect; that is subgroups 1, 2, 3, and 4 (Table 3). This means, that the corresponding subgroup contains frequencies causing a similar or the same biological response.
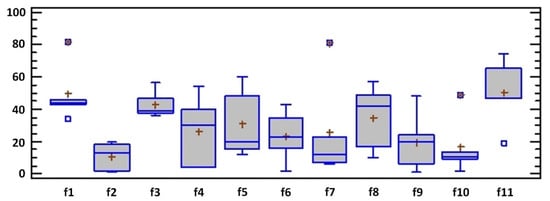
Figure 6.
Box plot of 1 series of experiments.
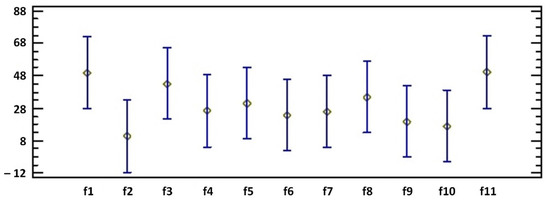
Figure 7.
Means and 95% Bonferroni intervals of 1 series of experiments.
Table 3.
Subgroups according to the response rate parameter S.
Within the investigated 11 frequencies, there are 6 pairs, within which there is a statistically significant difference between the mean values of the effect rate S [%]: pairs 5, 6, 7, 8, 9, and 10 (Table 3).
The hypothesis, Section 3.4 letter (a), that the maximum response rate parameter S [%] is at a frequency of 29.89 Hz (f6), with respect to conducted experimental data, could not be confirmed. Instead, according to the results, the maximum effect is at a frequency of 34.89 Hz (f11) and a frequency of 24.89 Hz (f1).
3.6. The Validity of the Maximal Biological Effect
The results show that different BAC/BDC ratios do not significantly affect the mean value of the response rate parameter S [%]. The hypothesis, Section 3.4 letter (b), that the maximum biological effect occurs if the amplitude of alternating component BAC of applied CMF is 1.8 times higher than the amplitude of the static component of the field BDC, is not confirmed, Figure 8 and Figure 9.
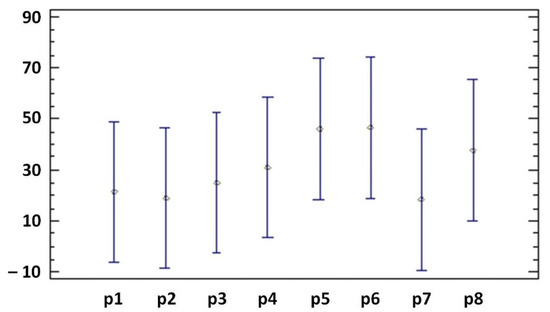
Figure 8.
Means and 95% Bonferroni intervals of 2 series of experiments.
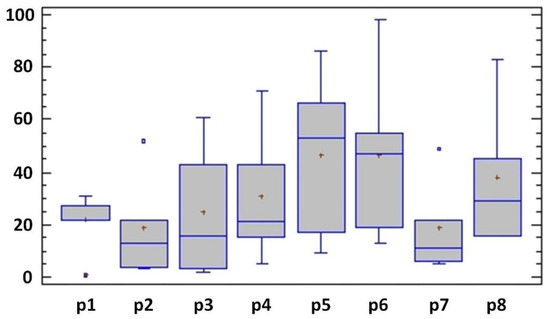
Figure 9.
Box plot of 2 series of experiments.
The statistical evaluation points to the influence of the frequency change on the response of the biological system. However, it did not confirm the maximum response of the system at the cyclotron resonance frequency for calcium ions from the first series of experiments. The most pronounced effect is observed at a frequency of 34.89 Hz and a frequency of 24.89 Hz. This resonance frequency shift may be caused by a different value of the Earth’s magnetic field flux density than was measured. The value was measured at only one place in the incubator, approximately at the position of sample C, representing 380 mm from the edge samples. At this distance, the BDC value could, and probably would be changed, causing further discrepancies in observed results. Likewise, the BDC value changes over time—four months passed from measuring the value used in the calculations to executing the experiments. There were seven days between the experiments with the frequencies with the most pronounced effect, f1, and f11.
Another non-negligible factor is the unfulfilled assumption of the static BDC’s collinear direction and the magnetic field’s alternating BAC component. Unfortunately, this fact was not verified experimentally. Thanks to the location of the coils, the alternating component has a perpendicular direction to the Earth’s surface. However, the direction of the static component could be influenced via the metal shielding between the coils. This ferromagnetic component can cause deformation of the induction lines of the vertical component of the geomagnetic field, thus disrupting its collinearity with the alternating component of the magnetic field created by the applicator. The second factor is that the edge samples are not located in the region of parallel induction lines of alternating components of the magnetic field—their parallelism is determined at a distance greater than the diameter of the coil cavity. In the used exposition system, more than 135 mm from the end of the coil winding would correspond to the parallelism of the induction lines. However, samples E and A are 120 mm from the applicator´s edge.
Statistical evaluation of the second series of experiments confirmed that different BAC/BDC ratios do not significantly affect the mean value of the response rate parameter S [%]. Therefore, the hypothesis that the maximum biological effect occurs when the amplitude value of the alternating magnetic field component is 1.8 times higher than the value of the static component, was not confirmed. Even in this case, the same factors influence the results described above. When the IDC value changes, the BAC/BDC ratio also changes. It is also important to mention that for different BAC/BDC ratios, the values difference of the required current varied from 3 mA to 10 mA. Using a voltage source, it was difficult to achieve the correct value of the flowing current and maintain it at the required value for the entire eight hours of irradiation. On the other hand, these conditions could better represent practical ambient conditions typical for power line frequencies, as the value of electric current (and thus the levels of the electromagnetic field) varies in accordance with demands on electro-energetical distribution.
As expected, the graphical representation of the results should approximate the results shown in Figure 1 (left) for changing the frequency, and in Figure 1 (right) for changing the BAC/BDC ratio. For sample C, it is most likely that all the conditions for experimenting according to the IPR theory are preserved—the collinear direction of BAC and BDC. Therefore, only the mentioned sample’s curves are presented in the next section. Figure 10 shows the response of the biological system depending on the change in frequency, considering the nature of the response (inhibition, stimulation). Figure 11 shows the response of the biological system’s dependence on the change in magnetic flux density ratio, considering the nature of the response. Alterations of local maxima and minima are characteristic of the nature of both courses. Similarly, for other forms of results quantification, such as averages or mean values of samples, the character of the curves remained the same. Apparently, the similarity with the graphical representation of the waveforms presented in Figure 1 could not be confirmed.
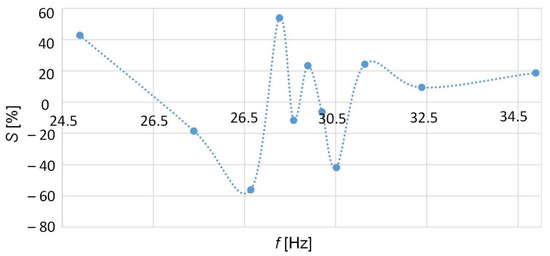
Figure 10.
Dependence of the response rate parameter of a biological system on the change in frequency, sample C.
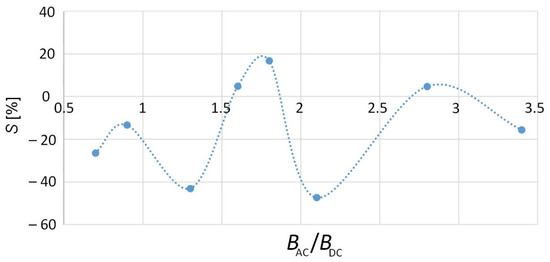
Figure 11.
Dependence of the response rate parameter of a biological system on the change in the induction ratio, sample C.
By gradually adjusting the presented experimental results, it could be possible to achieve a comparable graphic result as presented within the introduction section, but this would be contrary to the scientific interest of this work, and future research based on our results would have the wrong foundations and take the wrong direction.
4. Conclusions
The research presented within this paper extends and complements the previously published article [29], which was focused almost exclusively on experimental system design, construction, and testing. Herein, the experimental methodology is the same as in [29], but the main attention is focused on the application of a designed and developed system in terms of conducting a statistically relevant number of experiments performed by changes of specific physical parameters of applied ELF MF, with the intention to verify the resonant nature of the observed biological reaction. The relevance of the presented results is tested through various statistical analysis methods, providing a completely new overview of the investigations.
The first series of experiments aimed to verify the sensitivity of the biological system response in the vicinity of the resonance point for calcium ions Hz, with a specified range of ±5 Hz and the magnetic flux density ratio BAC/BDC = 1.8. The frequency of the applied field was determined based on the IPR theory, and the magnetic flux density of the geomagnetic field was obtained by measurements at the location where the experiments were carried out. The magnetic flux density ratio was chosen based on the published results of other research groups [23,24], where the maximum biological effect was observed at a precise mutual BAC/BDC ratio setting. The statistical evaluation of the results confirmed the influence of the frequency change on the biological system response but did not support the hypothesis regarding the maximum response of the system at the cyclotron resonance frequency for calcium ions. Instead, the maximum effect was observed at a frequency of 34.89 Hz and a frequency of 24.89 Hz at a given BAC/BDC ratio.
The second series of experiments verify the response of the biological system depending on the ratio of the alternating and direct components of the magnetic flux density. The works [12,23,24] published so far assumed the maximum effect of the applied field at BAC/BDC = 1.8 and further decreasing maxima at ratios of 0.7; 0.9; 1.3; 1.6; 2.1; 2.8; 3.4. The statistical evaluation of the results showed that the change in the magnetic flux density ratio does not have a significant effect on the mean value of the effect rate—the response of the biological system.
Based on our preliminary results, the validity of the two requirements of IPR theory cannot be unequivocally confirmed or refuted. The research in the subject area requires further investigation. It is necessary to perform a more significant number of experiments. In any case, it can be concluded that at least there is an indication of a frequency-dependent exposure effect of ELF MF at the cellular level, confirming other preliminary observations from [34,35].
Supplementary Materials
The following supporting information can be downloaded at: https://www.mdpi.com/article/10.3390/app13031777/s1, Figure S1: Average YPD temperature difference between control and exposed samples A–E; Figure S2: Ambient temperature monitoring within the incubator during the experiment.
Author Contributions
Conceptualization, Z.J.; Methodology, Z.J.; Investigation, Z.J. and R.R.; Software, Z.J.; Validation, Z.J. and I.P.; Writing—Original Draft Preparation, Z.J.; Writing—Review & Editing, R.R. and L.J.; Visualization, Z.J.; Supervision, L.J.; Data Curation, I.P. All authors have read and agreed to the published version of the manuscript.
Funding
This work was supported by the Slovak Research and Development Agency under the Contract no. APVV-19-0214.
Institutional Review Board Statement
Not applicable.
Informed Consent Statement
Not applicable.
Data Availability Statement
The data presented in this study are available on request from the corresponding author.
Conflicts of Interest
The authors declare no conflict of interest.
References
- Kohan, M.; Spronglova, M.; Visnovcova, N.; Misek, J.; Spanikova, G.; Jakusova, V.; Jakus, J. Monitoring of data transmission and changes in values of electromagnetic field in living environment. Commun. Sci. Lett. Univ. Žilina 2020, 22, 71–76. [Google Scholar] [CrossRef]
- Mustafa, Y.; Riad, S.; Abdel-Rahman, S.; El-Demellawy, M.; El-Messeiry, S. Effect of Low Frequency Electromagnetic Fields (LF-EMFs) on c-myc Oncogene Expression Level in Peripheral Blood Mononuclear Cells (PBMCs). Br. Biotechnol. J. 2014, 4, 1263–1271. [Google Scholar] [CrossRef]
- Zheng, Y.; Ma, X.; Dong, L.; Ma, W.; Cheng, J. Effects of uninterrupted sinusoidal LF-EMF stimulation on LTP induced by different combinations of TBS/HFS at the Schaffer collateral-CA1 of synapses. Brain Res. 2019, 1725, 146487. [Google Scholar] [CrossRef] [PubMed]
- Pall, M.L. Electromagnetic fields act via activation of voltage-gated calcium channels to produce beneficial or adverse effects. J. Cell Mol. Med. 2013, 17, 958–965. [Google Scholar] [CrossRef]
- Misek, J.; Vojtek, J.; Veternik, M.; Kohan, M.; Jakusova, V.; Spanikova, G.; Belyaev, I.; Jakus, J. New Radiofrequency Exposure System with Real Telecommunication Signals. Adv. Electr. Electron. Eng. 2018, 16, 101–107. [Google Scholar] [CrossRef]
- Jakusova, V. Ultraviolet Radiation and Mobile Communication: Physical properties, biological effects and health protection. In Vysoká Škola Zdravotníctva a Sociálnej Práce sv. Alžbety; Samosato: Bratislava, Slovakia, 2009; 97p. [Google Scholar]
- Redmayne, M.; Johansson, O. Radiofrequency exposure in young and old: Different sensitivities in light of age-relevant natural differences. Rev. Environ. Health 2015, 30, 323–335. [Google Scholar] [CrossRef]
- Xiongshan, S.; Chen, R.; Wang, F.; Chen, S.; Sun, X.; Guan, X.; Yang, Y.; Peng, B.; Pan, X.; Li, J.; et al. Pre-exposure to 50 Hz-electromagnetic fields enhanced the antiproliferative efficacy of 5-fluorouracil in breast cancer MCF-7 cells. PLoS ONE 2018, 13, e0192888. [Google Scholar]
- Ruiz-Gómez, M.J.; De La Peña, L.; Prieto-Barcia, M.I.; Pastor, J.M.; Gil, L.; Martínez-Morillo, M. Influence of 1 and 25 Hz, 1.5 mT Magnetic Fields on Antitumor Drug Potency in a Human Adenocarcinoma Cell Line. Bioelectromagnetics 2002, 23, 578–585. [Google Scholar] [CrossRef]
- Al-Musawi, S.; Albukhaty, S.; Al-Karagoly, H.; Almalki, F. Design and synthesis of multi-functional superparamagnetic core-gold shell coated with chitosan and folate nanoparticles for targeted antitumor therapy. Nanomaterials 2021, 11, 32. [Google Scholar] [CrossRef]
- Pedersen, C.; Johansen, C.; Schüz, J.; Olsen, J.H.; Raaschou-Nielsen, O. Residential exposure to extremely low-frequency magnetic fields and risk of childhood leukaemia, CNS tumour and lymphoma in Denmark. Br. J. Cancer 2015, 113, 1370–1374. [Google Scholar] [CrossRef]
- Liorni, I.; Parazzini, M.; Struchen, B.; Fiocchi, S.; Röösli, M.; Ravazzani, P. Children’s personal exposure measurements to extremely low frequency magnetic fields in Italy. Int. J. Environ. Res. Public Health 2016, 13, 549. [Google Scholar] [CrossRef]
- Kumar, S.; Dey, S.; Jain, S. Extremely low-frequency electromagnetic fields: A possible non-invasive therapeutic tool for spinal cord injury rehabilitation. Electromagn. Biol. Med. 2017, 36, 88–101. [Google Scholar] [CrossRef]
- Lakshmanan, S.; Gupta, G.K.; Avci, P.; Chandran, R.; Sadasivam, M.; Jorge, A.E.S.; Hamblin, M.R. Physical energy for drug delivery; poration, concentration and activation. Adv. Drug Deliv. Rev. 2014, 71, 98–114. [Google Scholar] [CrossRef]
- Rosenspire, A.J.; Kindzelskii, A.L.; Simon, B.J.; Petty, H.R. Real-time control of neutrophil metabolism by very weak ultra-low frequency pulsed magnetic fields. Biophys. J. 2005, 88, 3334–3347. [Google Scholar] [CrossRef]
- Liboff, A.R. Cyclotron resonance in membrane transport. Interact. Electromagn. Fields Cells 1985, 281–296. Available online: https://ci.nii.ac.jp/naid/10010348220/ (accessed on 15 January 2020).
- Lednev, V.V. Possible mechanism for the influence of weak magnetic fields on biological systems. Bioelectromagnetics 1991, 12, 71–75. [Google Scholar] [CrossRef]
- Belova, N.A.; Panchelyuga, V.A. Lednev’s model: Theory and experiment. Biophysics 2010, 55, 661–674. [Google Scholar] [CrossRef]
- Engstrom, S. Magnetic Field Effects on Free Radical Reactions in Biology. In Bioengineering and Biophysical Aspects of Electromagnetic Fields; CRC Press: Boca Raton, FL, USA, 2007; pp. 193–204. Available online: https://www.taylorfrancis.com/chapters/edit/10.1201/9781315221540-14/magnetic-field-effects-free-radical-reactions-biology-stefan-engstro¨m (accessed on 20 August 2021).
- Barnes, F.S.; Greenebaum, B. The effects of weak magnetic fields on radical pairs. Bioelectromagnetics 2015, 36, 45–54. [Google Scholar] [CrossRef]
- Liboff, A.R. ION cyclotron resonance: Geomagnetic strategy for living systems? Electromagn. Biol. Med. 2019, 38, 143–148. [Google Scholar] [CrossRef]
- Liboff, A.R. Geomagnetic cyclotron resonance in living cells. J. Biol. Phys. 1985, 13, 99–102. [Google Scholar] [CrossRef]
- Adair, R.K. Criticism of Lednev’s mechanism for the influence of weak magnetic fields on biological systems. Bioelectromagnetics 1992, 13, 231–235. [Google Scholar] [CrossRef] [PubMed]
- Adair, R.K. A physical analysis of the ion parametric resonance model. Bioelectromagnetics 2002, 19, 181–191. [Google Scholar] [CrossRef]
- Engström, S. Dynamic properties of Lednev’s parametric resonance mechanism. Bioelectromagnetics 1996, 17, 58–70. [Google Scholar] [CrossRef]
- Lednev, V.V. Bioeffects of weak static and alternating magnetic fields. Biofizika 1996, 41, 224–232. Available online: http://www.ncbi.nlm.nih.gov/pubmed/8714474 (accessed on 6 August 2019). [PubMed]
- Lednev, V.V. Biological effects of the extremely weak alternating magnetic fields: The identification of primary targets. Model. Geophys. Process. 2003, 130–136. [Google Scholar]
- Halgamuge, M.N.; Perssont, B.R.R.; Salford, L.G.; Mendis, P.; Eber-hardt, J. Comparison Between Two Models for Interactions Between Electric and Magnetic Fields and Proteins in Cell Membranes. Environ. Eng. Sci. 2009, 26, 1476–1480. [Google Scholar] [CrossRef]
- Judakova, Z.; Janousek, L.; Radil, R.; Carnecka, L. Low-Frequency Magnetic Field Exposure System for Cells Electromagnetic Biocompatibility Studies. Appl. Sci. 2022, 12, 6846. [Google Scholar] [CrossRef]
- Šilhánková, L. Mikrobiologie Pro Potravináře a Biotechnology, 3rd ed.; Academia: Prague, Czech Republic, 2008. [Google Scholar]
- Allen, M.J.; Cleary, S.F.; Sowers, A.E.; Shillady, D.D. Charge and field effects in biosystems. In Proceedings of the International Symposium on Charge and Field Effects in Biosystems, Richmond, VA, USA, 21–27 July 1991. [Google Scholar]
- Belova, N.A.; Lednev, V.V. Dependence of gravitotropic reaction in segments of flax stems on frequency and amplitude of variable components of a weak combined magnetic field. Biofizika 2000, 45, 1108–1111. [Google Scholar]
- Leng Tai, S.; Daran-Lapujade, P.; Walsh, M.C.; Pronk, J.T.; Daran, J.-M. Acclimation of Saccharomyces cerevisiae to Low Temperature: A Chemostat-based Transcriptome Analysis. Mol. Biol. Cell 2007, 18, 5100–5112. [Google Scholar]
- Radil, R.; Barabas, J.; Janousek, L.; Bereta, M. Frequency Dependent Alterations of S. Cerevisiae Proliferation Due to LF EMF Exposure. Adv. Electr. Electron. Eng. 2020, 18, 99–106. [Google Scholar] [CrossRef]
- Barabáš, J.; Radil, R.; Malíková, I. Modification of S. cerevisiae growth dynamics using low frequency electromagnetic fields in the 1-2 kHz range. Biomed. Res. Int. 2015, 2015, 694713. [Google Scholar] [CrossRef]


Disclaimer/Publisher’s Note: The statements, opinions and data contained in all publications are solely those of the individual author(s) and contributor(s) and not of MDPI and/or the editor(s). MDPI and/or the editor(s) disclaim responsibility for any injury to people or property resulting from any ideas, methods, instructions or products referred to in the content. |
© 2023 by the authors. Licensee MDPI, Basel, Switzerland. This article is an open access article distributed under the terms and conditions of the Creative Commons Attribution (CC BY) license (https://creativecommons.org/licenses/by/4.0/).