Appendix A. Selection of Components for the Braking System Prototype
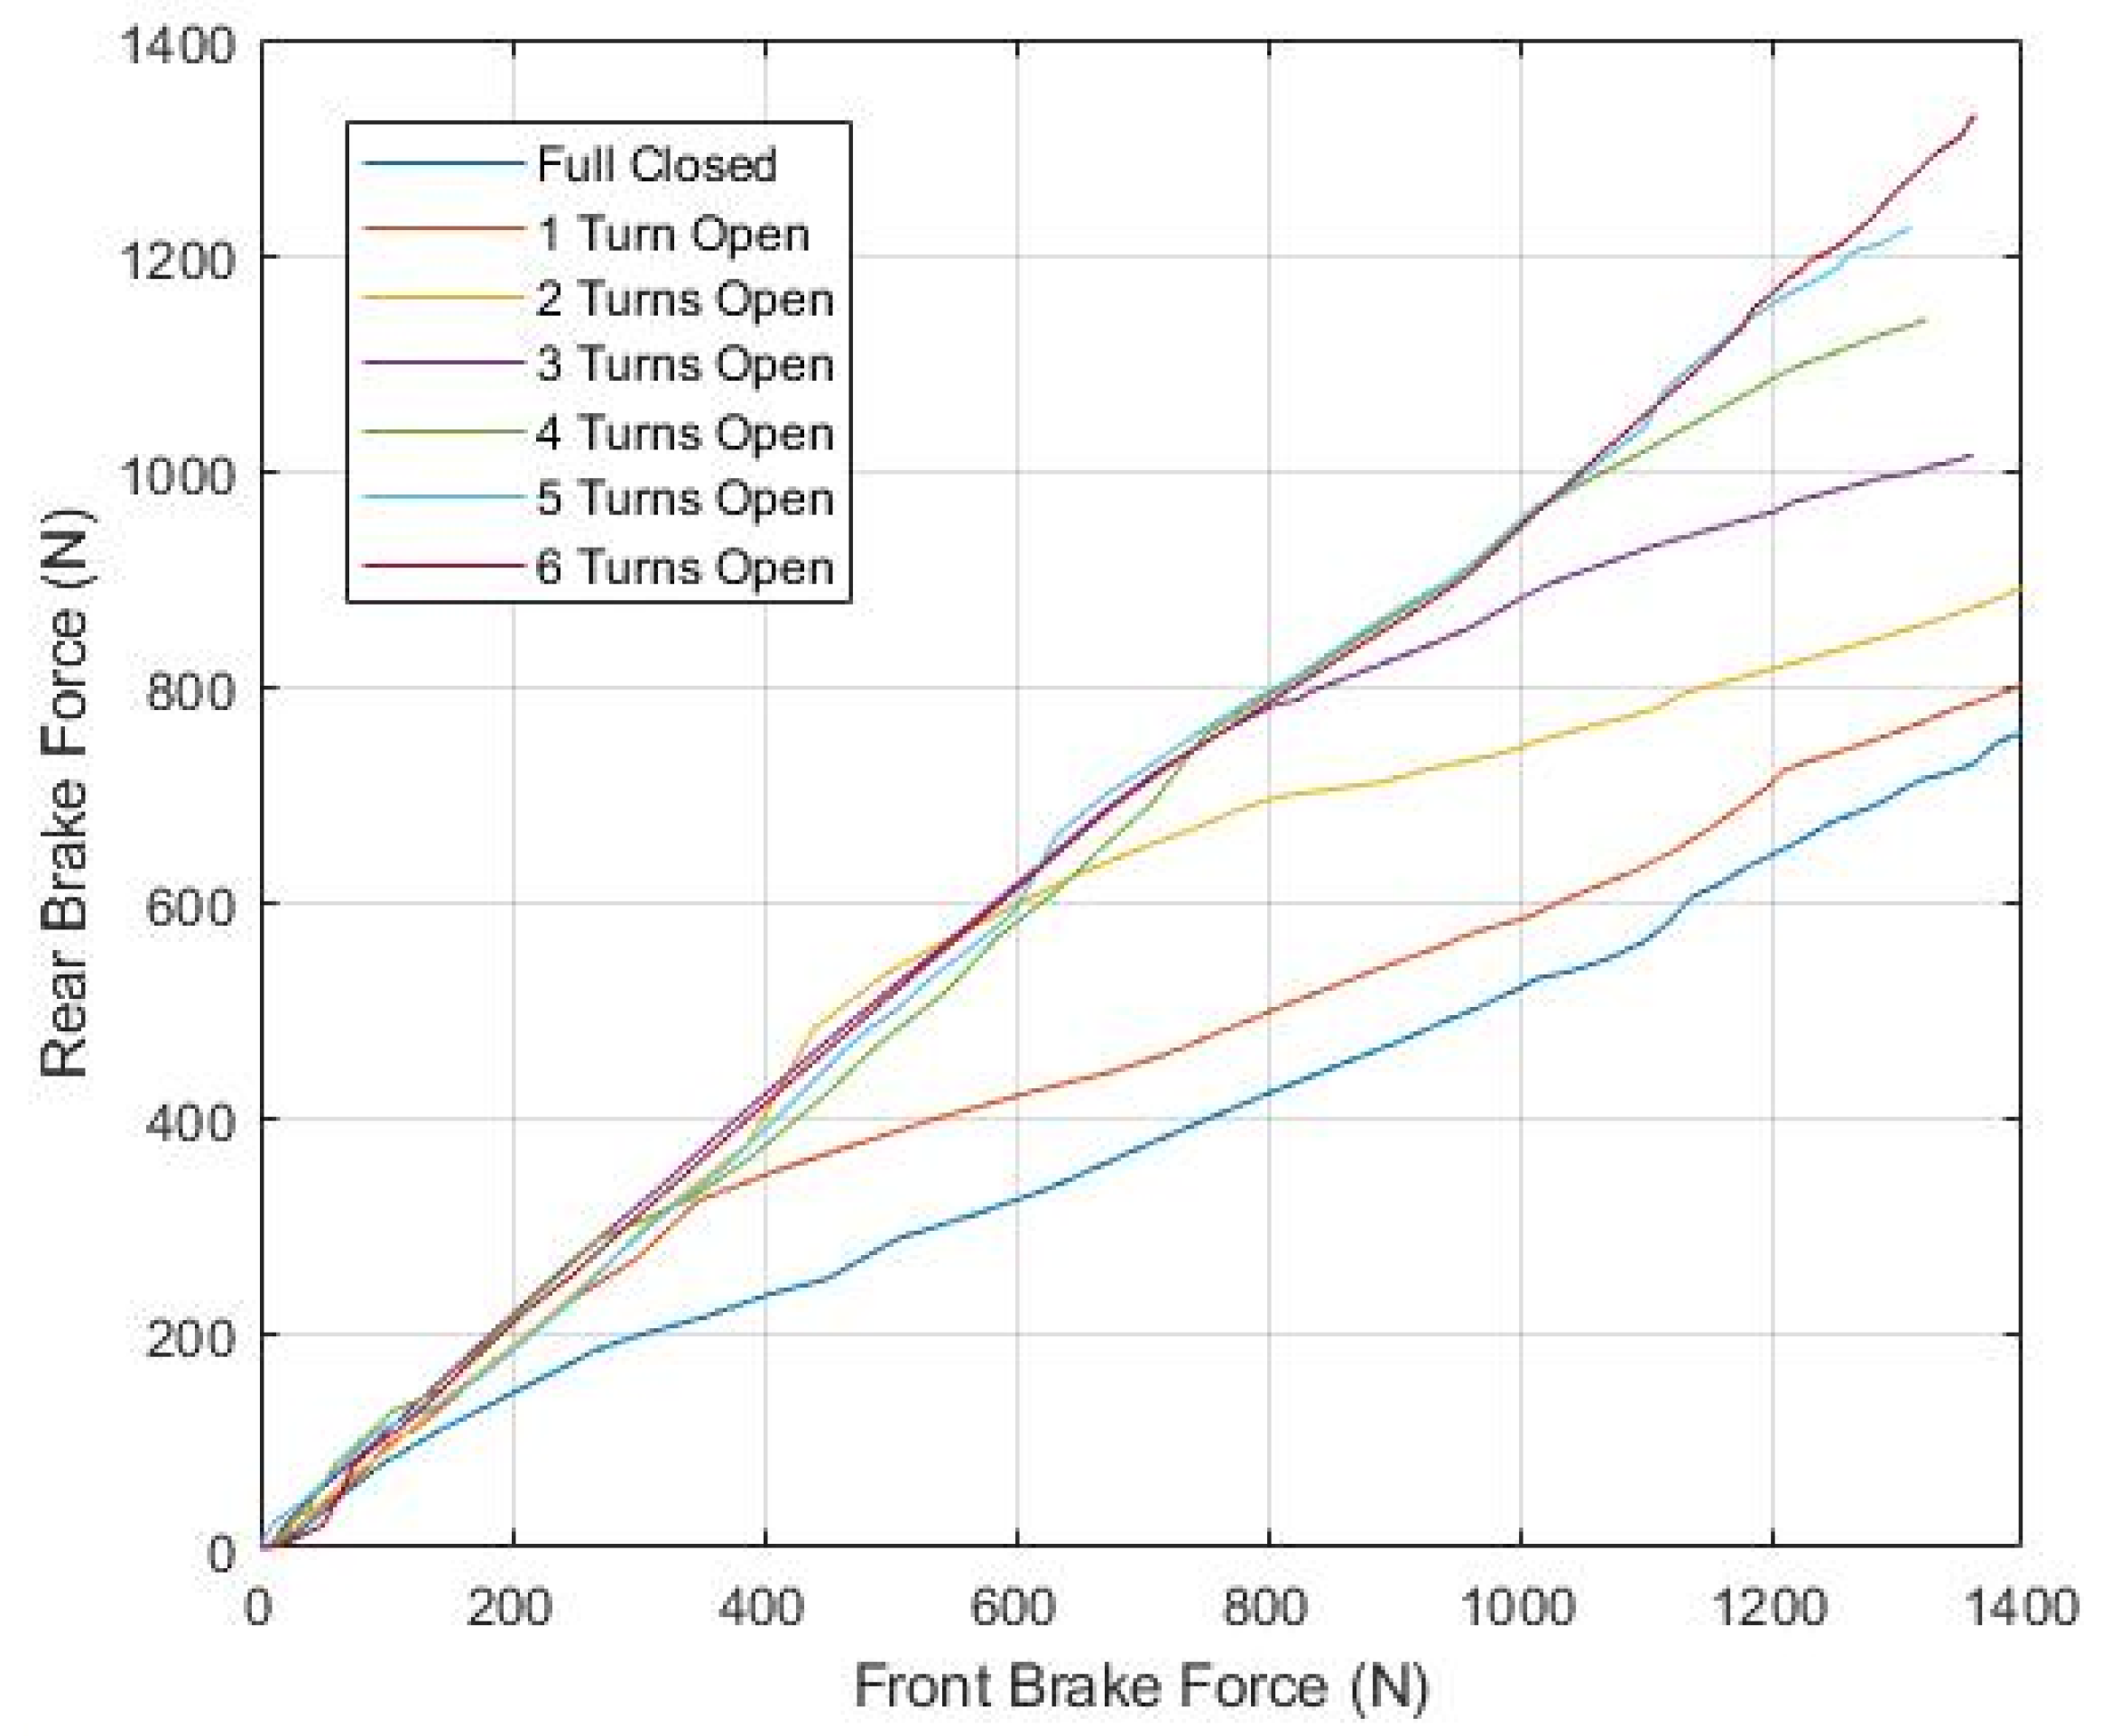
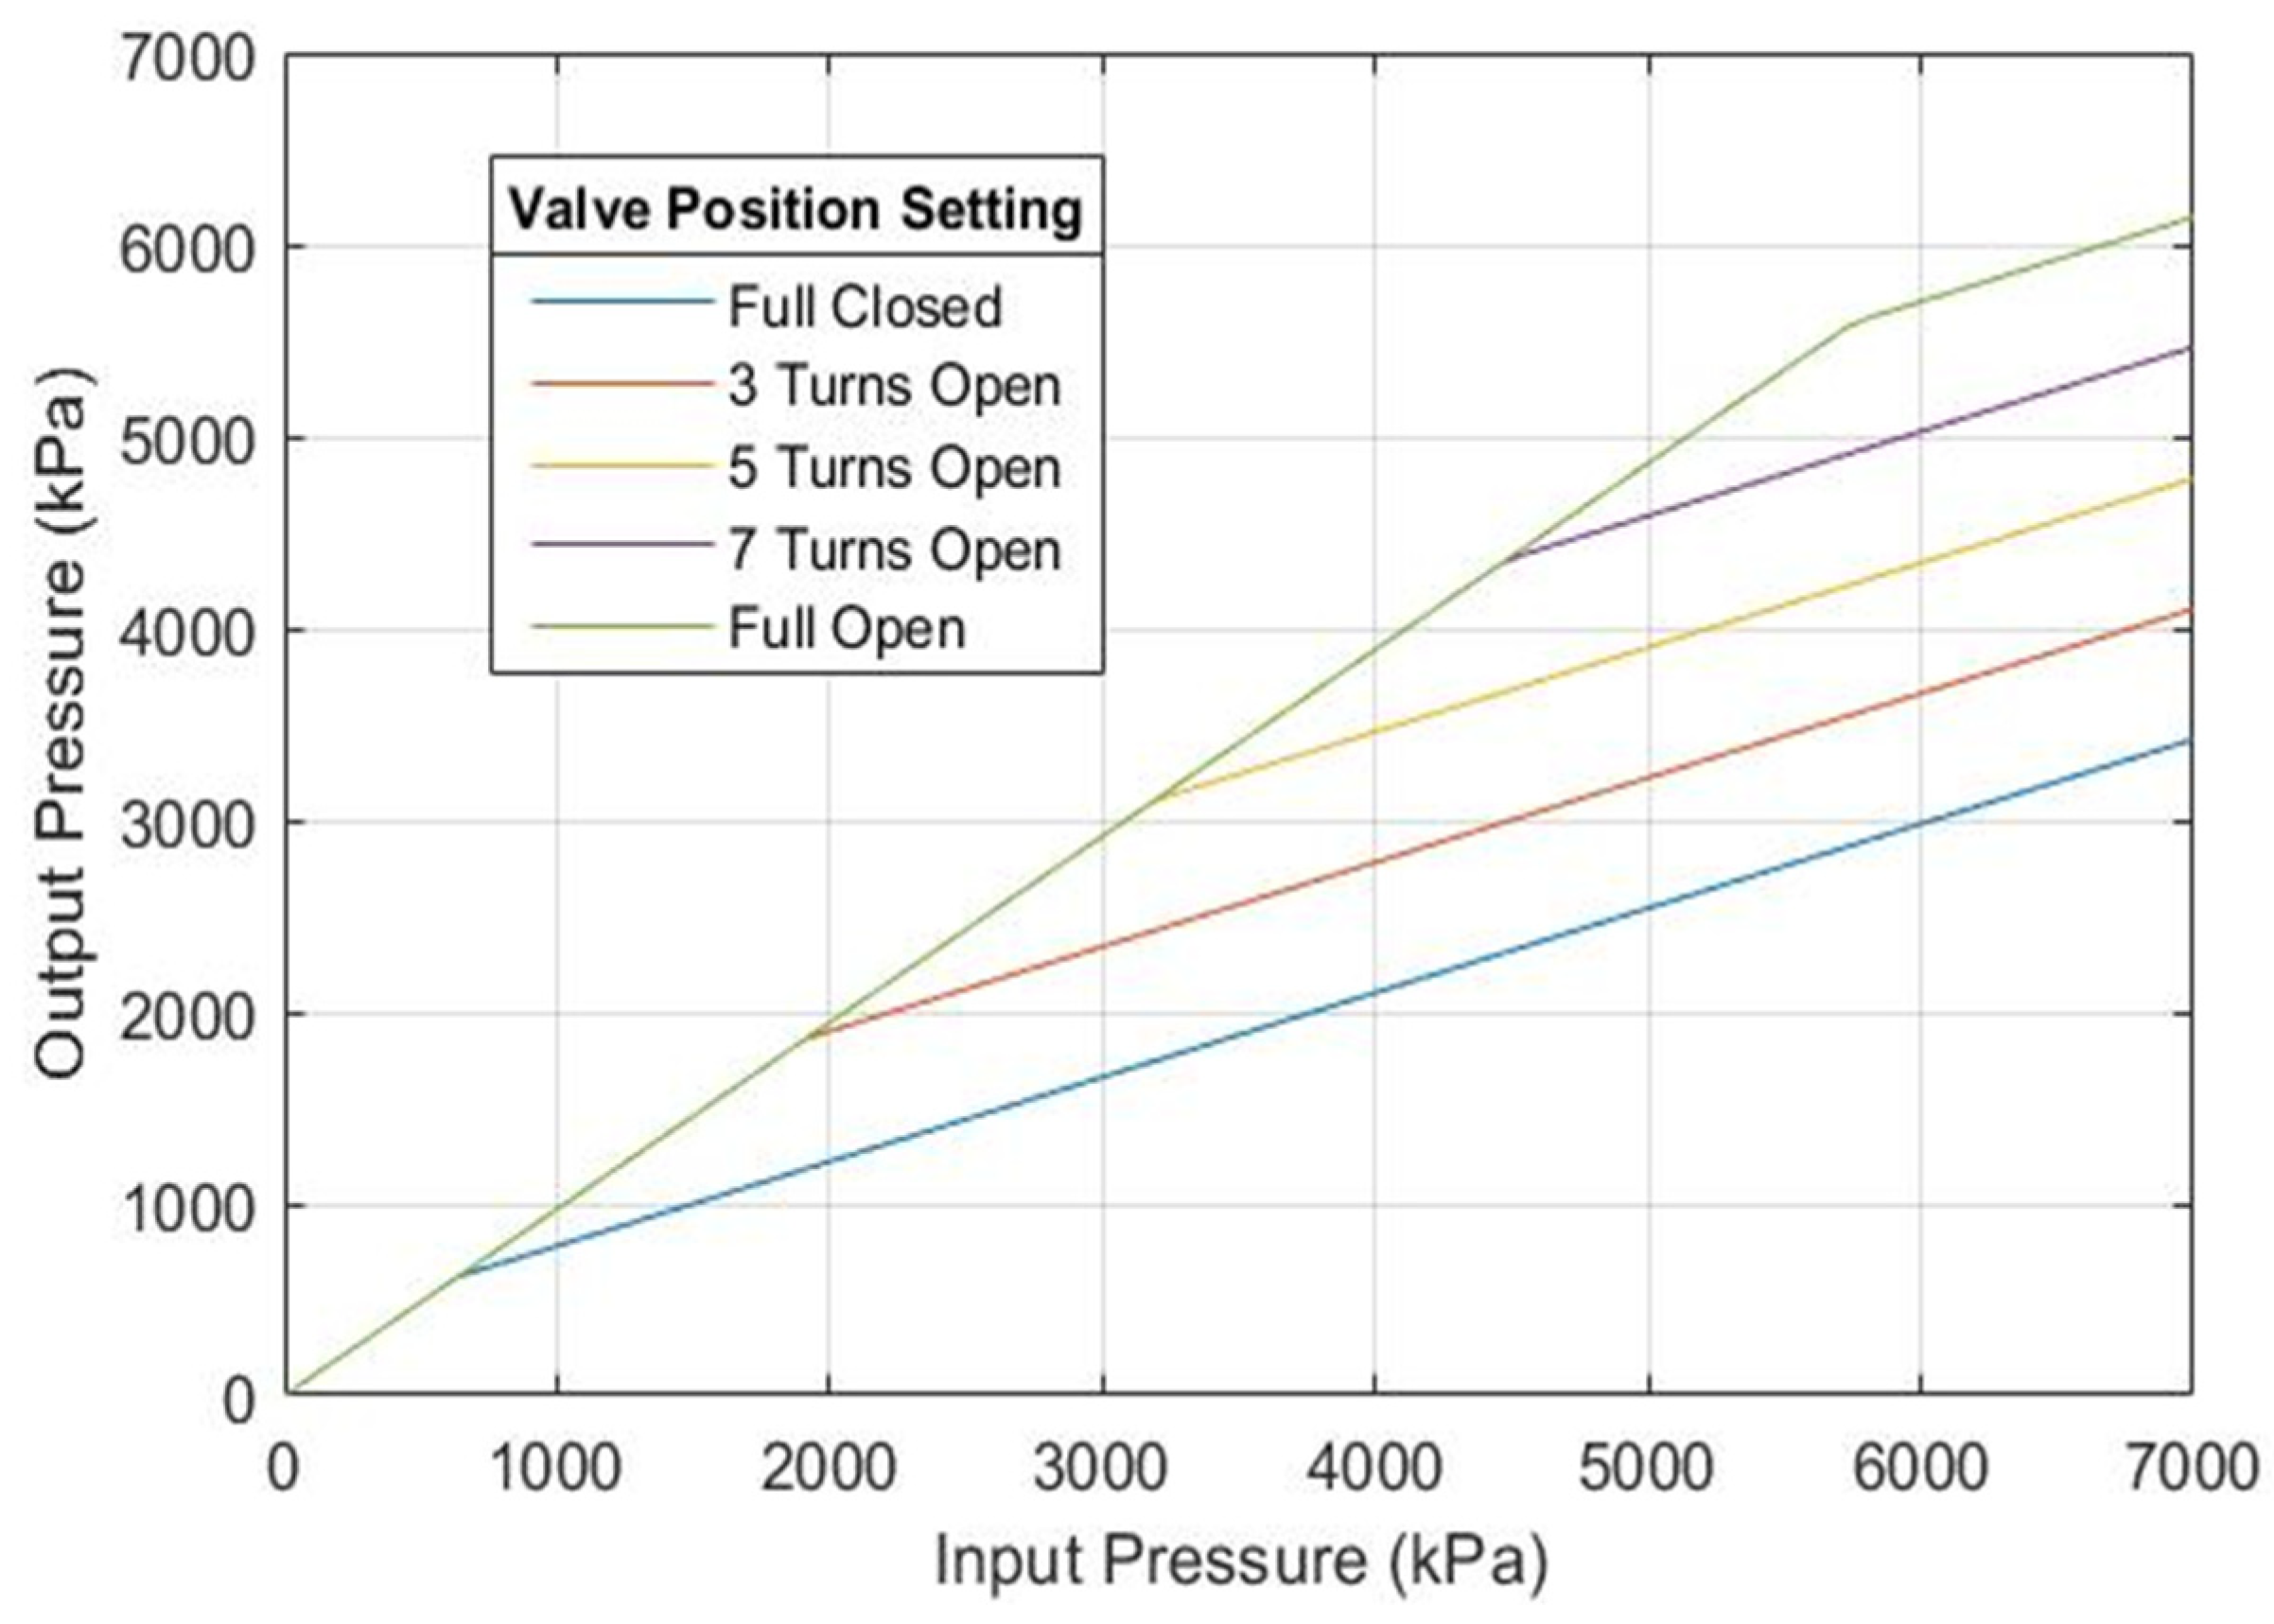
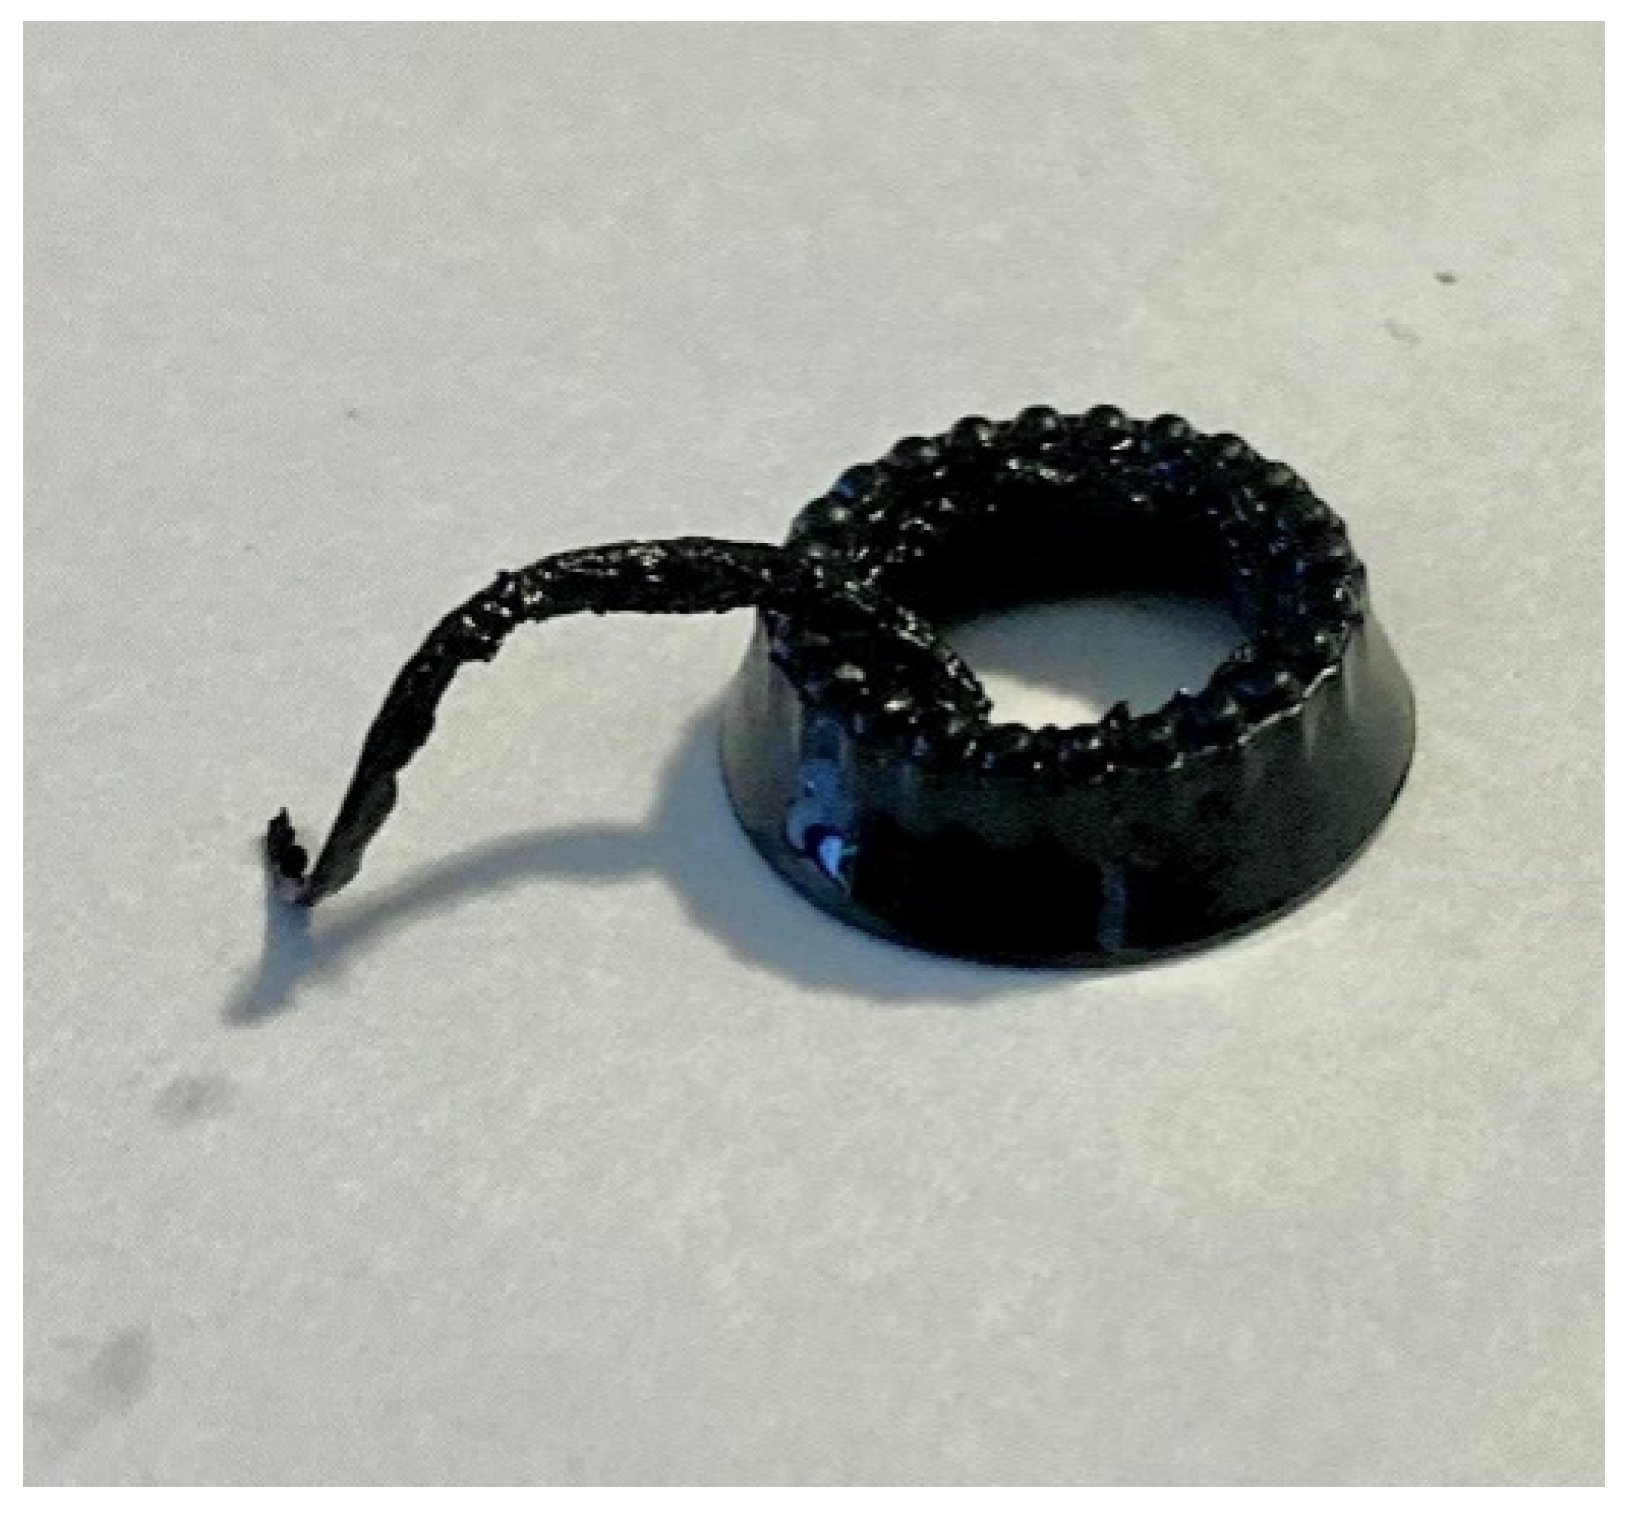
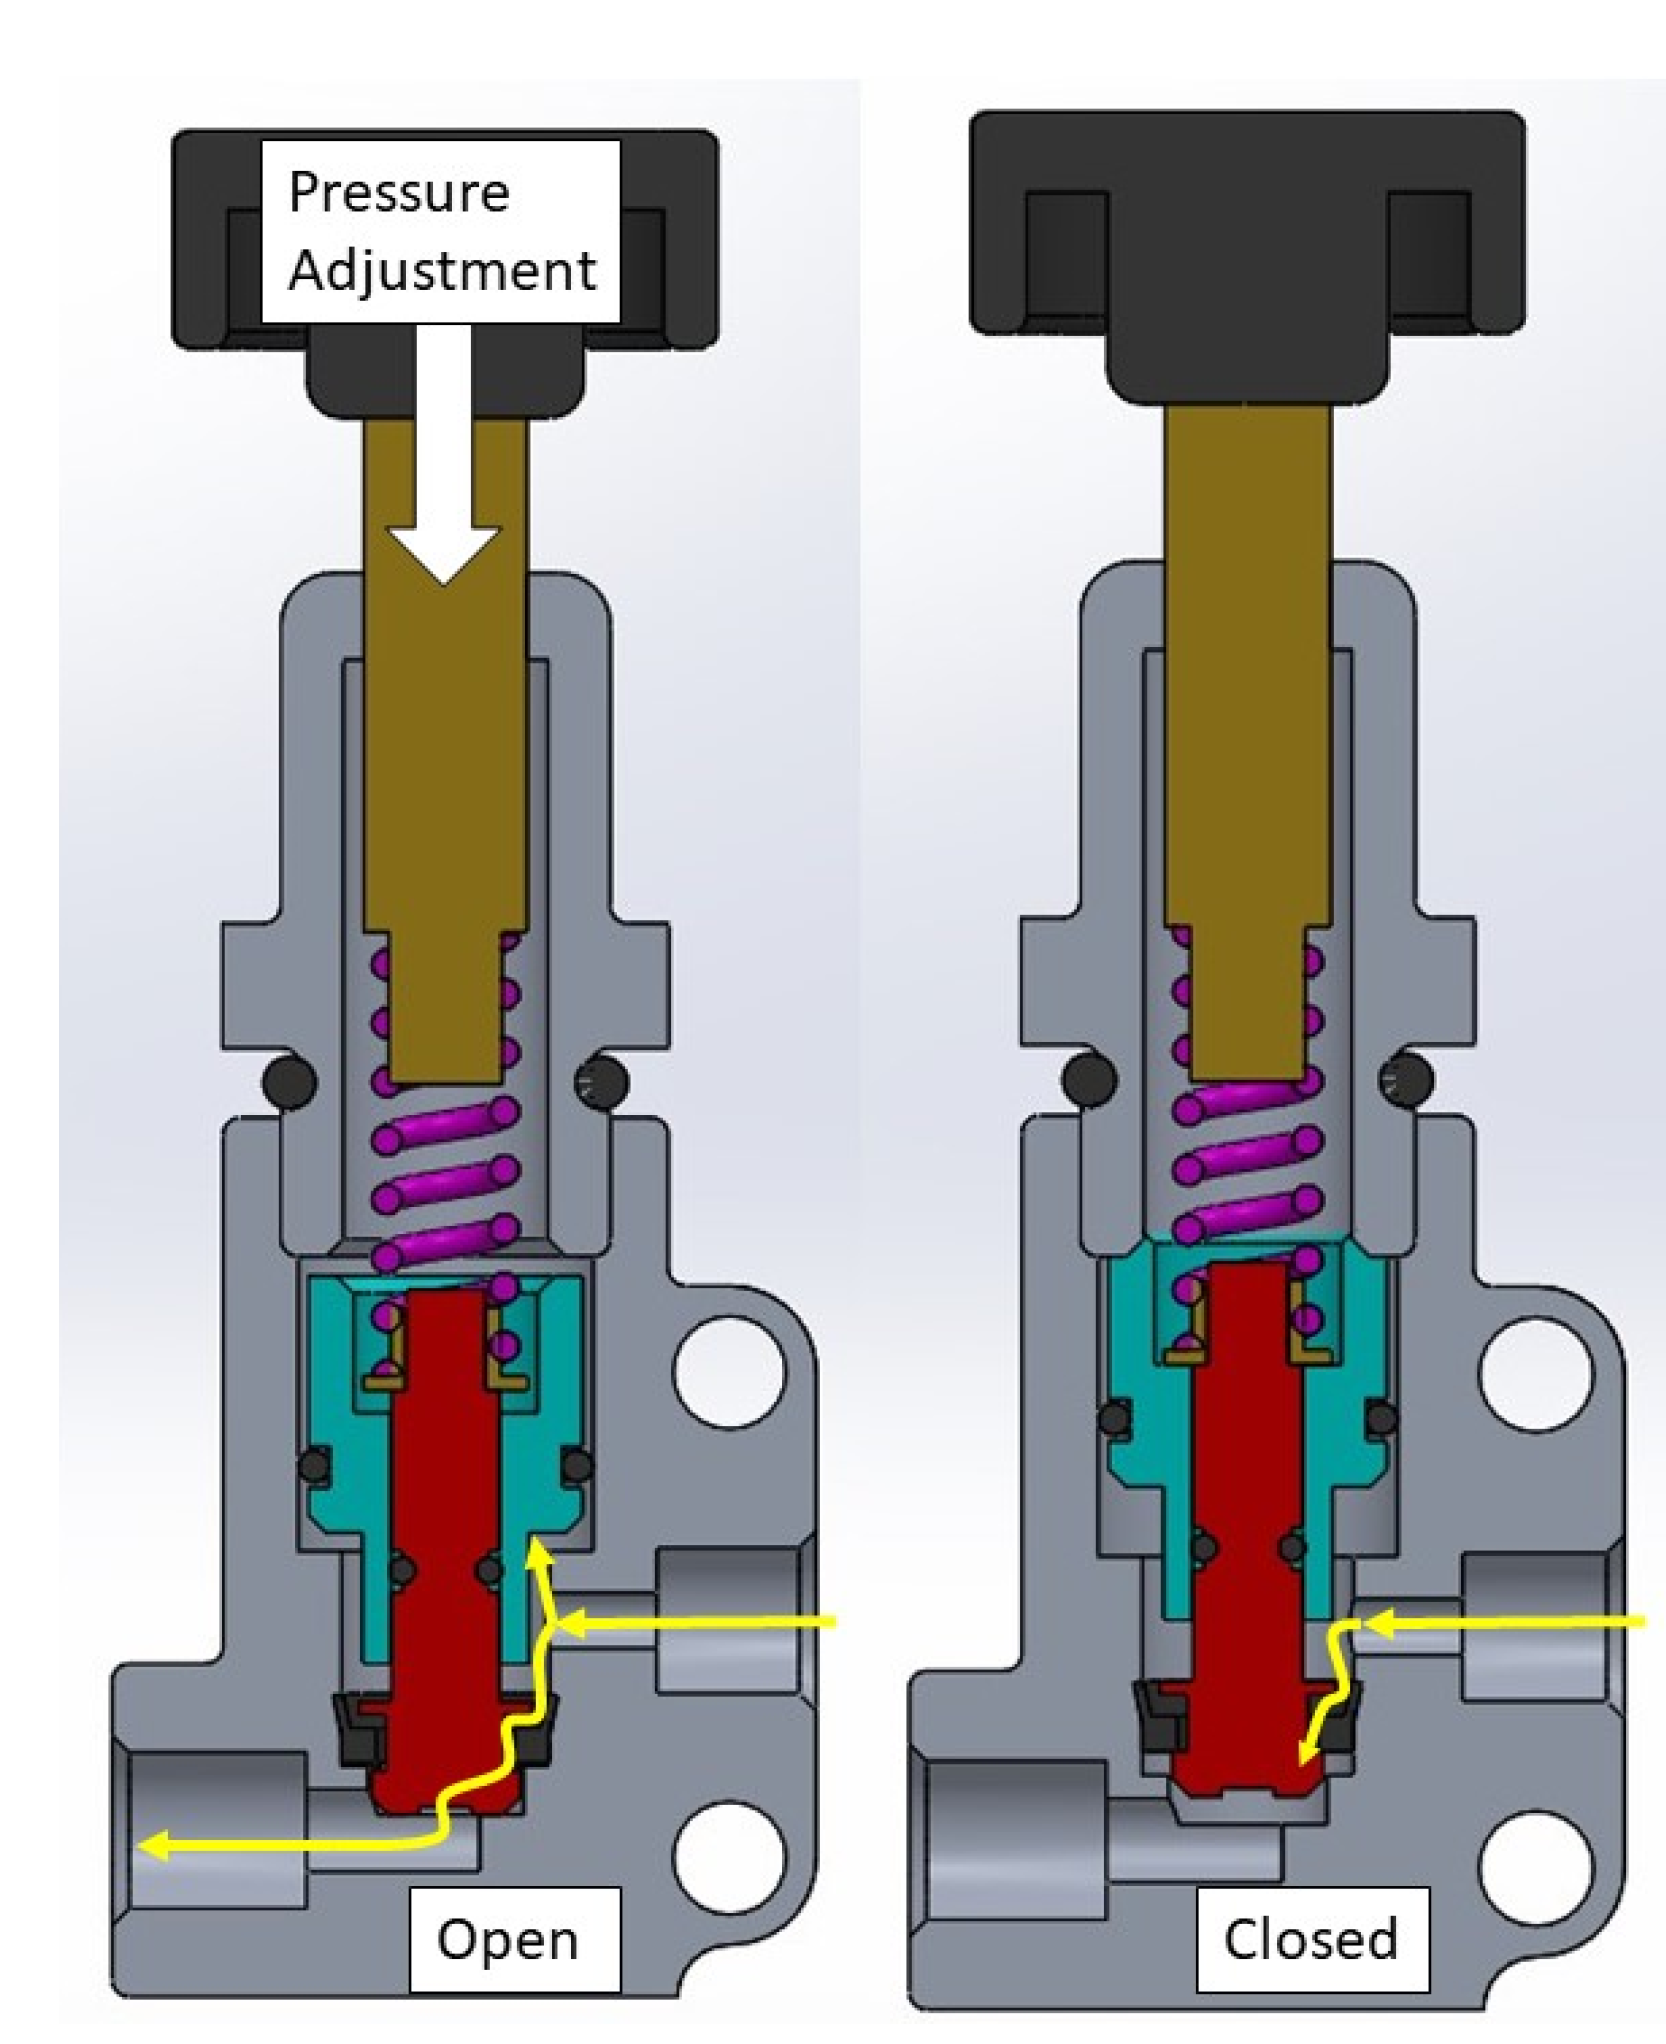
The Wilwood 260-8419 valve with a proportioning pressure range of 1000 to 8000 kPa was selected for this study. The valve only weighs 147 g, which is advantageous considering the overall system design. This proportioning valve regulates pressure based on the flow path shown in
Figure A1. As the pressure in the rear brake line increases, the blue cylinder compresses the purple spring, which allows the red cylinder to rise in the cavity. The red cylinder captures the bottom seal, which partially closes the valve (when partially closed, the pressure to the rear brake is 44% of the pressure to the front brake). The pressure at which the valve closes can be set by adjusting the preload on the purple compression spring. Turning the knob to the right increases rear brake pressure, and turning to the left decreases rear brake pressure.
Figure A1.
Isometric and section view of Wilwood 260-8419 proportioning valve in the open and closed position. The yellow line shows the flow path. Outlet pressure is reduced to 44% of the inlet pressure in the full closed position.
Figure A1.
Isometric and section view of Wilwood 260-8419 proportioning valve in the open and closed position. The yellow line shows the flow path. Outlet pressure is reduced to 44% of the inlet pressure in the full closed position.
An initial experiment was conducted with low-cost hardware to see what loads would be experienced if using only a single brake lever per caliper. Through this, it was determined that a 2500 N maximum compression load cell would be sufficient for the caliper force measurement. Next, a pressure gauge was installed in the system to characterize the lever force-to-pressure ratio. From this, it was determined that the hydraulic line pressure would not exceed 10 MPa at maximum lever force. The S-beam tension load cell was selected based on the ISO and CPSC standard maximum lever force of 180 N and 178 N, respectively. The selected sensor details can be found in
Table A1.
Table A1.
Sensor name, model, maximum operating range, and absolute accuracy.
Table A1.
Sensor name, model, maximum operating range, and absolute accuracy.
| Sensor | Model | Range | Accuracy |
|---|
| S-beam tension load cell | DYLY-103 | 0–300 N | ±1.5% |
| Button compression load cell | FX29 | 0–2500 N | 3.5% |
| Pressure transducer | MSP300 | 0–17.2 MPa | ±1.0% |
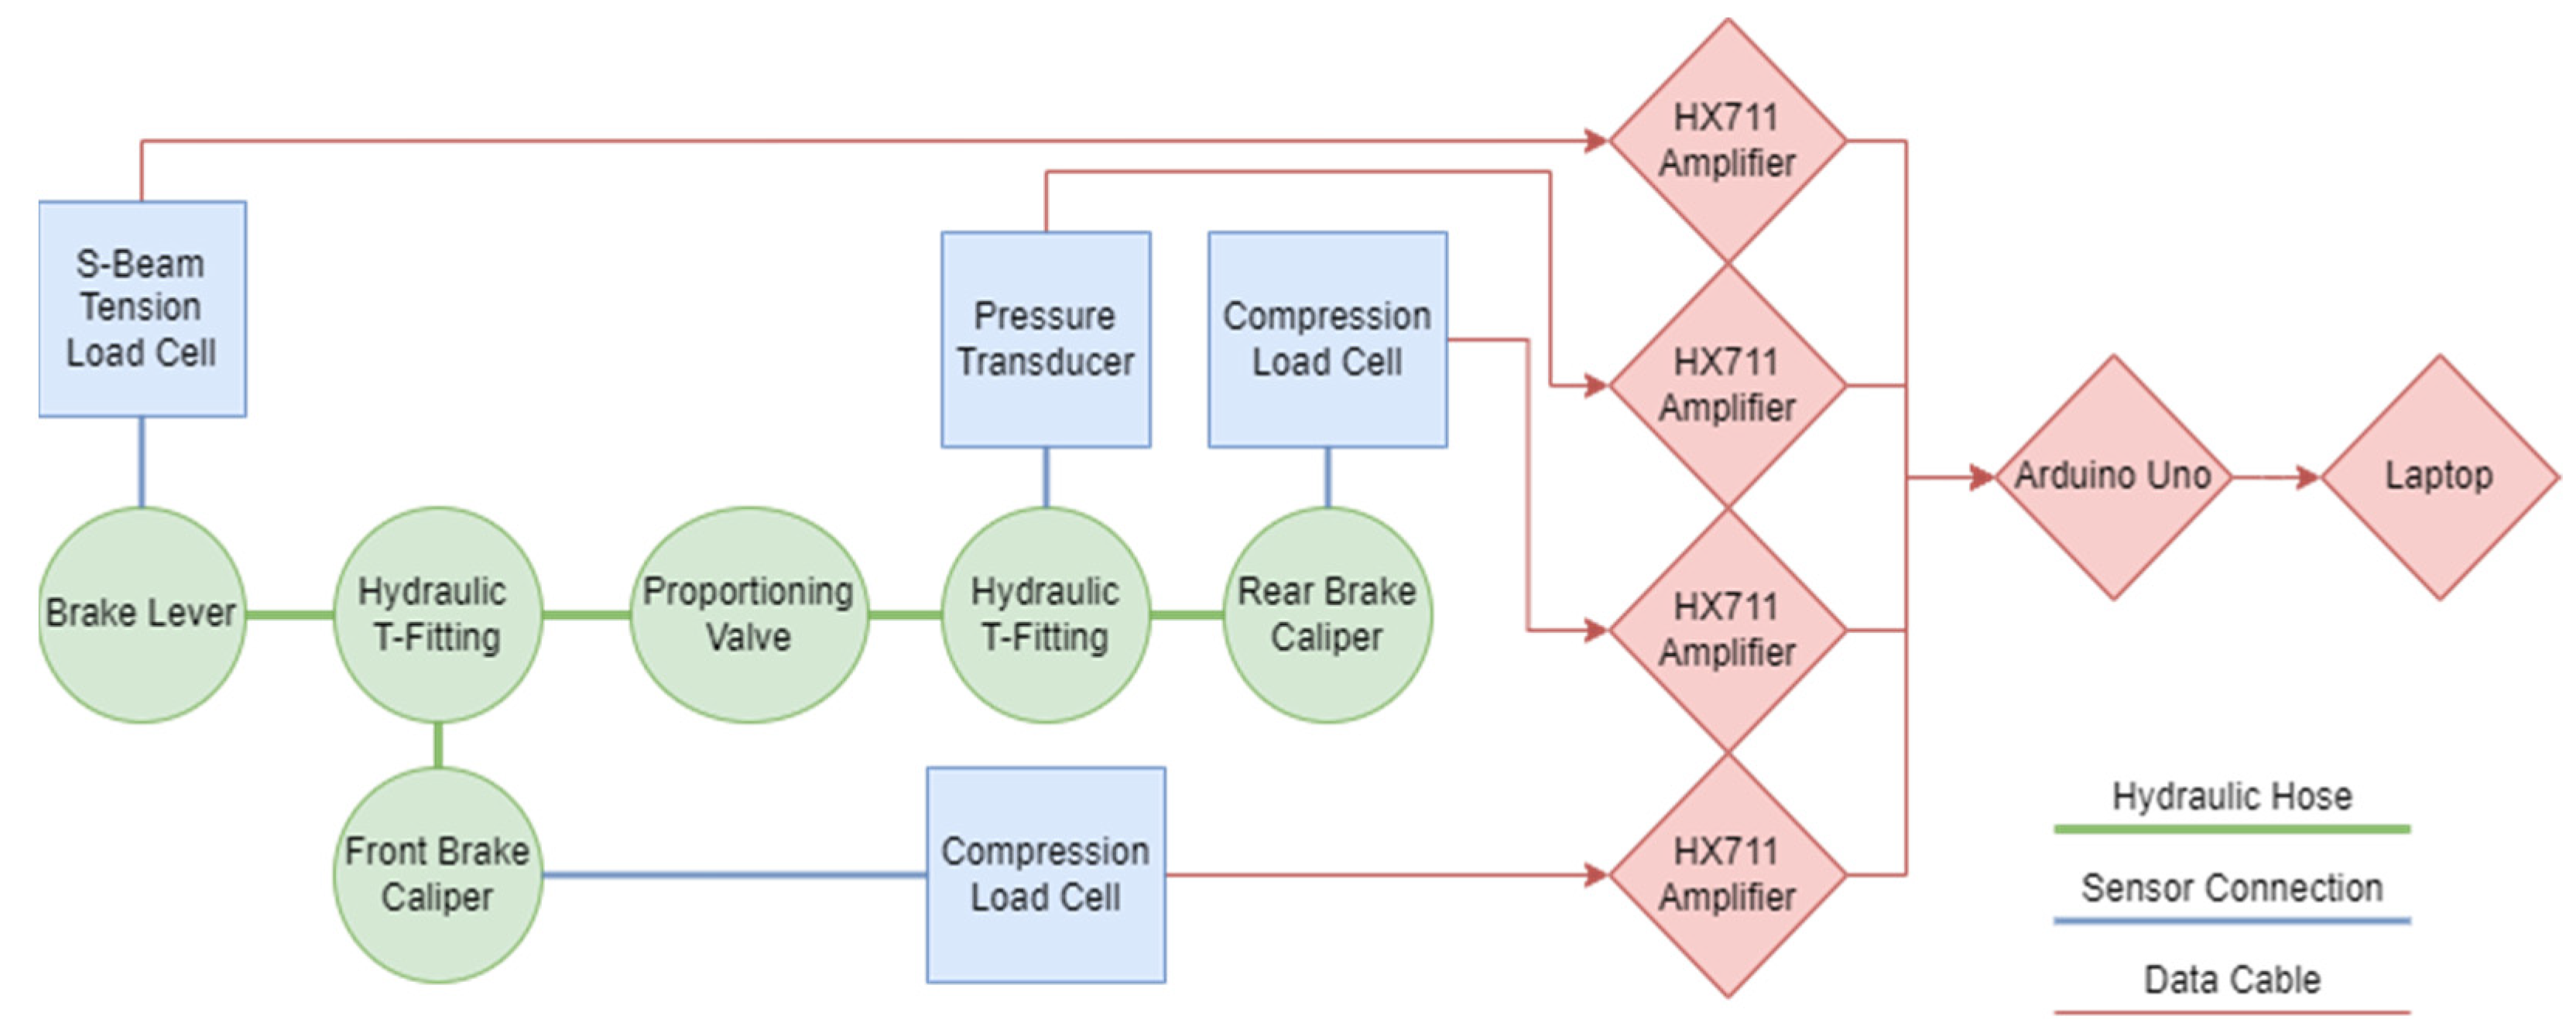
The test data was collected with an Arduino UNO R3 running through the Arduino IDE software. All four sensors output a 0 to 20 mV/V analog signal. This signal was amplified to 0 to 5 V for the Arduino through an HX711 Wheatstone Bridge Amplifier. Due to the force on each button load cell being close to the max range, the amplification signal saturated the input of the Arduino data acquisition unit. A voltage divider was used to decrease the output signal down to the 0 to 5 V range. The circuit wiring diagram is presented in
Figure A2.
Figure A2.
Circuit diagram used for the test setup.
Figure A2.
Circuit diagram used for the test setup.
The pressure transducer was calibrated with an analog pressure gauge in the same system. The tension load cell was calibrated by hanging masses of known weight, and the compression load cells were calibrated by added known mass to a custom calibration fixture.
Appendix B. Testing Results from Prototype Iterations
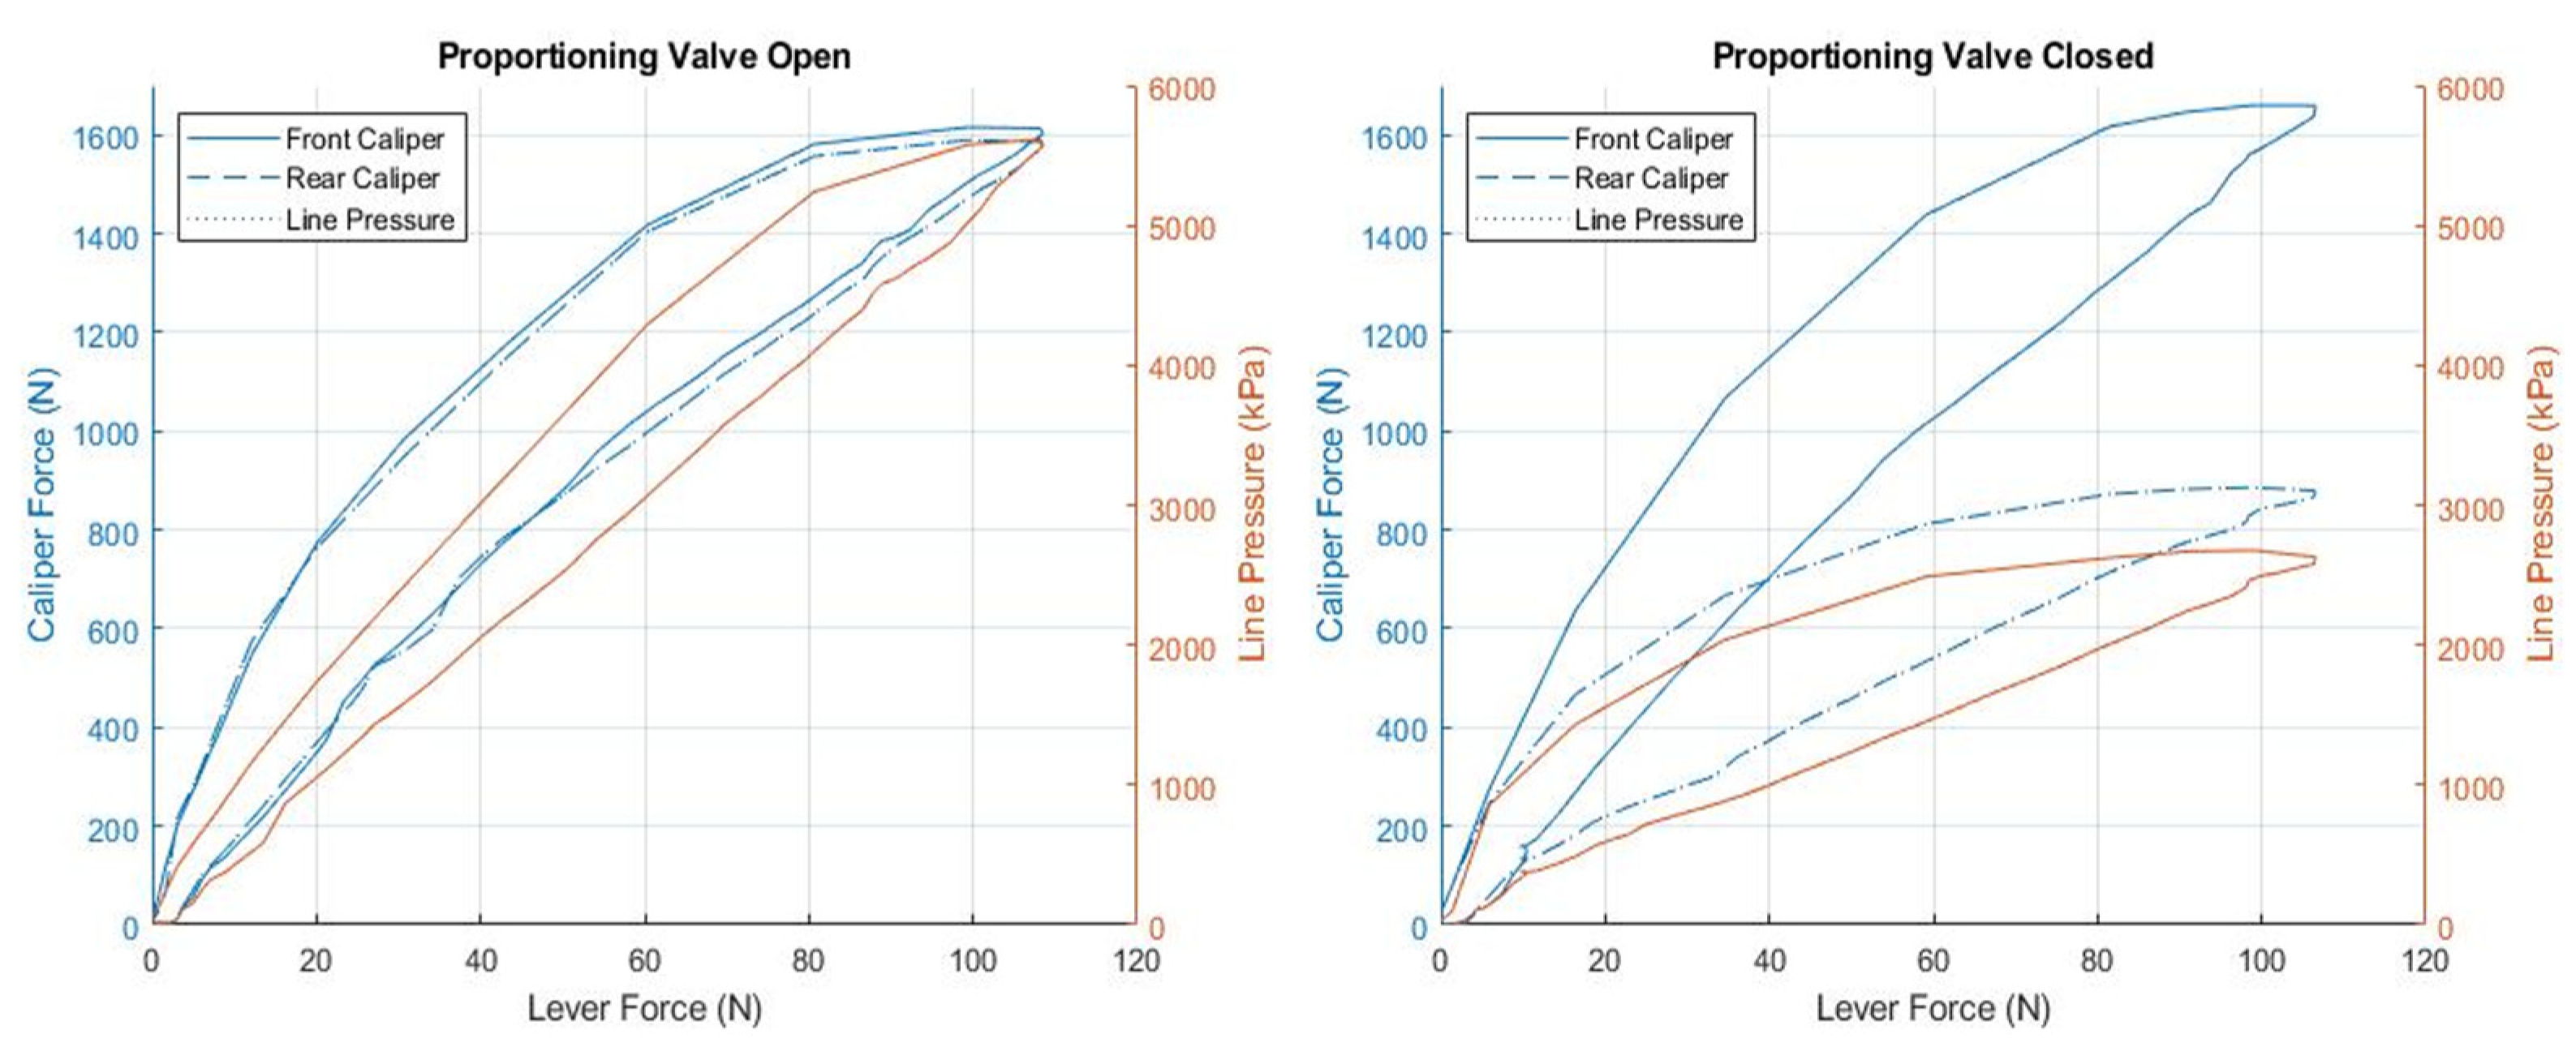
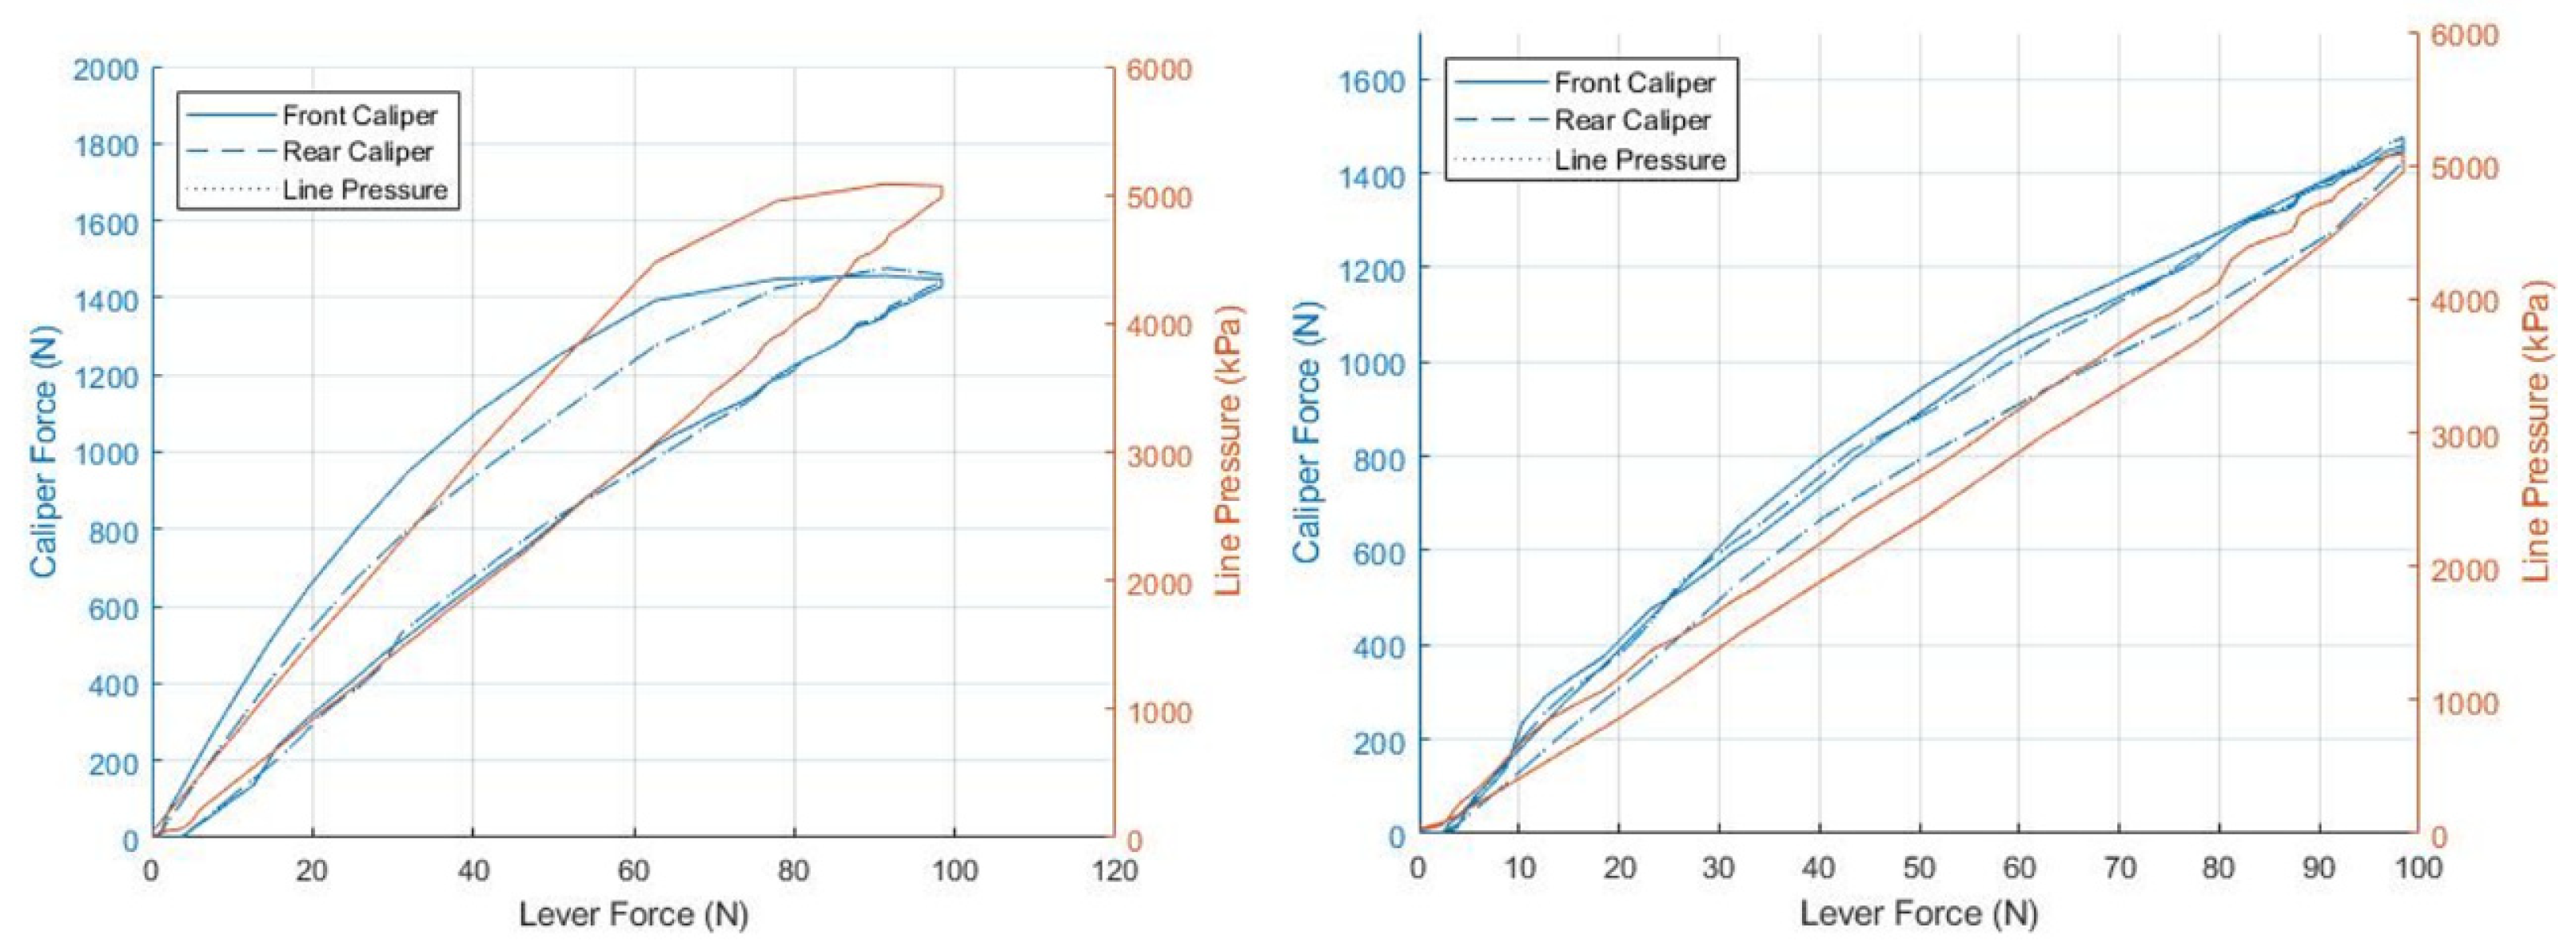
Caliper force and lever pressure as a function of lever force for the prototype system with the valve in the open and closed position are shown in
Figure A3. The advertised maximum brake pressure reduction from open to closed for this valve was 57%, and our measurements showed a reduction of 56%. This proportioning valve provides equal front and rear braking at low pressures, then decreases the caliper force at high pressures.
Figure A3.
Caliper compression force and system pressure as a function of lever force for the prototype with the proportioning valve open (left) and closed (right).
Figure A3.
Caliper compression force and system pressure as a function of lever force for the prototype with the proportioning valve open (left) and closed (right).
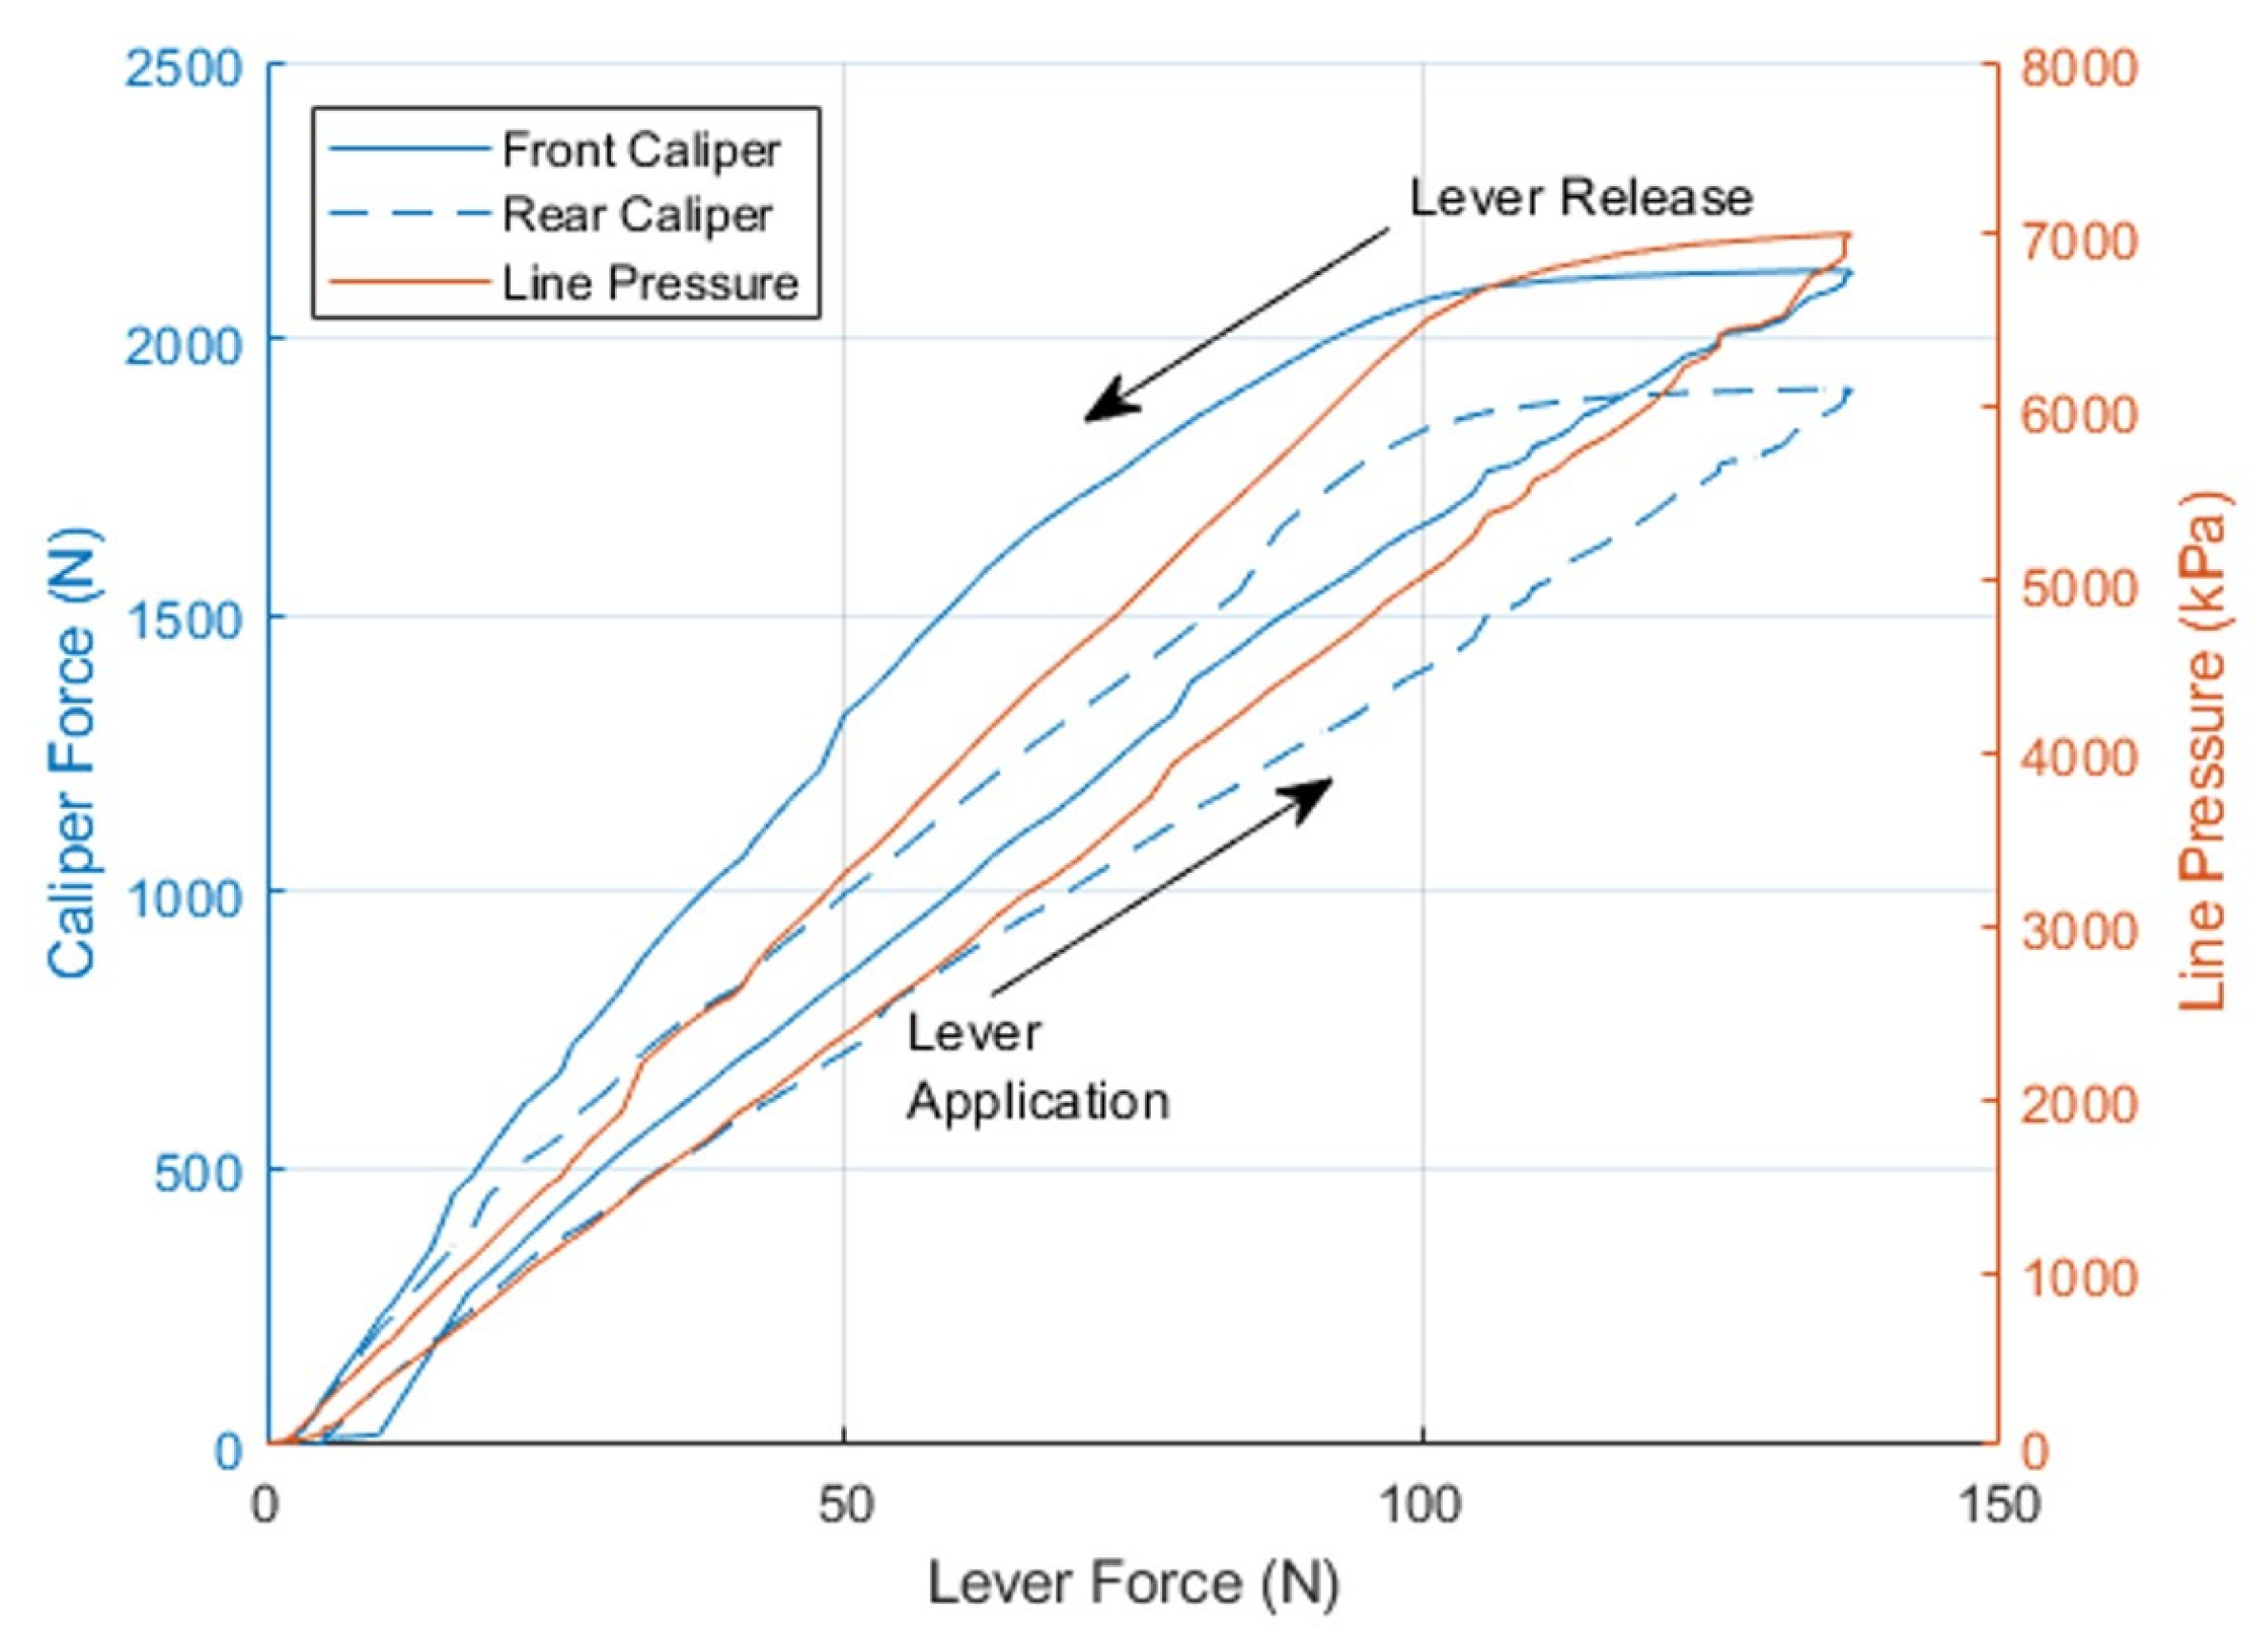
The experimental results show a different pressure profile during lever application than lever release indicating a source of system hysteresis (
Figure A4). The arrows show the direction of the hysteresis loop for both lever application and lever release. Rotor-to-pad spacing, pressure transducer expansion, trapped air, hose expansion, viscous drag, piston retraction, and sensor restoration delay were all investigated as potential reasons for the hysteresis displayed in the results.
Figure A4.
Caliper force and line pressure as a function of lever force. The arrows show the direction of the hysteresis loop.
Figure A4.
Caliper force and line pressure as a function of lever force. The arrows show the direction of the hysteresis loop.
The first hysteresis variable to be eliminated was rotor-to-pad spacing. This is defined as the air gap between the brake pads and the brake rotor. If there is a mismatch between the gap in the front brake setup and the rear brake setup, then one brake caliper will engage the brake rotor before the other. Not only will this cause a situation where there is a differential pressure between the calipers during lever application and lever release, but this could also change the level of proportioning depending on the air gap. Multiple tests were run with varying rotor-to-pad measurements by inserting shims between the caliper and the pad. For all iterations of the rotor-to-pad spacing, the hysteresis did not change.
Another potential cause of hysteresis in the results was an expansion from the pressure transducer. If the pressure transducer changes volume as a function of pressure, anytime pressure is decreased, the volume may not be restored in the same amount of time due to material properties, thus causing the hysteresis loop. This was tested by removing the pressure transducer and then running the same test again; however, the results did not change.
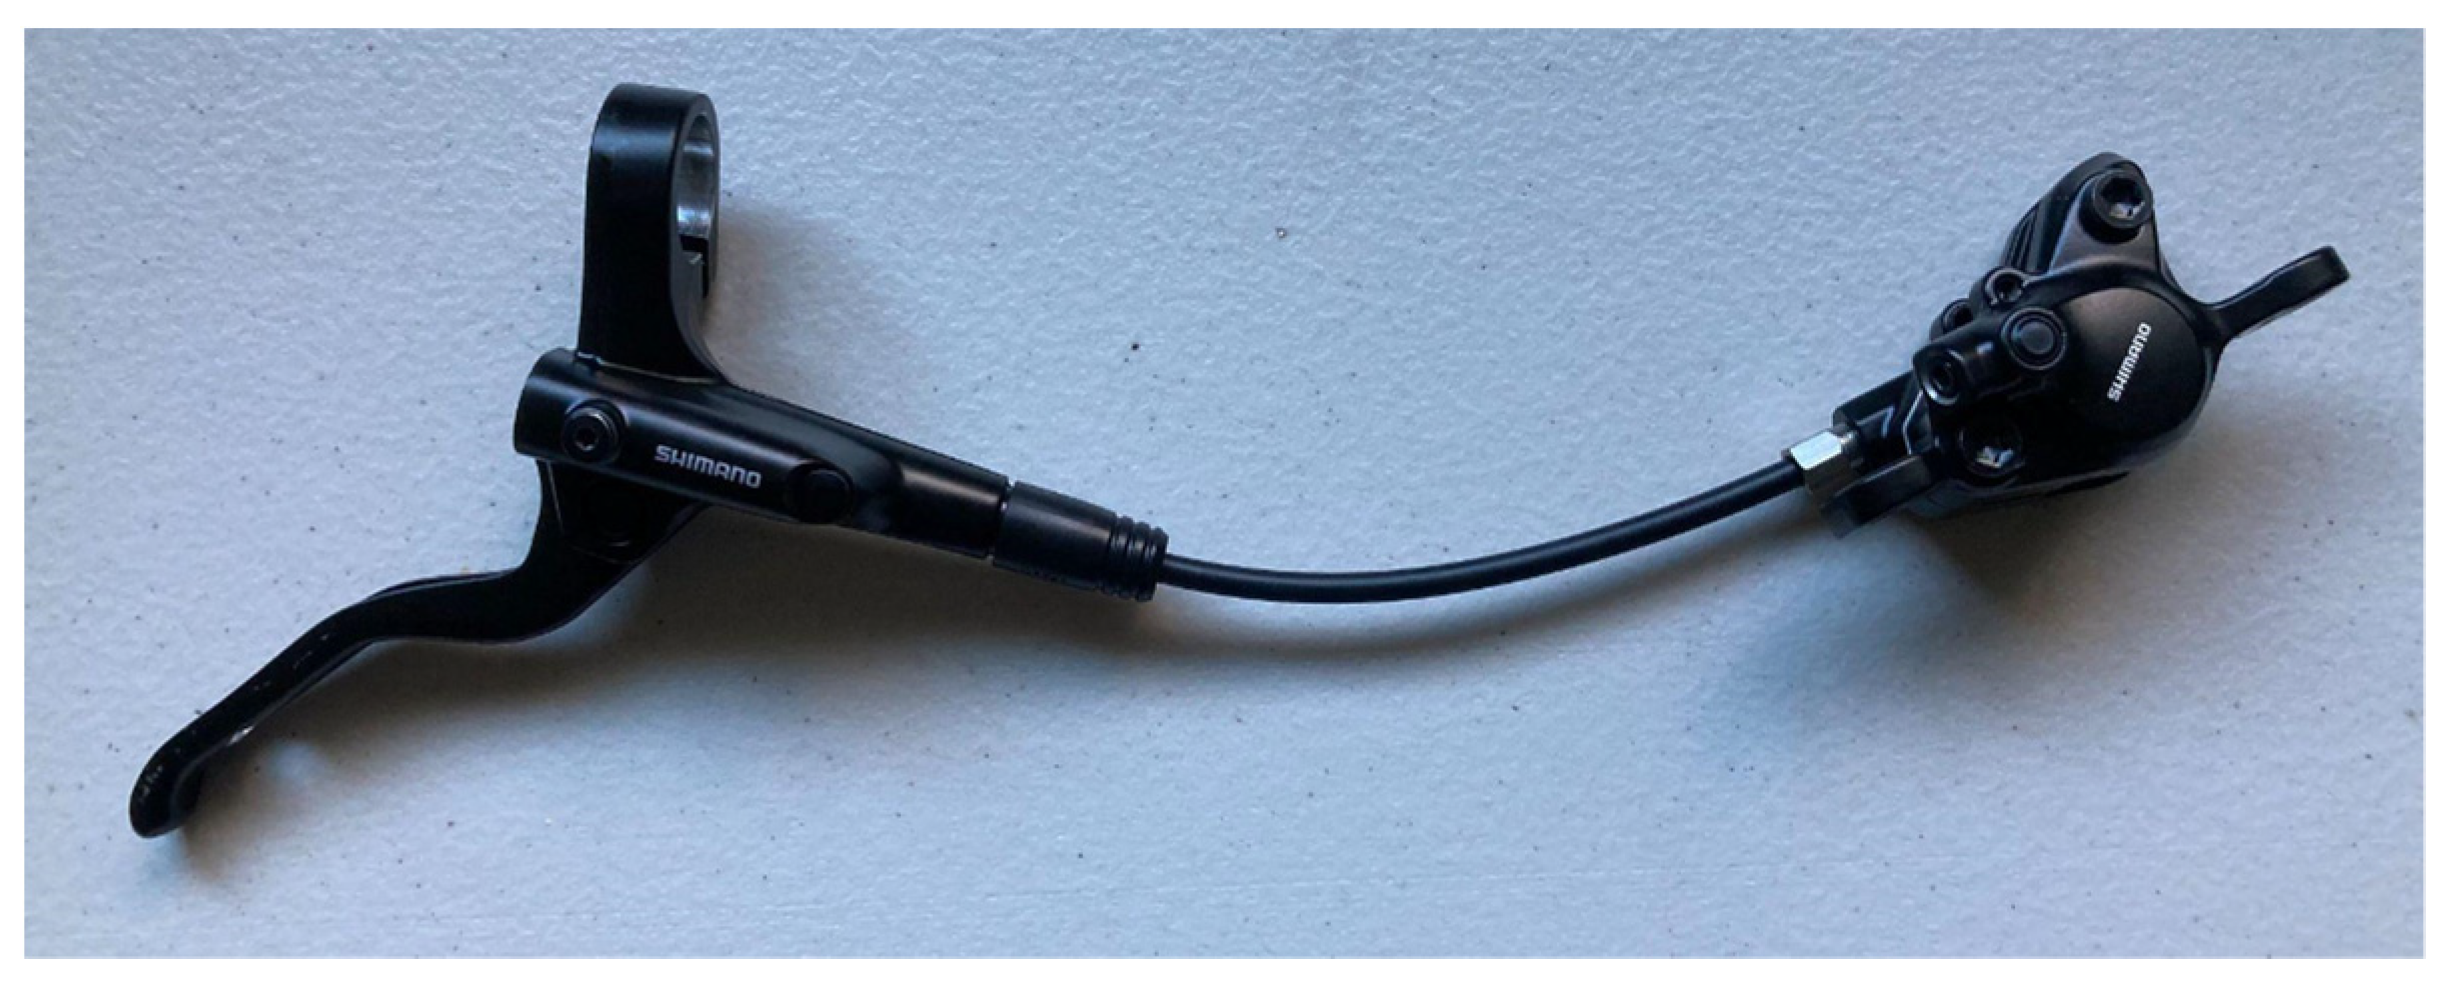
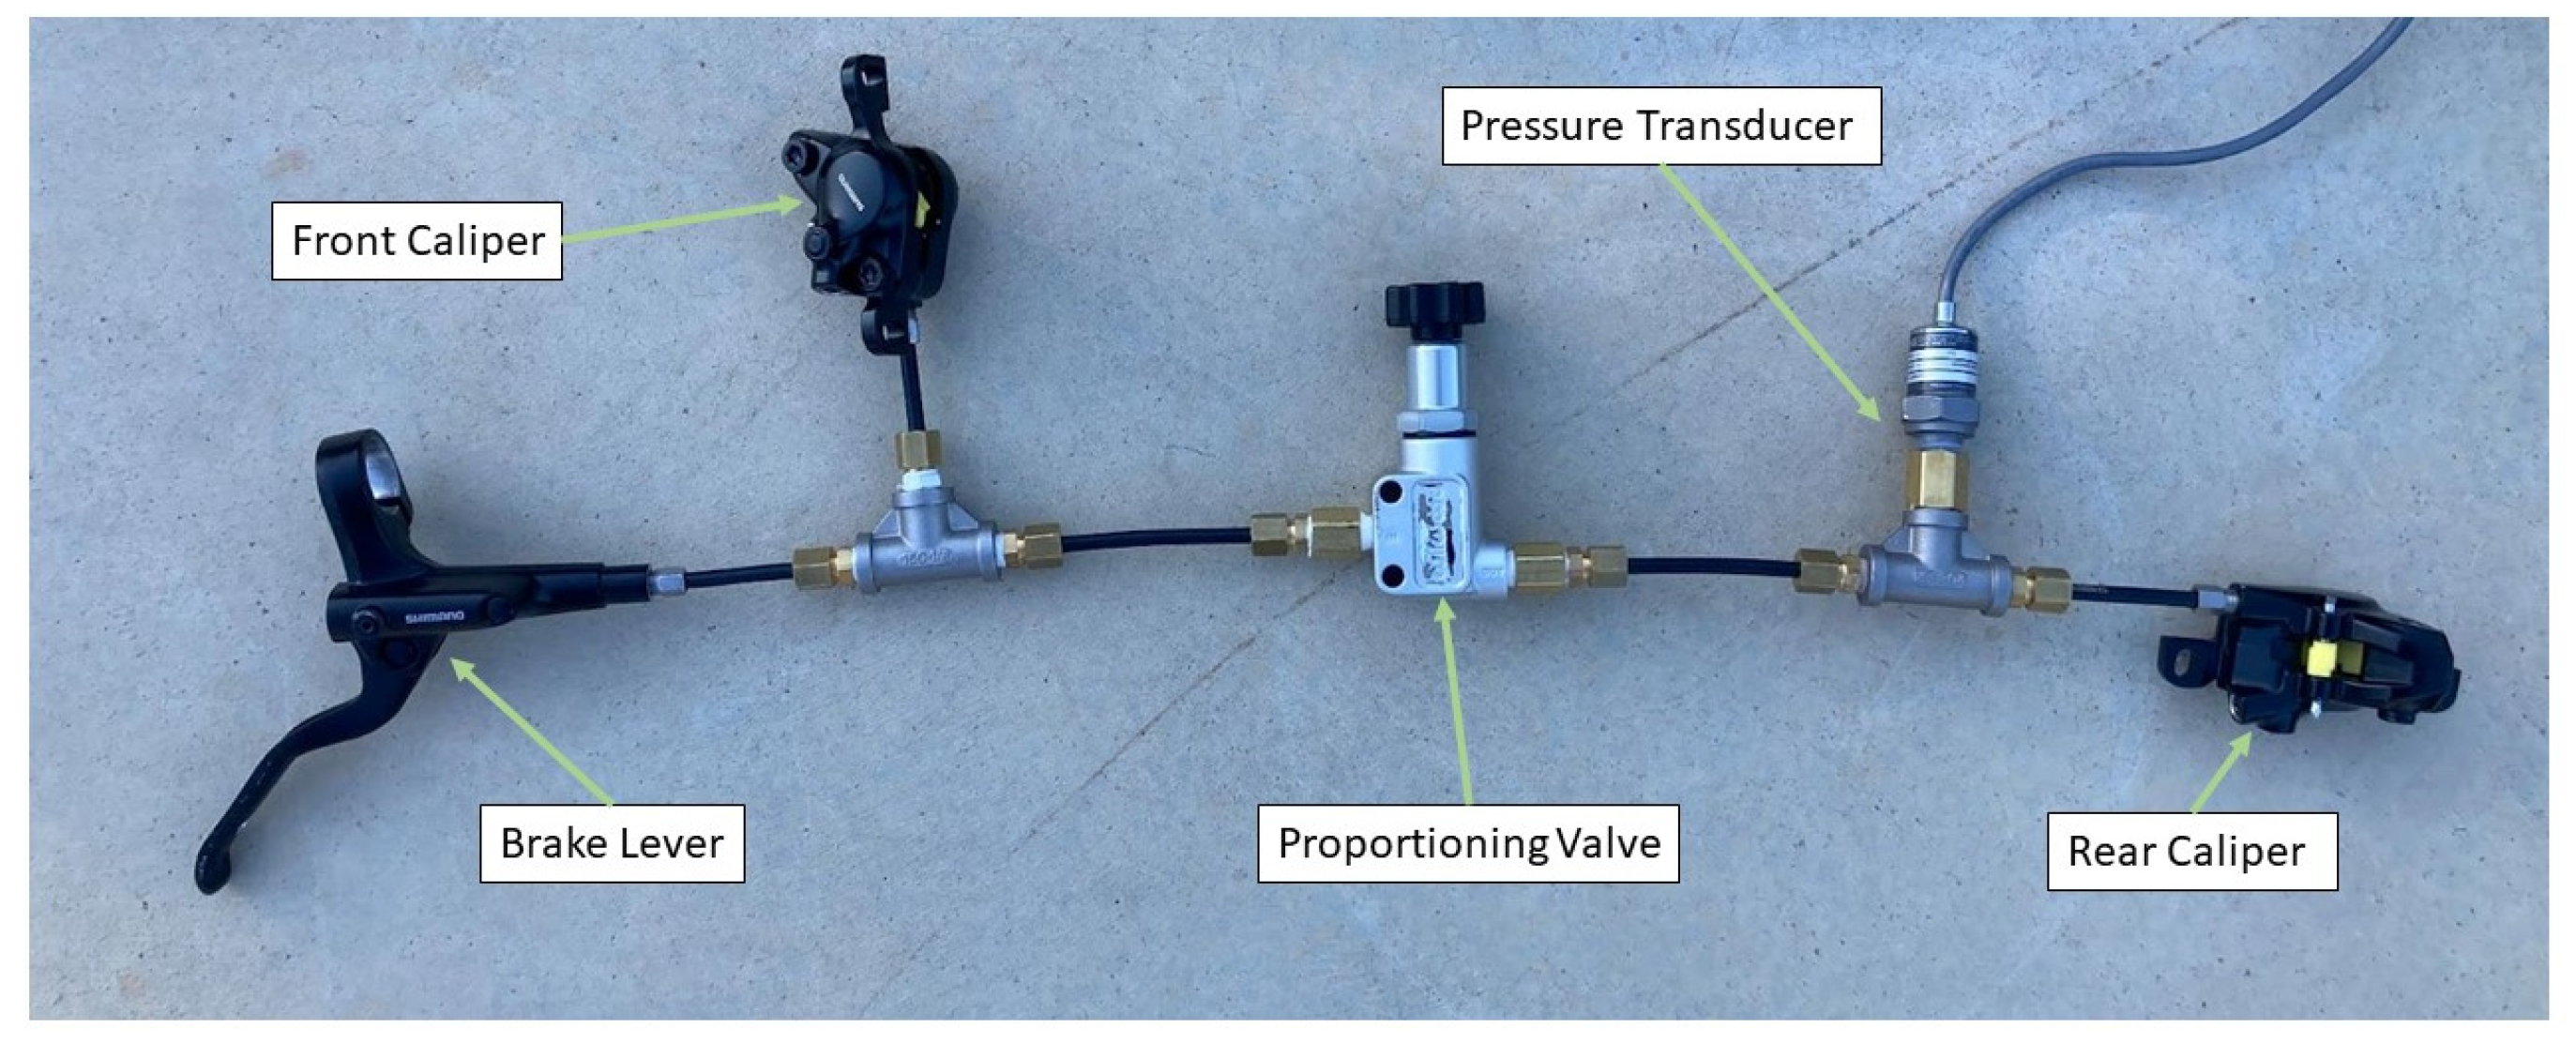
This hysteresis can also occur when there is air trapped in the system. The air pockets are compressed before the system pressure increases and then expand when the system pressure is released. A time delay between lever release and pressure decrease occurs when these air pockets expand, potentially causing the hysteresis loop. This was eliminated as a potential source of hysteresis by using the shortened test setup shown in
Figure A5. This shortened brake system decreases the chances of having air trapped in the system; however, there was no change in the results.
Figure A5.
Shortened brake system to eliminate potential hysteresis due to trapped air and hose expansion.
Figure A5.
Shortened brake system to eliminate potential hysteresis due to trapped air and hose expansion.
A shortened brake system also decreases the potential hysteresis due to hose expansion. At high lever force, the hose can expand, which increases the system volume and decreases the output force. As the lever is released, the line pressure stays elevated as the hose contracts, and the system volume decreases, but, as before, there was no change in the results.
Another culprit may be viscous drag creating a time delay in pressure response. As the fluid flows through the hose, it takes time to flow, so the decrease in pressure is not instantaneous. To test this, different lever application speeds were investigated, with no change in the results. Another form of drag in the system comes from the piston seals. As the pistons retract, the drag from the seals can cause a time delay in the pressure decrease, potentially causing the hysteresis seen. This was tested by shimming the system so that there was no piston displacement; however, there was still no change in the results.
The details of the final iteration of the prototype are available in
Section 4.2.


