Article

A Study on the Material Composition and Traceability of the Wellhead Blockage in the Process of Oil and Gas Exploitation—A Case of the DH231 Well in the Tarim Basin, China

1
College of Resources, China University of Geosciences, Wuhan 430070, China
2
Key Laboratory of Oil and Gas Geochemistry and Environment in Hubei Province, Yangtze University, Wuhan 430100, China
3
Research Institute of Experimental Detection, Tarim Oilfield Company, PetroChina, Korla 841000, China
*
Author to whom correspondence should be addressed.
Appl. Sci. 2023, 13(3), 1504; https://doi.org/10.3390/app13031504
Submission received: 15 November 2022 / Revised: 28 December 2022 / Accepted: 19 January 2023 / Published: 23 January 2023
(This article belongs to the Section Chemical and Molecular Sciences)

Abstract

:
The formation of wellhead blockage increases operating costs and seriously affects the safe production of oil wells. It is crucial to correctly analyze the blockage composition and determine the reasons for wellhead blockage to improve the production efficiency of oil wells. In this study, the material composition and origin of the wellhead blockage in Well DH231 are systematically investigated by means of a thin-section observation, scanning electron microscope, energy spectrum analysis, and molecular geochemical characterization of organic matter. The results show that the wellhead blockage in Well DH231 consists of organic and inorganic materials. The inorganic material was mainly composed of dolomite, fine sand, and unknown black minerals. Four elements, Fe, O, Na, and Cl, could account for 95% of the total elemental content in the unknown minerals. It is speculated that they may have come from rust on the metal parts of the inner wall of the wellbore while being influenced by groundwater during the formation process. The organic matter in the blockage was an oil stain from the geological body. The coexistence of n-alkanes and 25-norhopanes in the oil stain was obvious. It indicated that the oldest crude oil in Well DH231 experienced severe biodegradation, followed by the secondary injection of hydrocarbons. The distribution characteristics of hopanes and steranes in oil stains in Well DH231 were comparable to those of the carboniferous crude oil in neighboring Wells DH4 and DH5. The oil stains in the wellhead blockage may be the product of oil and gas migration in Wells DH4 and DH5.

1. Introduction

The Donghetang oil field is located in Kuche County, Xinjiang [1]. Additionally, it is the first marine sandstone oilfield discovered in China that is rich in high-abundance oil and gas, and is highly productive. Its discovery is a significant breakthrough in the theory and practice of oil and gas exploration in China’s marine sandstones [2]. It has kicked off the exploration of marine sandstones in the Tarim Basin, especially the Donghe Sandstone [3,4]. The exploration and development of the Donghetang field is of great significance to oil and gas exploration and the development of the Tarim oilfield [5].
Well DH231 is the latest appraisal well drilled in the Donghetang oilfield in recent years (2021). In the process of oil and gas extraction, there are many blockages formed around the wellhead. The phenomenon is not only observed in Well DH231 in the Donghetang oilfield, but also in Bozi 12, Keshen 506, Yudong 707, FuYuan 104 Wells, etc. The blockage is black powder before acidification, and black sludge after acidification. The formation of large blockages dramatically affects the efficiency of oil and gas extraction and the safety of oil-well production. Therefore, it is crucial to analyze the material composition and source of wellhead blockages to eliminate their formation.
To date, there is no unified understanding of the composition of wellhead blockages [6,7]. In previous studies of wellhead blockages, the method of “acid dissolution determination and analysis of ionic components in the residual acid” was used to identify the composition of the blockage [8]. This method is relatively complicated, can only analyze common salt minerals, and the accuracy needs to be improved. With the continuous improvement of equipment for rock and ore testing, many researchers have quantitatively characterized the macroscopic and microscopic compositions of the blockage. Luo et al. (2018) analyzed the blockage in the wellbore of the Yuanba gas field with an X-ray diffractometer and infrared spectrometer. The results showed that the blockage was mainly by pyrolysis products of calcium carbonate, iron sulfide, and a corrosion inhibitor [9]. Jiang et al. (2020) conducted X-ray diffraction analysis on blockages in high-pressure gas wells in the Kela 2 gas field, and used a combination of macroscopic and microscopic methods to determine the composition and proportion of substances in the blockages. It was concluded that inorganic substances predominated in the blockage in high-pressure wells in the Clark 2 gas field [10]. Li et al. (2022) used Fourier transform ion cyclotron resonance mass spectrometry to analyze the differences in the chemical composition of asphaltene in crude oil and wellhead blockage extracts from the Gao Tan 1 Well on the southern edge of the Junggar Basin, and explored the relationship between asphaltene structure and asphaltene deposition [11]. From the previous research methods, the combination of multiple analytical techniques can effectively dissect the material composition of the blockage. However, from the analysis results, there are significant differences in the material composition of the blockage in oil and gas wells drilled in different geological conditions. Therefore, it is difficult to apply the blockage composition research of other wells to the DH231 Well. It is necessary to conduct a more in-depth study on the composition of the wellhead blockage in Well DH231 [12].
In this study, the composition of the blockage in Well DH231 is analyzed by means of thin-section identification, scanning electron microscope, energy spectrum analysis, and the molecular geochemical characterization of organic matter. The possible origins of each component of the wellhead blockage are explained. This research is expected to provide guidance for clearing wellhead blockages.

2. Geological Setting

The Donghetang oilfield is an essential oil and gas production area in the Tarim Basin (Figure 1), and oil and gas have been discovered in the Carboniferous, Jurassic, and Paleogene Periods [13]. Devonian Donghe sandstone and the Jurassic strata are the two most important reservoir groups in this area [14]. There are two groups of oil-bearing layers developed vertically in the Jurassic: from top to bottom are JIII and JIV oil layers. The crude oil in the Donghetang oilfield mainly comes from the marine source rocks of the Middle and Upper Ordovician. The Late Hercynian and Late Himalayas were significant oil and gas charging periods [15].
The Donghe 23 trap is located in the Donghetang fault zone on the northwest margin of the Lunnan low salient in the Tarim Basin. The Donghetang fault structural zone is situated in the Tabei uplift (Figure 1). The north is the Kuche oil-bearing sag, and the south is the hydrocarbon generation center of the marine hydrocarbon source rocks in the Mangar sag. Well DH 231 is an appraisal well located in the Donghe 23 trap. To date, only one well has been drilled within the trap. The appraisal well was originally designed to penetrate the JIII formation and to explore the distribution of hydrocarbons in the JIV formation (Figure 2). Reservoir heterogeneity is strong, and local low-permeability reservoirs have developed. The target layer of Well DH231 is generally the oil permeable layer with medium and low porosities.

3. Materials and Methods

3.1. Reagents and Materials

The blockage collected at the wellhead of Well DH231 was black powder (Figure 3) with a faint smell of hydrogen sulfide and crude oil. To better analyze the source of organic matter of the blockage in Well DH231, four crude oil samples from adjacent wells were selected to compare the characteristics of the biomarkers. Crude oil samples were taken from Wells DH30, DH4, DH5, and DH601, respectively. The type of crude oil is carboniferous marine phase crude oil.
A total of 15% dilute hydrochloric acid was prepared from concentrated hydrochloric acid and ultrapure water. Analytical grade n-hexane, dichloromethane (DCM), methyl alcohol, chloroform, and petroleum ether were purified by fraction distillation. Solvent purity was monitored by the GC-MS analysis of equivalent amounts used in the separation techniques. Neutral aluminum oxide (Merck, 100~200 mesh) was activated at 400 °C in a muffle furnace for five hours and kept an even temperature of 120 °C before use to improve the adsorption of neutral alumina on different biomarkers. Disposable flint glass Pasteur pipettes of 180 mm in length, with an inner diameter of 7 mm, were used as standard columns.

3.2. Samples’ Pre-Treatment Methods

3.2.1. Acidification of the Blockage

The blockage was acidified with 15% dilute hydrochloric acid, and the effect of acid action on the organic matter composition of the wellhead blockage was verified. Changes in organic matter content and biomarker compounds were compared before and after acidification.

3.2.2. Soxhlet Extraction and Group Components’ Separation

The geochemical composition analysis of the blockage and crude oil requires Soxhlet extraction and group components’ separation to prepare high-purity biomarkers for GC-MS detection. Soxhlet extraction and group components’ separation were completed in accordance with the Petroleum and Natural Gas Industry Standards of the People’s Republic of China (SY/T5118-2021, SY/T5119-2008). The specific steps are shown below in Table 1.
The blockage was placed in an oven and dried at 40 °C for 12 h. The dried blockage was pulverized to 100–120 mesh. The powder of the blockage was subjected to 72 h Soxhlet extraction with chloroform to obtain chloroform bitumen “A”. Chloroform bitumen “A” was air-dried at room temperature and weighed. The chloroform bitumen “A” or crude oil obtained was 50 mg and was placed in a triangular flask. A total of 1 mL of dichloromethane and 20 mL of petroleum ether were added and left for 12 h to precipitate out the bitumen. After the filtration of asphaltene, 20 mL of filtrate was obtained, and the filtrate was concentrated to 1 mL by purging with nitrogen. To avoid the excessive loss of compounds during concentration, the temperature should be controlled below 40 °C. The filtrate was transferred into a chromatographic column (the column length was 180 mm) filled with 2.5 g 100–200 mesh neutral alumina to allow for complete adsorption. The saturated hydrocarbon was eluted with 10 mL of n-hexane. The eluted saturated hydrocarbons were detected by GC-MS to study the distribution of biomarker compounds in the blockage.
All experiments were completed at the Geological Experiment Center of the Institute of Experimental Testing, Tarim Oilfield Branch, PetroChina.

3.3. Analysis of Thin Section, SEM, and X-ray Energy Spectroscopy

Thin sections were observed on a Leica DM4500P microscope. Before thin-section observation was performed, the light-source intensity of the microscope should be adjusted to the maximum. Use the 50× objective to observe the entire rock section in both reflected and polarized light. Reflectance and polarized light images of the flakes were obtained using the ZENcore operating software v3.47.
The microscopic composition of the minerals was observed with a Quanta 250 FEG desktop scanning electron microscope (SEM) from the FEI Company, Hillsboro, OR, USA. The maximum magnification is 100,000 times. In high-resolution mode, it has a resolution of 3 nm/30 kV. The working temperature of the instrument was 20 °C, and the working humidity was 50%. The accelerating voltage of the SEM was 10 kV. The emission current was 10 uA, and the working distance was 15 mm. A backscattered electron receiving probe was used as a signal receiver. SEM follows standard operating procedures (SOPs) for mineralogy analysis.
Quantax 200x flash X-ray energy spectrometer from Brooke Company in Kassel, Germany, was used for the rapid and accurate qualitative and quantitative analyses of mineral constituent elements. The error of the analysis result was less than 5%. The composition of a mineral was identified by its elemental composition and atomic ratios. The X-ray excitation voltage was 20 kV. The dead time was 35% to 40%. Point analysis (100 s), line scan (1800 s), and area scan (3600 s) were performed on the sampled locations, respectively. Data processing followed the principle of 3 times the standard deviation.

3.4. Analysis of GC-MS

GC-MS analyses were conducted using an HP7693 MSD interfaced to an HP7890A gas chromatograph fitted with a 30 m × 0.25 mm i.d. WCOT fused silica capillary column covered with a 0.25 um film of 5% phenyl-methyl silicone. Helium was used as the carrier gas. The initial temperature of the GC oven was 50 °C holding for a minute and ramped from 50 °C to 100 °C at a heating rate of 20 °C/min. Finally, the GC oven was ramped from 100 °C to 300 °C at a heating rate of 3 °C/min and held for 8 min. The MS acted as ionization energy of 70 eV in full-scan mode (m/z 50–800), with a source temperature of 230 °C, with an electron multiplier voltage of 1800 V.

4. Results and Discussion

4.1. Component Identification of Wellhead Blockage

4.1.1. Identification of Inorganic Phases

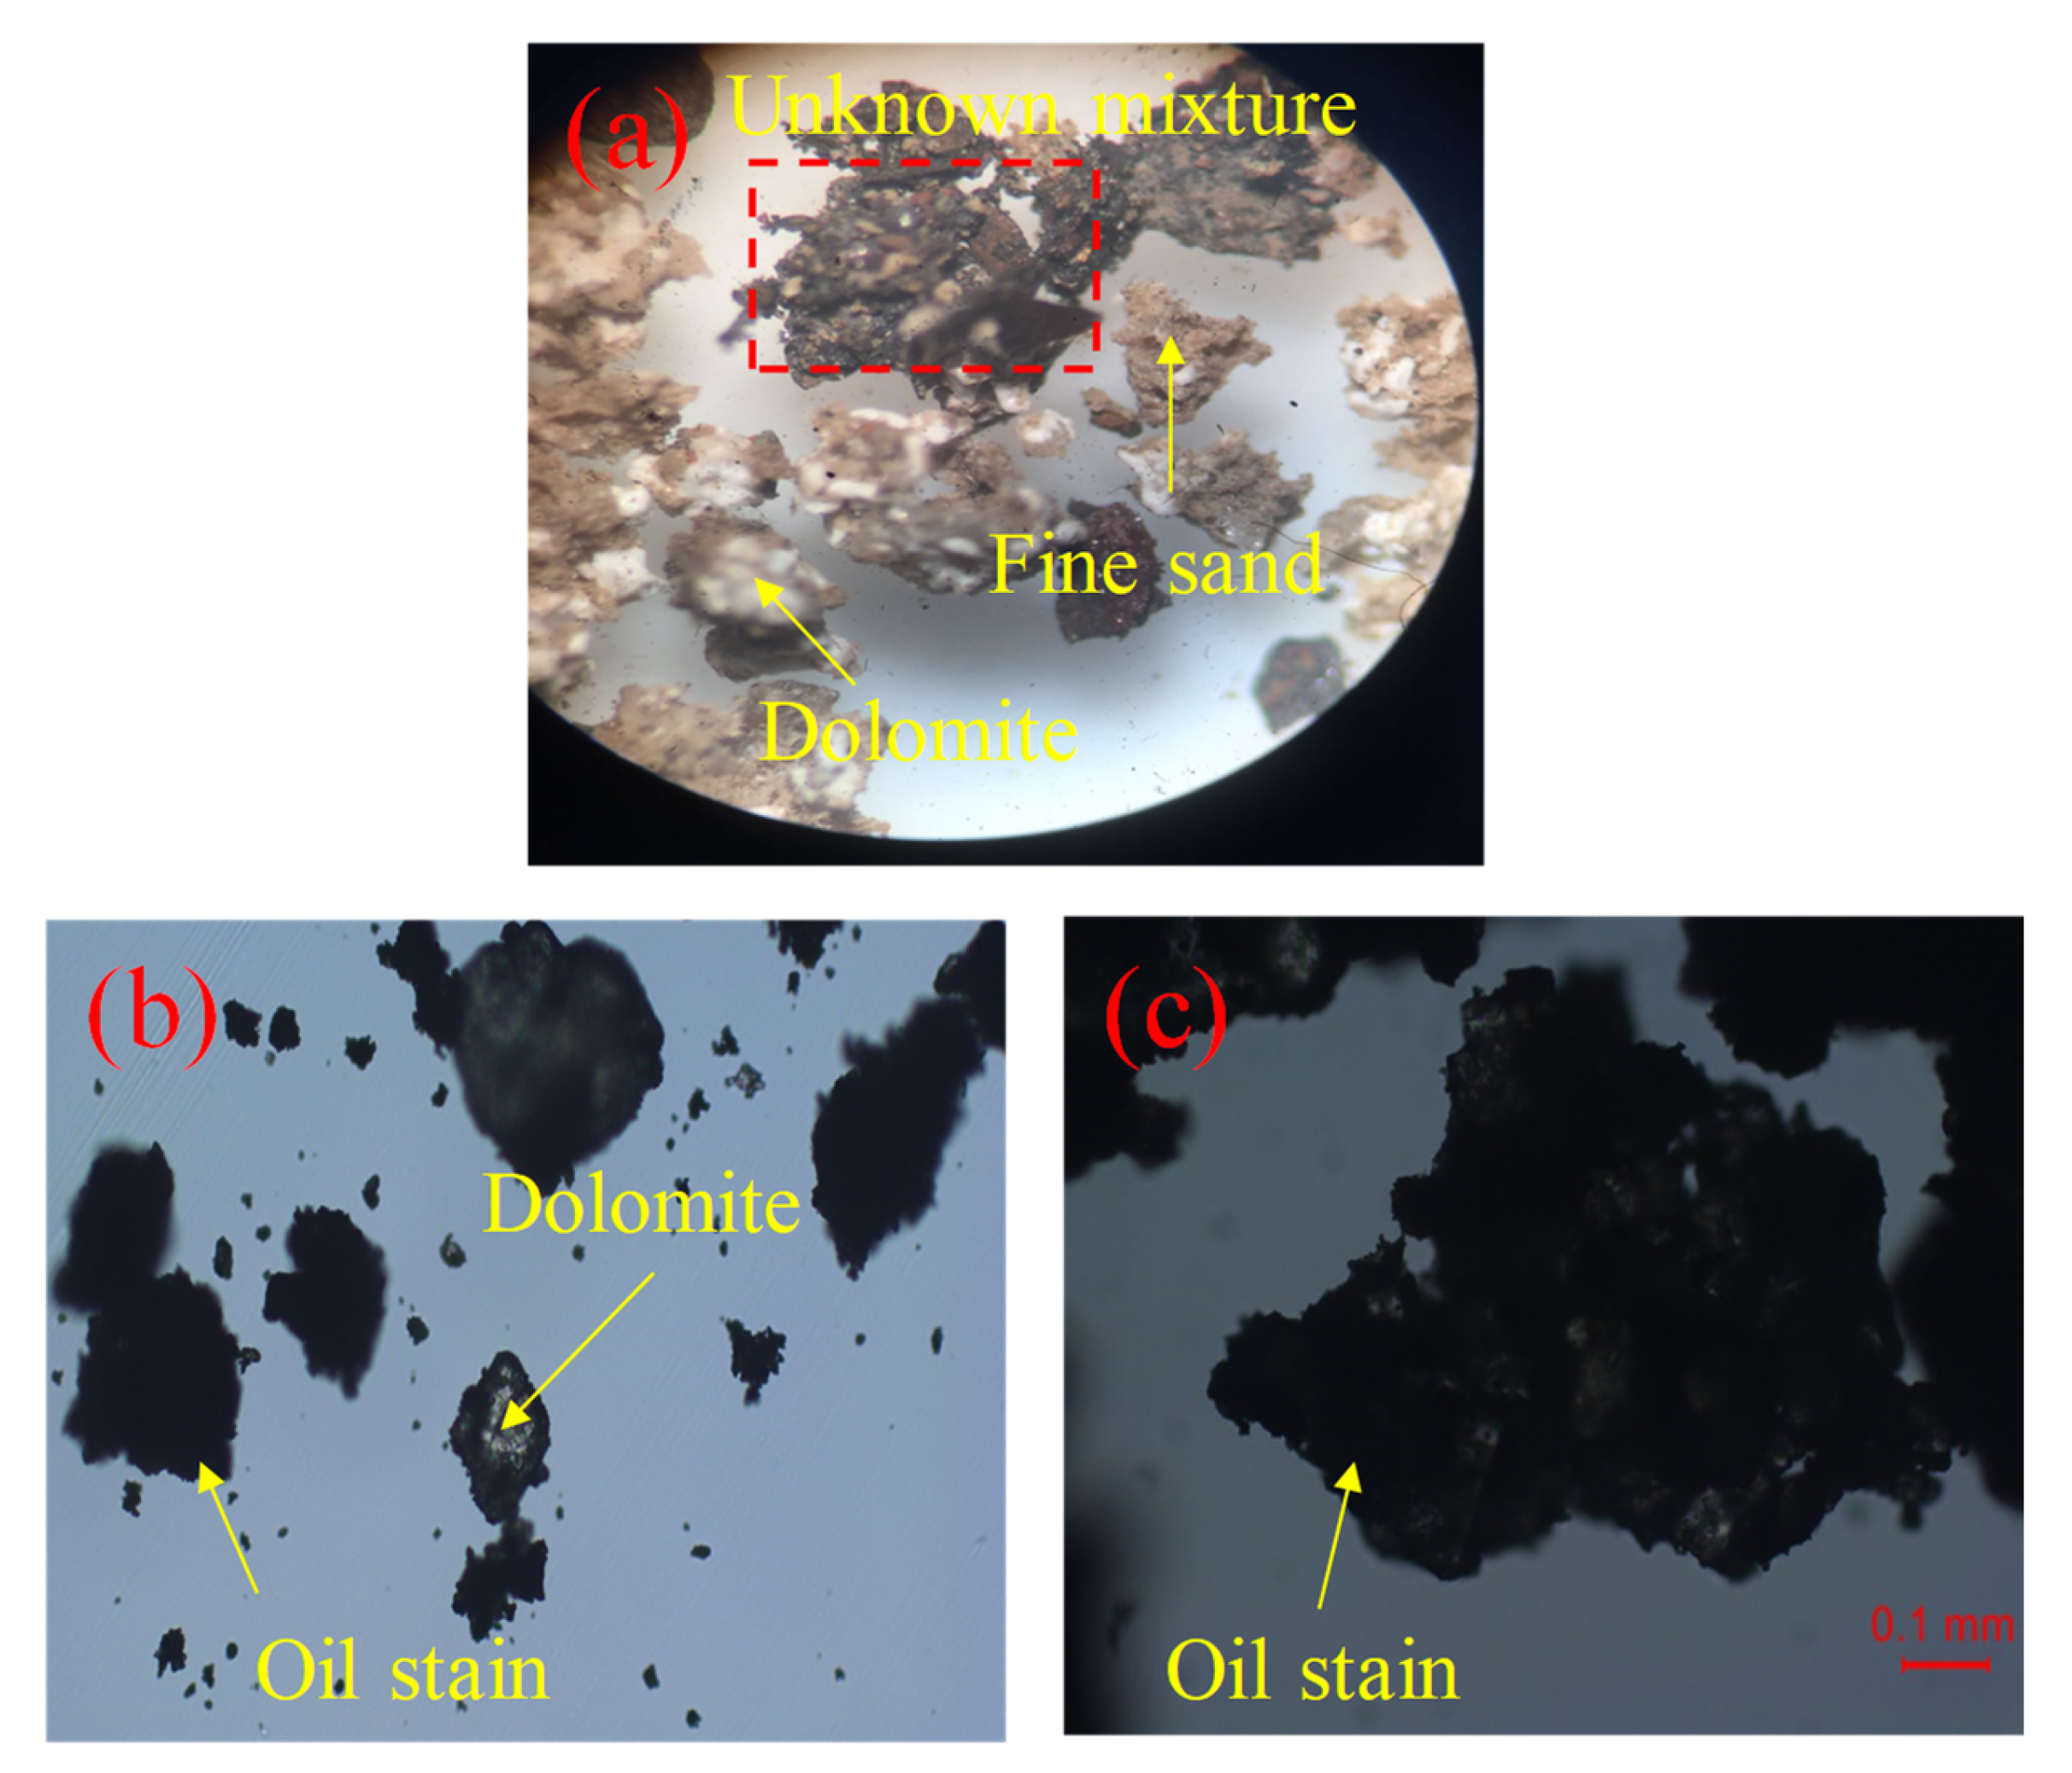
As shown in Figure 4, the wellhead blockage in Well DH 231 was a mixture of organic material and inorganic phases. From the reflected light image (Figure 4a), it can be observed that the wellhead blockage is mainly composed of three parts, namely, dolomite, fine sand, and a mixture that is unidentifiable under reflected light. The unknown mixture is purplish red in color and may be formed in a partially oxidized environment. Dolomite mixed with fine sand can be clearly discernible. Larger oil stains can be identified in polarized light micrographs (Figure 4a,b). The quantitative results show that the oil stains of the blockage could be up to 80%, and inorganic mineral accounts for less than 20% (Table 2). It is presumed that the inorganic phases may be rock fragments or cement in the drilled formation.
To determine the mineral composition of the unknown mixture in the reflected light images, we performed scanning electron microscopy observations [16,17] and mineral energy spectroscopy identification [18] of the unknown mixture, respectively (Figure 5). High-resolution scanning electron microscopy (SEM) can visualize the surface morphology and mineral composition of blockages, combined with auxiliary X-ray energy spectroscopy (EDS) for quantitative or semi-quantitative compositional analyses to determine the mineral composition. The unknown mixture mainly contained two inorganic phases. One of the inorganic phases was a crystal with a smooth surface and a cubic structure. The other inorganic phase was an unknown mineral with a distinct metallic luster. Under the 180–4700× magnification SEM, numerous densely distributed cube crystals in the mixture can be observed, with unknown minerals attached to their surfaces (Figure 5a–c). From the SEM image, it can be observed that the structure of this crystal was very similar to that of the Nacl crystal, but its exact composition was still unknown. Under the SEM field of view, the crystals can be up to 300 um and less than 20 um. Unknown minerals were distributed in blocks or cemented together with crystals.
The energy spectrometer performs component analysis by detecting the energy of the characteristic X-rays of the sample. The energy of the characteristic X-rays is a function of the atomic number of the sample. Therefore, by detecting the energy of the characteristic X-rays, the corresponding elements can be identified. As shown in Figure 5c, three points were taken on the cubic crystal as well as on the unknown mineral for elemental determination. The characteristic X-ray yield and energy of light elements with an atomic number lower than that of sodium were low; coupled with factors, such as spectral peak shift and interference, accurate detection results cannot be obtained. Mineral types can be inferred from the morphology, grayscale, point analysis of energy spectrum, and atomic ratio of minerals in SEM images. The energy spectrum identification results show that the unknown minerals mainly comprised four elements: Fe, O, Na, and Cl (Figure 5c,d). The four elements accounted for more than 95% of the total elemental amount. Among them, Fe and O elements accounted for 80%. According to the kα line of element oxygen and iron obtained from the energy spectrum, the atomic ratio of the two elements was calculated to be about 2:3. This suggested that the unknown mineral attached to the surface of the crystal was iron oxide. Undoubtedly, it is impossible to contain a large quantity of iron oxide in the formation [19]. A plausible explanation is that the iron oxide in the blockage may have come from rust on the metal parts of the inner wall of the wellbore.
The crystal was mainly composed of two elements: Na and Cl. According to the Kα spectral lines of the elements Na and Cl obtained from the energy spectrum, the atomic ratio of the two elements was calculated to be about 1:1. Combined with the morphological characteristics of the mineral, the large minerals observed under the scanning electron microscope were considered to be high-purity sodium chloride crystals [20]. Sodium chloride mainly derives from seawater or deep geological fluids [21]. The formation of the wellhead blockage can be thought to be influenced by geological fluid action during the formation process.

4.1.2. Component Analysis of Oil Stains

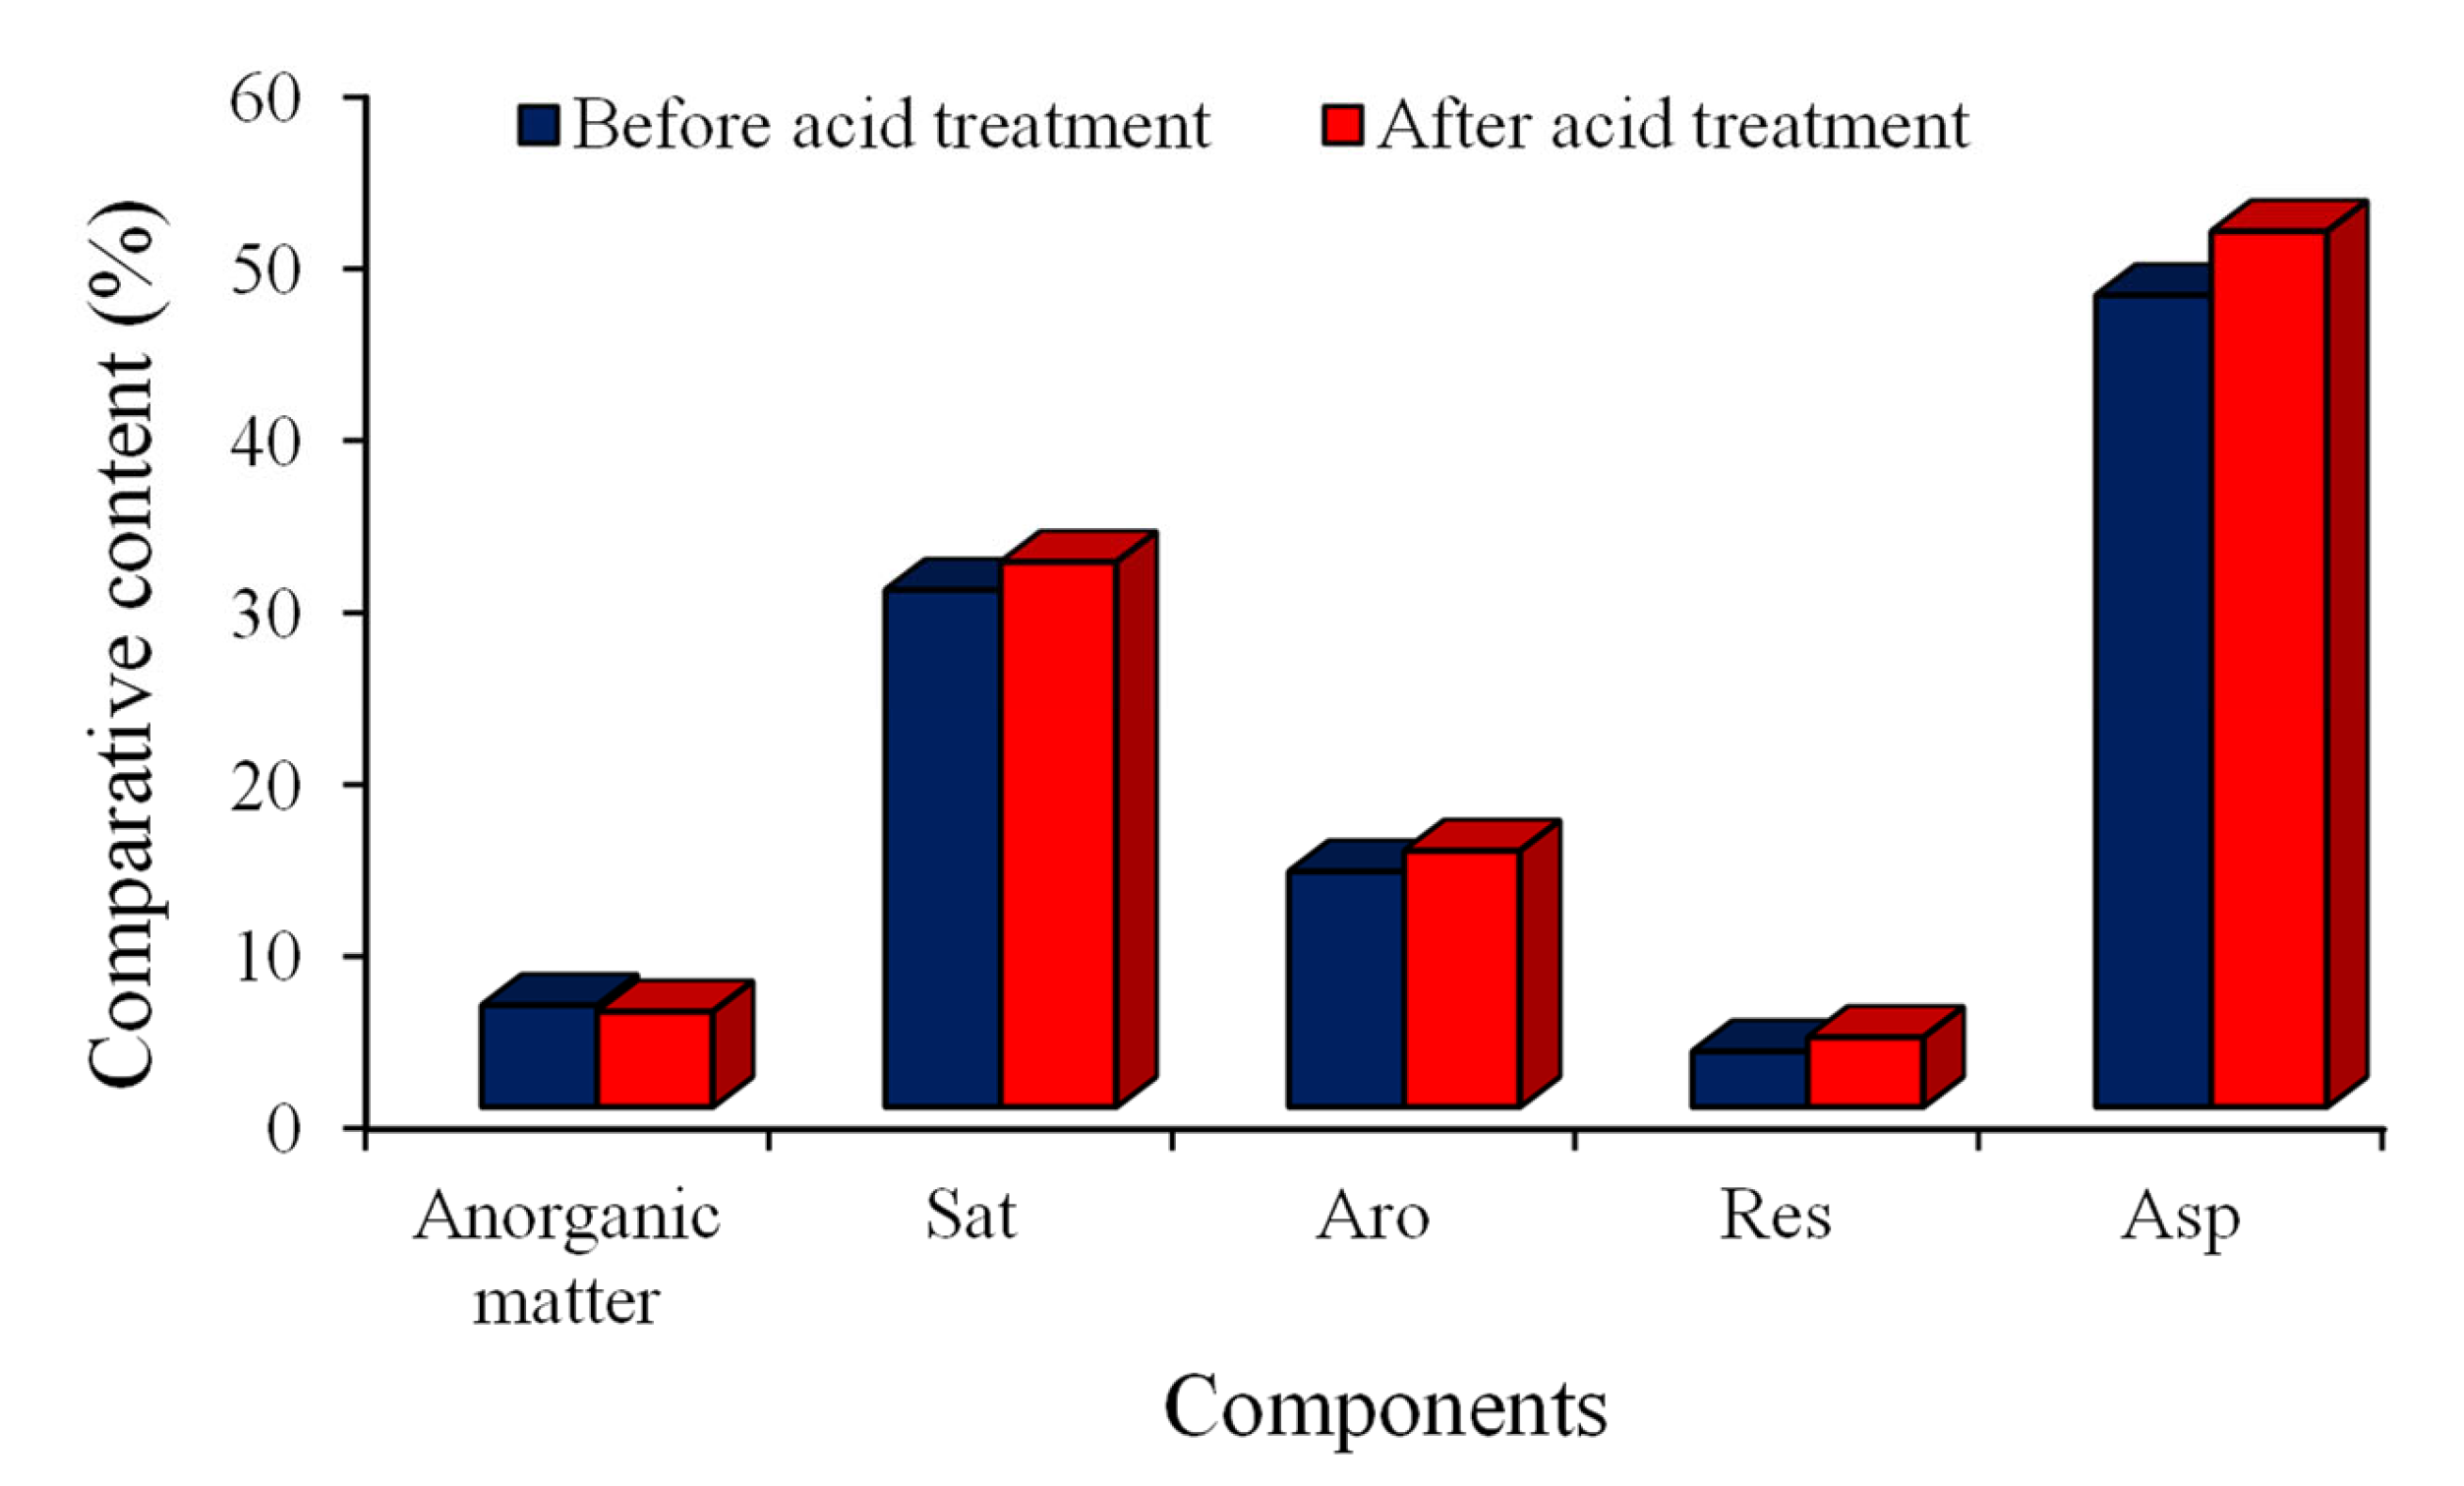
Chloroform bitumen “A” was extracted from the blockage with chloroform using the Soxhlet extraction method [22,23]. The obtained chloroform pitch “A” was subjected to group components separation. Studies have shown that the main components of the oil stains were saturated hydrocarbons, aromatic hydrocarbons, resins, and asphalt (Figure 6). The percentages of saturated hydrocarbons, aromatic hydrocarbons, resins, and asphaltenes were 30.03, 13.67, 3.22, and 47.18, respectively. Oil stains have the same material composition as normal crude oil or source rock extracts [24]. It is worth noting that the relative content of asphaltene in oil stains was relatively high, reaching 47.8% (Table 2). The formation of wellhead blockages may be related to the extraction rate of crude oil from the formation. With the continuous extraction of crude oil from the formation, the light and heavy fractions of crude oil are differentiated. Compared to normal crude oil, lighter oil has greater fluidity and a better recovery rate than crude oil. The heavy oil with a high asphaltene content has poor fluidity and is more likely to cause wellhead accumulation. Li et al. (2022) observed that the degree of condensation of asphaltenes in blockage extracts was significantly higher than that of asphaltenes in crude oil, and the asphaltenes contained more naphthene and aromatic ring structures [11]. This can accelerate the precipitation of other asphaltene components in the crude oil. Wu et al. (2022) further emphasized that the more polar asphaltenes were easier to spontaneously precipitate at the wellhead [25]. High asphaltene content in the oil stains may be the potential reason for wellhead plugging of Well DH231. In the production of heavy oil with high asphaltene content, the viscosity of crude oil can be changed by adding additives to the crude oil to improve the production efficiency of oil wells and reduce wellhead clogging.
To verify the secondary impact of acidification during drilling and production on the organic matter in the wellhead blockages, we conducted a comparative test on the contents of each component before and after the acidification of the collected wellhead blockage. The experimental results show that the acid treatment has little effect on the organic matter in the blockage. The composition of the filler obtained after acidification changed by less than 2% compared to before (Table 2). The bitumen “B” produced after acidification had a limited impact on the hydrocarbon composition of the blockage. In other words, there is little organic matter hidden in the carbonate rock crystals or lattices [26].
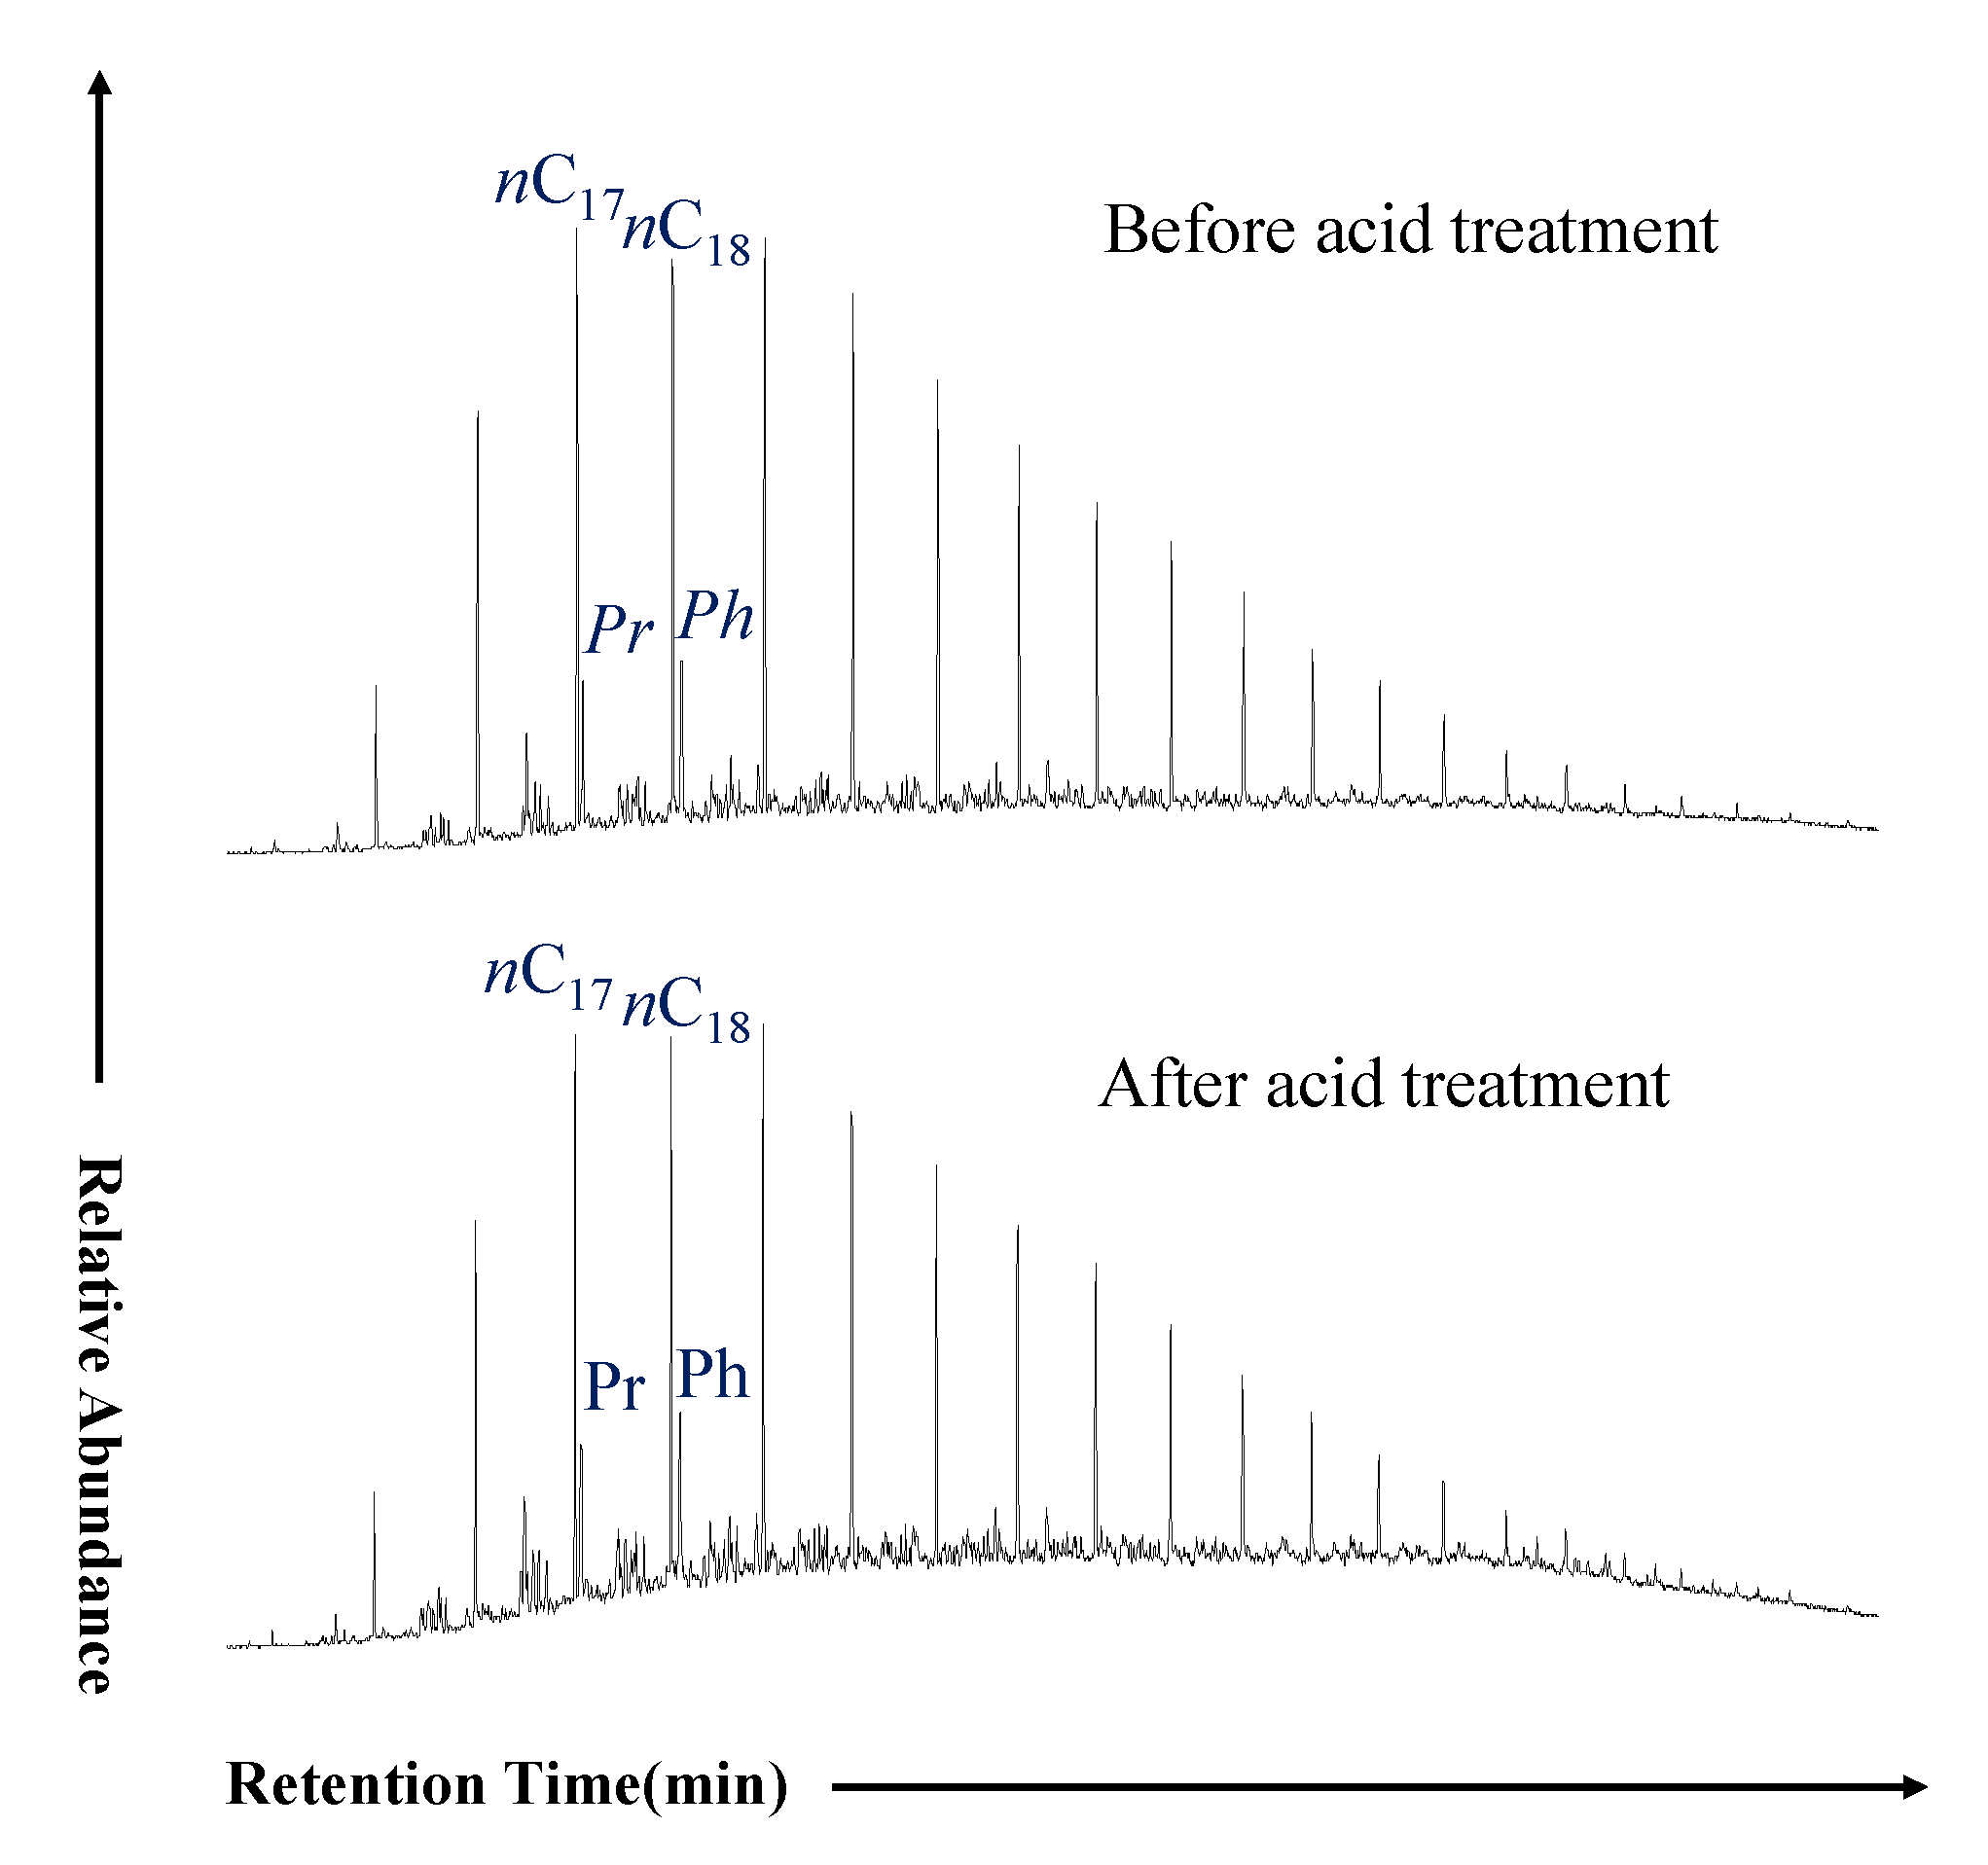
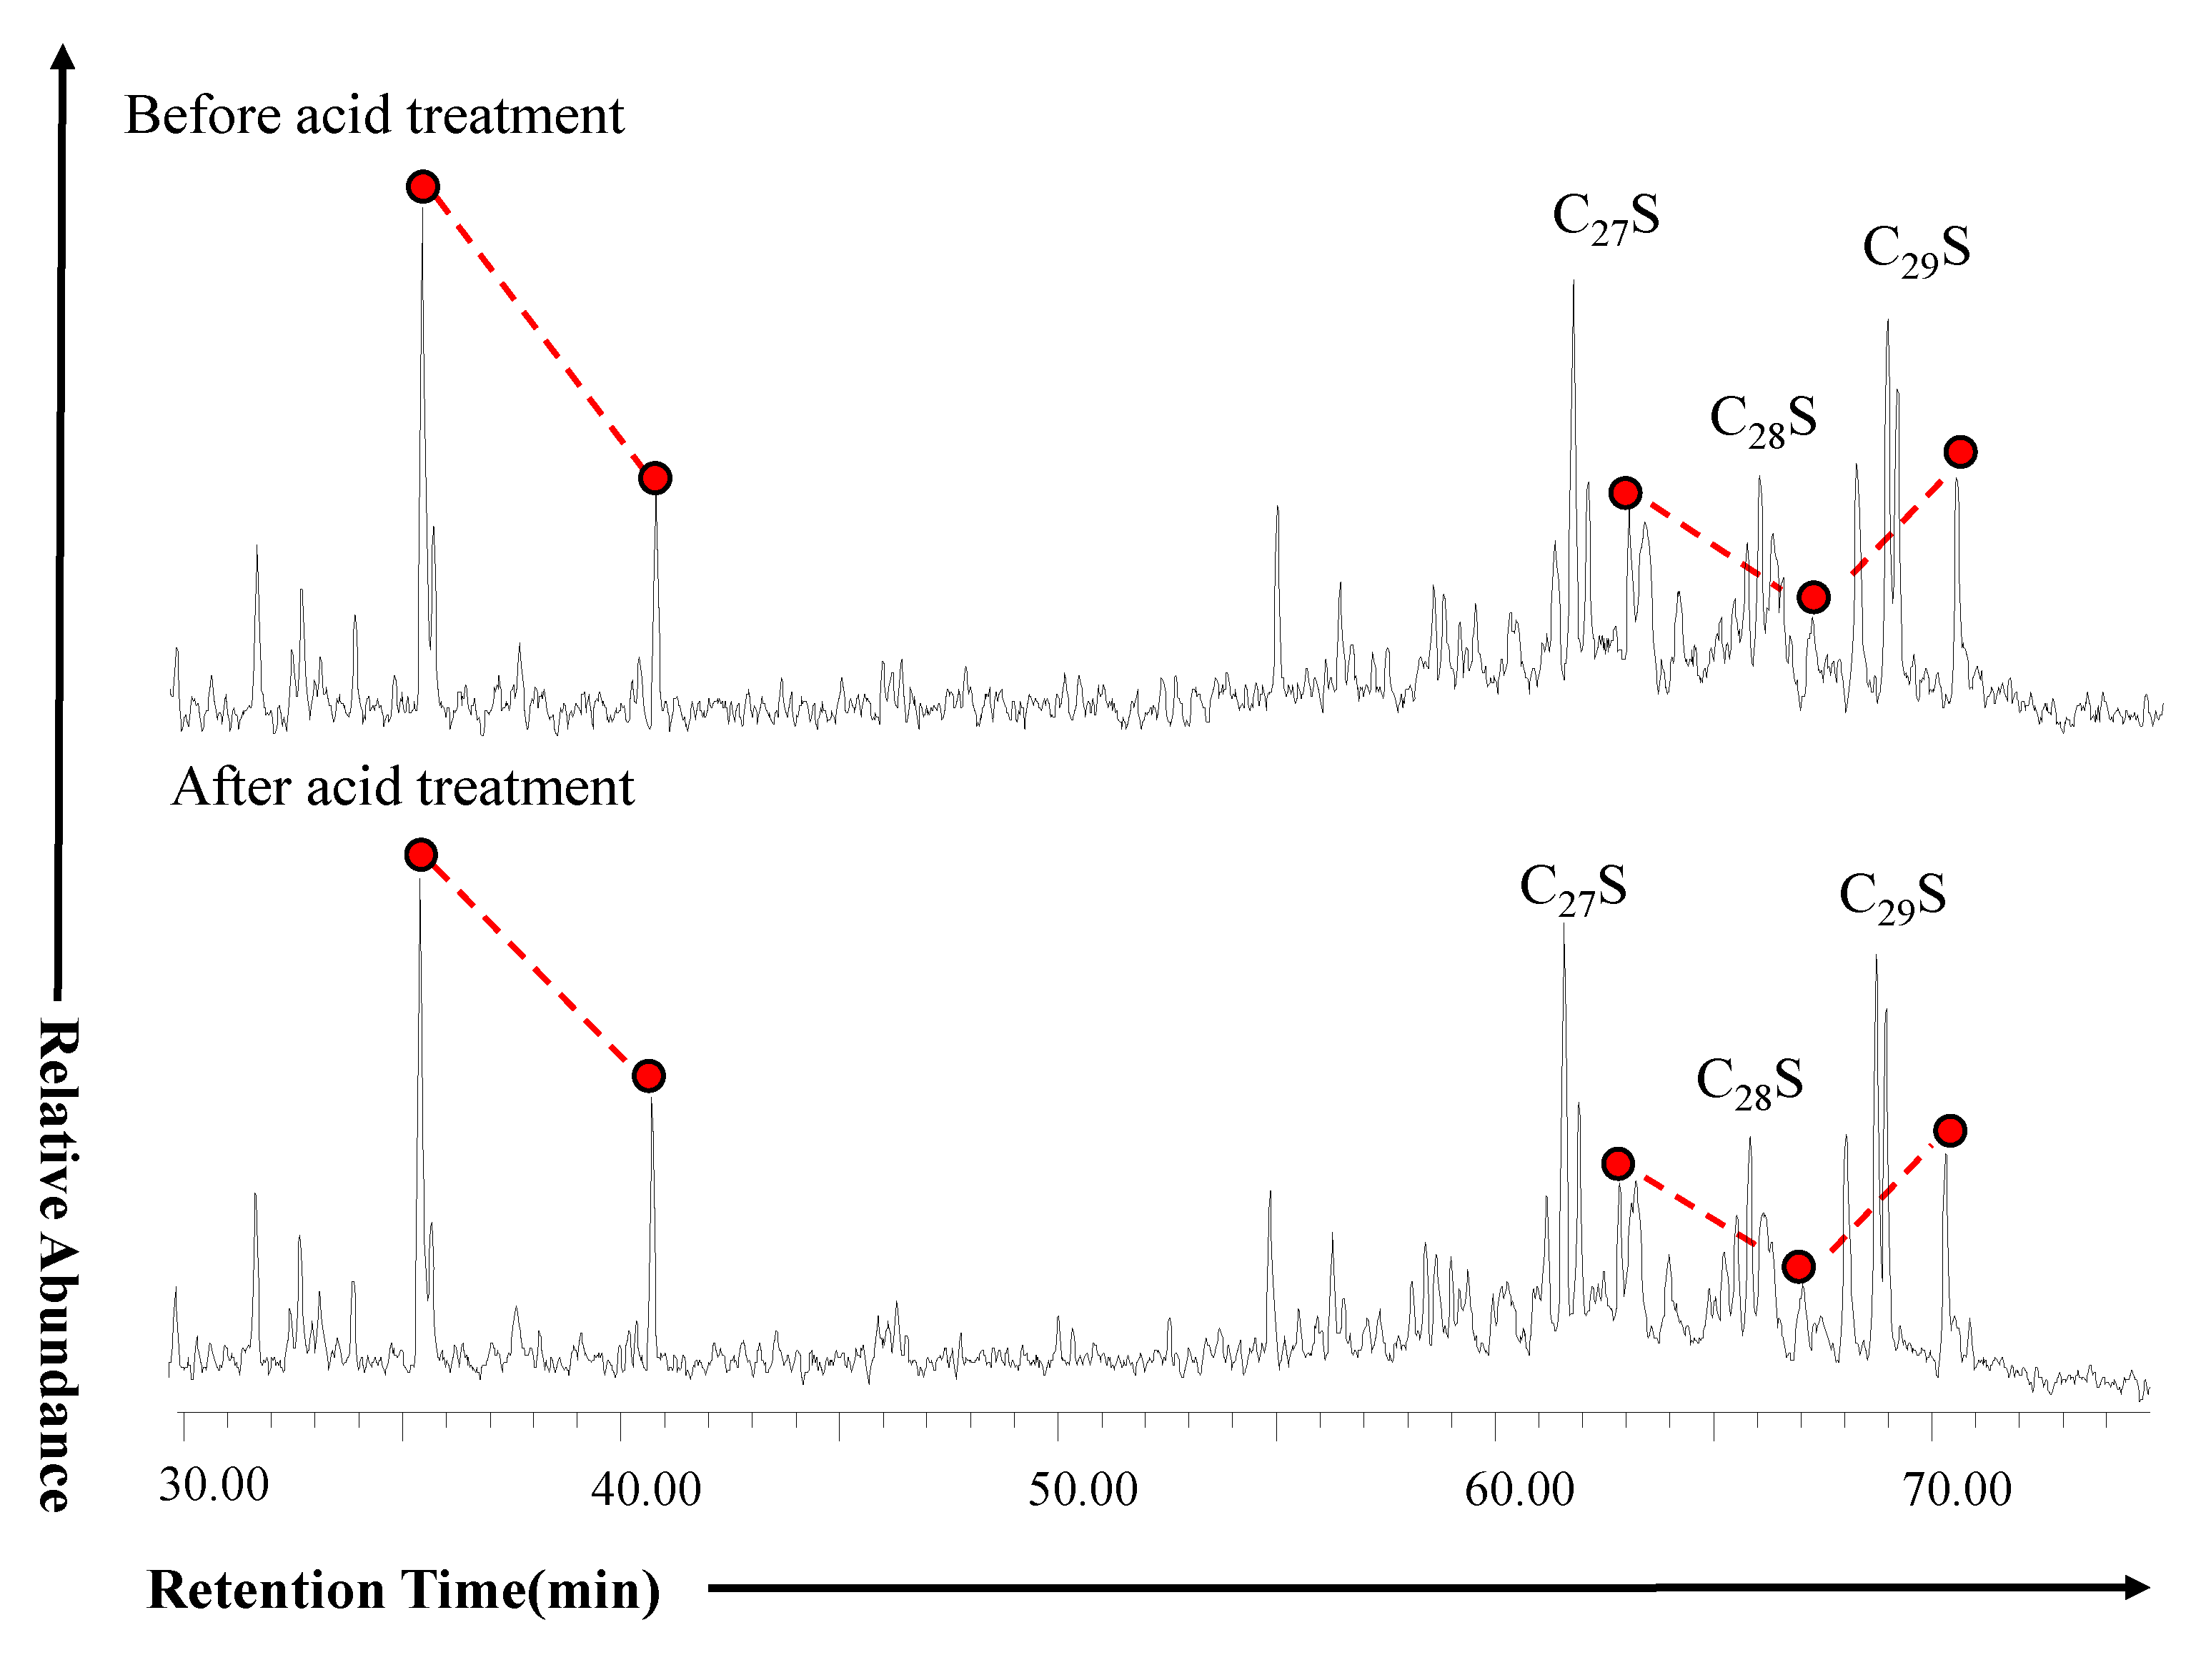
Wellhead blockage occurs during oil and gas production. Due to the particularity of the production process, the organic components in the blockage showed some complexity [26,27,28]. Oil stains on the wellhead blockage may be secondary fouling from additives, such as foreign diesel and gasoline in the mining process, or natural organic matter in geological bodies. The extracted chloroform bitumen “A” was identified by full oil chromatography, and the characteristics of the oil stains’ full oil chromatographic are shown in Figure 7. The carbon number distribution of n-alkanes was very wide, ranging from nC13–nC25. The distribution of n-alkanes was complete, mainly low-carbon compounds, showing a single-peak distribution, with nC17 as the central peak. High-carbon n-alkanes did not have an odd–even carbon dominance distribution phenomenon. Obviously, the n-alkane components of oil stains were entirely different from refined oils, such as gasoline and diesel. The abovementioned characteristics indicate that the petroleum-like substances in the blockage were the products of geological bodies. It is not an additive used in the drilling process, but a more mature component of crude oil.
At the same time, the later acidification process had little effect on the overall distribution characteristics of the chromatogram of the wellhead blockage. In Figure 4, the acid-treated blockage exhibited a distinct UCM bump in the baseline of the chromatogram (Figure 7). It is speculated that a small amount of organic matter encapsulated by inorganic minerals is released during blockage acidification [29]. The secondary release of organic matter was not enough to affect the overall distribution characteristics of primary organic matter in the whole oil chromatogram. However, the complex compounds released can cause significant UCM bulging in the total oil chromatogram [30]. The distribution characteristics of Pr/Ph, Pr/nC17, and Ph/nC18 in the chromatograms (Figure 4) showed that the Pr/Ph values before and after the acidification of the blockage were close to 0.9, respectively, 0.94 and 0.90 (Figure 7). When the thermal evolution of the source rocks is similar, and the initial source input is relatively stable, Pr/Ph can be used as an indicator of the oxidation conditions of the original depositional environment of the source rocks, indicating the sedimentary paleoenvironment [31]. Didyk et al. (1978) suggested that Pr/Ph < 1 represented a reducing environment and Pr/Ph > 1 indicated an oxidizing environment [32]. Peters et al. (2017) pointed out that for samples within the oil-generating window, Pr/Ph > 3 represented the input of terrestrial organic matter in an anoxic environment, while Pr/Ph < 0.8 represented an anoxic, reduced sedimentary environment [33]. Combined with the comprehensive analysis of the geological background, it is believed that the oil stains of Well DH231 were formed in a strongly reducing marine environment.

4.2. Composition, Distribution Characteristics, and Significance of Organic Steroid Terpenoids

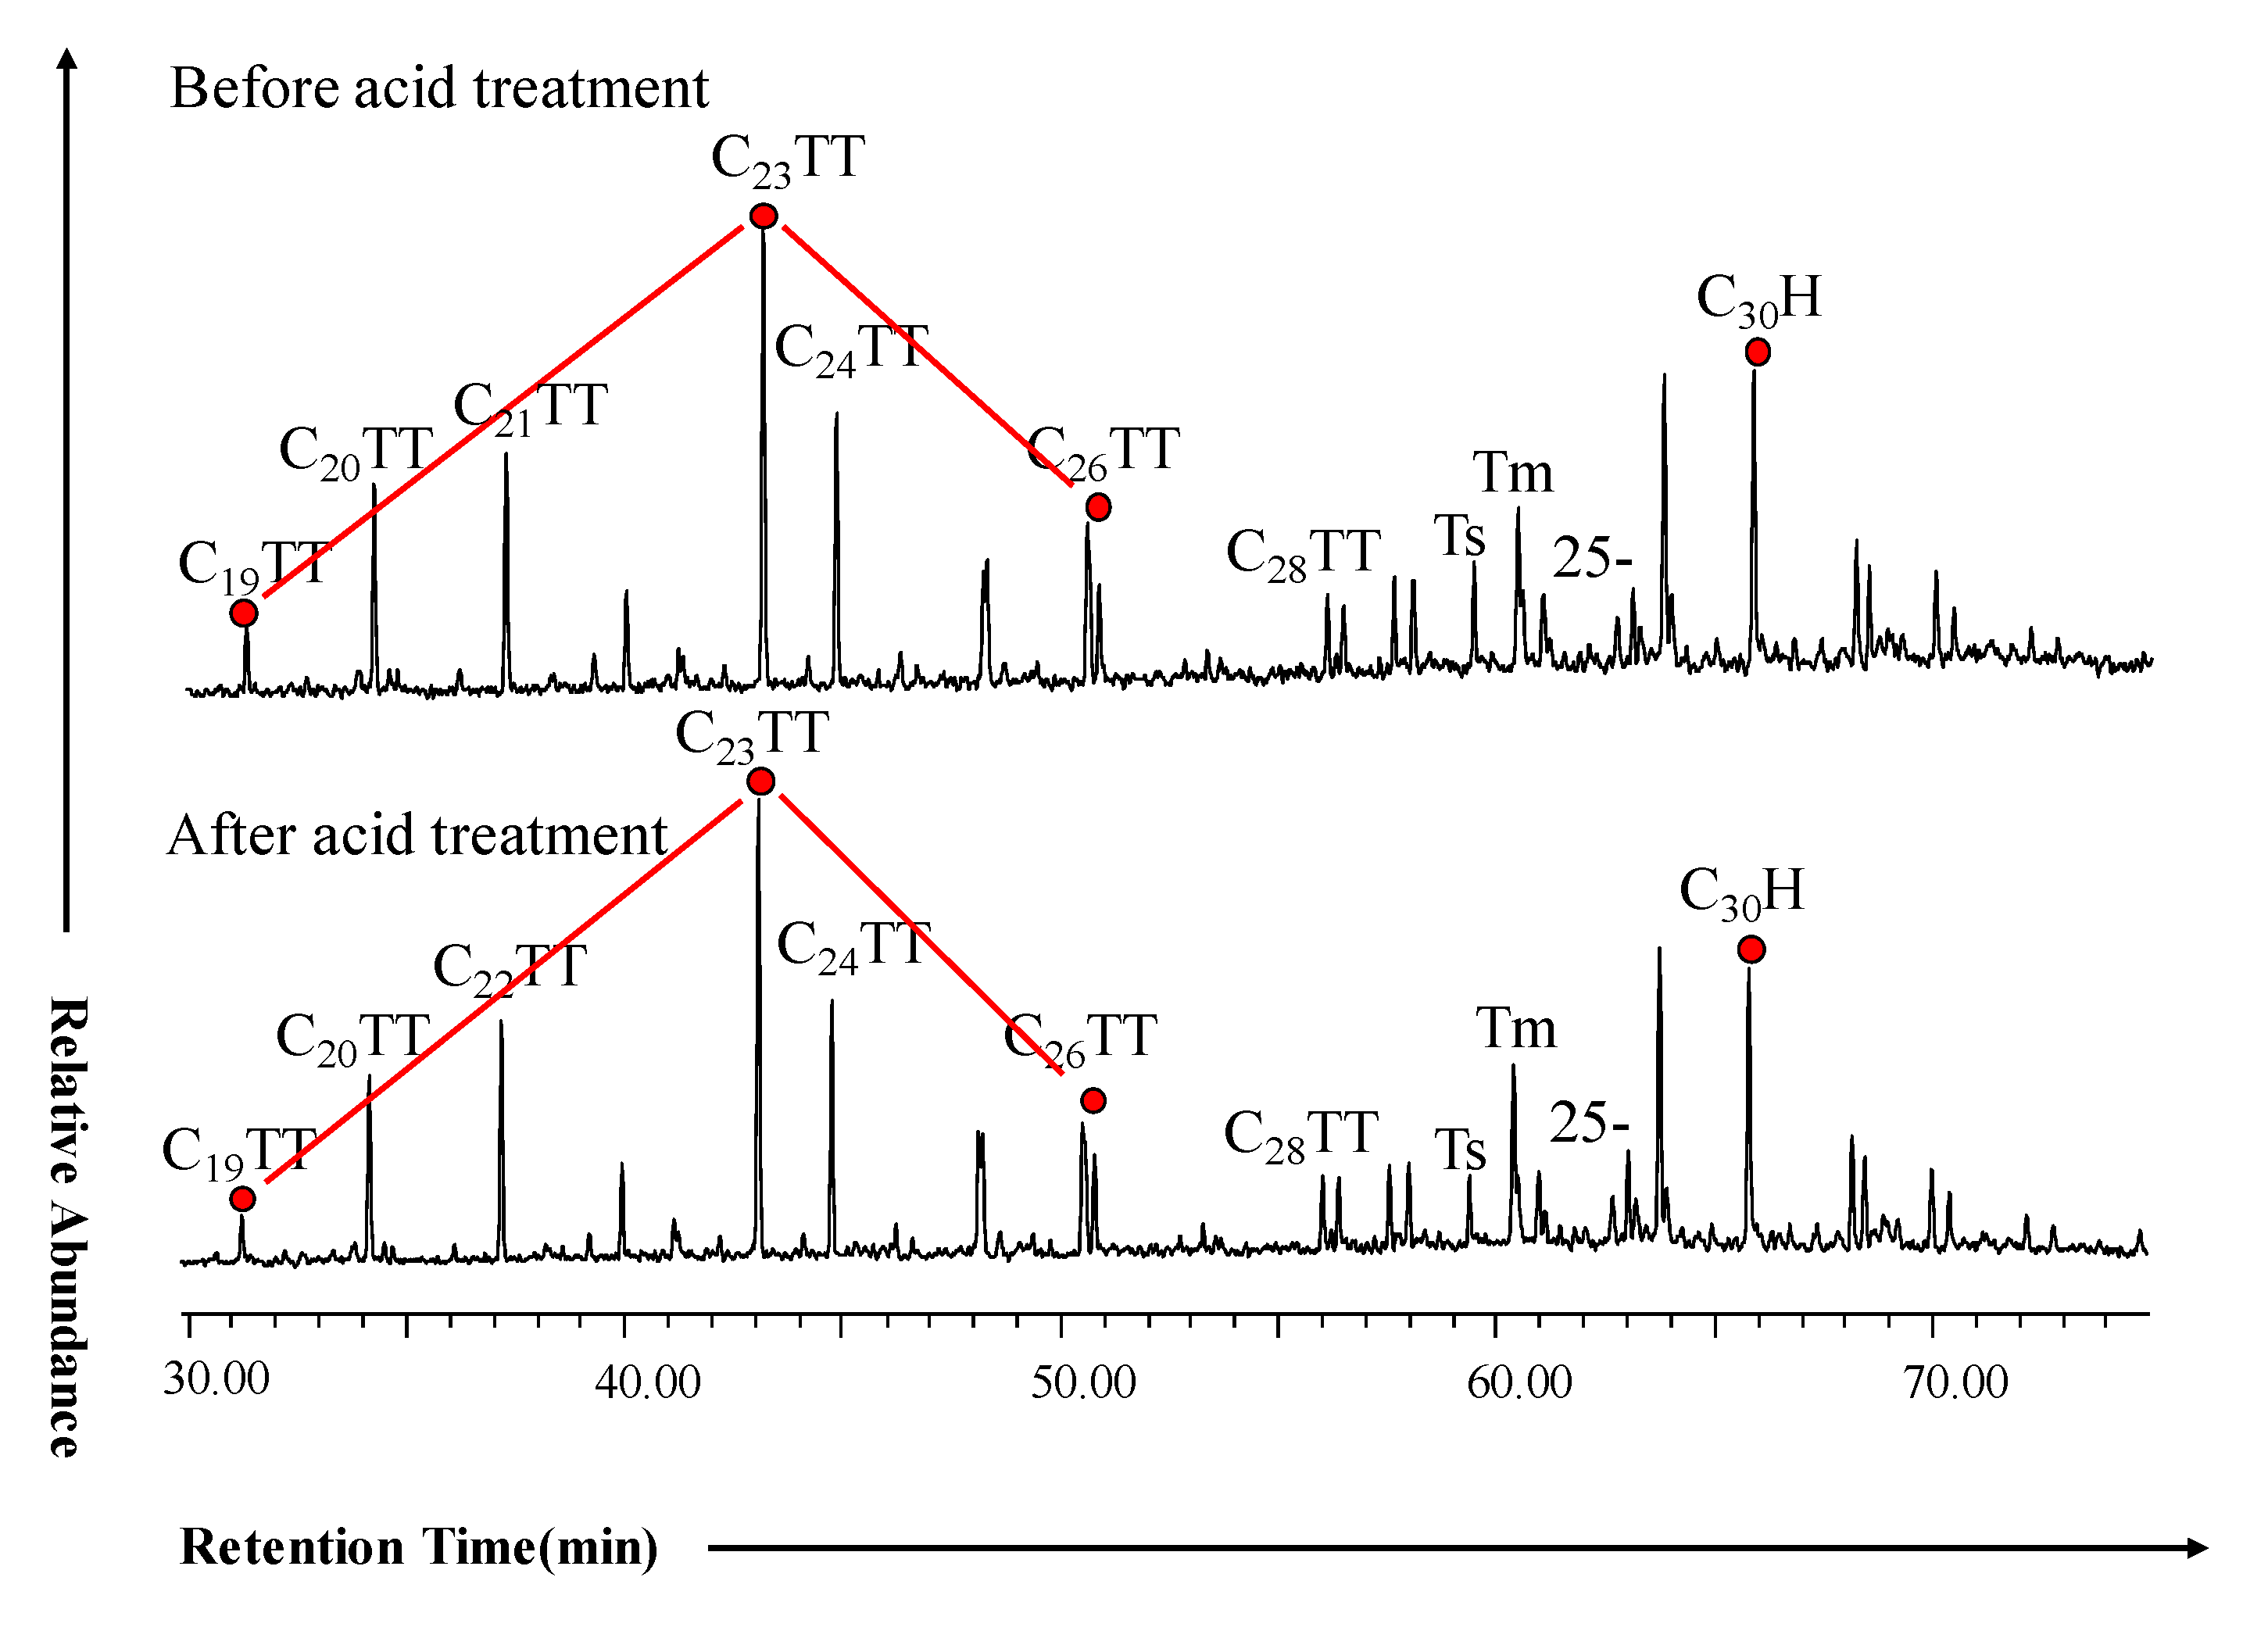
Terpenoids widely exist in source rock extracts and are reliable indicators for characterizing depositional environments [34]. The abundance of tricyclic terpenes in the blockage was relatively high, with C23 tricyclic terpenes as the main peak (Figure 8) and contained a high content of C28 and C29 tricyclic terpenes. It exhibited typical Middle and Upper Ordovician marine crude oil distribution characteristics [35]. The hopane series dominated the pentacyclic terpene alkanes, and the moretane series was poorly developed. The C30H/C30M values ranged from 10.05 to 11.05 with a mean of 10.55 (Table 3). The m/z 191 mass chromatograms of the saturated hydrocarbon fractions of the blockage before and after acidification had very similar characteristics, indicating that acidification had little effect on the composition of organic matter (Figure 8). It is easy to observe that it is in good agreement with the RIC diagram characteristics of the compounds in the saturated hydrocarbon fraction before and after acidification in Figure 7.
Notably, a certain abundance of 25-norhorpanes series compounds (25- in Figure 5) and 25,28-bis-norhopanes (peak after Tm) were faintly visible on the m/z 191 mass chromatogram (Figure 8). Due to the n-alkanes in the blockage being preserved and intact (Figure 7), the appearance of 25-norhopanes and 25, 28-bis-norhopanes indicated that Well DH231 had undergone more than two oil and gas charging phases [15,36]. The pre-charged crude oil of Well DH231 underwent sufficient biodegradation, and the n-alkanes in the blockage were the products of late crude oil charging.
Steranes are tetracyclic compounds with alkyl side chains. The carbon numbers of conventional steranes range from C27~C29, but there are also highly complex carbon number variations [34,37]. The steranes in source rocks mainly come from the sterane acids produced by algae, phytoplankton, and higher plants during diagenesis, and there is basically no mutual transformation between steranes after formation [34]. Therefore, steranes are an essential compound for analyzing the source of organic matter in source rocks [38,39]. The values of αααα 20R Sterane C27/C29 in the blockage ranged from 0.71–0.80 with an average value of 0.76 (Table 3). This suggests that lower marine algae are also a significant source of raw materials for clogging oil stains. The isomerization parameter of sterane is a reliable indicator of the maturity of source rocks [37,40,41]. The value of C29αββ/(αββ + ααα) in the blockage was 0.6, and the value of C29ααα 20S/(20S + 20R) was 0.5. Although the C29αββ/(αββ + ααα) value exceeds the used equilibrium range (0.52–0.55), the C29ααα 20S/(20S + 20R) value (0.6) still indicates the high maturity of oil stains in the blockage (Table 3).
The characteristics of steranes are very consistent before and after acidification. As shown in Figure 9, the relative abundance of pregnane steranes in the blockage was higher than that of regular steranes. Of the entire sterane composition, rearranged steranes did not develop. In the regular sterane composition, the relative abundance of ααα conformational compounds was low, and the abundance of ααα20R was lower than that of ααα20S. In comparison, the relative abundance of αββ conformational compounds was significantly higher (Figure 9), which also indicated that the crude oil in Well DH231 underwent some biodegradation before recharging [42].

4.3. Comparative Analysis of Wellhead Blockage and Adjacent-Well Crude Oil

Due to the lack of geochemical information related to source and reservoir rocks in this layer, a conventional oil–source correlation cannot be performed. Therefore, we compared the geochemical characteristics of oil stains in the blockage with of that crude oil from adjoining wells. It is expected that it can explain the origin of crude oil from Well DH231.
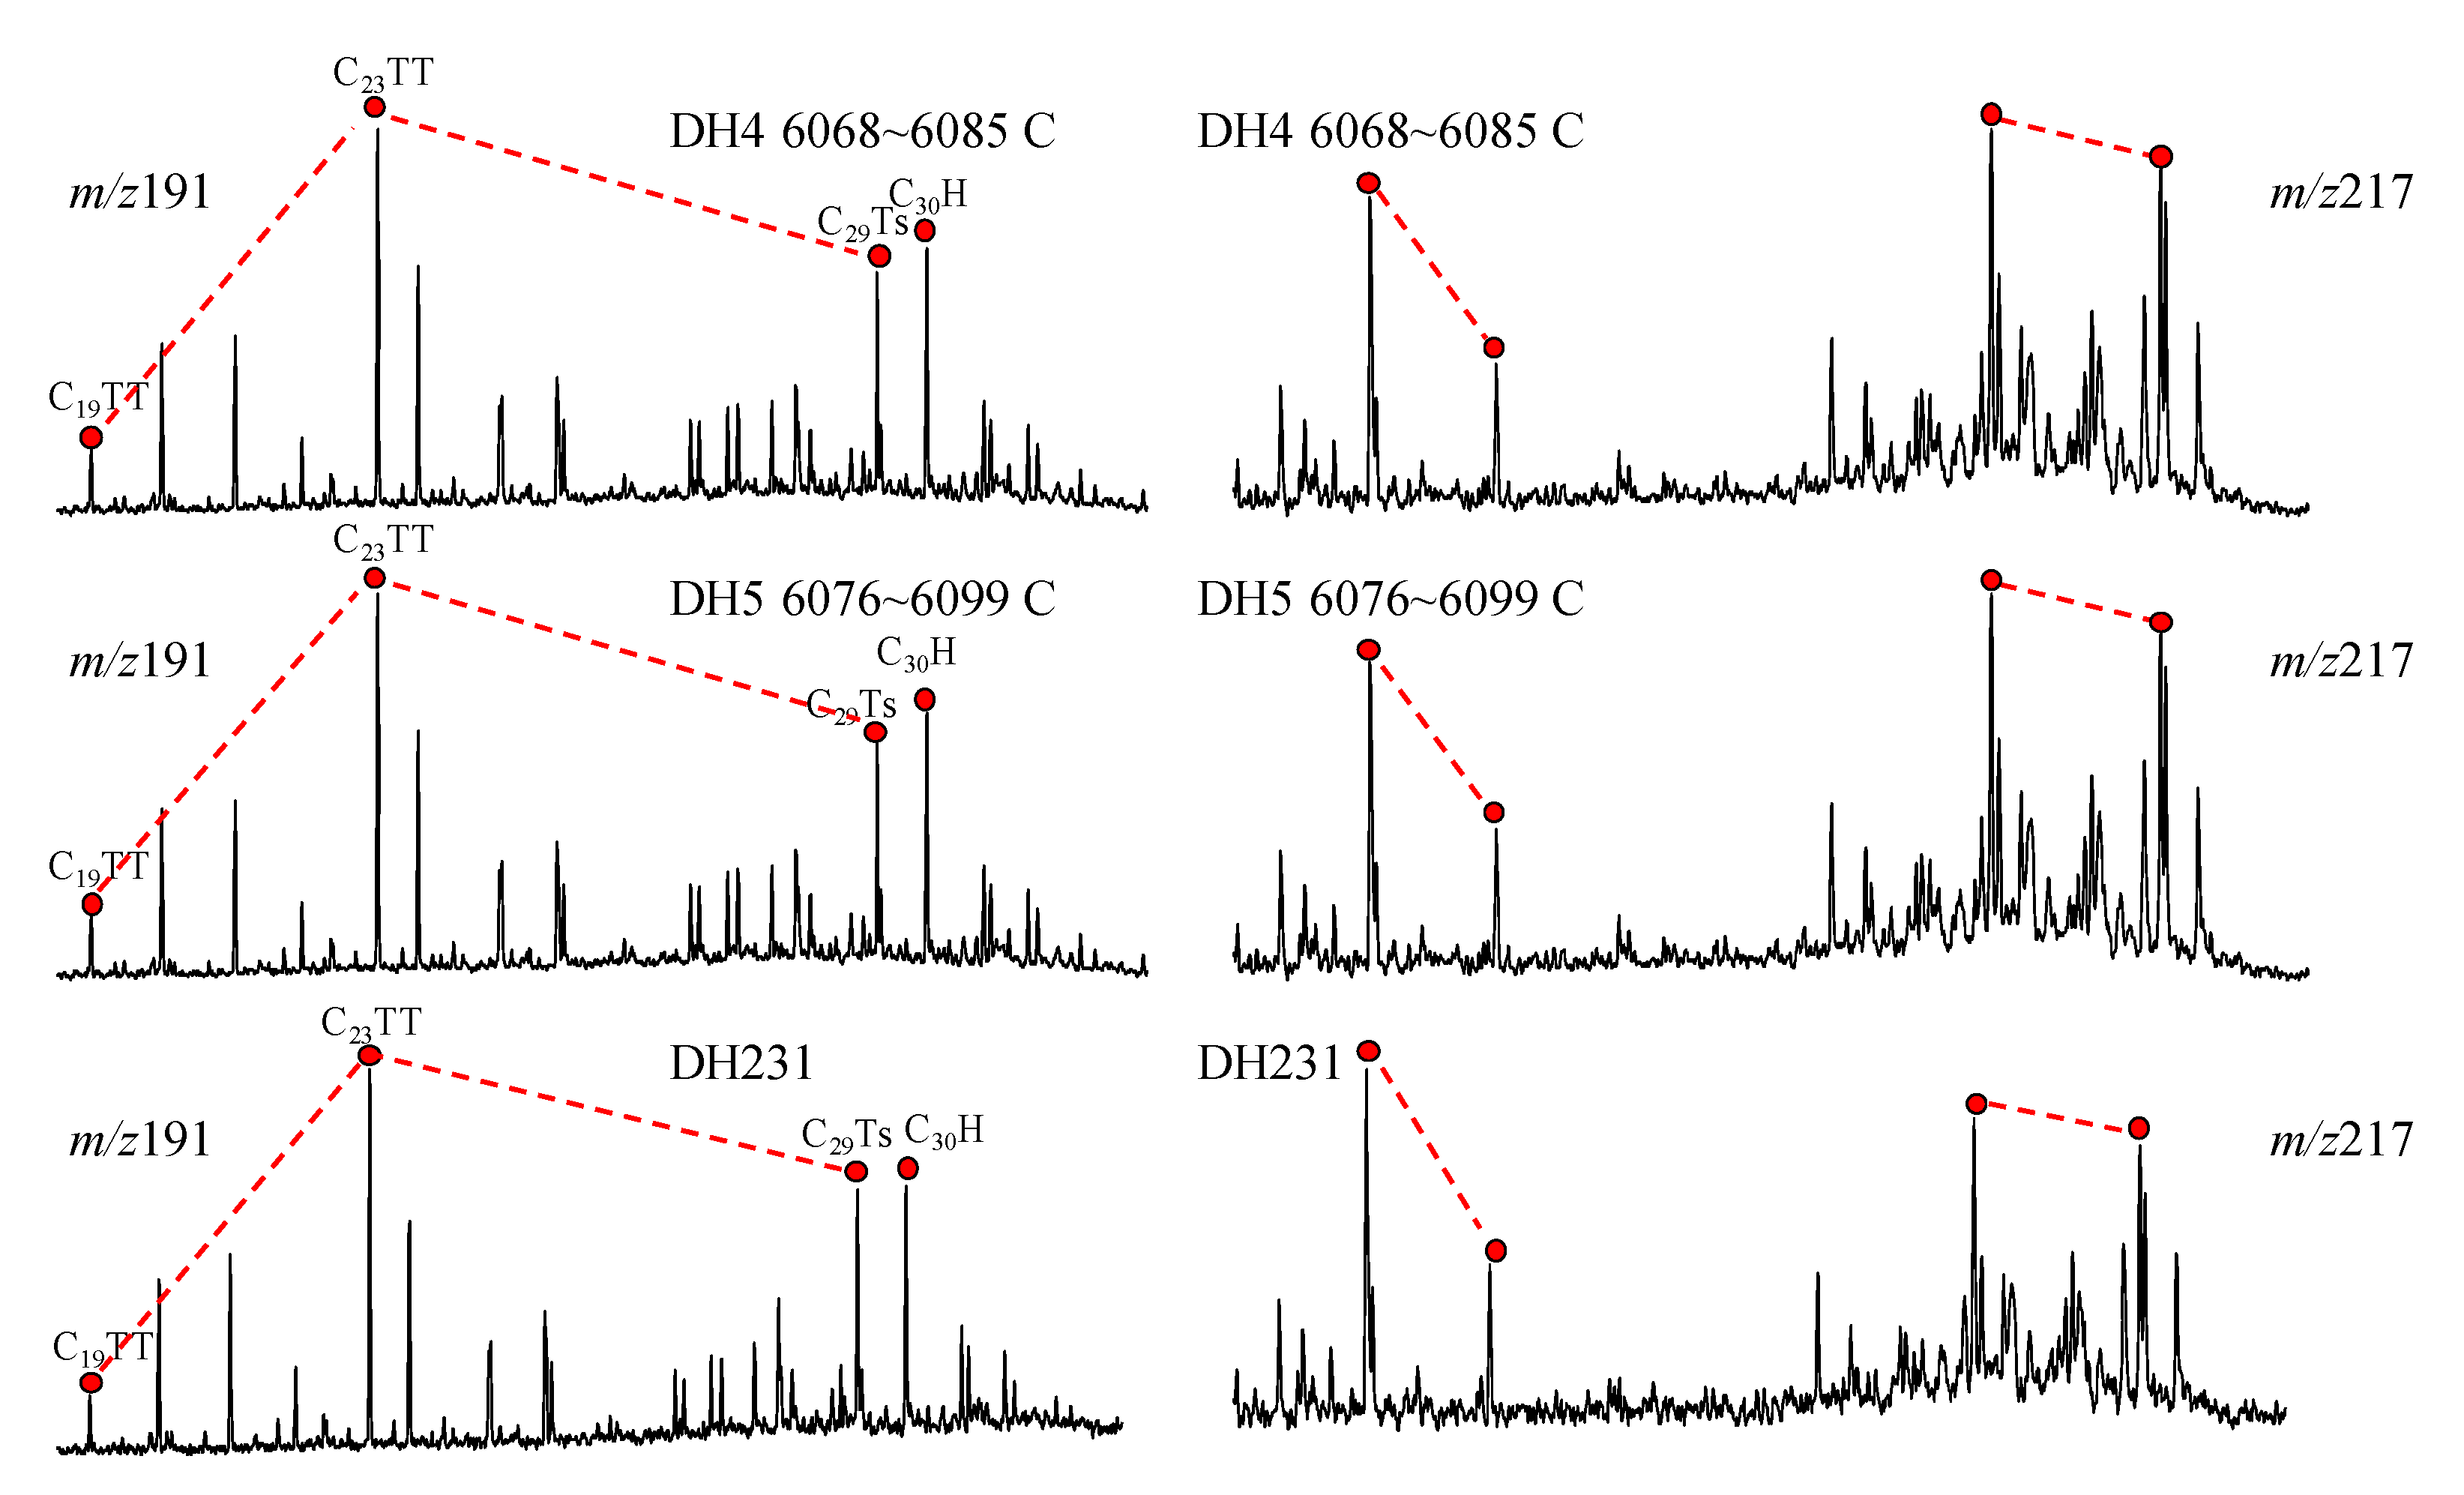
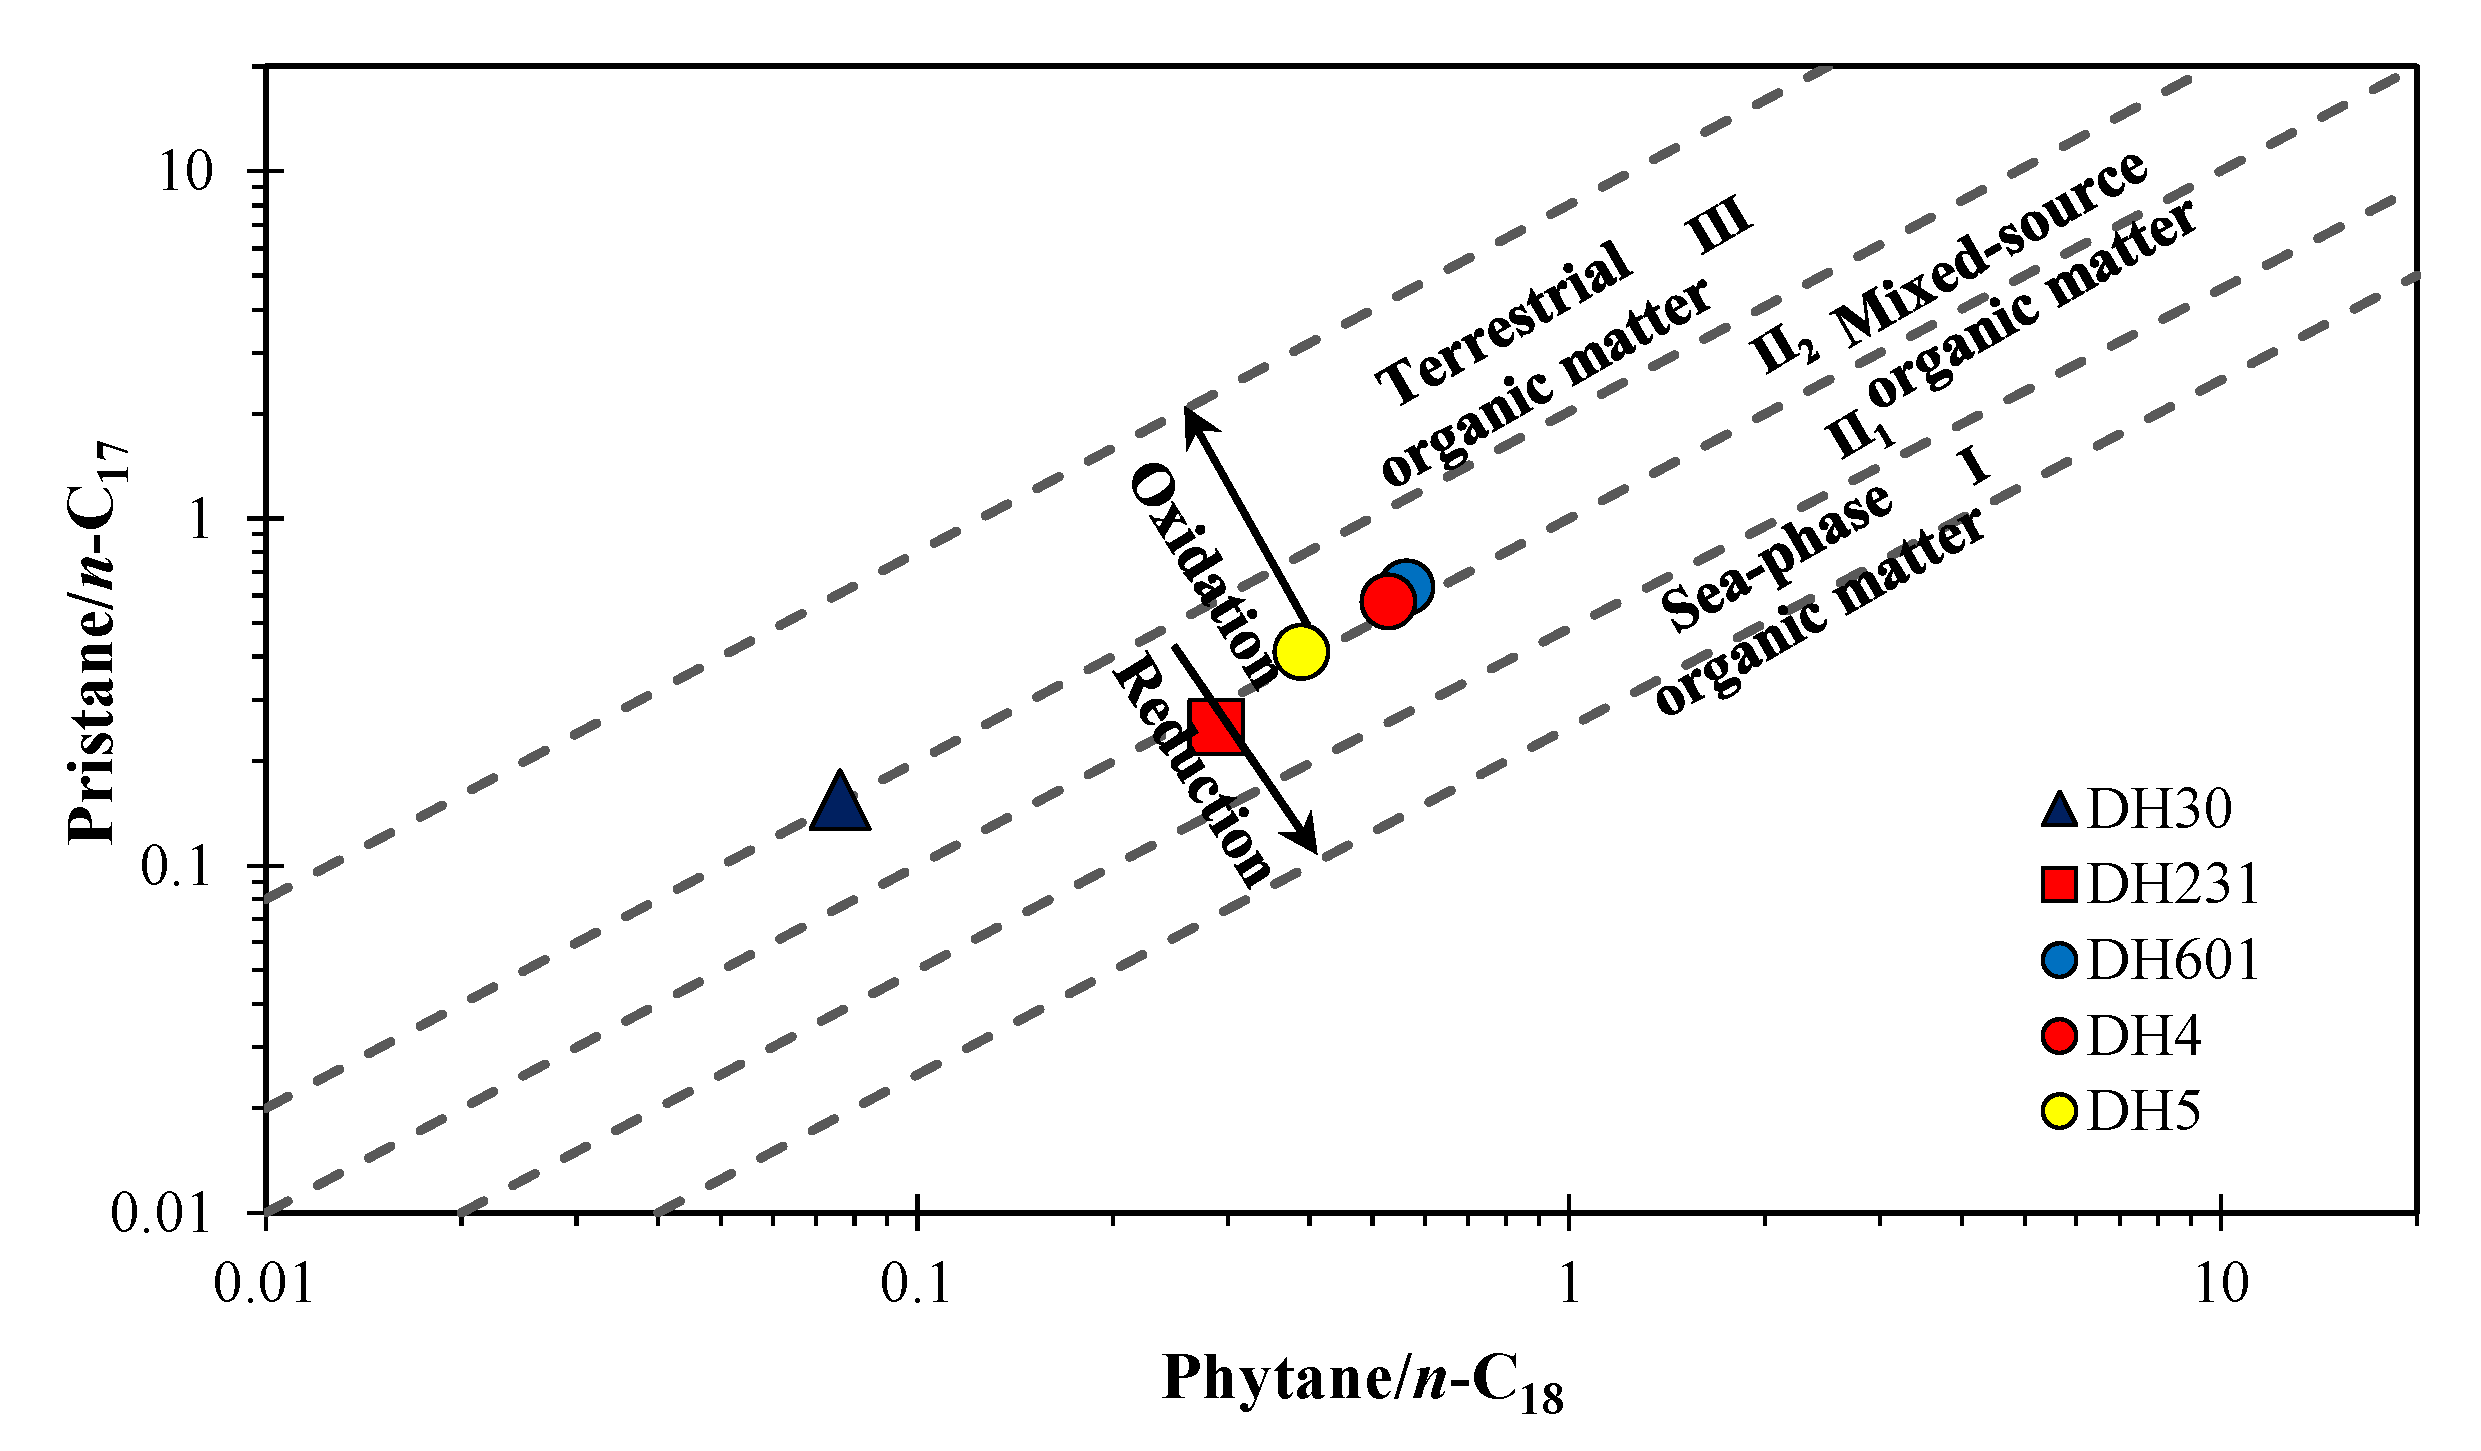
Biomarker compounds in saturated hydrocarbon components are essential indicators for an oil–source comparison [43,44,45]. By analyzing the distribution of biomarker compounds in crude oil, the source of crude oil can be preliminarily judged [22]. As shown in Figure 10, the sterane and terpene compositions of the oil stains are in stark contrast to the crude oils from the Carboniferous reservoir in Wells DH 4 and DH 5. This means that they are somehow “related” to each other. Meanwhile, the cross plot of Pr/nC17 and Ph/nC18 shows that the oil stains in the blockage of Well DH231 have a similar material origin to the crude oils of Wells DH601, DH4, and DH5 (Figure 11). The results indicate that they all have apparent mixed source contribution characteristics [32,33].
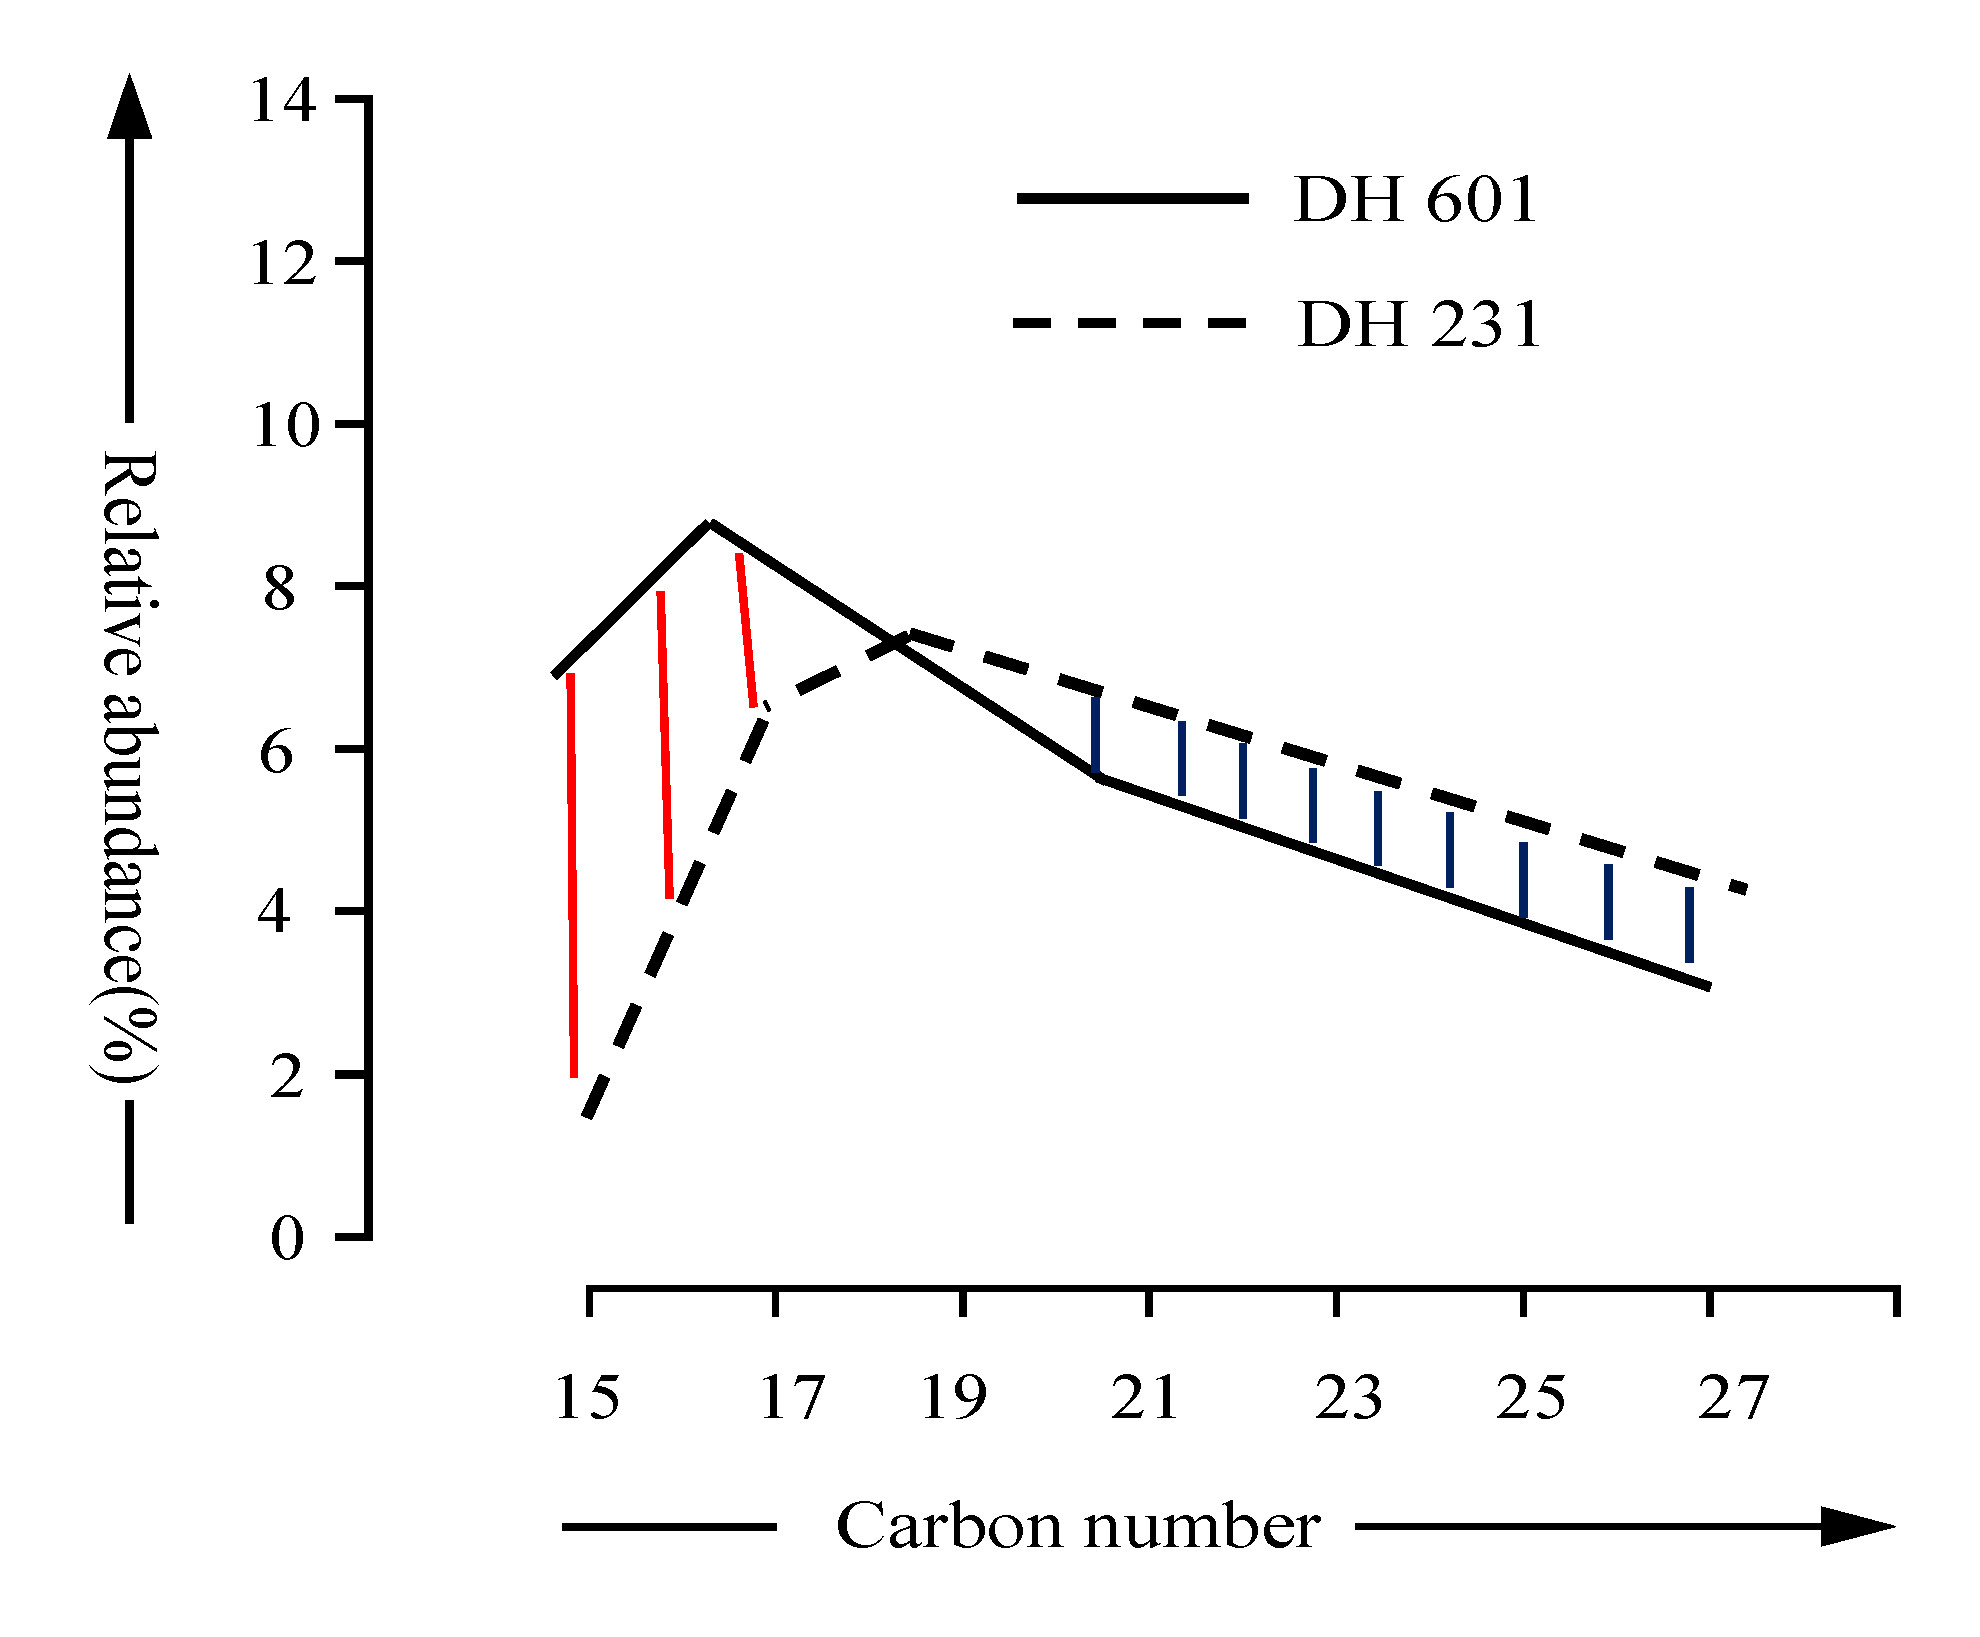
However, compared to the saturated hydrocarbons of crude oil in Well DH601, there was a significant reduction in the light component of the oil stains (Figure 12). The relative content of nC15 in the oil stain can be more than 5% lower than that of the crude oil from Well DH601. At the same time, the content of heavy components in the oil stains showed a significant increase again (Figure 12). In summary, the oil stains at the wellhead of Well DH231 may come from the same reservoir system as the crude oil of Wells DH 4 and DH5. The oil stains in the blockage were the migration products of the crude oil in Wells DH 4 and DH5 [46].
Among the hopane compounds, the 25-norhopanes series had significant abundance in the wellhead blockage. In contrast, the 25-norhopanes series in the carboniferous crude oil of Wells DH 4 and DH 5 showed a trace distribution (Figure 10). This feature may indicate that the recharging of crude oil in Well DH231 may not be as abundant as Wells DH 4 and DH 5. Alternatively, the early recharging of the carboniferous crude oil in Wells DH 4 and DH 5 is relatively weak.

5. Conclusions

Based on the analyses of thin-section identification, scanning electron microscopy, energy spectrum, and in combination with molecular geochemistry of oil stains, the following conclusions can be reached:
(1)
The inorganic substances in the wellhead blockage of well DH231 are mainly iron oxide, sodium chloride, and dolomite. The high abundance of iron oxide comes from rust on the metal parts of the wellbore liner. Dolomite and other inorganic minerals are rock fragments or cement from the drill encounter formation. The presence of sodium chloride indicates that geological fluid plays a role in the blockage formation.
(2)
The organic matter in the wellhead blockage of Well DH231 is mainly oil stains. The oil stain is a native organic matter in geological bodies, which is a display of oil and gas during the drilling process. It has the same composition as crude oil rather than gasoline, diesel, and additives left over from the drilling process. The percentage of asphaltene in oil stains is as high as 47%. High asphaltene content in oil stains could be a potential reason for generating the wellhead blockage in Well DH231.
(3)
The blockage of Well DH231 contains some abundance of 25-norhopanes, but the distribution of n-alkanes is intact. It indicates that secondary charging and multi-period accumulation of crude oil occurred in this well.
(4)
The fingerprint characteristics of the steroid terpenoids in the wellhead blockage of Well DH231 are comparable to those of the carboniferous crude oil from Wells DH 4 and DH 5, suggesting some “kinship” between the two.
Taking Well DH231 as an example, the material composition and reason for the formation of the wellhead blockage were analyzed. On the one hand, it can reasonably explain similar phenomena encountered in other wells during oil and gas production. On the other hand, it allows us to largely avoid this phenomenon as much as possible in the subsequent production process. The study can be easily applied in the later production practice.

Author Contributions

Methodology and writing—original draft: Z.L.; data curation and investigation: Z.C.; data curation and resources: Z.L. and W.X.; revised and edited the manuscript: W.X. and Z.L. All authors have read and agreed to the published version of the manuscript.

Funding

This research was funded by the National Science Foundation of China (No. 41503034, No. 41972122) and the National Science and Technology Major Special Foundation (grant number 2017ZX05001005).

Institutional Review Board Statement

Not applicable.

Informed Consent Statement

Not applicable.

Data Availability Statement

Not applicable.

Acknowledgments

The authors would like to give their sincere thanks to the teachers in the department for their comments on the revision of the article.

Conflicts of Interest

The authors declare no conflict of interest.

References

  1. Song, D.; Wang, T.-G.; Li, H. Geochemical Characteristics and Origin of the Crude Oils and Condensates from Yakela Faulted-Uplift, Tarim Basin. J. Pet. Sci. Eng. 2015, 133, 602–611. [Google Scholar] [CrossRef]
  2. Liu, J.; Steel, R.J.; Lin, C.; Yang, H.; Yang, Y.; Peng, L.; Gong, Y.; Chu, C. Geomorphology Control on the Development of Reservoir Depositional Systems, Devonian Donghetang Formation in the Tabei Uplift of the Tarim Basin, China. Mar. Pet. Geol. 2012, 38, 177–194. [Google Scholar] [CrossRef]
  3. Li, W.; Xu, H.; Gao, S.; Yu, Y.; Ning, C.; Yang, J.; Jiang, T. Inner Architectural Characteristics of Wave-Dominated Shoreface Deposits and Their Geological Implications: A Case Study of Devonian ‘Donghe Sandstones’ in Tarim Basin, China. Mar. Pet. Geol. 2021, 134, 105334. [Google Scholar] [CrossRef]
  4. Sun, P.; Fang, H.; Xu, Z.; Wang, C.; Xu, H.; Lu, M. Siliciclastic Depositional Model within a Subsurface Coastal Parasequence Based on Barriers and Baffles—An Application to the Donghe Sandstone Member in the Hudson Oilfield, Tarim Basin, NW China. J. Pet. Sci. Eng. 2020, 195, 107947. [Google Scholar] [CrossRef]
  5. Zhou, X.; Yang, H.; Hu, J.; Zhu, Y. Exploration Examples of Marine Oil and Gas Fields in China—Exploration and Discovery of Donghetang Marine Sandstone Oilfield in Tarim Basin. Mar. Oil-Gas Geol. 2010, 15, 73–78, (In Chinese with English abstract). [Google Scholar]
  6. Zhang, J.; Wang, Z.; Sun, B.; Sun, X.; Liao, Y. An Integrated Prediction Model of Hydrate Blockage Formation in Deep-Water Gas Wells. Int. J. Heat Mass Transf. 2019, 140, 187–202. [Google Scholar] [CrossRef]
  7. Wang, Z.; Zhu, S.; Zhou, W.; Liu, H.; Hu, Y.; Guo, P.; Du, J.; Ren, J. Experimental Research of Condensate Blockage and Mitigating Effect of Gas Injection. Petroleum 2018, 4, 292–299. [Google Scholar] [CrossRef]
  8. Zhang, L.; Geng, S.; Yang, L.; Wen, R.; He, C.; Zhao, Z.; Qin, G. Formation Blockage Risk Analysis of Geothermal Water Reinjection: Rock Property Analysis, Pumping and Reinjection Tests, and Long-Term Reinjection Prediction. Geosci. Front. 2022, 13, 101299. [Google Scholar] [CrossRef]
  9. Luo, W.; Lin, Y.; Dong, H.; Wu, Q. Wellbore blockage removal technology in Yuanba gas field. Pet. Drill. Technol. 2018, 46, 109–114, (In Chinese with English abstract). [Google Scholar] [CrossRef]
  10. Jiang, T.; Meng, X.; Huang, K.; Zhao, L.; Chen, D.; Wu, H. Wellbore Plugging Mechanism and Plugging Removal Technology in Keshen 2 Gas Field. Oil Drill. Amp 2020, 42, 657–661, (In Chinese with English abstract). [Google Scholar] [CrossRef]
  11. Li, E.; Jin, J.; Chen, L.; Lu, F.; Shi, Q.; Wu, J.; Zhang, Y. Study on Molecular Composition of Asphaltene in Wellbore Blockage in Southern Junggar Basin. Exp. Pet. Geol. 2022, 44, 306–313, (In Chinese with English abstract). [Google Scholar] [CrossRef]
  12. Yang, J.; Feng, Y.; Zhang, B.; Tang, Y.; Jiang, Z. A Blockage Removal Technology for Natural Gas Hydrates in the Wellbore of an Ultra-High Pressure Sour Gas Well. Nat. Gas Ind. B 2021, 8, 188–194. [Google Scholar] [CrossRef]
  13. Han, R.; Liu, Q.; Jiang, T.; Xu, H.; Xu, Z.; Zhao, L.; Lei, C.; Zhang, P. Feature, Origin and Distribution of Calcareous Interlayers: A Case of Carboniferous Donghe Sandstone in Hade Oil Field, Tarim Basin, NW China. Pet. Explor. Dev. 2014, 41, 475–484. [Google Scholar] [CrossRef]
  14. Fang, H.; Xu, H.; Wang, Z.; Jiang, T.; Zhao, Y.; Li, J. Formation Mechanism of the Donghe Sandstone Residual Oil Zone in the Tarim Basin, NW China. J. Pet. Sci. Eng. 2018, 171, 1023–1032. [Google Scholar] [CrossRef]
  15. Zhang, B.; Zhu, G.; Su, J.; Lu, Y. Oil and Gas Source and Distribution of Donghetang in West of Tabei Uplift. Earth Sci. Front. 2012, 19, 276–283. [Google Scholar]
  16. Hiyoshi, N.; Ikeda, T.; Hasegawa, Y.; Sato, K. Observation of La-Exchanged NaY Zeolite Using Aberration-Corrected Scanning Transmission Electron Microscopy. Microporous Mesoporous Mater. 2021, 311, 110711. [Google Scholar] [CrossRef]
  17. Kishida, K.; Okutani, M.; Inui, H. Direct Observation of Zonal Dislocation in Complex Materials by Atomic-Resolution Scanning Transmission Electron Microscopy. Acta Mater. 2022, 228, 117756. [Google Scholar] [CrossRef]
  18. Tollefson, A.D.; Smith, C.M.; Carpenter, M.H.; Croce, M.P.; Fassbender, M.E.; Koehler, K.E.; Lilley, L.M.; O’Brien, E.M.; Schmidt, D.R.; Stein, B.W.; et al. Measurement of 227Ac impurity in 225Ac using decay energy spectroscopy. Appl. Radiat. Isot. 2021, 172, 109693. [Google Scholar] [CrossRef]
  19. Guilbaud, R.; White, M.L.; Poulton, S.W. Surface Charge and Growth of Sulphate and Carbonate Green Rust in Aqueous Media. Geochim. Et Cosmochim. Acta 2013, 108, 141–153. [Google Scholar] [CrossRef]
  20. Li, Z.; Li, B.; Du, L.; Wang, W.; Liao, X.; Yu, H.; Yu, C.; Wang, H.; Li, Q. Three-Dimensional Oxygen-Doped Porous Graphene: Sodium Chloride-Template Preparation, Structural Characterization and Supercapacitor Performances. Chin. J. Chem. Eng. 2021, 40, 304–314. [Google Scholar] [CrossRef]
  21. Hanor, J.S.; Wendeborn, F.C. Origin of Sodium Bicarbonate Groundwaters, Southern Hills Aquifer System, USA by Silicate Hydrolysis. Appl. Geochem. 2022, 148, 105512. [Google Scholar] [CrossRef]
  22. Zhang, X.; Li, W.; Wang, F.; Wang, N.; Xu, Y.; Liu, Y.; Cheng, R.; Liu, H. Biomarker Characteristics of Paleogene Source Rocks in Liaodong Bay Area and Its Geological Significance. Lithol. Hydrocarb. Reserv. 2021, 34, 73–85, (In Chinese with English abstract). [Google Scholar] [CrossRef]
  23. Alfken, S.; Wörmer, L.; Lipp, J.S.; Wendt, J.; Taubner, H.; Schimmelmann, A.; Hinrichs, K.-U. Micrometer Scale Imaging of Sedimentary Climate Archives—Sample Preparation for Combined Elemental and Lipid Biomarker Analysis. Org. Geochem. 2019, 127, 81–91. [Google Scholar] [CrossRef]
  24. Graham, S.A.; Brassell, S.; Carroll, A.R.; Xiao, X.; Demaison, G.; McKnight, C.L.; Liang, Y.; Chu, J.; Hendrix, M.S. Characteristics of Selected Petroleum Source Rocks, Xianjiang Uygur Autonomous Region, Northwest China. AAPG Bull. 1990, 74, 493–512. [Google Scholar] [CrossRef]
  25. Wu, W.; Hou, J. Analysis of the composition and causes of oil well plugging in an oilfield in Xinjiang. Oilfield Chem. 2022, 39, 349–354, (In Chinese with English abstract). [Google Scholar] [CrossRef]
  26. da Silva Brito, A.; Rodrigues Nogueira, A.C.; Gomes de Almeida, L.T.; Gonçalo de Lima, S. Orbital-Scale Cyclicity and Organic Matter Production in a Permian Shallow Mixed Carbonate-Siliciclastic System: Paraná Basin, Brazil. Mar. Pet. Geol. 2023, 147, 105987. [Google Scholar] [CrossRef]
  27. Lima, B.L.B.; Marques, N.N.; Souza, E.A.; Balaban, R.C. Polysaccharide Derivative as an Additive in Olefin-Based Drilling Fluid. J. Mol. Liq. 2022, 364, 120023. [Google Scholar] [CrossRef]
  28. Bagum, M.; Ahammad, J.M.; Husain, T.; Hossain, M.E. An Experimental Study to Develop an Environmental Friendly Mud Additive of Drilling Fluid Using Aloe Vera. J. Pet. Sci. Eng. 2022, 211, 110135. [Google Scholar] [CrossRef]
  29. Han, H.; Feng, Y.; Chen, J.; Xie, Q.; Chen, S.; Sheng, M.; Zhong, S.; Wei, W.; Su, S.; Fu, P. Acidification Impacts on the Molecular Composition of Dissolved Organic Matter Revealed by FT-ICR MS. Sci. Total Environ. 2022, 805, 150284. [Google Scholar] [CrossRef]
  30. Li, S.; Cao, J.; Hu, S.; Luo, G. Characterization of Compounds in Unresolved Complex Mixtures (UCM) of a Mesoproterzoic Shale by Using GC×GC-TOFMS. Mar. Pet. Geol. 2015, 66, 791–800. [Google Scholar] [CrossRef]
  31. Meyers, P.; Ishiwatari, R. Lacustrine Organic Geochemistry—An Overview of Indicators of Organic Matter Sources and Diagenesis in Lake Sediments. Org. Geochem. 1993, 20, 867–900. [Google Scholar] [CrossRef] [Green Version]
  32. Didyk, B.M.; Simoneit, B.R.T.; Brassell, S.C.; Eglinton, G. Organic Geochemical Indicators of Palaeoenvironmental Conditions of Sedimentation. Nature 1978, 272, 216–222. [Google Scholar] [CrossRef]
  33. Peters, K.E.; Walters, C.C.; Moldowan, J.M. Biomarkers: Assessment of Petroleum SourceRock Age and Depositional Environment; Springer International Publishing: Cham, Switzerland, 2017; pp. 1–11. [Google Scholar]
  34. Seifert, W.K.; Michael Moldowan, J. Applications of Steranes, Terpanes and Monoaromatics to the Maturation, Migration and Source of Crude Oils. Geochim. Et Cosmochim. Acta 1978, 42, 77–95. [Google Scholar] [CrossRef]
  35. McArthur, J.M. Early Toarcian Black Shales: A Response to an Oceanic Anoxic Event or Anoxia in Marginal Basins? Chem. Geol. 2019, 522, 71–83. [Google Scholar] [CrossRef]
  36. Li, N.; Huang, H.; Jiang, W.; Wu, T.; Sun, J. Biodegradation of 25-Norhopanes in a Liaohe Basin (NE China) Oil Reservoir. Org. Geochem. 2015, 78, 33–43. [Google Scholar] [CrossRef]
  37. Yin, F.; He, Z.; Song, Z.; Su, P.; Zhang, L.; Feng, D.; Yang, T. The Fingerprint Stability of the Biomarker Hopanes and Steranes in Soot Emissions from In-Situ Burning of Oil. Sci. Total Environ. 2022, 839, 156273. [Google Scholar] [CrossRef]
  38. Holba, A.; Dzou, L.; Masterson, W.; Hughes, W.; Huizinga, B.; Singletary, M.; Moldowan, J.; Mello, M.; Tegelaar, E. Application of 24-Norcholestanes for Constraining Source Age of Petroleum. Org. Geochem. 1998, 29, 1269–1283. [Google Scholar] [CrossRef]
  39. Barbanti, S.; Moldowan, J.; Watt, D.; Kołaczkowska, E. New Triaromatic Steroids Distinguish Paleozoic from Mesozoic Oil. Org. Geochem. 2011, 42, 409–424. [Google Scholar] [CrossRef]
  40. Huang, H.; Zhang, H.; Yin, M.; Han, D. Molecular Composition Characterization of Oilsand Heating Experiments to Investigate Steam-Solvent Effects and Chemical Reactions during Thermal Recovery. Energy Fuels 2021, 35, 9917–9929. [Google Scholar] [CrossRef]
  41. Wu, L.; Jin, Z.; Liu, K.; Chu, Z.; Yang, P. Evolution of a Deeply-Buried Oil Reservoir in the North Shuntuoguole Low Uplift, Tarim Basin, Western China: Insights from Molecular Geochemistry and Re–Os Geochronology. Mar. Pet. Geol. 2021, 134, 105365. [Google Scholar] [CrossRef]
  42. Curiale, J.A.; Harrison, W.E.; Smith, G. Sterane Distribution of Solid Bitumen Pyrolyzates. Changes with Biodegradation of Crude Oil in the Ouachita Mountains, Oklahoma. Geochim. Et Cosmochim. Acta 1983, 47, 517–523. [Google Scholar] [CrossRef]
  43. Hong, W.; Qinglai, F.; Jianxin, Y.; Shan, C. Characteristics and Sources of Organic Matter from the Early Cambrian Niutitang Formtion and Its Preservation Environment in Guizhou. J. Earth Sci. 2022, 33, 933–944. [Google Scholar] [CrossRef]
  44. Wu, X.; Guo, Q.; Zhang, W.; He, D.; Qi, X.; Li, D. Characteristics of Volcanic Reservoirs and Hydrocarbon Accumulation of Carboniferous System in Junggar Basin, China. J. Earth Sci. 2021, 32, 972–985. [Google Scholar] [CrossRef]
  45. Chengpeng, S.; Shu, J.; Zhixin, W.; Zhaomin, W. Comparison of the Petroleum Geology in the Deep-Water Basins between the Passive Margin of Morocco and Its Conjugate Margin of Canada. J. Earth Sci. 2020, 31, 919–929. [Google Scholar] [CrossRef]
  46. Fowler, M.G.; Brooks, P.W. Organic Geochemistry as an Aid in the Interpretation of the History of Oil Migration into Different Reservoirs at the Hibernia K-18 and Ben Nevis I-45 Wells, Jeanne d’Arc Basin, Offshore Eastern Canada. Org. Geochem. 1990, 16, 461–475. [Google Scholar] [CrossRef]
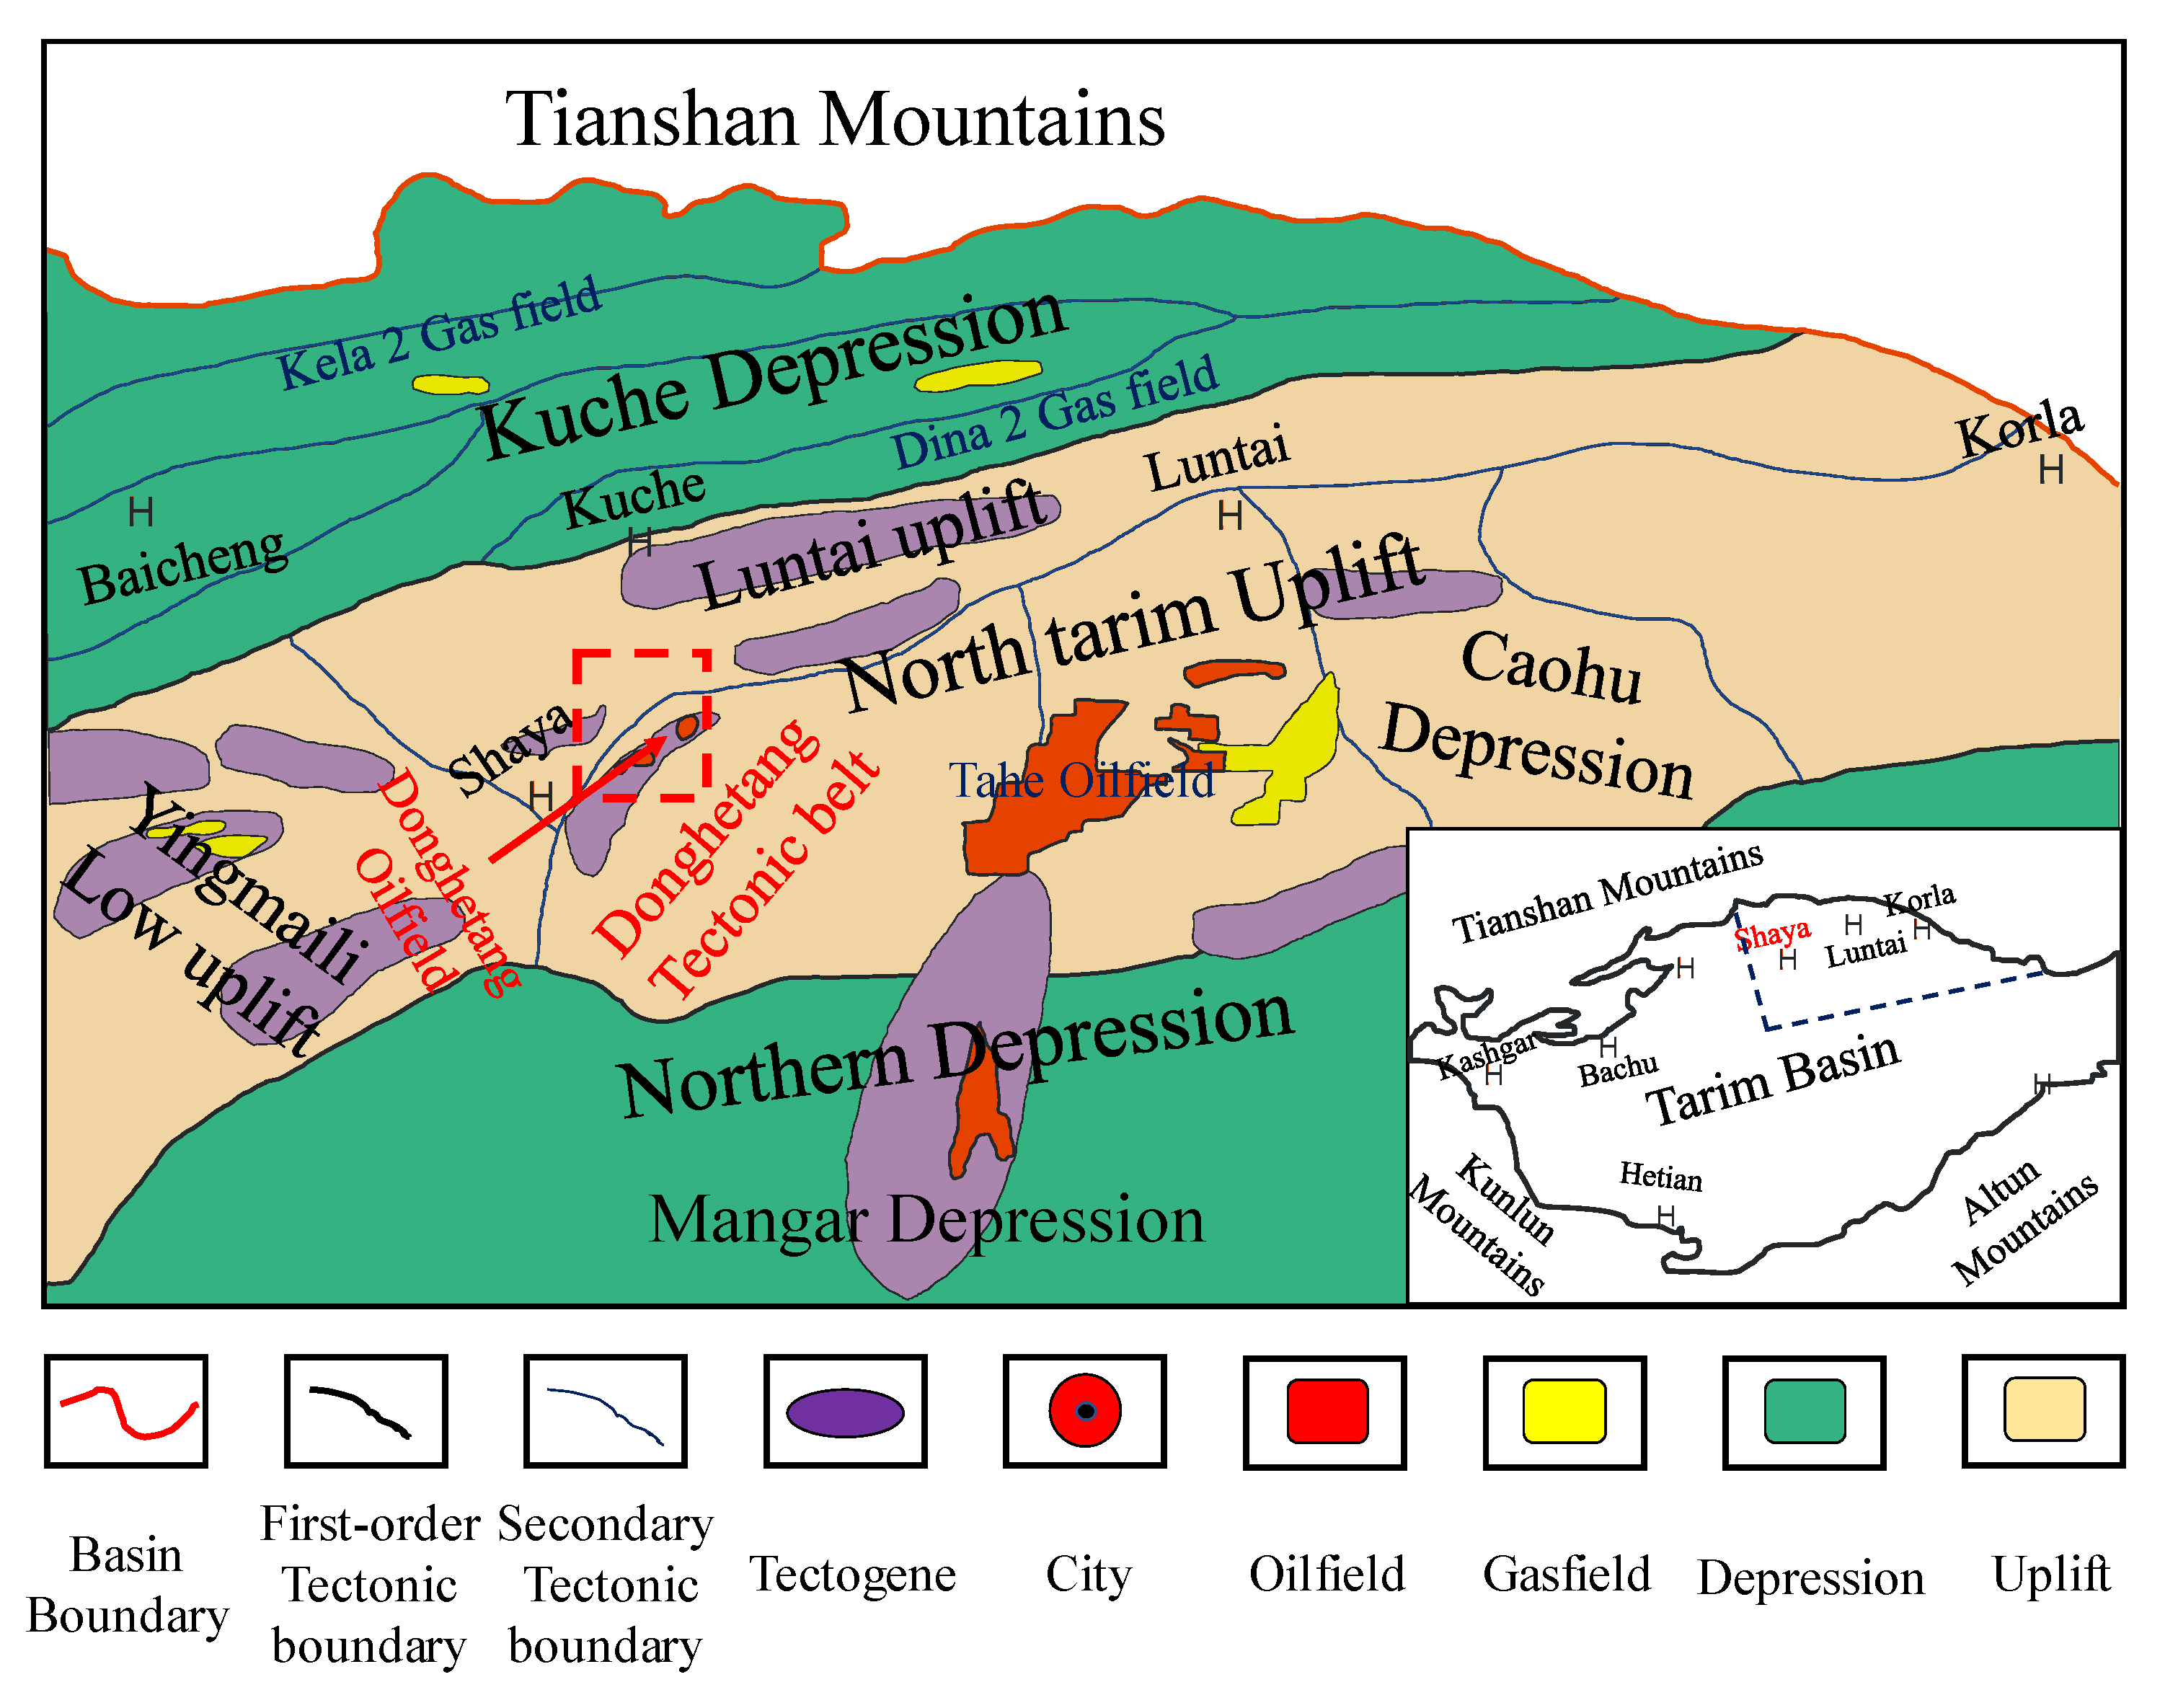
Figure 1. Regional location and tectonic features of the Tarim Basin [5].
Applsci 13 01504 g001
Figure 2. N–W seismic profile of Well DH231 [14].
Applsci 13 01504 g002
Figure 3. Photograph of the wellhead blockage in Well DH231.
Applsci 13 01504 g003
Figure 4. Micrograph of the inorganic and organic portions of the wellhead blockage ((a): reflected light images; (b,c): polarized light images).
Applsci 13 01504 g004
Figure 5. Scanning electron micrograph and energy spectrum analysis of unknown mixture (x. spot: sampling points for energy spectrum analysis). (a) Scanning electron micrograph of 180×; (b) Scanning electron micrograph of 540×; (c) Scanning electron micrograph of 4700×; (d) energy spectrum analysis of sampling points.
Applsci 13 01504 g005
Figure 6. Comparison of the relative content changes in components before and after acidification of the blockage at the wellhead of Well DH231.
Applsci 13 01504 g006
Figure 7. Whole oil chromatogram of wellhead blockage in Well DH231 before and after acidification (RIC).
Applsci 13 01504 g007
Figure 8. Saturated hydrocarbon fraction m/z 191 mass chromatogram of oil stains in the wellhead blockage before and after acidification of Well DH231.
Applsci 13 01504 g008
Figure 9. Saturated hydrocarbon fraction m/z 217 mass chromatogram of oil stains in the wellhead blockage before and after acidification of Well DH231.
Applsci 13 01504 g009
Figure 10. The composition of steranes and terpenoids in the blockade and its comparison with crude oil from adjoining wells.
Applsci 13 01504 g010
Figure 11. The cross plots of Pr/nC17 and Ph/nC18 of Ordovician crude oil and the wellhead blockage.
Applsci 13 01504 g011
Figure 12. Comparison of distribution curve of C15 + n-alkanes.
Applsci 13 01504 g012
Table 1. The workflow of Soxhlet extraction components’ separation.
(a) Soxhlet Extraction Workflow(b) Components Separation Workflow
Put the blockage into an oven and dry at 40 °C for 12 h
Take 50 mg chloroform bitumen “A” in a triangular flask
Pulverize the dried blockage to 100–120 mesh
Add 1 mL of dichloromethane and 20 mL of petroleum ether in the triangular flask and leave for 12 h to precipitate out the bitumen
The powder of blockage is subjected to 72 h Soxhlet extraction with chloroform
After filtration of asphaltene, the filtrate is concentrated to 1 mL
Chloroform bitumen “A” is air-dried at room temperature
The filtrate is transferred into a chromatographic column filled with 2.5 g 100–200 mesh neutral alumina
The air-dried chloroform bitumen “A” is weighedThe saturated hydrocarbon is eluted with 10 mL of n-hexane
Table 2. Absolute mass statistics of components before and after acidification of wellhead blockage in Well DH231.
No.TypeComponentsWeight, mg
DH 231H
(before acid treatment)
MineralIron oxide, dolomite2.2
OrganicsSat11.2
Aro5.1
Res1.2
Asp17.6
DH 231H
(after acid treatment)
MineralIron oxide, dolomite1.27
OrganicsSat12.6
Aro6.9
Res2.8
Asp16.3
Note: Sat: saturated hydrocarbon; Aro: aromatic hydrocarbon; Res: resin; Asp: asphaltene.
Table 3. Geochemical parameters of Ordovician crude oil and wellhead blockage.
No.WellDepth (m)TypeStrataA1A2A3A4A5A6A7A8B1B2B3B4B5B6B7
1DH306043–6078OilC/1.081.051.920.150.07//1.927.340.200.060.600.670.47
2DH46068–6085OilCnC101.070.991.200.580.535.683.301.8911.700.260.050.920.650.50
3DH56076–6099OilCnC101.111.021.230.410.395.272.532.0410.910.260.060.910.650.48
4DH6016063–6089OilCnC111.041.021.220.630.564.381.671.052.180.280.050.980.660.49
5DH231(B)////1.071.020.940.250.290.83.110.7110.050.250.070.800.600.48
6DH231(A)////1.061.020.900.300.340.813.850.9711.050.230.060.710.610.51
Note: A1: main peak carbon; A2: CPI; A3: OEP; A4: Pr/Ph; A5: Pr/nC17; A6: Ph/nC18; A7: ∑nC21-/∑nC22+; A8: (nC21 + nC22)/(nC28 + nC29); B1: Tm/Ts; B2: C30H/C30M; B3: C29Ts/C29H; B4: C30DH/C30H; B5: ααα 20R Sterane C27/C29; B6: C29αββ/(αββ + ααα); B7: C29ααα 20S/(20S + 20R); Pr: pristane; Ph: phytane; H: hopane; M: moretane; DH: rearranged hopane; A: after acid treatment; B: before acid treatment.
Disclaimer/Publisher’s Note: The statements, opinions and data contained in all publications are solely those of the individual author(s) and contributor(s) and not of MDPI and/or the editor(s). MDPI and/or the editor(s) disclaim responsibility for any injury to people or property resulting from any ideas, methods, instructions or products referred to in the content.