Abstract
Punching shear-reinforced flat slabs can fail in three modes: (1) inside the shear-reinforced zone, (2) outside the shear-reinforced zone, or (3) at the maximum punching shear capacity. By using the theory of structural systems reliability, this study investigates how these failure modes combined affect the safety level of reinforced concrete flat slabs with punching shear reinforcement, and ultimately, the variation of partial factors. Based on DIN EN 1992-1-1 together with the German National Annex DIN EN 1992-1-1+NA(D), and by using distinct reliability-based methods (i.e., levels II and III), the variation in the system failure probabilities and, consequently, partial factors were analysed. The results indicated that partial factors can fluctuate significantly depending on the governing ultimate limit state function and the scatter of basic variables. Furthermore, they indicated that the chosen reliability-based method had a significant influence on the resulting safety level. The sensitivity analysis confirmed the premise that partial factors can be reduced without compromising socially accepted safety levels (e.g., recommended in DIN EN 1990). Ultimate benefits include material and cost savings and CO2 emission reductions. Finally, the approach addressed in this paper offers a new perspective on the derivation of partial factors that can be considered by engineering practitioners.
1. Introduction
Reinforced concrete (RC) flat slabs are well-accepted structural solutions because they enable easy and flexible partitions of space compared with slabs with beams, leading to an easy way to simplify and speed up site operations (e.g., [1]). However, it is also recognised that in slab-column connections of RC flat slabs, shear stress concentrations can occur and lead to a sudden brittle punching failure. A punching shear failure may occur in regions surrounding the columns of RC flat slabs with a much lower load than that which could cause flexure failure [1]. Nonetheless, when addressed during the design phase, punching shear failure can be prevented by using drop panels, increasing the column head dimensions and/or using punching shear reinforcement (for example, through stirrups, bent-up bars or studs). It is generally accepted that adequate use of punching shear reinforcement can either improve the punching strength capacity or reach the flexural capacity of RC flat slabs.
Yet, providing that RC flat slabs have punching shear reinforcement, failure modes (or mechanisms) can still occur in any of the following situations (e.g., [1,2,3]):
- (1)
- Failure inside the zone of punching shear reinforcement (i.e., failure in the surface crossing one or more rows of punching shear reinforcement);
- (2)
- Failure outside the zone of punching shear reinforcement (i.e., failure in the surface located in the region outside the punching shear reinforcement elements);
- (3)
- Failure at the maximum punching shear capacity (i.e., failure in the compression zone directly at the face of the column).
The typical crack formations of these punching shear failure modes, with and without punching shear reinforcement, are illustrated in Figure 1.
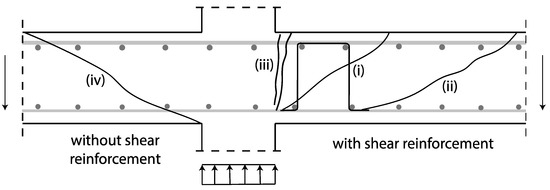
Figure 1.
Scheme of the typical crack formations of punching shear failure modes: (i) inside and (ii) outside the zones of punching shear reinforcement, (iii) at maximum punching shear capacity and (iv) without punching shear reinforcement (adapted from [2]).
In Germany, the punching shear design provisions (with and without reinforcement) included in the European structural code DIN EN 1992-1-1 [4,5] are supplemented by the National Annex NA(D) [6,7]. In the following sections, this combination is abbreviated as DIN EN 1992-1-1+NA(D) [4,5,6,7].
If a low amount of punching shear reinforcement is installed and a shear crack appears, the punching shear reinforcement will be activated. Due to the low amount of reinforcement, it will start to yield immediately and the crack width cannot be controlled. This lack of control can lead to immediate failure. This should be avoided through a minimum amount of punching shear reinforcement, which is established by the structural code. For larger amounts of punching shear reinforcement, a failure can occur at the maximum punching shear capacity, inside the shear-reinforced zone, or even outside the shear-reinforced zone, depending on the number of reinforcement rows. Despite the design being normally governed by the smallest punching shear resistance, the extent to which the above-described failure modes influence partial factors for building materials (i.e., concrete and reinforcing steel) can vary. When it is unclear which type of failure is decisive due to the scatter of basic variables (namely, material and geometric properties and model uncertainties), the use of reliability-based methods enables the assessment of failure probabilities and the corresponding reliability indices (as a measure of structural safety level) for a structural system or component.
The theory of structural systems reliability offers means to assess these failure probabilities and reliability indices when a system is subjected to multiple failure modes (e.g., [8,9,10,11,12,13]). In principle, a structural system can be idealised and modelled in two ways (e.g., [8,9,10,11,12,13]): (1) a series system, also known as the weakest link system, which is said to fail if at least one component (e.g., structural element, section, or point in the structure where yielding occurs) fails or the conditions are met to fail in one of several mutually exclusive modes [10], and (2) a parallel system, which is said to fail if all components have failed or all originally redundant structural configurations or paths to carry the load have been eliminated [10]. In theory, a third type of structural system, a so-called hybrid or mixed system, is also possible to mechanically idealise and model by combining the concepts of series and parallel systems (e.g., [11]).
By using the theory of structural systems reliability and focusing on the structural code DIN EN 1992-1-1+NA(D) [4,5,6,7], this study explores how the punching shear failure modes affect the safety level of a RC flat slab with punching shear reinforcement, and ultimately, the variation of partial factors for concrete. This study was undertaken in the context of a research initiative promoted by the German Federal Ministry for Economic Affairs and Energy (in German: Bundesministerium für Wirtschaft und Energie). One of the goals of this research project was the development of an open-source software package (developed in the software language R [14]) for structural reliability computations. Named as TesiproV (Hochschule Biberach/RWTH Aachen) [15], the ultimate goal of this package is to facilitate and promote the use of reliability-based approaches among structural engineering practitioners and scientific communities [16,17]. It should be also noted that this investigation is in line with previous reliability assessments of punching shear resistance models for flat slabs (e.g., [18]). Yet, the parametric study addressed in this paper is original and not addressed in any other publication.
This paper is organised in the following manner: Section 2 presents the design provisions for punching shear with shear reinforcement as described in DIN EN 1992-1-1+NA(D) [4,5,6,7]. Section 3 offers a brief overview of the theory of systems reliability and Section 4 describes the considerations adopted for the design and the reliability-based analyses of the structural system addressed in this investigation. Then, the respective results are presented in Section 5 and discussed in Section 6. Finally, Section 7 summarises the main conclusions of this investigation, alongside the main limitations and recommendations for further research developments.
2. Designing Flat Slabs against Punching Shear Failures with Shear Reinforcement
2.1. General Considerations
As mentioned above, the main design provisions for punching shear with and without shear reinforcement are given in the European structural code DIN EN 1992-1-1 [4,5], i.e., the “base” Eurocode 2. As explained, for example, in [19,20], such provisions are grounded on the design concept given in CEB/FIP Model Code 1990 [21], which is mostly based on empirical models (i.e., those that were fitted to experimental evidence). Yet, in Germany, the punching shear design provisions partly deviate from the original provisions in DIN EN 1992-1-1 [4,5], mainly to guarantee that the safety levels recommended in DIN EN 1990 [22] and DIN 1055-100 [23] can be reached (e.g., [2,3]). As a result, complementary design provisions were added to the National Annex NA(D) [6,7]. For the sake of this investigation, the design provisions for punching shear with and without shear reinforcement in the combined code DIN EN 1992-1-1+NA(D) [4,5,6,7] were adopted.
2.2. Design Provisions for Punching Shear with Shear Reinforcement according to DIN EN 1992-1-1 (Eurocode 2)
For RC flat slabs without shear reinforcement, the punching shear resistance is evaluated along different control perimeters. For slabs without shear reinforcement, DIN EN 1992-1-1 [4,5] also demands that the shear stress at the periphery of the loaded area does not exceed the web-crushing limit (i.e., crushing of the compressive strut) for beams :
with d being the distance from the extreme compression fibre to the centroid of the longitudinal tensile reinforcement (also known as the effective depth) and being a factor accounting for the strength reduction of concrete compression struts in cracked concrete due to lateral tension stresses and given by , with referring to the characteristic compressive strength of concrete (for cylinders). The term refers to a load increase factor to account for load eccentricities (i.e., the non-uniform shear distribution along the column perimeter).
The second control perimeter applies at a distance of 2.0d from the periphery of the loaded area (Figure 2). The shear stress along this perimeter should not exceed the punching shear resistance without shear reinforcement :
Note that DIN EN 1992-1-1 [4,5] provides three methods to allow for the effect of combined shear and an unbalanced moment [24]: (1) the assumption of a fully plastic distribution of shear stresses along the critical perimeter, (2) a reduction in the basic control perimeter, or (3) the use of constant shear force multipliers. For non-sway systems, and where the adjacent spans do not differ in length by more than 25%, the load increase factors may be taken as equal to 1.5, 1.4 and 1.15 for the corner, edge and interior columns, respectively. Two other methods are described in [24].

Figure 2.
Typical critical control sections around load introduction areas according to DIN EN 1992-1-1 [4,5].
Figure 2.
Typical critical control sections around load introduction areas according to DIN EN 1992-1-1 [4,5].

The punching shear resistance without punching shear reinforcement is determined by using
with being the empirical factor for flat slabs (=0.18/ recommended in DIN EN 1992-1-1 [4,5]), with being the partial factor for concrete (=1.5 recommended in DIN EN 1992-1-1 [4,5]); referring to the mean flexural reinforcement ratio considering a slab width equal to the column width plus 3d on each side and given by . As referred above, the term refers to the characteristic compressive strength of concrete (for cylinders). The term k is given by and refers to a size effect factor for the effective depth d; the parameter refers to the minimum punching shear capacity, which is especially critical for small flexural reinforcement amounts in combination with a high concrete compressive strength. The term refers to the empirical factor that defines the amount of normal stress to be considered (=0.10 is recommended in DIN EN 1992-1-1 [4,5]) and refers to the normal concrete stress in the critical section (e.g., due to pre-stressing).
The punching shear design of prestressed interior column-slab connections is discussed in detail in [25].
The punching shear resistance inside the shear-reinforced zone is calculated by using a strut-and-tie model with a compression strut inclination of 33° in combination with a constant concrete contribution:
with being the punching shear resistance without shear reinforcement (calculated with Equation (3)), being a factor that limits the punching shear capacity (=1.5 recommended for stirrups as punching shear reinforcements), being the amount of shear reinforcement provided in each row and being the radial spacing between adjacent rows of shear reinforcement. The term refers to the effective design strength of the punching shear reinforcement, which considers the worse anchorage of the punching shear reinforcement for small slab thicknesses and is defined as . The term refers to the angle between the punching shear reinforcement and the plane of the slab.
The amount of punching shear reinforcement that is calculated must be provided in several rows. The precise number of rows required is determined by the shear strength without shear reinforcement (calculated with Equation (3)) checked along the outer perimeter, which is located at a distance of 1.5d from the outermost row.
At least two rows of shear reinforcement are needed. The first row must be placed at a distance of 0.30d ≤ ≤ 0.50d from the boundary of the loaded area. The radial spacing between additional rows of shear reinforcement should be limited to 0.75d. For inclined bars, the effective cross-section must be determined using . Note that the punching shear capacity with punching shear reinforcement is limited by the maximum capacity (Equation (1)), which must be checked along the column perimeter .
2.3. Complementary Design Provisions for Punching Shear with Shear Reinforcement in the German National Annex NA(D)
The design value of the applied shear stresses along the critical perimeter at a distance 2.0d from the boundary of the loaded area can be calculated in accordance with DIN EN 1992-1-1+NA(D) [4,5,6,7] using
For interior column-slab connections, the load increase factor is slightly reduced in comparison to DIN EN 1992-1-1 [4,5] to 1.1. It should be noted here that limiting the shear stresses directly at the perimeter of the load application area to a value equal to the web-crushing limit of beams is, according to DIN EN 1992-1-1+NA(D) [4,5,6,7], obsolete since a previous comparison with test results clearly showed a dependency on the concrete compressive strength and the specific column perimeter /d [2,26,27]. In addition, limiting the shear stresses at the face of the column to means that it is not possible to consider a potential increase in the punching shear resistance due to improved punching shear elements, such as double-headed studs or lattice girders [28,29,30].
As in DIN EN 1992-1-1 [4,5], the punching shear capacity without shear reinforcement is calculated according to Equation (3). For interior column–slab connections and /d ratios < 4.0, a reduced empirical pre-factor is given by
To avoid compression reinforcement, DIN EN 1992-1-1+NA(D) [4,5,6,7] limits the flexural reinforcement ratio to . For effective depths > 600 mm, the minimum punching shear capacity is reduced in comparison to DIN EN 1992-1-1 [4,5] and is equal to the minimum shear capacity of the German bridge-building provisions “DIN Fachbericht 102” [31]:
For effective depths between 600 mm and 800 mm, the pre-factor may be interpolated linearly.
Limiting the shear stresses to (i.e., web-crushing limit) at the column perimeter was not adopted in Germany. The maximum punching shear capacity was defined as 1.4 times the punching shear capacity without shear reinforcement [2,3,26,27]:
Furthermore, DIN EN 1992-1-1+NA(D) [4,5,6,7] demands that the amount of punching shear reinforcement is increased by a factor of for the first row (at a distance of 0.3d to 0.5d) and by a factor of for the second row. From the third row onwards, a factor of is assumed. The distance between adjacent rows needs to be adjusted to a maximum of 0.75d.
In principle, as many rows of punching shear reinforcement are to be arranged as it is required until the verification of the punching shear capacity of a linearly supported slab (one-way shear) is fulfilled along an outer control perimeter at the distance of 1.5d from the outermost punching shear reinforcement row. The required length of the outer circular section is determined using
with the corresponding to the punching shear capacity without shear reinforcement (Equation (3)). Note that for the verification of the punching shear capacity outside the punching shear reinforced area according to NA(D) [6,7], the term in Equation (3) shall have an empirical pre-factor (with ) and a factor equal to 0.10.
3. Foundations of the Theory of Structural Systems Reliability
Normally, failures in structural systems are dependent events since the same uncertain variables are embedded in the functions describing the passage into the failure modes of different components; this dependency makes the probabilistic evaluation of a system’s reliability rather complex [10]. During the 1960s, Cornell [8] proposed a simple approach to assess the reliability of a structural system, the so-called simple bounds. Simple bounds are a first-order technique to evaluate the reliability of a structural system when it is affected by multiple failure modes. The outcome is a range of values (or, as the name implies, bounds) of failure probabilities and corresponding reliability indices containing the “precise” failure probability. These bounds are defined by the extreme cases of correlation between failure modes: perfect or full correlation ( = 1) and no correlation ( = 0).
For the sake of this investigation, it was assumed that the failure modes described in Section 1 are idealised in a structural series system, which, as described above, represents the failure of a system if any of the failure modes is activated (i.e., the weakest link of the system governs the failure). The simple bounds of a series system are defined as (e.g., [8,9,10,11,12,13]):
with the lower bound being the failure probability when all elements are fully correlated (i.e., the failure probability of the system is equal to the failure probability of the failure mode with the largest failure probability, i.e., a system where the weakest linl may be cleary identified). The upper bound being the failure probability when all the elements are uncorrelated (i.e., the system will not necessarily fail in the failure mode with the largest failure probability; there is a probability that failure will take place in any of the links of the system). The corresponding reliability index of a system (i.e., a system safety level) is calculated as follows (e.g., [8,9,10,11,12,13]):
with being the reliability indices of the individual failure modes .
4. Considerations for the Reliability Analyses of the Structural System
4.1. Database of Experimental Tests and Data Filtering Criteria
To set up the resistance models for punching shear with shear reinforcement, the database compiled at the Institute of Structural Concrete (IMB) of RWTH Aachen University (Germany) was used. Initiated by Beutel [32], the database has been continuously maintained and updated by multiple researchers (e.g., [33,34,35,36,37]). The version considered in this investigation comprises 308 tests on RC flat slabs with punching shear reinforcement. According to the database, these tests are divided into different failure modes. Since the tests could not always be allocated to a single failure mode, some tests were assigned to several failure modes. The sum of the tests evaluated for the different failure modes is, therefore, greater than the total number of tests.
For a proper statistical evaluation of the model uncertainties (Section 4.2), the tests were filtered according to the following criteria:
- (1)
- The tests should contain at least one row of punching shear reinforcement.
- (2)
- Only star-like punching shear reinforcement was used.
- (3)
- Only stirrup reinforcement (or comparable reinforcement) was considered (note that this criterion does not apply to failure mode (ii) referring to failure outside the punching shear reinforcement zone).
- (4)
- The tests should have complete documentation of all the parameters needed for the design calculation according to DIN EN1992-1-1+NA(D) [4,5,6,7].
In addition to these filters defined on the basis of DIN EN1992-1-1+NA(D) [4,5,6,7], individual test series were excluded from the evaluation after reviewing the corresponding literature. This applied to the cases where the results were not comprehensible, or the data parameters were not properly described. The application of these filters together with this individual analysis reduced the database to 38 tests regarding failure inside the punching shear reinforced zone (failure mode (i)), 44 tests regarding failure outside the punching shear reinforced zone (failure mode (ii)) and 41 tests regarding failure at the maximum punching shear capacity (failure mode (iii)).
4.2. Stochastic Models for the Basic Variables
The stochastic models for the basic variables that affect the design equations described in Section 2 were defined based on the provisions of the JCSS Probabilistic Model Code [38]. These models are presented and described throughout Table 1, Table 2 and Table 3. For the sake of this investigation, all the basic variables are considered uncorrelated.
The stochastic models for the concrete compressive strength described in Table 1 are particularly relevant. As a material property, concrete compressive strength is typically described using a logarithmic normal distribution (i.e., lognormal distribution), as it does not allow for negative values (e.g., [39]). Since concrete compressive strength is affected by multiple factors, such as limited sample sizes, the production site and the time of year, it is generally accepted that its mean and its standard deviation are also considered random variables.
In statistics, the conjugate prior of a normal or lognormal distribution with an unknown mean and standard deviation is a normal-gamma distribution (e.g., [39]), which is a bivariate four-parameter family of a continuous probability distribution. These four parameters are commonly denoted as and , with referring to the mean value of a sample with size and being the empirical standard deviation of a sample of size . To describe the stochastic model for the concrete compressive strength, a four-parameter distribution (log-Student’s-t distribution) was used, whose parameters are given in the JCSS Probabilistic Model Code [38] for different concrete strength classes (Table 1). Note that a log-Student’s-t distribution arises as the marginal distribution, which results from the integration of a normal-gamma posterior distribution and is the required distribution density for concrete compressive strength (e.g., [39]).

Table 1.
Stochastic values for the concrete compressive strength variable.
Table 1.
Stochastic values for the concrete compressive strength variable.
| Concrete Class | Prior Parameters (*) [38] | Parameters for a Lognormal Distribution | fcm | fck | |||||
|---|---|---|---|---|---|---|---|---|---|
| Standard | |||||||||
| C25 | 3.65 | 3.0 | 0.12 | 10 | 3.65 | 0.164 | 39.00 | 6.45 | 28.36 |
| C35 | 3.85 | 3.0 | 0.09 | 10 | 3.85 | 0.123 | 47.35 | 5.86 | 38.37 |
| C45 | 3.98 | 3.0 | 0.07 | 10 | 3.98 | 0.096 | 53.76 | 5.17 | 45.71 |
(*) Parameters for ready-mixed concrete. fcm: mean value of concrete comp. strength (cylinder) . standard deviation of concrete comp. strength (cylinder) . fck: characteristic concrete comp. strength at 28 days (cylinder)
Another relevant basic variable is the model uncertainty. The model uncertainty generally accounts for effects that are neglected in model simplifications and mathematical relationships (e.g., [40,41]). As previous studies already demonstrated (e.g., [18,40,41]), uncertainties in resistance models can play a significant role in structural safety evaluations and the calibration of partial factors in semi-probabilistic designs and, therefore, their thorough consideration is critical for the feasibility of any reliability-based investigation. According to the JCSS Probabilistic Model Code [38], the model uncertainty variable is typically characterised by a lognormal distribution. Nonetheless, in the context of this investigation, this assumption needed to be properly evaluated. Thus, the statistical parameters of the distribution function describing the model uncertainty were estimated from the data stored in the experimental database described in Section 4.1. To this end, the theoretical (i.e., predicted) punching shear resistance (according to DIN EN 1992-1-1+NA(D) [4,5,6,7]) was compared with the experimental failure loads. Note that for the comparison, the punching shear was used, all the partial factors in the design equations were taken as unity and the mean value of concrete compressive strength (for cylinders) was adopted. Then, the statistical parameters of the related resistances were determined under the assumption of both the normal and lognormal distributions. By doing this, the quotients of the experimental failure loads and the theoretical punching shear resistances were determined.
In addition to the statistical characterisation of the model uncertainty, three consecutive analyses were carried out. First, a goodness-of-fit test–in this case, the Kolmogorov–Smirnov test (e.g., [42,43,44,45])—was adopted to evaluate whether the data followed the assumed distribution function (i.e., a lognormal distribution). The test hypothesis evaluates whether the data sample fits this assumed distribution function by comparing the deviation values with a target value, which depends on the significance level adopted and the sample size. The assumed lognormal distribution for the model uncertainty was confirmed for all the investigated resistance models (in this case, a resistance model for each of the failure modes identified in Section 1).
Second, the David–Hartley–Pearson test was used to detect potential outliers in the dataset [46]. The test checks whether it is likely that an observed extreme value belongs to a normally distributed population or whether it is an extreme observation. If an outlier is detected, the test is repeated, excluding the test result with the greatest distance from the mean value. This process is repeated until no further outliers are identified. Due to the lognormality of the data, before applying the David–Hartley–Pearson test, the data values were previously transformed to normality: . The test statistic was then determined for the transformed data values . Once this evaluation was concluded, the database was limited to 37 tests for failure inside the punching shear reinforced zone (failure mode (i)), 44 tests for failure outside the punching shear reinforced zone (failure mode (ii)) and 41 tests for failure at the maximum punching shear capacity (failure mode (iii)).
Third, the estimators for the real parameters were determined by means of point estimators and interval estimators (Table 2). As the name implies, a point estimator is a procedure used to produce an estimate of a parameter of interest and it is usually a function of only sample data values when these are available [47]. For the estimation of the expected value, the arithmetic mean of the population was used and for the estimation of the standard deviation, the unbiased empirical standard deviation of the population was adopted. The point estimators were then contrasted with the interval estimators; in this case, a confidence level of 95% was considered due to the limited size of the dataset. The lower estimates of the expected values and the upper estimates of the standard deviations were initially determined for a normal distribution. Then, the lognormal distributed parameters (i.e., expected value, standard deviation and coefficient of variation) were also determined for the point estimators and interval estimators.
Table 2.
Statistical parameters for the model uncertainty.
Table 2.
Statistical parameters for the model uncertainty.
| Failure Mode (Design Equation) | Parameter | Normal Distribution (ND) | Lognormal Distribution (LND) | |||||
|---|---|---|---|---|---|---|---|---|
| Point Estimators | Interval Estimators (IE) (95%) | Point Estimators | Interval Estimators (95%) | |||||
| LND Values | LND Values Converted | IE Values | IE Values Converted | Corrected Values | ||||
| (i) Inside shear reinf. zone (Equation (4)) | μ | 1.3927 | [1.3397; +∞] | 0.3219 | 1.3927 (a) | [0.2841; +∞] | [1.3478; +∞] (d) | 1.3478 |
| σ | 0.1910 | [–∞; 0.2375] | 0.1362 | 0.1906 (b) | [–∞; 0.1694] | [–∞; 0.2300] (e) | 0.2199 (g) | |
| CoV | 0.1371 | [–∞; 0.1773] | 0.4231 | 0.1368 (c) | [–∞; 0.5962] | [–∞; 0.1706] (f) | 0.1631 | |
| (ii) Outside shear reinf. zone (Equation (10)) | μ | 1.1072 | [1.0654; +∞] | 0.0903 | 1.1075 (a) | [0.0514; +∞] | [1.0713; +∞] (d) | 1.0713 |
| σ | 0.1648 | [–∞; 0.2008] | 0.1536 | 0.1712 (b) | [–∞; 0.1871] | [–∞; 0.2023] (e) | 0.1951 (g) | |
| CoV | 0.1489 | [–∞; 0.1885] | 1.7013 | 0.1545 (c) | [–∞; 3.6442] | [–∞; 0.1888] (f) | 0.1821 | |
| (iii) At max. punching shear capacity (Equation (9)) | μ | 1.0855 | [1.0567; +∞] | 0.0769 | 1.0855 (a) | [0.0500; +∞] | [1.0596; +∞] (d) | 1.0596 |
| σ | 0.1095 | [–∞; 0.1345] | 0.1021 | 0.1111 (b) | [–∞; 0.1254] | [–∞; 0.1334] (e) | 0.1224 (g) | |
| CoV | 0.1009 | [–∞; 0.1273] | 1.3277 | 0.1023 (c) | [–∞; 2.5058] | [–∞; 0.1259] (f) | 0.1155 | |
μ: expected value; σ: standard deviation; CoV: coefficient of variation. Equations for the calculation of the parameters of a lognormally distributed variable X (i.e., conversions [(a) to (f)] and the correction of (g)): Point estimators—(a) (b) (c). Interval estimators—
(d) (e) (f) . Correction of using the coefficient of variation based on [48]: (g)
Table 3.
Probabilistic models of the basic variables according to [38].
Table 3.
Probabilistic models of the basic variables according to [38].
| Basic Variables | Distr. | Unit | Nominal Value | Mean | Stand. | |
|---|---|---|---|---|---|---|
| Concrete compressive strength fc (also see Table 1) | C25 | LSD | N/mm² | 25 | 39.00 | 6.45 |
| C35 | 35 | 47.35 | 5.86 | |||
| C45 | 45 | 53.76 | 5.17 | |||
| Yield strength | fy | ND | N/mm² | 500 | 30 | |
| Effective depth | d | ND | mm | dnom | dnom +10 | 10 |
| Column dimensions | c, c∅ | ND | mm | cnom | cnom + 0.003cnom | 4 + 0.006cnom |
| Slab width | h | ND | mm | hnom | hnom + 10 | 10 |
| Reinf. area | As | ND | mm² | As,nom | As,nom | 0.02As,nom |
| Radial spacing of perimeter of shear reinforcement | sr | ND | mm | sr,nom | sr,nom | sr,nom ± 20 |
| Model uncertainty: | ||||||
| (i) Inside reinf. zone | LND | - | 1.3478 | CoV: 0.1631 | ||
| (ii) Outside reinf. zone | LND | - | 1.0713 | CoV: 0.1821 | ||
| (iii) At max. punching shear capacity | LND | - | 1.0596 | CoV: 0.1155 | ||
LSD: log-Student’s-t distribution (parameters and described in Table 1). ND: normal distribution; LND: lognormal distribution; CoV: coefficient of variation.
Finally, by following the recommendation of Taerwe [48], the coefficient of variation was corrected with a value of 0.05. It should be clarified here that the geometric and strength variables included in the tests showed some scatter, which was included in the model uncertainty. If the model uncertainty is combined with such variables, the overall scatter can be overestimated. Therefore, the coefficient of variation of the model uncertainty is recommended to be reduced by 0.05. The entire set of test results cannot be presented in this paper due to space limitations. However, for the purpose of illustration, Figure 3 shows the model uncertainties of the failure mode at maximum punching shear capacity (failure mode (iii)). All the values attained for the model uncertainties are described in Table 2 and summarised in Table 3.
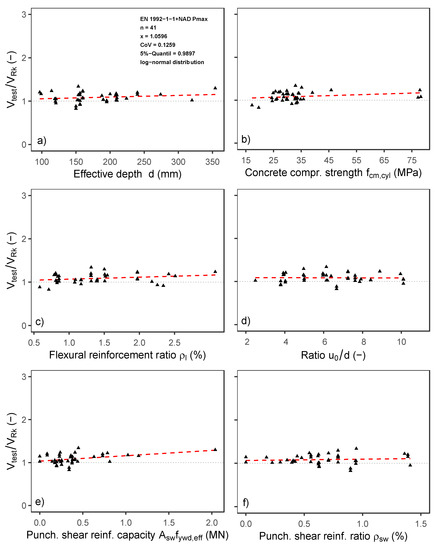
Figure 3.
Model uncertainties at the maximum punching shear capacity (i.e., failure mode (iii) described in Section 1) according to DIN EN 1992-1-1+NA(D) [4,5,6,7] with
as a function of the (a) effective depth d (mm), (b) concrete compressive strength (cylinder) (MPa), (c) flexural reinforcement ratio (%), (d) ratio (–), (e) punching shear reinforcement capacity (MN) and (f) punching shear reinforcement ratio (%).
4.3. Computational Considerations
4.3.1. Design of the Structural System
For the design of the structural system, the parameters described in Table 4 were considered. Note that for the sake of this investigation, the load side was neglected. It should be noted here that to decouple the resistance and load sides, a constant sensitive value equal to 0.80 was applied based on the provisions of DIN EN 1990 [22]. The resulting reliability indices were, therefore, divided by 0.8, which enabled comparisons with the target value of 3.8 recommended in DIN EN 1990 [22].
Table 4.
Assumptions for the design of the structural system.
4.3.2. Reliability-Based Methods (Levels II and III Methods)
For the system reliability analyses, the so-called level II and level III methods were used. For the level II methods, the simple bounds approach of Cornell [8] was adopted (see Section 3). This approach is supported by a first-order reliability algorithm, which uses a first-order Taylor series approximation of a limit state function at the so-called design point and uses second-moment statistics (i.e., means and variances) of the respective basic variables. In this case, the Rackwitz–Fiessler [49] procedure was adopted. Although it is one of the pioneering procedures of first-order second-moment methods, the Rackwitz–Fiessler approach is still accepted as an efficient, simple and easy way to solve the uncorrelated non-normal reliability problems by transforming original non-normal variables into equivalent normal variables based on the equivalent normal conditions [50].
For the level III methods, direct (or crude) Monte Carlo simulations (MCC) and Monte Carlo simulations with variance reduction were considered. Here, the variance reduction methods refer to Monte Carlo simulation with importance sampling (MC-IS) (e.g., [18,51,52,53]) and Monte Carlo simulation with subset sampling (MC-SuS) (e.g., [53,54]). It is relevant to highlight that the MC-IS method follows the approach proposed by Melchers [52,55]. The approach uses a multi-modal sampling function, where each component of the function is selected for the ith limit state function in the same way as for an individual function, with the most interesting regions being those that contribute the greatest probability density for the functions. For the calculation with MC-SuS, the following symbolic equation for a series system reliability problem was defined:
where is the performance function expressed as the minimum of all the significantly dominant failure modes affecting the structural system. The reliability-based calculations were carried out in the abovementioned software package TesiproV [15].
5. Results
5.1. System Reliability Analyses for Fixed Partial Factors
Figure 4, Figure 5, Figure 6 and Figure 7 show the results of the system reliability analyses for varying amounts of punching shear reinforcement. Each system reliability was calculated according to the methods described in Section 4.3.2 for different partial factors for concrete . The grey columns of Figure 4, Figure 5, Figure 6 and Figure 7 respectively refer to the three failure modes discussed in Section 1: (failure mode (i)), (failure mode (ii)) and (failure mode (iii)). The variation of the amount of punching shear reinforcement considered in the analysis range between a minimum of 824 mm2, which was determined according to DIN EN 1992-1-1+NA(D) [4,5,6,7], and 6000 mm2. The target value of 3.8 was taken from DIN EN 1990 [22] and refers to the recommended value for a reliability class 2 (RC2) and a 50-year reference period. This RC2 is associated with the consequence class 2 (CC2), which is mostly related to common structures where the consequences of failure are medium (e.g., residential and office buildings, public buildings).
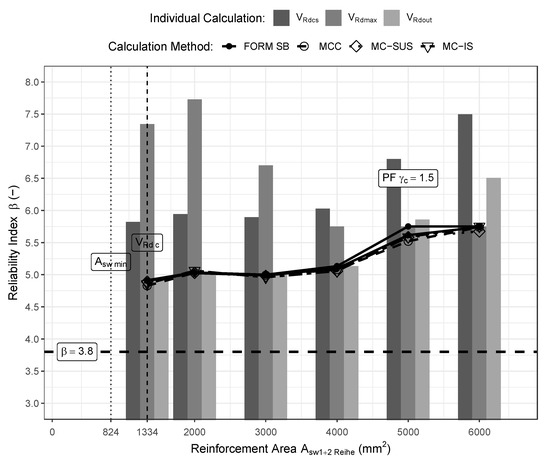
Figure 4.
Systems reliability analysis for a partial factor of 1.5.
Figure 4 shows the results of the system reliability analysis that considered the partial factor equal to 1.5. Here, it can be observed that for all the reinforcement amounts, the calculated values varied between 4.8 and 5.7 (approximately), meaning that the safety level of the system was always above the value of 3.8 recommended in DIN EN 1990 [22]. Figure 4 also shows that the safety levels increase quite sharply for the reinforcement amounts of 5000 mm2 and 6000 mm2. Additionally, the results highlight that the values generated through simple bounds and the simulation methods were quite similar for small amounts of reinforcement. This similarity could be an indication that the first-order methods already produced quite accurate results for the failure modes addressed in this investigation. For higher amounts of reinforcement, the values generated through simple bounds were slightly higher than those produced through simulation methods. It was particularly noticeable that for the punching shear reinforcement with a cross-section of 5000 mm2 in the first two rows, the simple bounds were only marginally wider than the bounds obtained for small amounts of reinforcement. Additionally, it can be observed that for reinforcement amounts lower than 4000 mm2, the failure outside the zone of punching shear reinforcement was governing the system failure. However, for higher amounts of reinforcement (i.e., 5000 mm2 and 6000 mm2), the failure at the maximum punching shear capacity became dominant. The failure mode inside the zone of punching shear reinforcement never became dominant across the range of reinforcement amounts considered.

Figure 5.
Systems reliability analysis for a partial factor of 1.35.
Figure 5.
Systems reliability analysis for a partial factor of 1.35.

By reducing the partial factor to 1.35 (Figure 5), it was noticeable that the overall system safety level decreased despite still being above the 3.8 threshold. Figure 5 shows that the lowest reliability index ( = 4.3) was attained for a rather low amount of reinforcement (i.e., 1334 mm2). It is also visible that for reinforcement amounts higher than 2000 mm2, the variations in the values were relatively small. For reinforcement cross-sections of 4000 mm2 and 5000 mm2, the variations remained marginal and the maximum value ( = 4.7) was found for the highest amounts of reinforcement considered (i.e., 5000 mm2 and 6000 mm2). In fact, Figure 5 shows that the different reliability-based methods generated very similar results for the entire spectrum of reinforcement cross-sections. As seen in the results illustrated in Figure 4 (for a partial factor of 1.5), the failure outside the zone of punching shear reinforcement was governing the system failure for reinforcement amounts lower than 4000 mm2. For higher amounts of reinforcement (i.e., 5000 mm2 and 6000 mm2), the failure at the maximum punching shear capacity became dominant. Similar to the previous analysis, the failure mode inside the zone of punching shear reinforcement never became dominant. Note that here, only the MC-SuS was used for reasons of computational efficiency.

Figure 6.
Systems reliability analysis for a partial factor of 1.3.
Figure 6.
Systems reliability analysis for a partial factor of 1.3.

Figure 6 shows that a further reduction of the partial factor to 1.3 also led to an overall reduction of the system safety levels for all the reinforcement cross-sections considered. To some extent, it can be argued that this reduction was marginal since the maximum values decreased to values around 4.3–4.5. However, an exception was visible for the safety level corresponding to the reinforcement amount of 1334 mm2, where the value was only marginally above the 3.8 threshold. These results seemed to indicate that a reduction of partial factors was not proportional (i.e., linear) to a reduction in the safety level across all the reinforcement amounts. As with the use of higher partial factors, here the failure outside the zone of punching shear reinforcement also governed for reinforcement amounts lower than 4000 mm2. For higher amounts of reinforcement (i.e., 5000 mm2 and 6000 mm2), the failure at the maximum punching shear capacity was again dominant. The failure mode inside the zone of punching shear reinforcement is never dominant.
The results of a further reduction of the partial factor to 1.2 are plotted in Figure 7. This figure shows that the system safety levels are now below the threshold value ( = 3.8) for reinforcement amounts smaller than 2000 mm2 and for reinforcement amounts of 5000 mm2 and 6000 mm2. By comparing the . values produced by the different reliability-based methods, it was visible that for the reinforcement amount of 4000 mm2, the simple bounds seemed to be slightly larger than for the remaining reinforcement amounts. Note that it is normally accepted that when one failure mode is not dominant in relation to the other failure modes, the simple bounds are generally too wide, which could be less interesting for practical use (e.g., [56]). Nonetheless, since these bounds were only marginally wider and the results of the lower bounds were practically the same as the values generated using the simulation methods, the variation in the safety level for the reinforcement amount of 4000 mm2 in the first two rows was further analysed in detail. It should also be noted that here, the above-described trends for the governing failure modes are maintained: The failure mode inside the zone of punching shear reinforcement never became dominant. For reinforcement amounts lower than 4000 mm2, the failure outside the zone of punching shear reinforcement governed the system failure, while for higher amounts of reinforcement (i.e., 5000 mm2 and 6000 mm2), the failure at the maximum punching shear capacity is governing instead.

Figure 7.
Systems reliability analysis for a partial factor of 1.2.
Figure 7.
Systems reliability analysis for a partial factor of 1.2.

5.2. System Reliability Analyses for Variable Partial Factors (Sensitivity Analysis)
Focusing on the system reliability for a reinforcement area of 4000 mm2, Figure 8 shows the impact of varying the partial factors on the system safety level. Here it was visible that to ensure a safety level above the 3.8 threshold, the simple bounds (Figure 8, grey area) gave a relatively wide spectrum of possible “minimum” partial factors, which ranged between 1.10 and 1.17 (approximately). Furthermore, for a value of 3.8, the value obtained with the MC-SuS method seemed to be close to the lower bound of the simple bounds approach with a partial factor close to 1.17. The relatively wide spectrum of the simple bounds did not enable drawing a precise conclusion about the accuracy of these “minimum” partial factors. However, it should be highlighted that the interpretation of this value is solely based on a “medium” reinforcement amount (i.e., 4000 mm2). Nonetheless, addressing other reinforcement amounts and investigating additional variations is not only relatively easy with the use of advanced computation tools but also vital to avoid unsafe decisions regarding the selection of a partial factor. Furthermore, the results of this analysis also suggested that with slightly additional computational power, the use of a variance reduction technique (i.e., level III method) might lead to even more precise results.
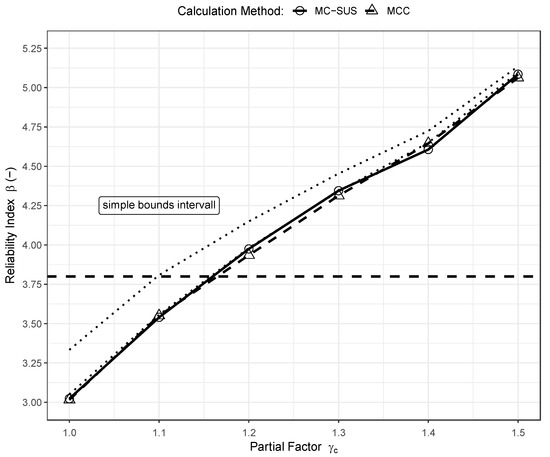
Figure 8.
Sensitivity analysis: variation in the safety level in relation to the partial factor (reinforcement area of 4000 mm2).
6. Discussion
The above-described results for the system safety level (Figure 4, Figure 5, Figure 6 and Figure 7) showed that its reliability indices varied according to the limit state functions. The results indicated that to ensure satisfactory system reliability (i.e., above a pre-defined threshold or code recommendation), no simple linear dependencies can be derived, which increases the complexity associated to the derivation of partial factors. It is important to stress here that the scatter of the basic variables affecting the design equations of the system failure modes also plays a relevant role on the resulting system safety level, and ultimately, on the resulting partial factors. Likewise, the chosen reliability-based method used to calculate the system failure probabilities also had a significant influence on the derived partial factors. Nonetheless, this investigation also showed that the use of the simple bounds in combination with a first-order reliability method could give a reasonable first indication of a possible system safety level. However, the results should be carefully interpreted to avoid deriving unsafe partial factors. If sufficient computing power is available—which should be relatively possible with modern computational tools and software packages, such as the TesiproV—simulation methods should be used to calculate a more precise operational failure probability and the corresponding reliability index for the structural system.
A possible alternative is to use the simple bounds approach in combination with the values of a second-order reliability method (SORM). In theory, this could generate more accurate results compared with those produced by a first-order method that requires only marginal additional computational power; this is particularly valid for strongly non-linear functions. If the simple bounds limit the results of a system failure probability and simulation methods are too computationally costly, second-order bounds, such as the Ditlevsen bounds [57], can also be considered, as these tend to be slightly more accurate than first-order approximation methods. With the approximation method developed by Ditlevsen [57], tighter bounds for the system failure probabilities can in theory be calculated by determining a correlation (i.e., a value between 0 and 1) between the safety levels of the individual failure modes. This is especially valid when it is not clear which failure mode is dominant due to similar failure probabilities when multiple failure modes occur. Overall, the results of this investigation confirm the premise that a more precise analysis of the system reliability can reduce the partial factors for concrete in the case of punching shear with shear reinforcement. As a result, potential benefits, such as material and cost savings can be achieved without falling below a socially accepted safety level (e.g., the value of 3.8 recommended in DIN EN 1990 [22]).
7. Conclusions
Based on the results of this investigation, the following conclusions can be drawn:
- The concepts related to systems reliability can be applied to derive partial factors for design equations. The above-described results indicated that the partial factors can vary considerably depending on the governing limit state function and the scatter of the basic variables. This confirmed the importance of a thorough definition of stochastic models for the basic variables and the importance of a careful selection of the reliability-based method (i.e., level II or level III method).
- In this investigation, it was seen that the use of the simple bounds in combination with a first-order reliability method (i.e., level II methods) can give a decent preliminary indication of the system safety level. Yet, the results should be carefully interpreted to avoid deriving unsafe partial factors. If sufficient computing power is available, simulation methods (i.e., level III methods) should be used since they enable the calculation of more precise system failure probabilities.
- The results of the sensitivity analysis confirmed the premise that a thorough analysis of the reliability may support the reduction of partial factors . This could be a possible approach for practitioners to save material and costs and reduce CO2 emissions during the structural design process without compromising socially accepted safety levels (e.g., the value of 3.8 recommended in DIN EN 1990 [22]).
The investigated approach seems to have potential for further applications and developments. For example, instead of changing a partial factor, other parameters of the design equations could instead vary, such as the pre-empirical factor . This would enable the reduction in while maintaining the code-recommended value for a partial factor. Further investigations could include the evaluation of the impact of different basic variables on the derivation of partial factors. Another possibility is to consider correlated variables in the analysis. A more precise analysis that involves using second-order bounds (e.g., Ditlevsen bounds) should be also conducted. Finally, distinct failure mechanisms could be considered to evaluate the transferability of the proposed concept, not only regarding other structural components but also concerning a broader scope of Eurocode 2.
Author Contributions
Conceptualisation, T.F. and M.R.; methodology, T.F. and M.R.; software, T.F.; validation, T.F., J.P.S.-A. and M.R.; formal analysis, T.F., J.P.S.-A. and M.R.; investigation, T.F.; resources, T.F. and M.R.; data curation, T.F.; writing—original draft preparation, T.F.; writing—review and editing, T.F., J.P.S.-A. and M.R.; visualisation, T.F.; supervision, M.R.; project administration, M.R. and J.H.; funding acquisition, M.R. and J.H. All authors read and agreed to the published version of the manuscript.
Funding
This research was funded by the German Federal Ministry for Economic Affairs and Climate Action (in German: Bundesministerium für Wirtschaft und Klimaschutz, BMWK), grant number 03TNK003E. The financial support is gratefully acknowledged by the authors.
Institutional Review Board Statement
Not applicable.
Informed Consent Statement
Not applicable.
Data Availability Statement
Not applicable.
Acknowledgments
The authors are very thankful to Konstantin Nille-Hauf, a former member of the Institute of Structural Engineering at the Hochschule Biberach—University of Applied Sciences, for the support provided during the set-up of the design models and the computations presented in this manuscript.
Conflicts of Interest
The authors declare no conflict of interest. The funders had no role in the design of the study; in the collection, analyses, or interpretation of data; in the writing of the manuscript; or in the decision to publish the results.
References
- Trautwein, L.M.; Bittencourt, T.N.; Gomes, R.B.; Della Bella, J.C. Punching Strength of Flat Slabs with Unbraced Shear Reinforcement. ACI Struct. J. 2011, 108, 197–205. [Google Scholar]
- Siburg, C.; Häusler, F.; Hegger, J. Flat slab punching design according to German annex of Eurocode 2. Bauingenieur 2012, 87, 216–225. (In German) [Google Scholar]
- Hegger, J.; Haüsler, F.; Ricker, M. Maximum Punching Capacity of Flat Slabs. Beton-Und Stahlbetonbau 2007, 102, 770–777. [Google Scholar] [CrossRef]
- DIN EN 1992-1-1:2011 + AC:2010; Eurocode 2: Bemessung und Konstruktion von Stahlbeton-und Spannbetontragwerken—Teil 1-1: Allgemeine Bemessungsregeln und Regeln für den Hochbau. Deutsche Fassung EN 1992-1-1:2004 + AC:2010. NABau: Berlin, Germany, 2011.
- DIN EN 1992-1-1:2015; Eurocode 2: Bemessung und Konstruktion von Stahlbeton- und Spannbetontragwerken—Teil 1-1: Allgemeine Bemessungsregeln und Regeln für den Hochbau, Ergänzung A1. Deutsche Fassung EN 1992-1-1:2004/A1:2014. NABau: Berlin, Germany, 2015.
- DIN EN1992-1-1+NA:2013; Nationaler Anhang—National festgelegte Parameter—Eurocode 2: Bemessung und Konstruktion von Stahlbeton-und Spannbetontragwerken—Teil 1-1: Allgemeine Bemessungsregeln und Regeln für den Hochbau. NABau: Berlin, Germany, 2013.
- DIN EN1992-1-1+NA/A1:2013; Nationaler Anhang—National festgelegte Parameter—Eurocode 2: Bemessung und Konstruktion von Stahlbeton-und Spannbetontragwerken—Teil 1-1: Allgemeine Bemesungsregeln und Regeln für den Hochbau. Änderung A1. NABau: Berlin, Germany, 2015.
- Cornell, C.A. Bounds on the reliability of structural systems. J. Struct. Div. 1967, 93, 171–200. [Google Scholar] [CrossRef]
- Ang, A.; Tang, W. Probability Concepts in Engineering Planning and Design; John Wily and Sons: Hoboken, NJ, USA, 1975. [Google Scholar]
- Fießler, B.; Krzykacz, B.; Neumann, H.-J.; Rackwitz, R. Non-Normal Vectors, Quadratic Limit State Criteria, Systems and Extreme Loads in First Order Reliability Theory, Heft 29/1978; Laboratorium für den konstruktiven Ingenieurbau (IKI), Technische Universität München: München, Germany, 1978. [Google Scholar]
- Thoft-Cristensen, P.; Baker, M.J. Structural Reliability Theory and Its Applications; Springer: Berlin/Heidelberg, Germany, 1982. [Google Scholar]
- Ditlevsen, O.; Bjerager, P. Methods of structural systems reliability. Struct. Safety 1986, 3, 195–229. [Google Scholar] [CrossRef]
- Nowak, A.S.; Collins, K.R. Reliability of Structures; CRC Press: Boca Raton, FL, USA, 2012. [Google Scholar]
- R Core Team. R: A Language and Environment for Statistical Computing; R Foundation for Statistical Computing: Vienna, Austria, 2013. [Google Scholar]
- Nille-Hauf, K.; Feiri, T.; Ricker, M.; Tesiprov: Calculation of Reliability and Failure Probability in Civil Engineering. R package version 0.9.1. 2022. Available online: https://CRAN.R-project.org/package=TesiproV (accessed on 30 November 2022).
- Schulze-Ardey, J.; Feiri, T.; Ricker, M.; Hegger, J. Implementation of reliability methods in a new developed open-source software package. In Proceedings of the 18th International Probabilistic Workshop, IPW 2021, Las Vegas, NV, USA, 26 October 2021; Springer: Berlin/Heidelberg, Germany, 2021; Volume 153, pp. 405–415. [Google Scholar]
- Schulze-Ardey, J.; Stark, A.; Feiri, T.; Ricker, M.; Hegger, J. Comparison of reliability-based evaluations on selected RC structural members using FORM, SORM and Monte Carlo simulations. In Proceedings of the fib Symposium. Concrete Structures: New Trends for Eco-Efficiency and Performance, Fédération Internationale du Béton (fib)—International Federation for Structural Concrete, online, 14–16 June 2021; Volume 153, pp. 2284–2293. [Google Scholar]
- Ricker, M.; Feiri, T.; Nille-Hauf, K.; Adam, V.; Hegger, J. Enhanced reliability assessment of punching shear resistance models for flat slabs without shear reinforcement. Eng. Struct. 2021, 226, 111319. [Google Scholar] [CrossRef]
- Muttoni, A.; Fernández Ruiz, M. MC2010: The Critical Shear Crack Theory as a mechanical model for punching shear design and its application to code provisions. fib Bulletin 2010, 57, 31–60. [Google Scholar]
- Ricker, M.; Siburg, C. Punching shear strength of flat slabs–critical review of Eurocode 2 and fib Model Code 2010 design provisions. Struct. Concr. 2016, 17, 457–468. [Google Scholar] [CrossRef]
- CEB-FIP Model Code 1990: Design Code. Committee Euro-International du Beton; Thomas Telford: London, UK, 1993. [Google Scholar]
- 1990:2002 + A1:2005 + A1:2005/AC:2010; DIN EN 1990:2002 + A1:2005 + A1:2005/AC:2010 December 2010: Eurocode: Basis of structural design; CEN European Committee for Standardization: Bruxelles, Belgium, 2010.
- DIN 1055-100 March 2001; Actions on Structures—Part 100: Basis of Design, Safety Concept and Design Rules. Beuth: Berlin, Germany, 2001.
- Ricker, M.; Häusler, F.; Hegger, J. Punching of edge column–slab connections–comparison of tests and codes. Proc. Inst. Civ. Eng.-Struct. Build. 2022, 175, 202–214. [Google Scholar] [CrossRef]
- Häusler, F.; Ricker, M.; Siburg, C. Influence of prestressing on the punching behaviour of flat slabs. Bauingenieur 2014, 89, 261–271. [Google Scholar]
- Hegger, J.; Walraven, J.C.; Häusler, F. Punching of Flat Slabs according to Eurocode 2. Beton-Und Stahlbetonbau 2010, 105, 206–215. [Google Scholar] [CrossRef]
- Hegger, J.; Häusler, F.; Ricker, M. Critical Review of the Punching Shear Provisions According to Eurocode 2. Beton-Und Stahlbetonbau 2008, 103, 93–102. [Google Scholar] [CrossRef]
- Siburg, C.; Hegger, J.; Furche, J.; Bauermeister, U. Punching shear reinforcement for semi-precast slabs according to Eurocode 2. Beton-Und Stahlbetonbau 2014, 109, 170–181. [Google Scholar] [CrossRef]
- Ricker, M.; Häusler, F. European punching design provisions for double-headed studs. Struct. Build. 2014, 167, 495–506. [Google Scholar] [CrossRef]
- Lindorf, A. Punching shear design of double-headed anchors according to European Technical Approvals. Beton-Und Stahlbetonbau 2013, 108, 691–700. [Google Scholar] [CrossRef]
- DIN-Fachbericht 102; Concrete Bridges. Beuth: Berlin, Germany, March 2009. (In German)
- Beutel, R. Durchstanzen Schubbewehrter Flachdecken im Bereich von Innenstützen. Ph.D. Thesis, Lehrstuhl und Institut für Massivbau (IMB), RWTH Aachen, Aachen, Germany, 2003. [Google Scholar]
- Häusler, F. Zum Maximalen Durchstanzwiderstand von Flachdecken mit und ohne Vorspannung. Ph.D. Thesis, Lehrstuhl und Institut für Massivbau (IMB), RWTH Aachen, Aachen, Germany, 2009. [Google Scholar]
- Ricker, M. Zur Zuverlässigkeit der Bemessung gegen Durchstanzen bei Einzelfundamenten. Ph.D. Thesis, Lehrstuhl und Institut für Massivbau (IMB), RWTH Aachen, Aachen, Germany, 2009. [Google Scholar]
- Siburg, C. Zur einheitlichen Bemessung gegen Durchstanzen in Flachdecken und Fundamenten. Ph.D. Thesis, Lehrstuhl und Institut für Massivbau (IMB), RWTH Aachen, Aachen, Germany, 2014. [Google Scholar]
- Hegger, J.; Adam, V.; Schmidt, M.; Schmidt, P. Fallbeispiele, Parameterstudien und Datenbankauswertungen zu den Vorschlägen der Querkraft-, Torsions- und Durchstanzbemessung für die zweite Generation des Eurocode 2; Institutsbericht 415/2020; Lehrstuhl und Institut für Massivbau (IMB), RWTH Aachen: Aachen, Germany, 2020. [Google Scholar]
- Schmidt, P. Punching in Shear-Reinforced Flat Slabs and Column Bases. Ph.D. Thesis, Lehrstuhl und Institut für Massivbau (IMB), RWTH Aachen, Aachen, Germany, 2020. [Google Scholar]
- Joint Committee on Structural Safety, JCSS Probabilistic Model Code. Available online: https://www.jcss-lc.org/ (accessed on 30 November 2022).
- Rackwitz, R. Predictive distribution of strength under control. Matériaux Et Constr. 1983, 16, 259–267. [Google Scholar] [CrossRef]
- Holický, M.; Sýkora, M.; Barnardo-Viljoen, C.; Mensah, K.K.; Retief, J.V. Model uncertainties in reliability analysis of reinforced concrete structures. In Research and Applications in Structural Engineering, Mechanics and Computation 2013; CRC Press: Boca Raton, FL, USA, 2013; pp. 773–774. [Google Scholar]
- Holický, M.; Retief, J.V.; Sýkora, M. Assessment of model uncertainties for structural resistance. Probabilistic Eng. Mech. 2016, 45, 188–197. [Google Scholar] [CrossRef]
- Benjamin, J.R.; Cornell, C.A. Probability, Statistics, and Decision for Civil Engineers; Dover Books on Engineering, Dover Publications: Newburyport, MA, USA, 1970. [Google Scholar]
- Plate, E.J. Statistik und Angewandte Wahrscheinlichkeitslehre für Bauingenieure; Ernst & Sohn: Berlin, Germany, 1993. [Google Scholar]
- Fischer, L. Sicherheitskonzept für neue Normen—ENV und DIN-neu. Grundlagen und Hintergrundinformationen Teil 3: Statistische Auswertung von Stichproben im eindimensionalen Fall (1. Forts.). Bautechnik 1999, 76, 236–253. [Google Scholar] [CrossRef]
- Faber, M.H. Statistics and probability theory. In Pursuit of Engineering Decision Support. Topics in Safety, Risk, Reliability and Quality; Springer: Dordrecht, The Netherlands, 2012. [Google Scholar]
- David, H.A.; Hartley, H.O.; Pearson, E.S. The distribution of the ratio, in a single, normal sample, of range to standard deviation. Biometrika 1954, 41, 482–493. [Google Scholar] [CrossRef]
- Montgomery, D.C.; Runger, G.C. Applied Statistics and Probability for Engineers; John Wiley & Sons: Hoboken, NJ, USA, 2010. [Google Scholar]
- Taerwe, L. Towards a Consistent Treatment of Model Uncertainties in Reliability Formats for Concrete Structures, CEB Bulletin d’Information No 219. Saf. Perform. Concepts 1993, 219, 5–61. [Google Scholar]
- Rackwitz, R.; Flessler, B. Structural reliability under combined random load sequences. Comput. Struct. 1978, 9, 489–494. [Google Scholar] [CrossRef]
- Zhou, S.; Xiao, Q.; Zhou, J.; Li, H. Improvements of Rackwitz–Fiessler method for correlated structural reliability analysis. Int. J. Comput. Methods 2020, 17, 1950077. [Google Scholar] [CrossRef]
- Ditlevsen, O.; Madsen, H.O. Structural Reliability Methods; Wiley: New York, NY, USA, 1996; Volume 178. [Google Scholar]
- Melchers, R.E.; Beck, A.T. Structural Reliability: Analysis and Prediction; John Wiley & Sons: Hoboken, NJ, USA, 2018. [Google Scholar]
- Ricker, M.; Feiri, T.; Nille-Hauf, K. Contribution to efficient structural safety assessments: A comparative analysis of computational schemes. Probabilistic Eng. Mech. 2022, 69, 103285. [Google Scholar] [CrossRef]
- Au, S.K.; Beck, J.L. Estimation of small failure probabilities in high dimensions by subset simulation. Probab. Eng. Mech. 2001, 16, 263–277. [Google Scholar] [CrossRef]
- Melchers, R.E. Importance sampling in structural systems. Struct. Saf. 1989, 6, 3–10. [Google Scholar] [CrossRef]
- Sørensen, J.D. Notes in Structural Reliability Theory and Risk Analysis; Aalborg University: Aalborg, Denmark, 2004. [Google Scholar]
- Ditlevsen, O. Narrow reliability bounds for structural systems. J. Struct. Mech. 1979, 7, 453–472. [Google Scholar] [CrossRef]


Disclaimer/Publisher’s Note: The statements, opinions and data contained in all publications are solely those of the individual author(s) and contributor(s) and not of MDPI and/or the editor(s). MDPI and/or the editor(s) disclaim responsibility for any injury to people or property resulting from any ideas, methods, instructions or products referred to in the content. |
© 2023 by the authors. Licensee MDPI, Basel, Switzerland. This article is an open access article distributed under the terms and conditions of the Creative Commons Attribution (CC BY) license (https://creativecommons.org/licenses/by/4.0/).