Abstract
This study proposes a concrete-filled tube composite strengthening system (CCSS), which is a new concept that can improve and supplement the vulnerability of existing CFT seismic strengthening methods. The CCSS seismic reinforcement method is easy to construct and integrates with the existing frame and reinforcement. It is one of the seismic strengthening methods that allows the simple calculation of the required amount of seismic reinforcement and can efficiently increase the strength when applied to existing reinforced concrete (R/C) buildings with non-seismic details dominated by shear failure. To examine the seismic safety of the proposed CCSS, two framework specimens were prepared based on an existing R/C building with non-seismic details. A pseudo-dynamic test was conducted on the unreinforced framework specimen and the framework specimen reinforced with CCSS to verify the seismic strengthening effect of applying CCSS to the existing R/C framework, i.e., in terms of the load–displacement characteristics and seismic response control capability. Based on the pseudo-dynamic test results, restoration of the force characteristics was proposed for the nonlinear dynamic analysis of the building reinforced with CCSS. Nonlinear dynamic analysis was conducted based on the proposed restoration of the force characteristics, and the results were compared with the pseudo-dynamic test results. Finally, for the commercialization of CCSS, nonlinear dynamic analysis was conducted on the existing whole R/C building with non-seismic details that was reinforced with CCSS. The seismic strengthening effect was then verified by examining the seismic response load, displacement characteristics, and the degree of seismic damage to the members based on the ductility ratio before and after seismic strengthening. The study results show that under a design basis earthquake with a magnitude of 200 cm/s2, the unreinforced R/C building exhibits shear failure, and light seismic damage is expected on the CCSS-reinforced building.
1. Introduction
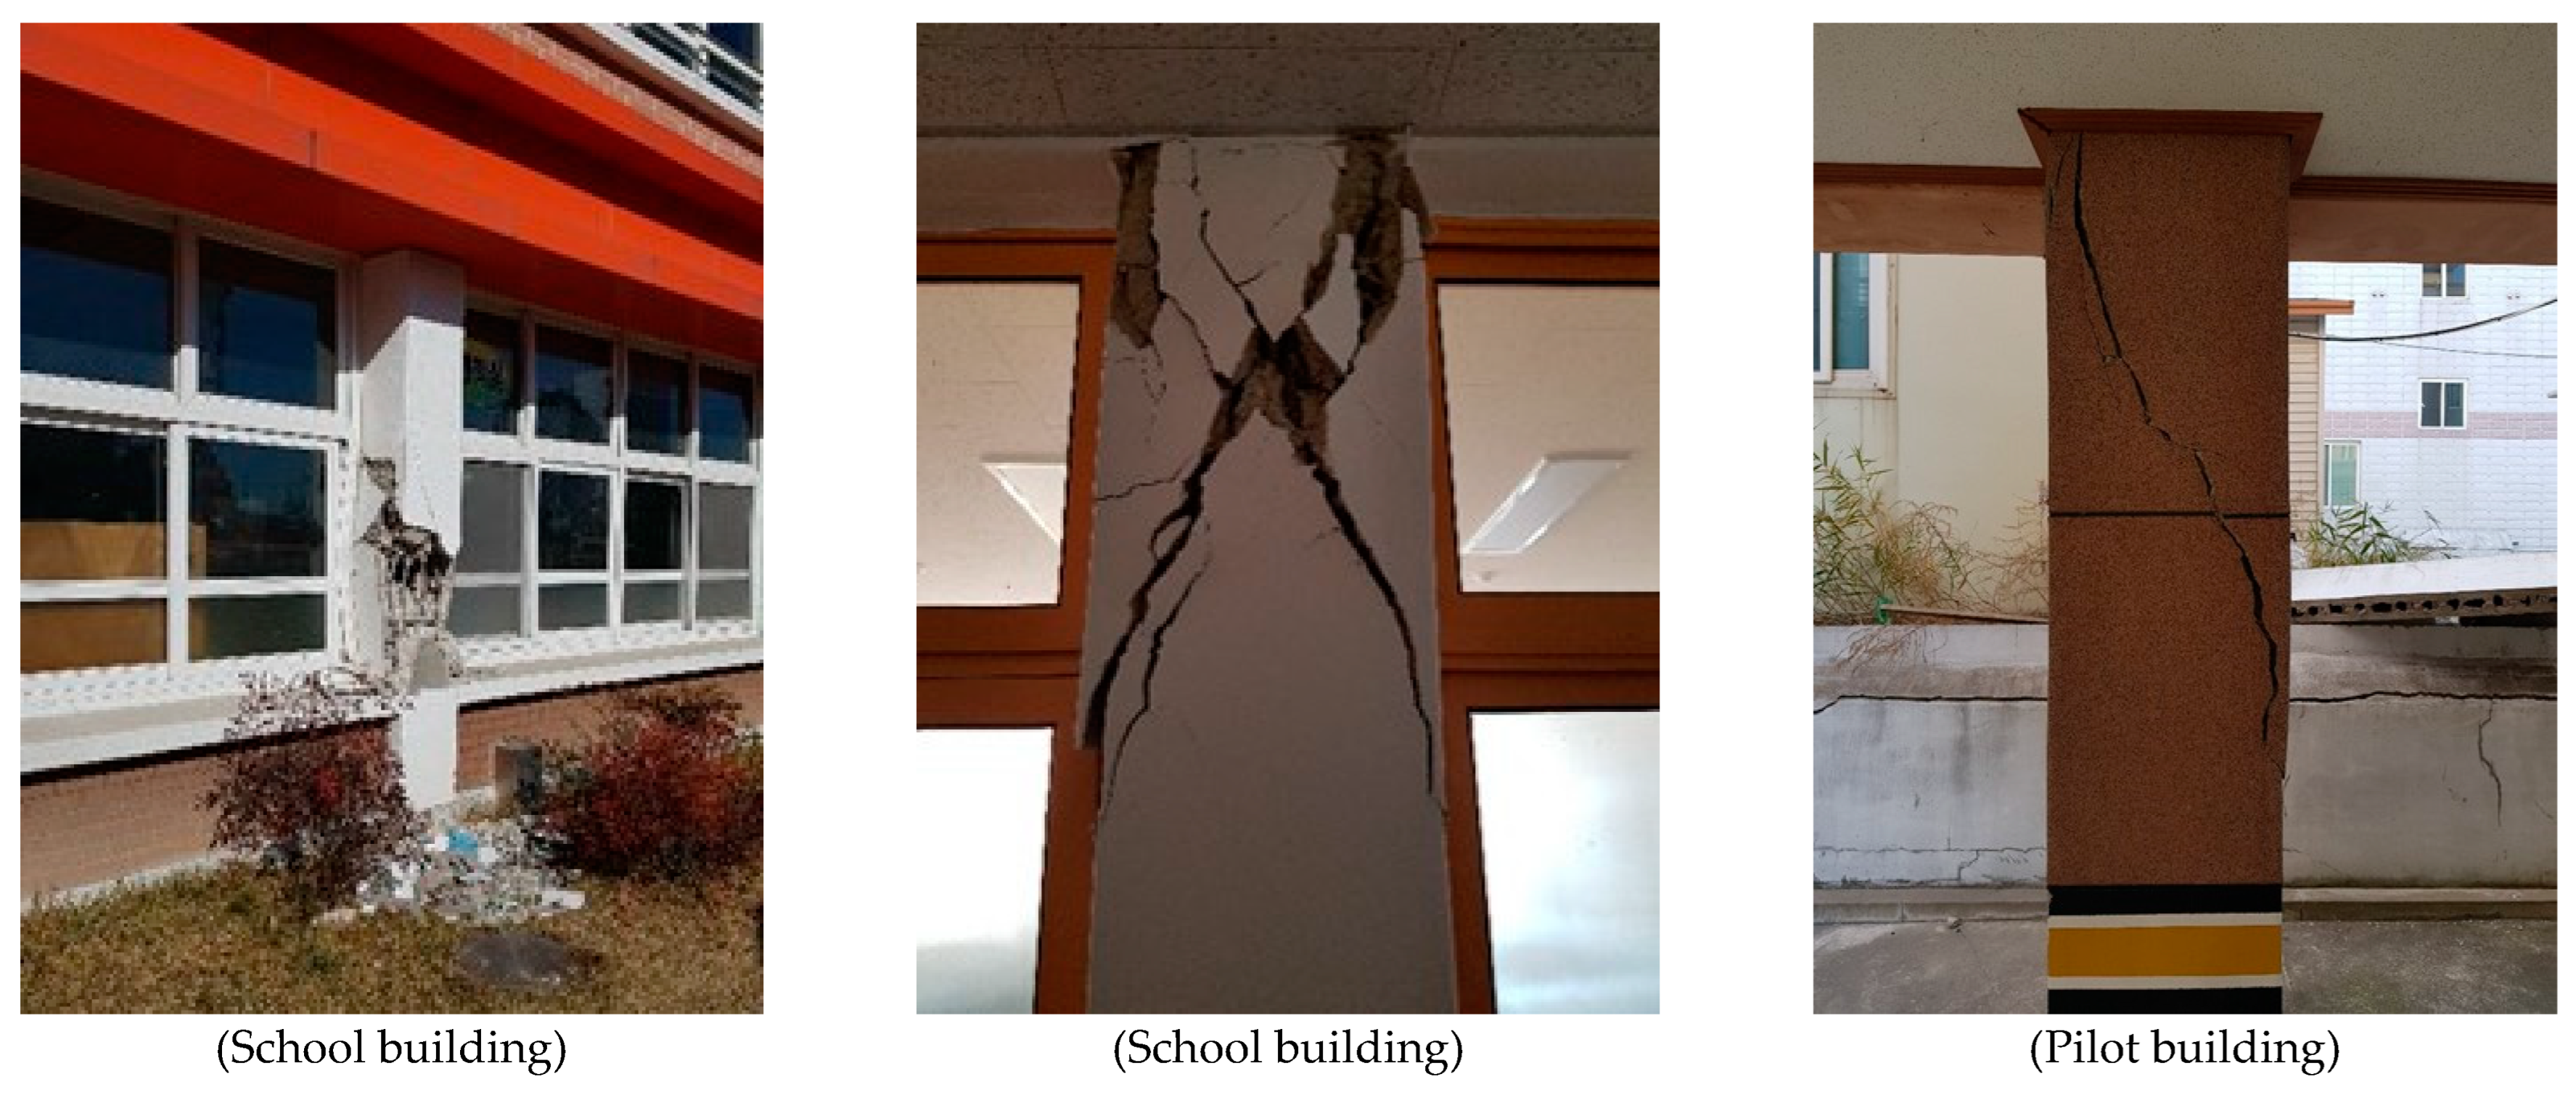
In recent years, large earthquakes, including the 2023 earthquake in Kahramanmaras, Turkey, have been occurring around the world, causing a sharp increase in seismic damage to buildings and human casualties. Seismic damage has also increased in Japan, China, and Taiwan (countries close to the Korean Peninsula) owing to large earthquakes, confirming that Korea can be directly or indirectly affected by earthquakes. The 2016 Gyeongju earthquake and the 2017 Pohang earthquakes showed serious issues in the seismic safety of various facilities in Korea, particularly buildings. They demonstrated that the occurrence of large earthquakes is highly likely and may result in national disasters. During the 2016 Gyeongju earthquake, the scale of the seismic damage to buildings was small except for the seismic damage to non-structural members, including the columns of some buildings (e.g., schools and apartments) located near the epicenter. However, the 2017 Pohang earthquake caused serious seismic damage to school buildings and new pilot structures without seismic reinforcement, as shown in Figure 1 [1]. Among them, the shear failure of reinforced concrete (R/C) columns with insufficient shear reinforcement is currently an important topic for seismic safety design in Korea.
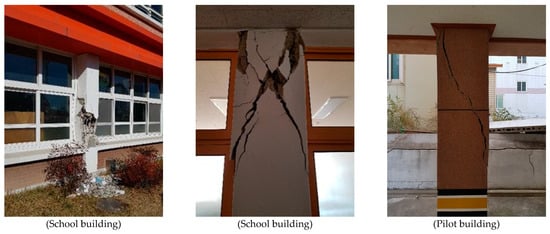
Figure 1.
Shear damage on R/C columns after the 2017 Pohang Earthquake [1].
Therefore, owing to the increasing magnitude and frequency of earthquakes worldwide, it is important to develop economical and effective seismic strengthening methods that can ensure the seismic safety of buildings vulnerable to earthquakes, particularly R/C buildings without seismic design, which are susceptible to shear failure in the columns. This can reduce property damage and human casualties caused by the destruction of buildings during a large earthquake. In addition, seismic strengthening should be performed using efficient and economical methods.
Meanwhile, representative seismic strengthening methods for existing R/C buildings without seismic reinforcement include strength reinforcement methods (the R/C wall installation method, section enlargement method, and steel brace method), deformation capacity improvement methods (the steel-plate reinforcement method, wire-mesh insertion reinforcement method, and fiber-reinforced polymer (FRP) reinforcement method), methods for improving the energy absorption capacity using seismic damping systems, and seismic isolation methods [1,2,3,4,5,6,7,8,9,10].
According to [11,12], shear failure is highly likely to occur in most low- and mid-rise R/C buildings without seismic design because the interval of the stirrups in the columns is approximately 30 cm or more. Moreover, because the horizontal load-carrying capacity is also insufficient, the use of a single seismic strengthening method to enhance the ductility is inefficient. Therefore, the strength enhancement method is more efficient and economical for securing the seismic safety of buildings.
Currently, the major seismic strengthening methods include adding infill shear walls in the framework, installing various types of steel braces (e.g., V-type, K-type, and X-type) inside the framework, inserting steel panels and precast concrete panels in the framework, and employing bonding methods inside the framework (e.g., the section enlargement method). Although internal-bonding seismic strengthening methods are effective for increasing the horizontal strength of buildings [2,3,4], they increase the weight of buildings. In particular, buildings with weak foundations, such as R/C buildings with non-seismic features, may require foundation reinforcement owing to the weight increase. It is also difficult to prepare a workspace for seismic strengthening owing to the limited available space. For the seismic wall installation and steel brace methods, which are widely used methods, additional transport locations and internal work space for the reinforcement are required. In this case, it is disadvantageous because the space available for reinforcement construction is reduced. In addition, the available space is limited and the efficiency is lower because it is difficult to secure space during strengthening work, and the seismic strengthening construction period is highly likely to be elongated for maintaining the integrity of the existing framework and internal joints and for securing the demand for a high construction accuracy [4].
To address these problems, it is necessary to develop construction methods that are suitable for investigating the seismic structural characteristics (e.g., shear failure type and low ultimate strength) of existing low- and mid-rise R/C buildings without seismic reinforcement and that can maintain the integrity of the existing structure and seismic reinforcement. In addition, new internal-bonding seismic strengthening methods that enable efficient space utilization should also be developed.
A concrete-filled tube composite strengthening system (CCSS), which is a new concept that can improve and supplement the vulnerability of existing seismic strengthening methods, is proposed in this study. The CCSS method has excellent joint constructability between the existing framework and reinforcement. It is one of the seismic strengthening methods that can allow the simple calculation of the required seismic reinforcement volume and can efficiently increase the strength when applied to the existing R/C buildings with non-seismic features dominated by shear failure.
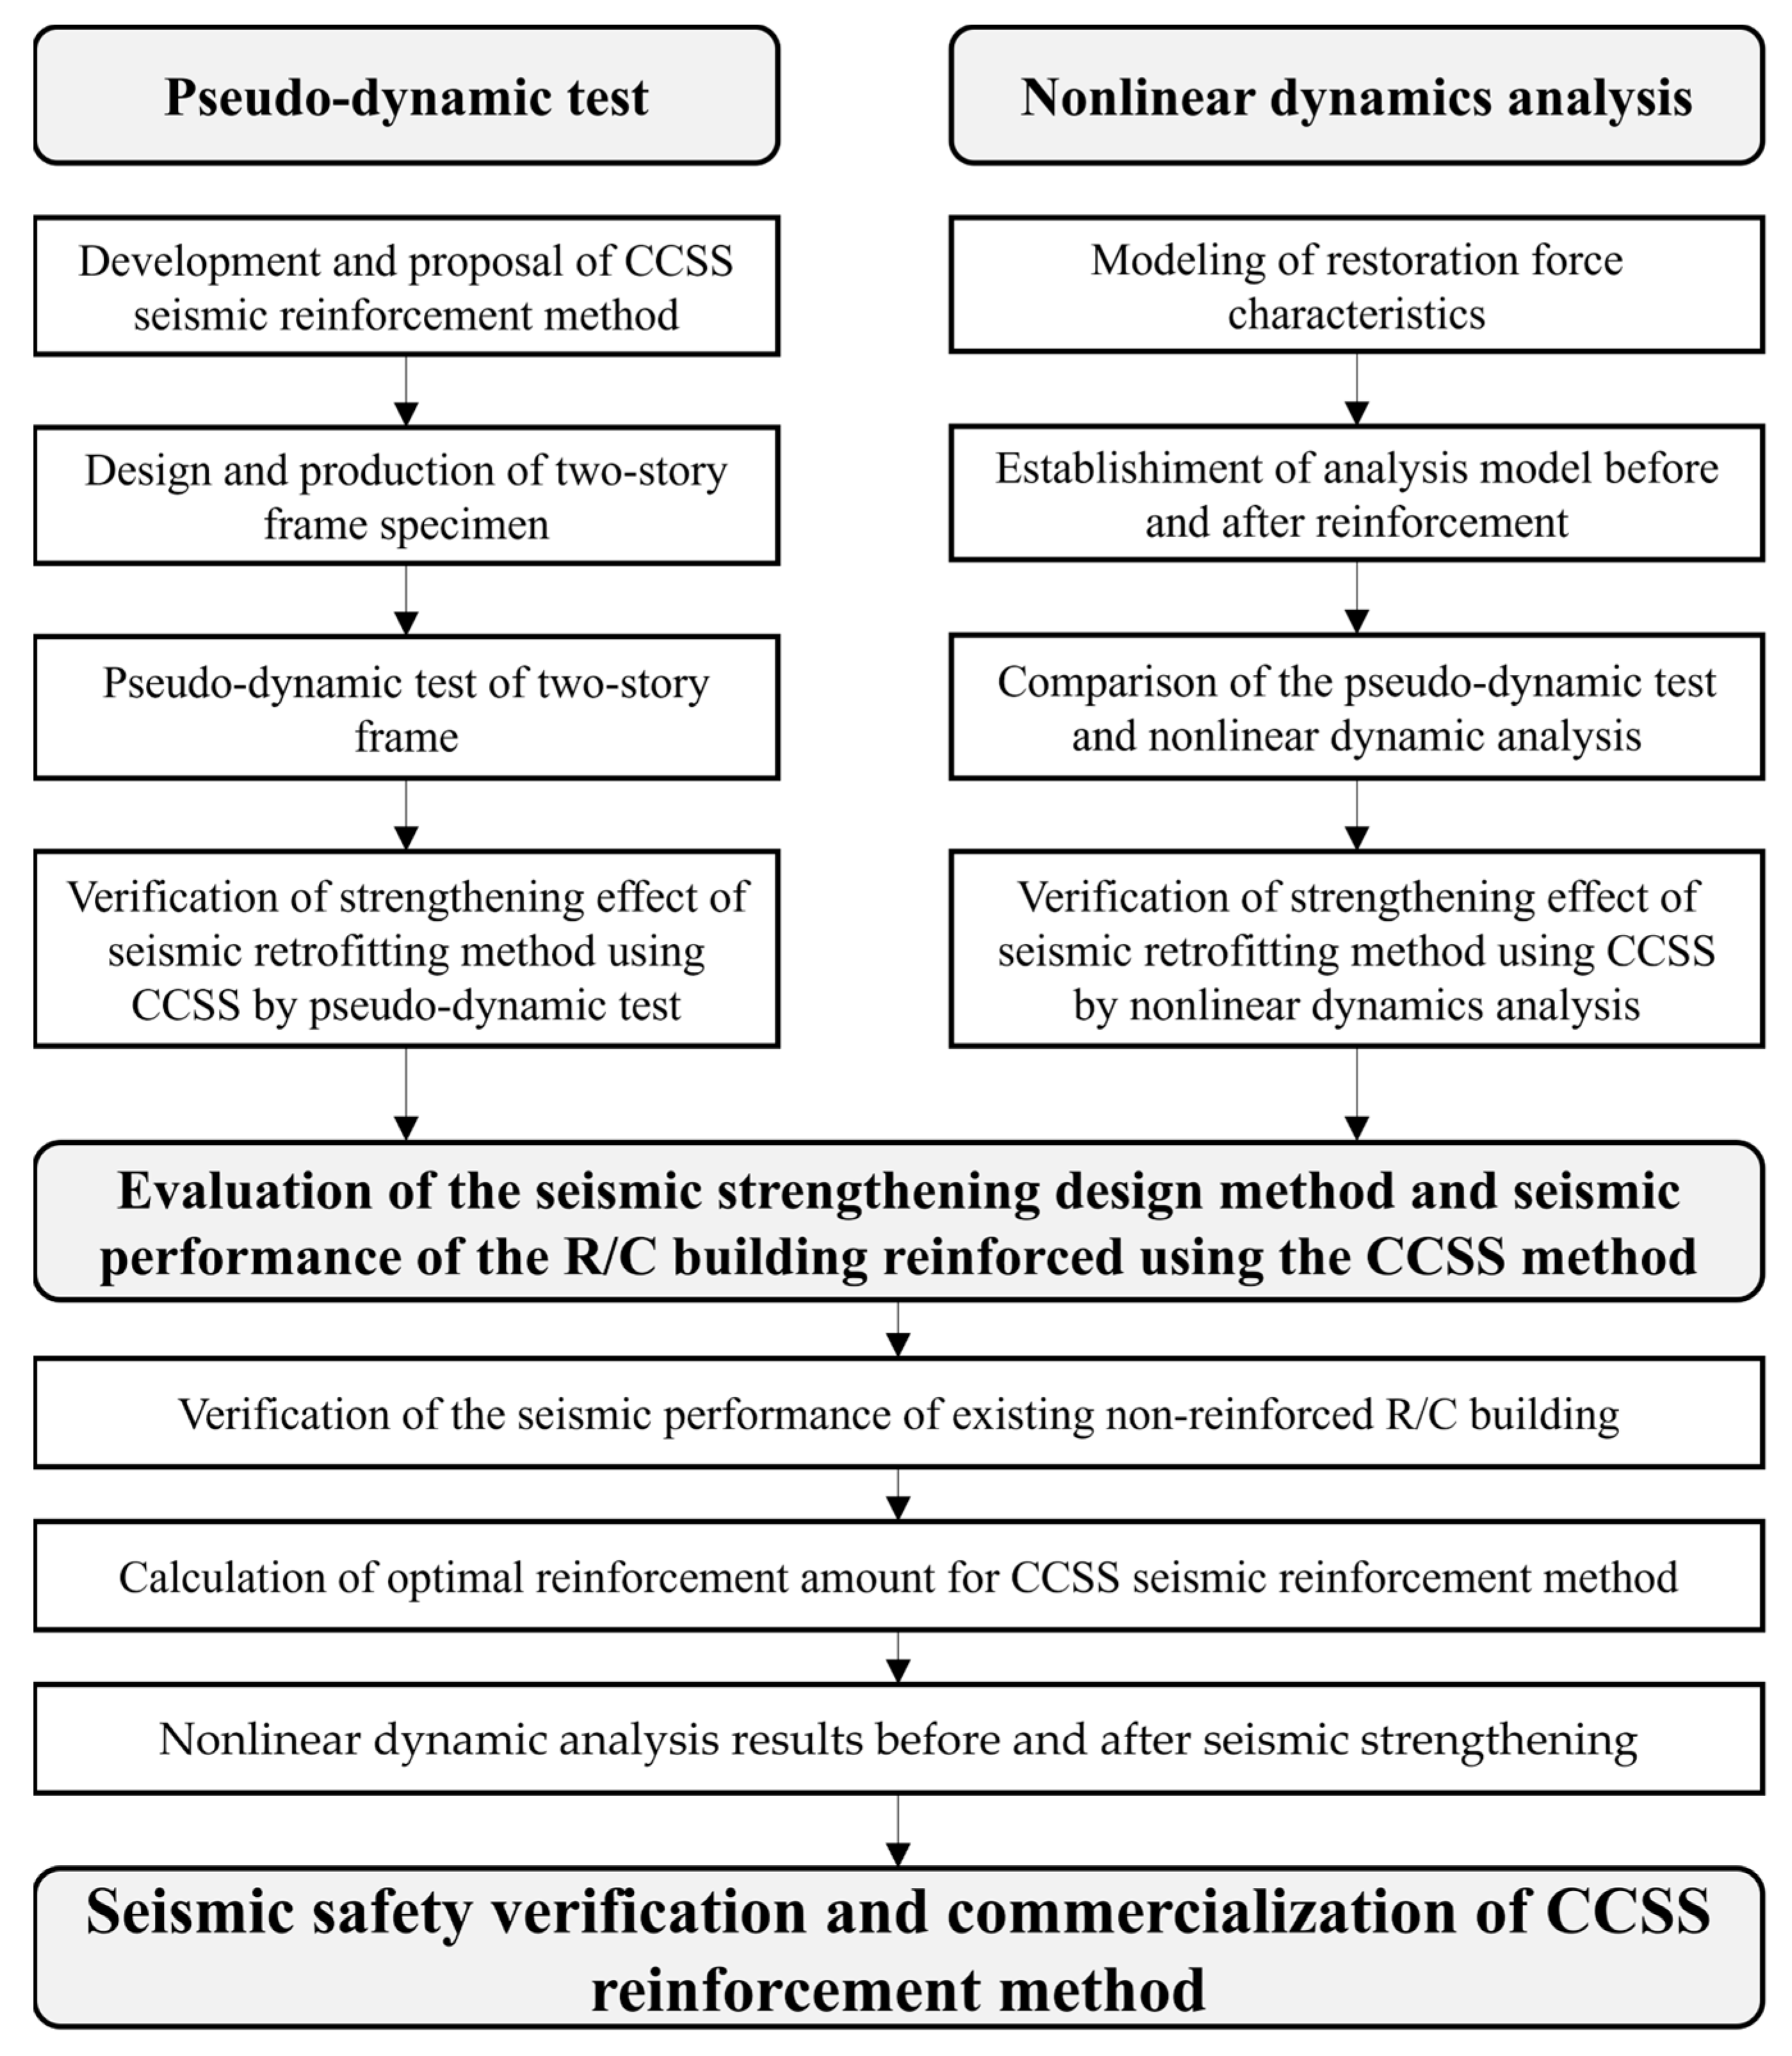
As shown in Figure 2, to examine the seismic safety of the proposed CCSS, two two-story framework specimens were prepared based on an existing R/C building with non-seismic features. A pseudo-dynamic test was then performed on the unreinforced two-story framework specimen and the two-story framework specimen reinforced with CCSS to verify the seismic strengthening effect of applying CCSS to the existing R/C framework, i.e., in terms of load–displacement characteristics and seismic response control capability. The force characteristics were restored based on the pseudo-dynamic test results to allow the nonlinear dynamic analysis of the building reinforced with CCSS (framework specimen) and the restoration force, and the results were compared with the pseudo-dynamic test results. Finally, for the commercialization of CCSS, nonlinear dynamic analysis was conducted on the existing R/C building with non-seismic features reinforced with CCSS. The seismic strengthening effect was then verified by examining the seismic response load, displacement characteristics, and the degree of seismic damage to the members based on the ductility ratio before and after seismic strengthening.
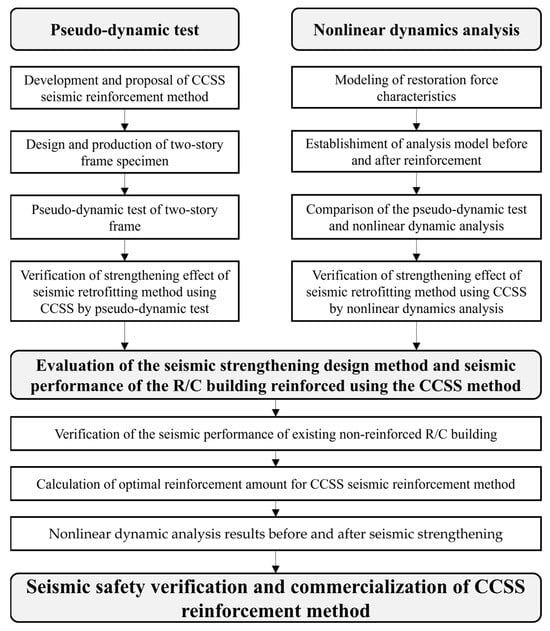
Figure 2.
Flowchart of the research performed in this study.
2. Overview of the CFT Composite Strengthening System
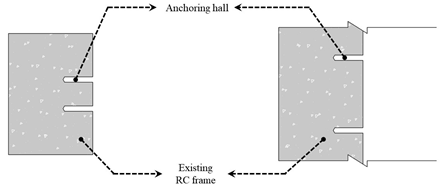
The reinforcing bar/chemical anchor method is widely used for the internal bonding of the existing framework and the seismic strengthening frame. The ductility of concrete at joints is insufficient, and cracking in concrete is inevitable in the event of an earthquake. Since seismic load transmission to seismic strengthening devices is blocked by cracking, it is difficult to expect effective seismic strengthening effects through the integrated behavior of the existing structure and seismic strengthening devices [3,4].
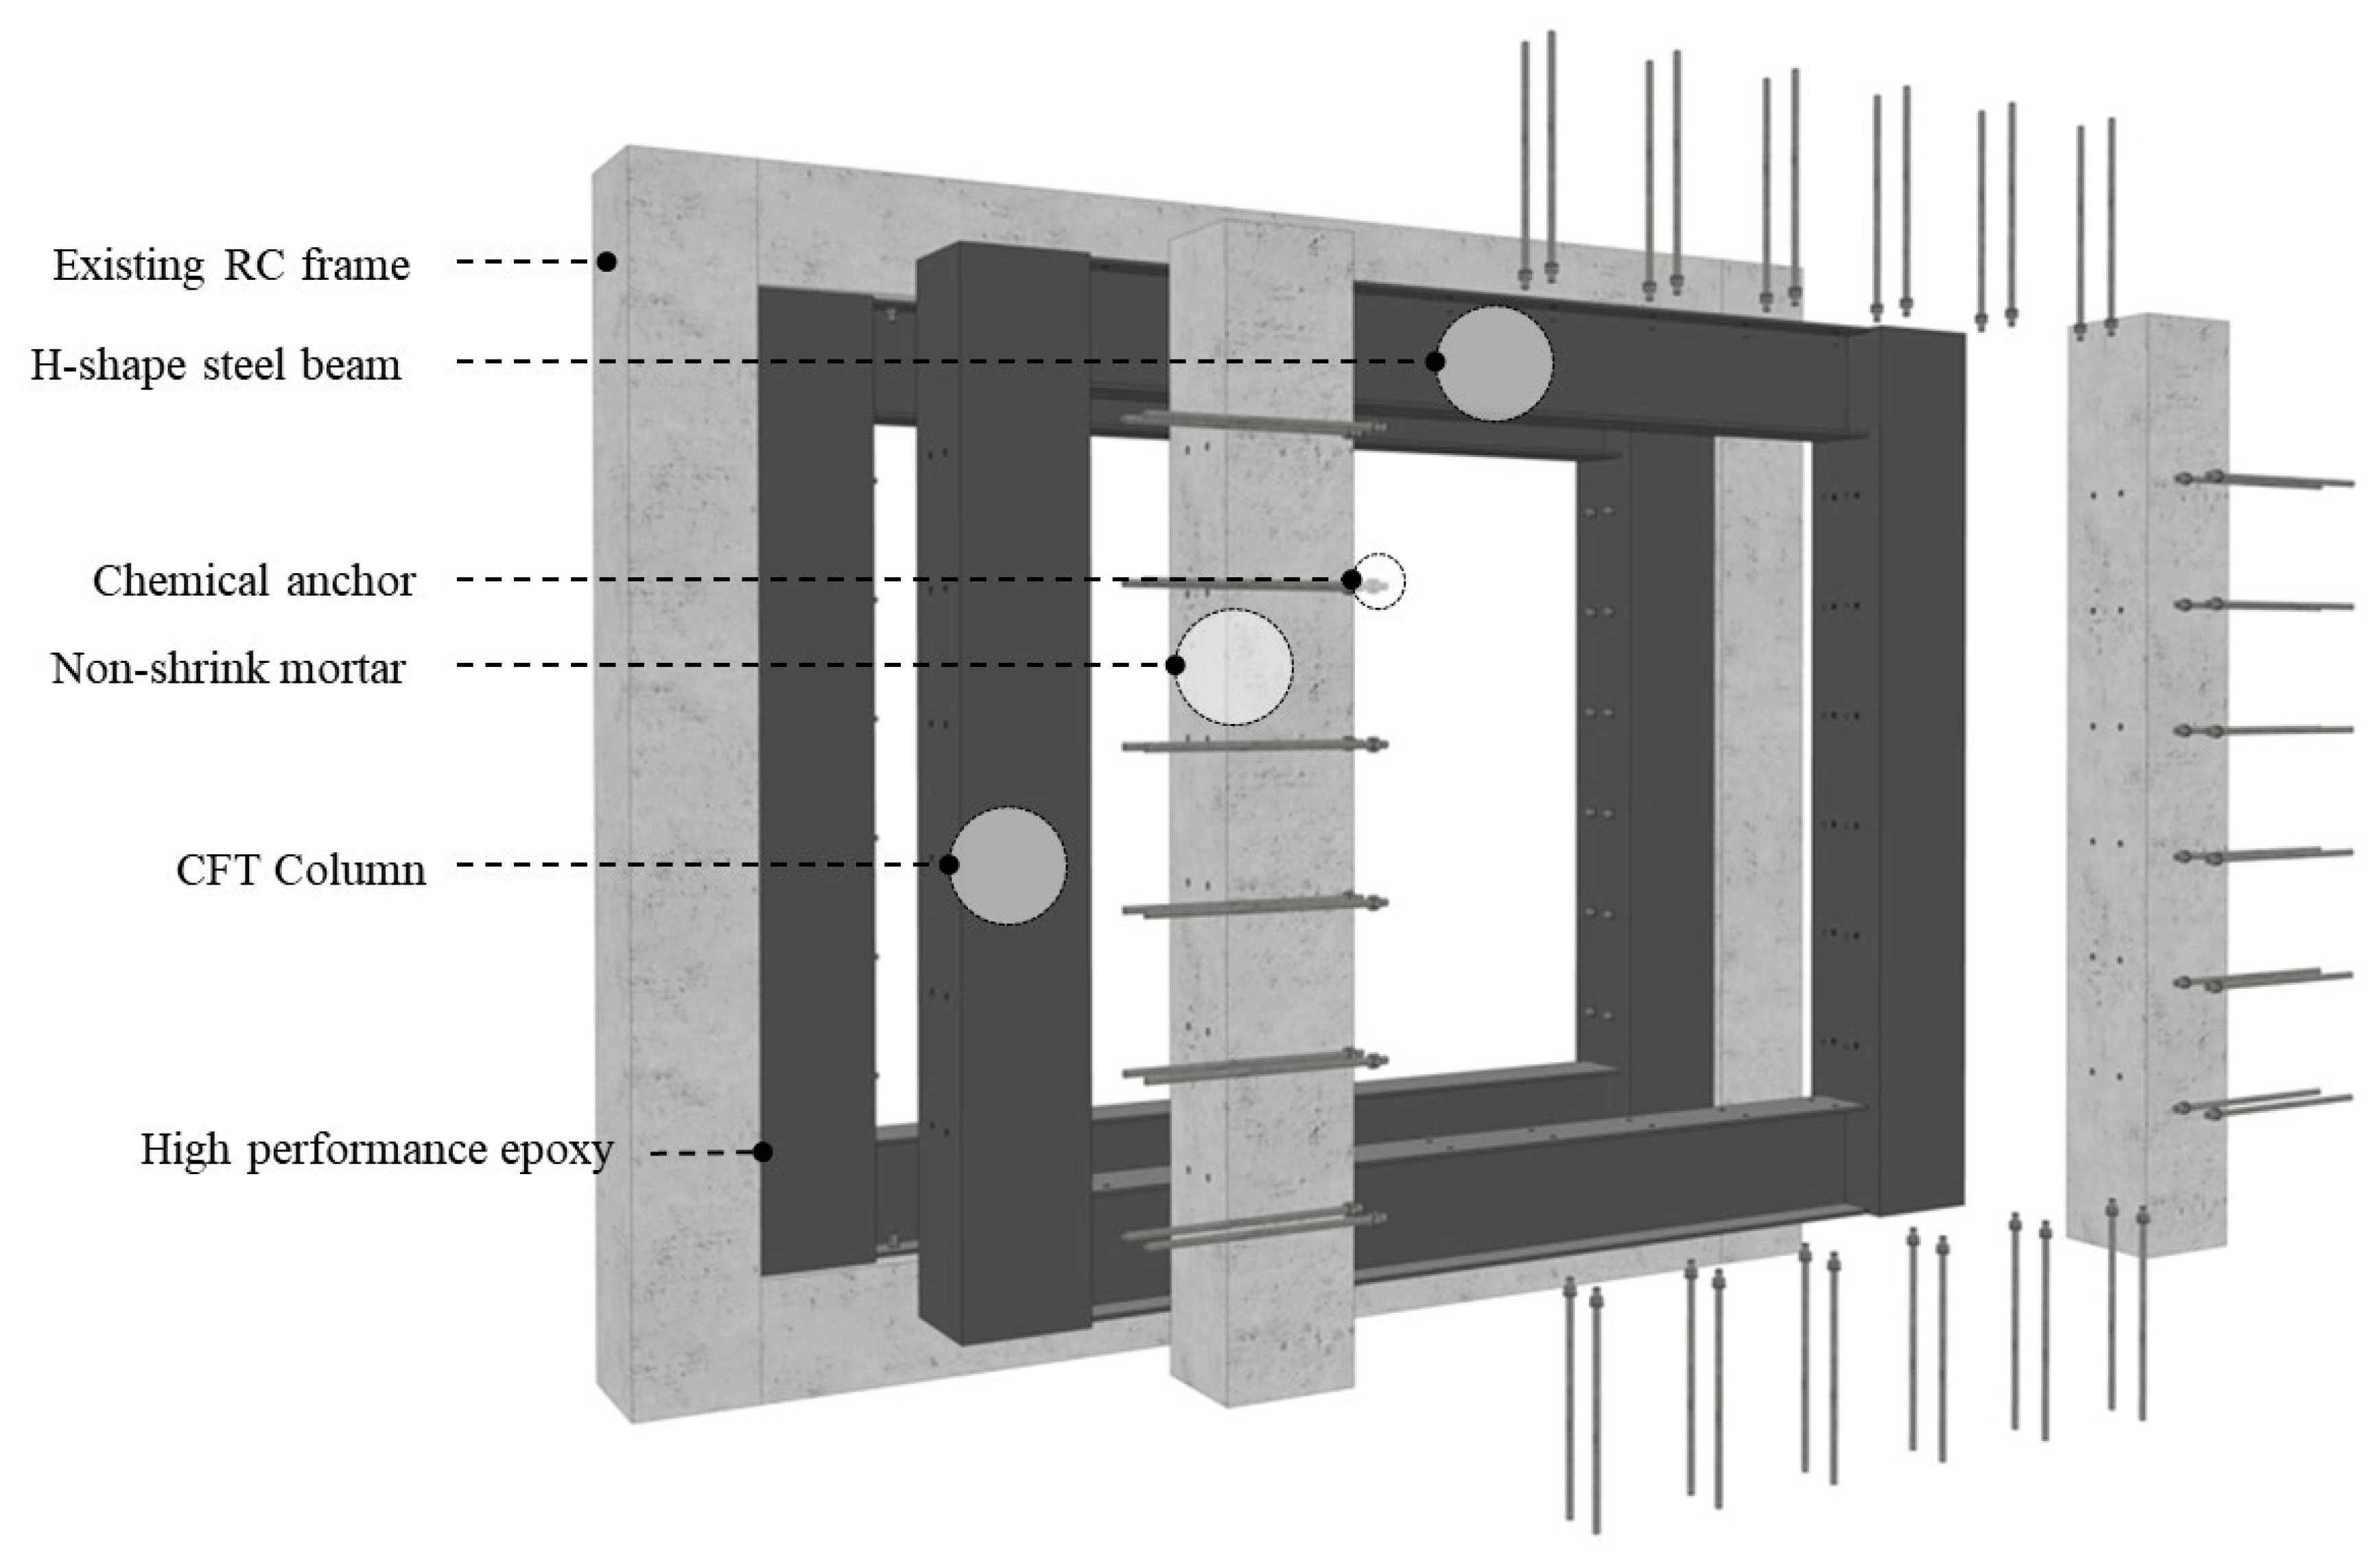
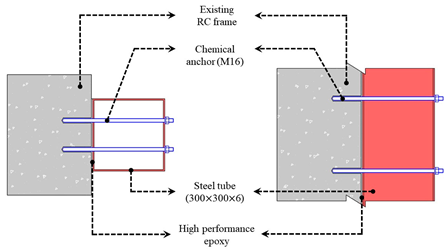
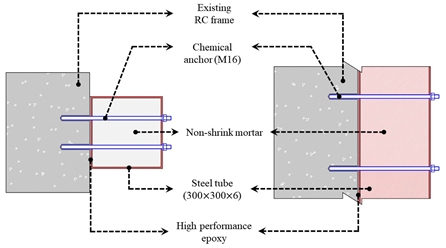
The existing CFT reinforcement method consists of a steel tube by integrating the C-channel into the existing R/C framework through a chemical anchor method and welding another C-channel. In this case, a welding process is added, constructability is reduced, and if the surface of the existing R/C frame is not flat, it is difficult to secure joint integrity between the two C-channels. The proposed CCSS supplements and addresses the shortcomings of the existing chemical anchor method, i.e., the problem of securing joint integrity. It increases strength by directly bonding the reinforcement in the form of a frame to the existing R/C structure, as shown in Figure 3. It innovatively improves the constructability and integrity of the joints between the existing R/C framework and reinforcement. CCSS consists of a reinforcement part, a joint, and a filling part. The reinforcement part is composed of the existing R/C structure and CFT frame, and the joint is composed of chemical anchors and high-performance epoxy. The filling part is composed of non-shrink mortar.
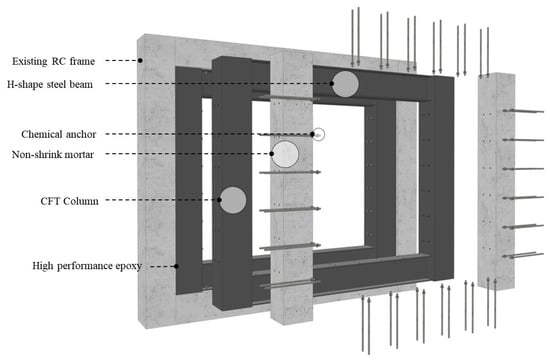
Figure 3.
Detailed diagram of the CCSS strengthening system.
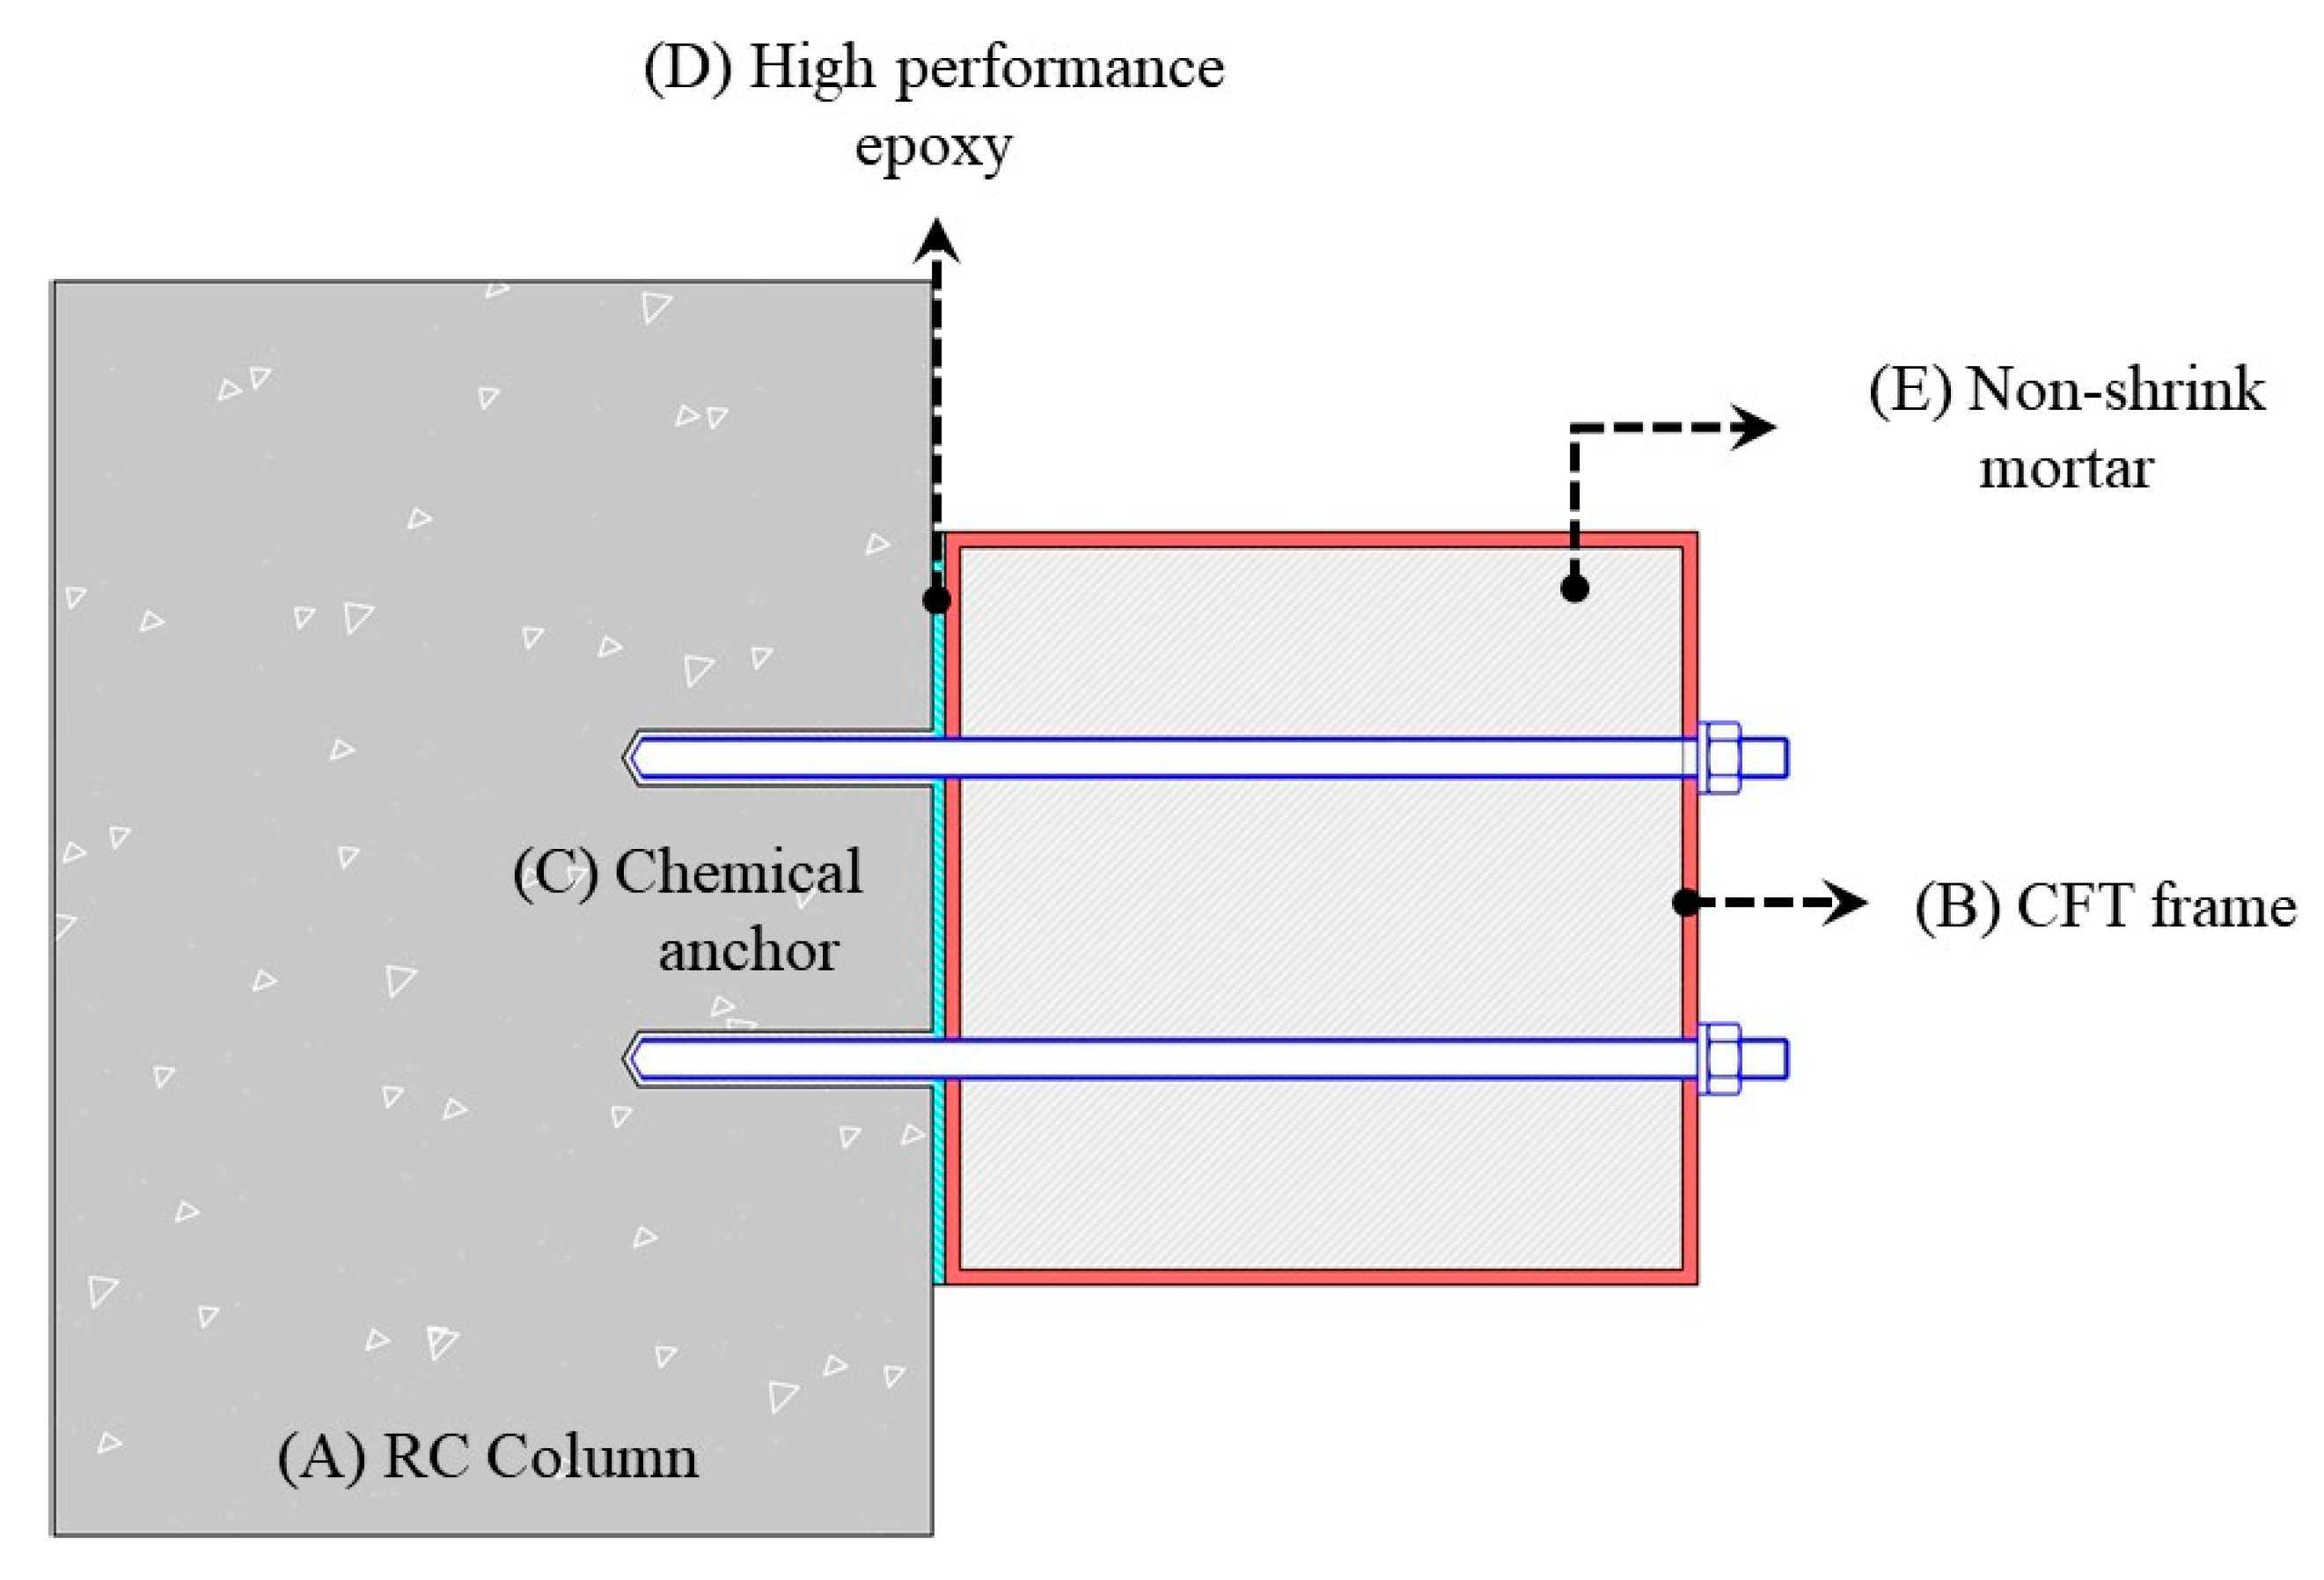
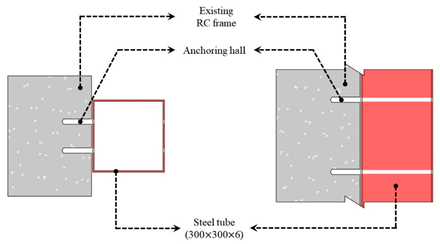
Figure 4 shows the connection details of the CCSS method. The CFT frame is bonded to the existing R/C structure (column and beam) using chemical anchors and high-performance epoxy, and non-shrink mortar is injected to integrate the seismic reinforcement with the existing R/C structure. The construction procedure shown in Table 1 is as follows.
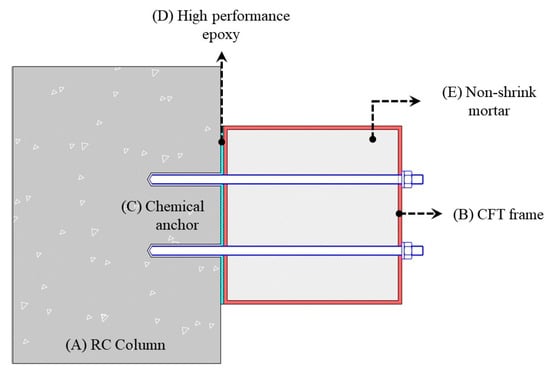
Figure 4.
Details of the connection between the CCSS system and existing column.

Table 1.
Construction procedure of the CCSS strengthening system.
- (1)
- Boring holes for anchor bolts in the existing structure (i.e., column and beam members);
- (2)
- Fixing the position of the CFT frame for seismic strengthening;
- (3)
- Installing the CFT frame using chemical anchors and high-performance epoxy;
- (4)
- Injecting non-shrink mortar and finishing.
3. Experiment Overview
3.1. Material Properties
The design concrete strength of the pseudo-dynamic test specimens is 21 MPa and was selected based on the average strength of the three specimens. The corrected value of the standard specimen is 97% of the measured compressive strength, and the 28-day average concrete strength is 21.6 MPa. One reinforcing bar type (SD400) was used in the specimens, D19 and D16 were used as the main reinforcements for the R/C columns, and D10 was used as the hoop. To investigate the material properties of the reinforcing bars, three tensile specimens were prepared for each reinforcing bar in accordance with KS B 0801 [13], and the tensile test was conducted at a loading rate of 5 mm/min using a universal testing machine (UTM). Based on the test results, the average yield and tensile strengths are 495 and 745 MPa for D19 and D16 and 472 and 702 MPa for D10.
3.2. Specimen Overview and Variables
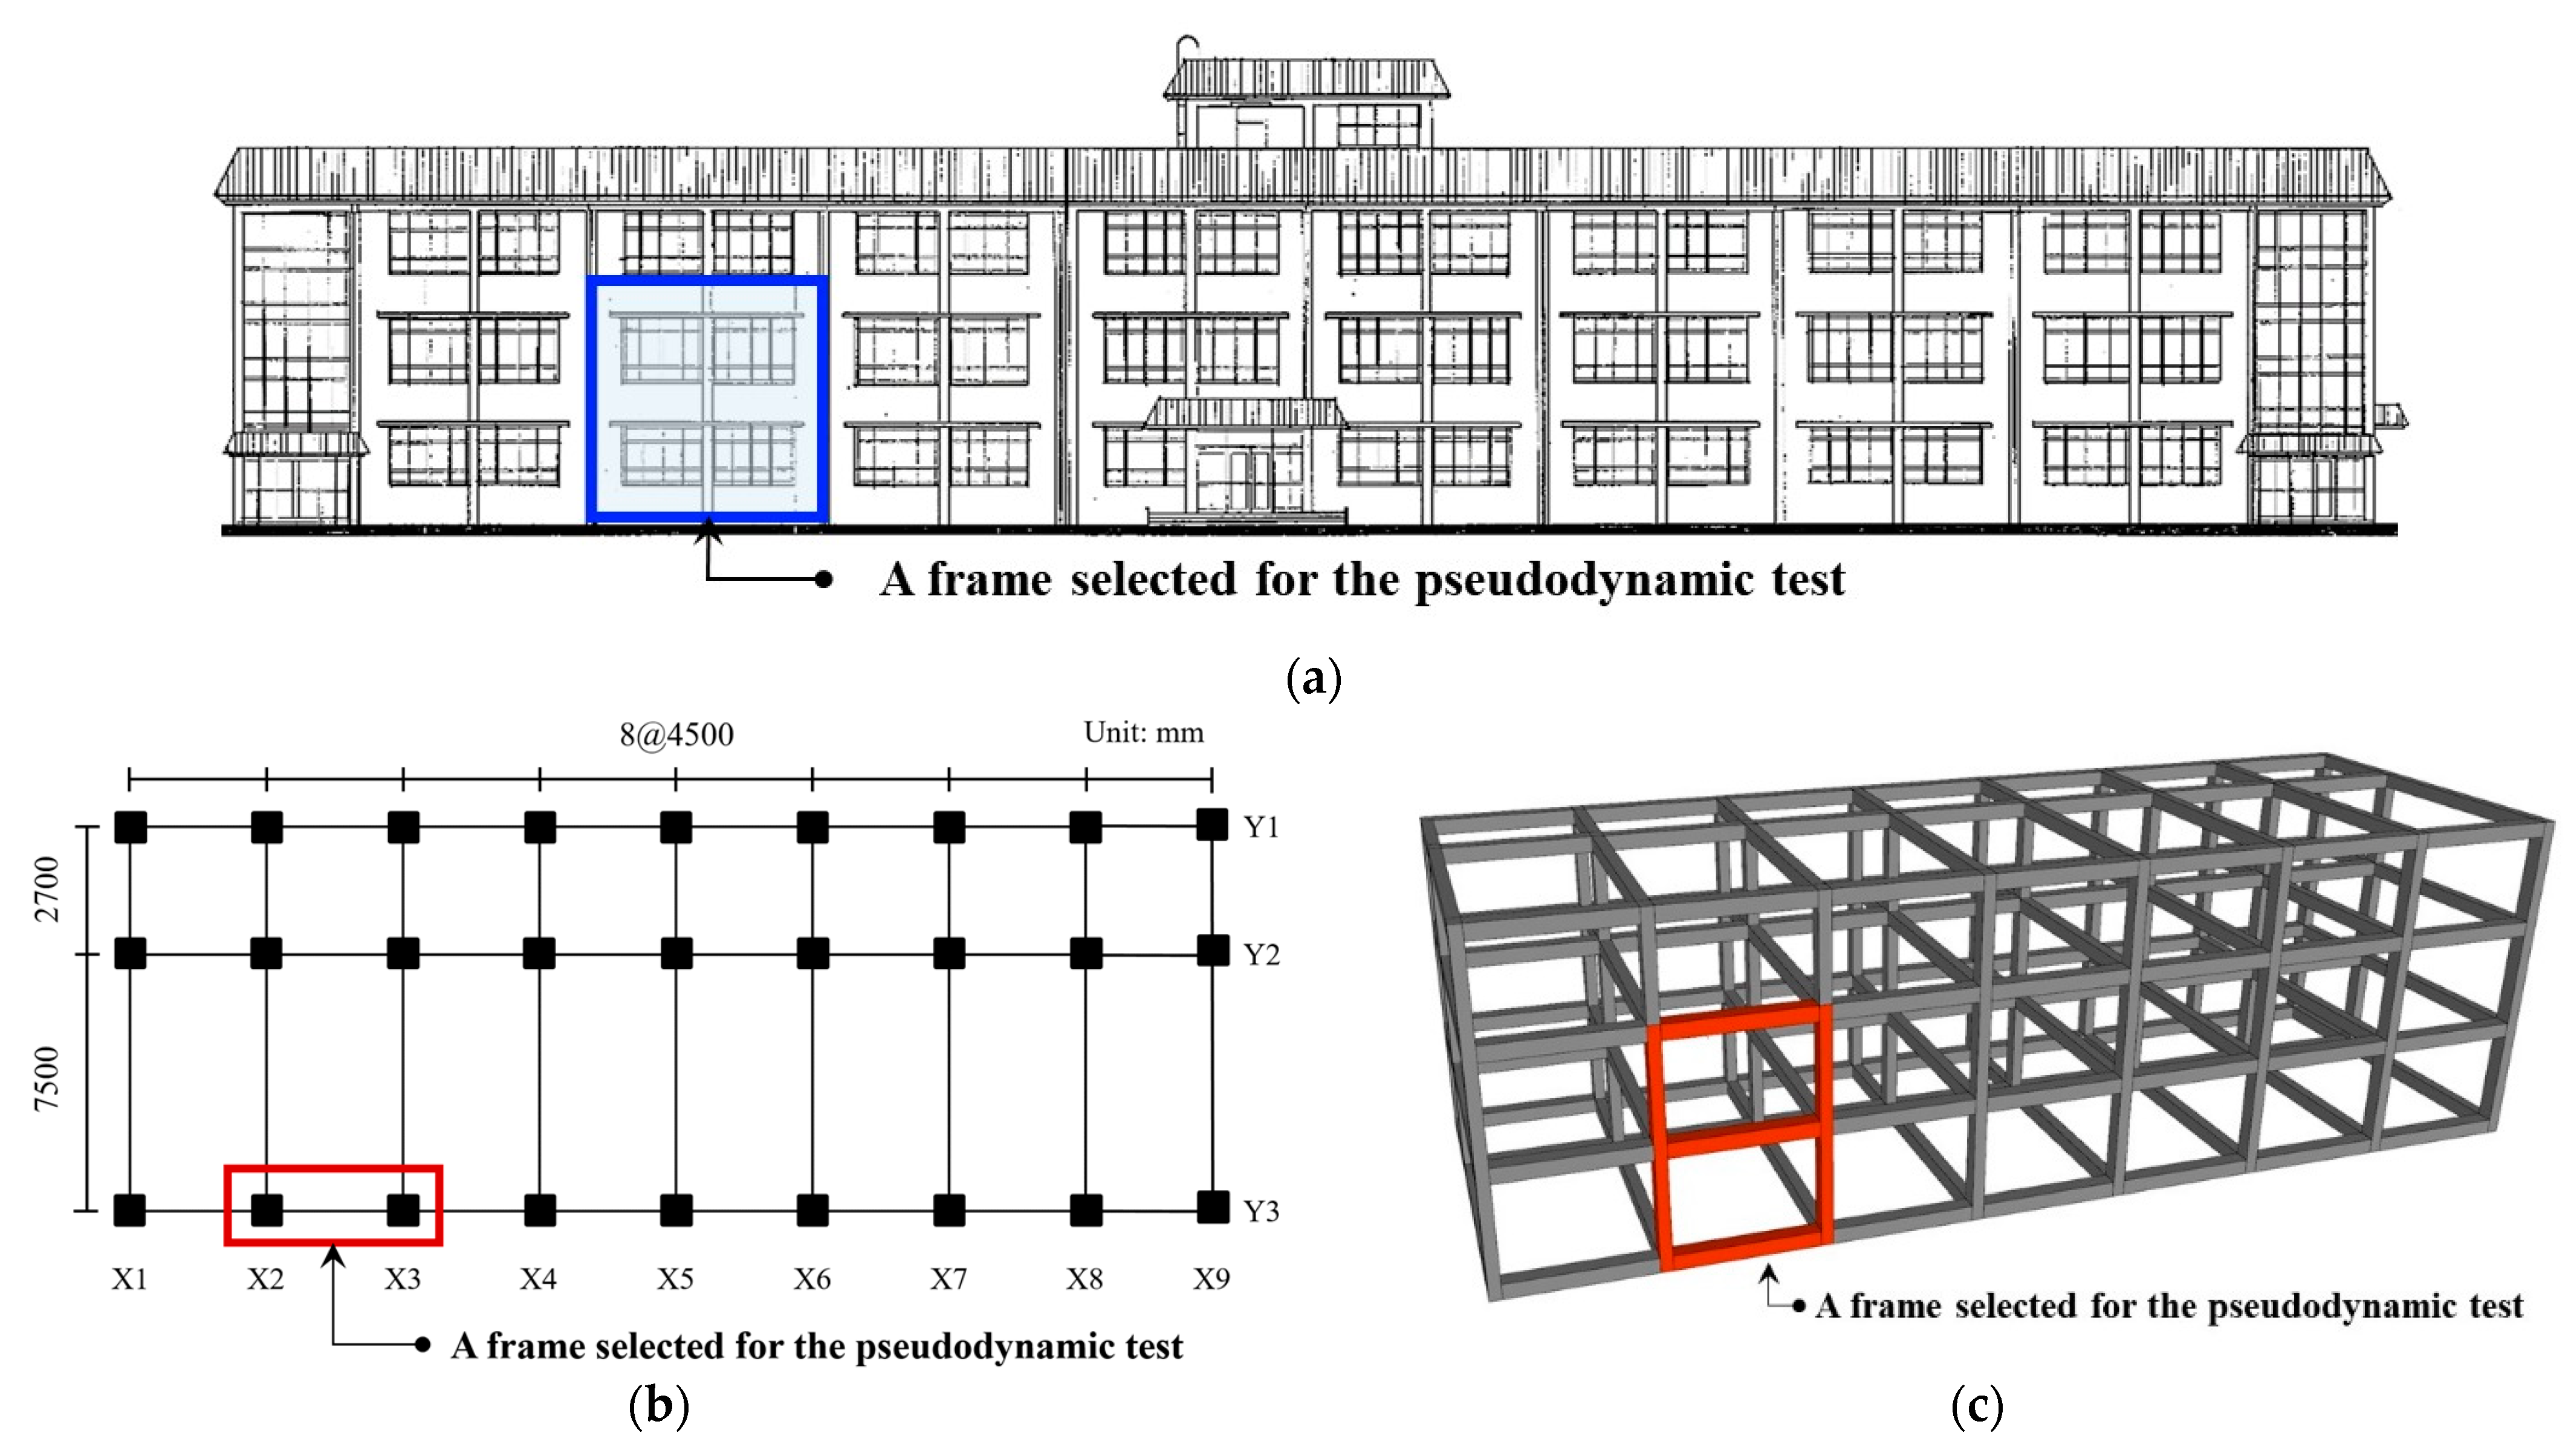
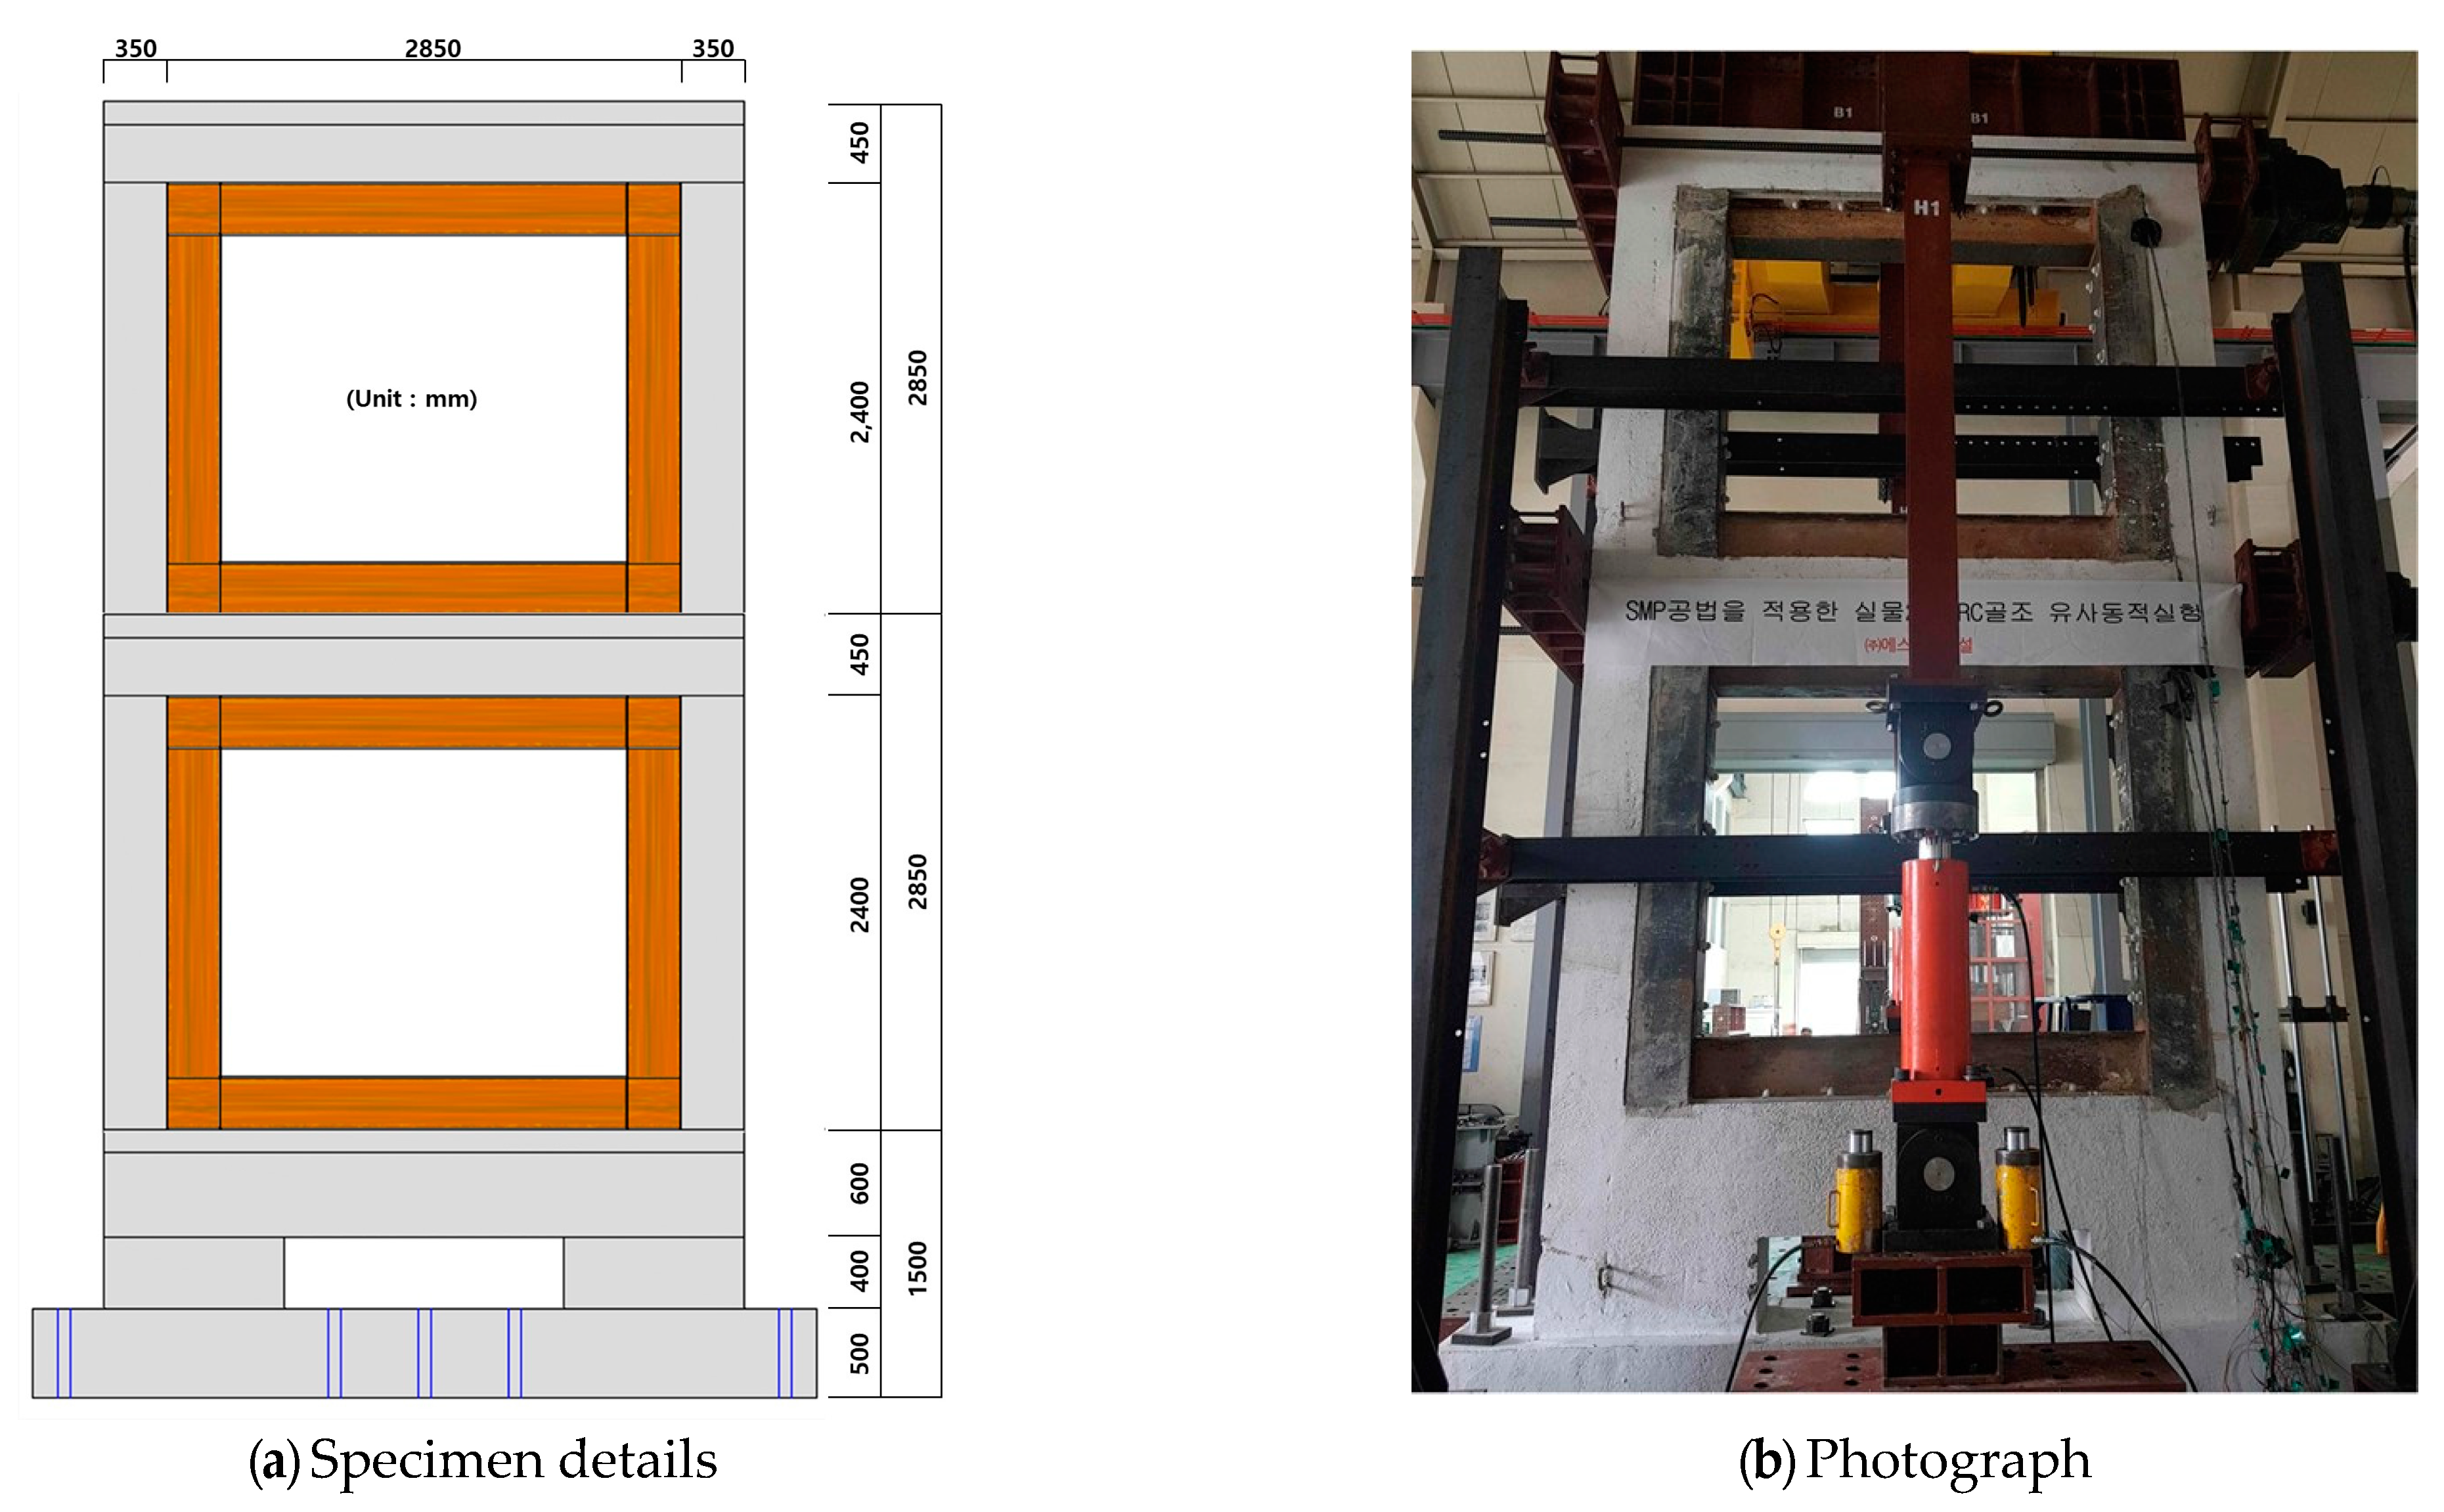
To verify the strengthening effect of CCSS, the framework of an existing three-story R/C school building built in the 1980s with non-seismic features was selected, as shown in Figure 5 [14]. The building has a floor height of 330 mm, seven spans (4500 mm per span) in the longitudinal direction, and two spans (7500 mm × 2700 mm) in the transverse direction. Its design concrete strength is 21 MPa, and the target of the pseudo-dynamic test is the one-span two-story framework inside the external frame of the actual R/C building. The beams of the target framework were prepared as T-shaped beams based on KDS 41 [15] and considering the effective slab width. Table 2 shows the variables of the specimens.
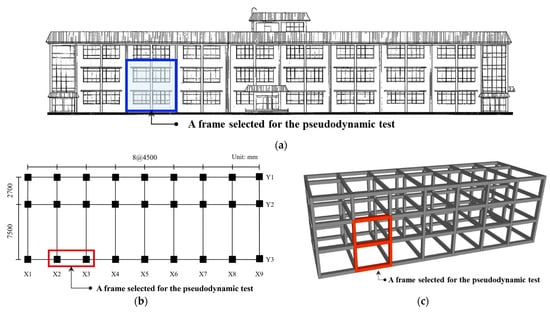
Figure 5.
Selected R/C building and frame for the pseudo-dynamic testing: (a) front view; (b) planar view; (c) isometric view.
Table 2.
Summary of the specimen details.
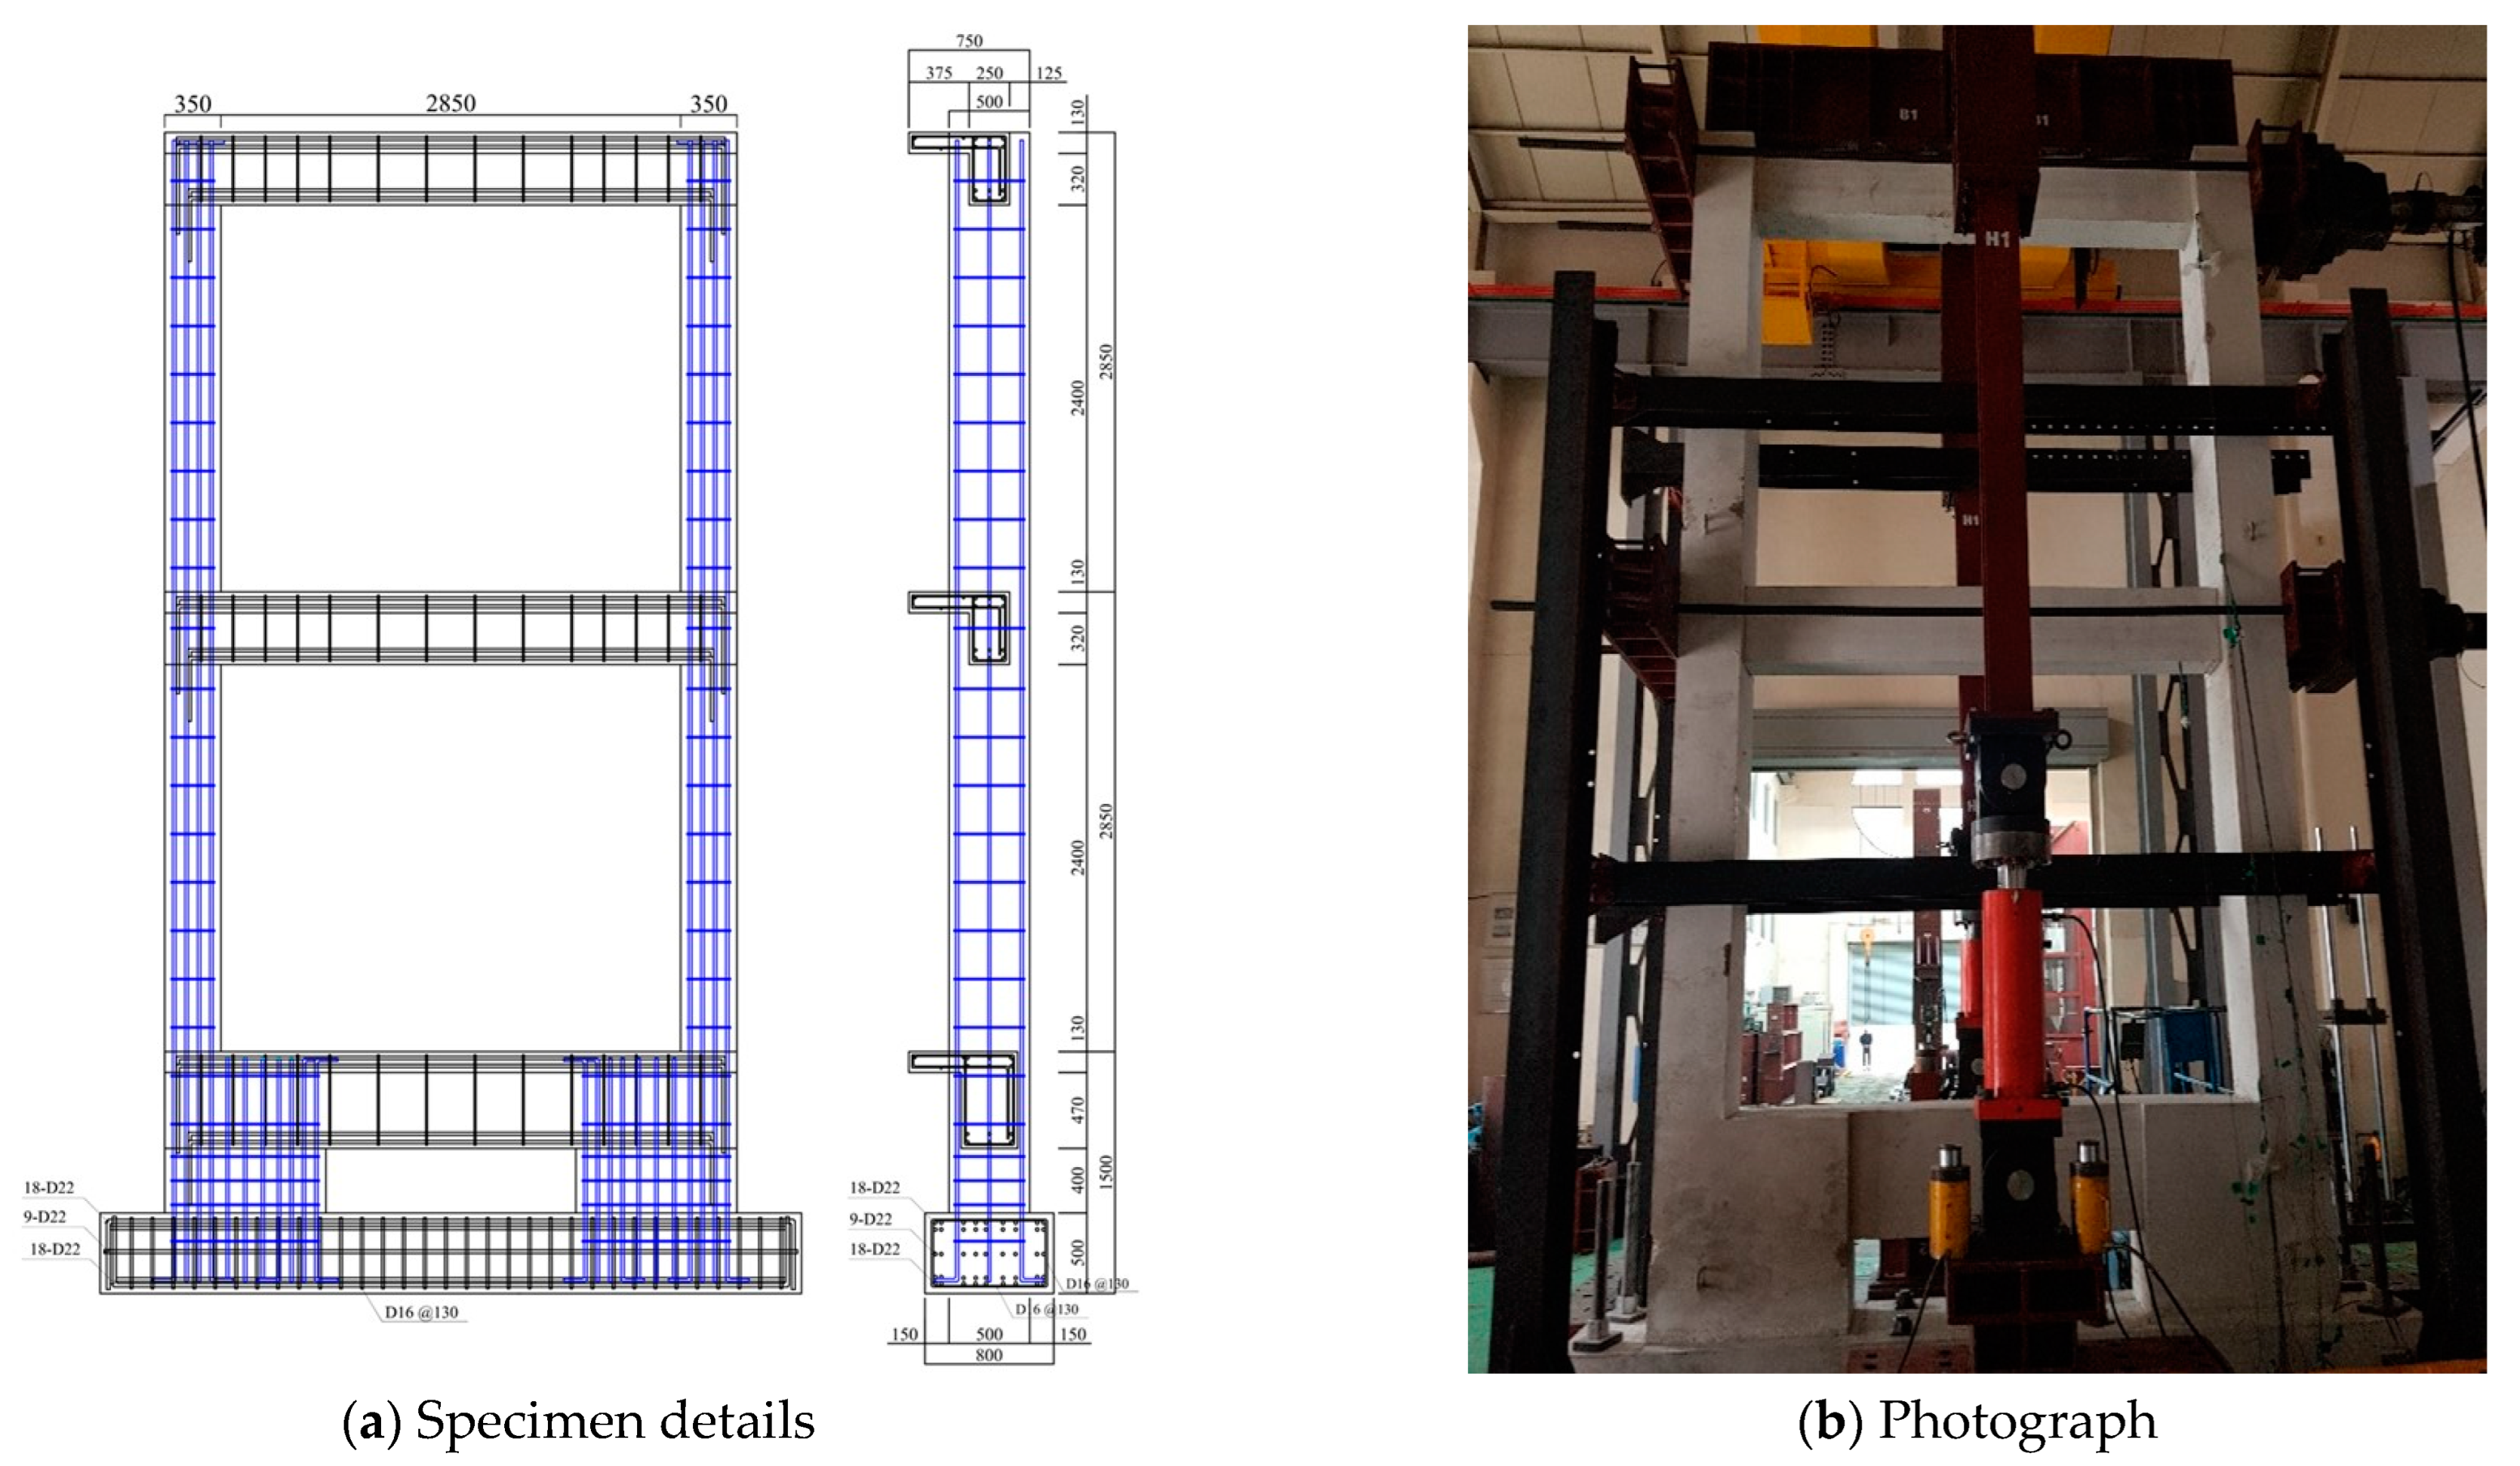
Figure 6 and Figure 7 show the reinforcement details and photographs of the R/C framework of the target building and the specimen reinforced with CCSS. The pseudo-dynamic test was performed on two specimens, including an unreinforced specimen and a CCSS-reinforced specimen for comparison. For the input ground motions used in the pseudo-dynamic test, Hachinohe (EW) exhibited the highest seismic response ductility ratio and was selected based on the research results of Lee [16] to determine the seismic response ductility ratios of the 10 historical seismic waves selected using R/C buildings with less than six stories. The seismic acceleration was normalized to 200, 300, and 400 cm/s2 for the Hachinohe (EW) seismic waves, and 200 cm/s2 (design basis earthquake, DBE) and 300 cm/s2 (maximum considered earthquake, MCE) are the accelerations of two-thirds of the 2400-year return period earthquake and the 2400-year return period earthquake corresponding to seismic zone-1 and ground type S4 in KDS 41 [15], respectively. Additionally, 400 cm/s2 was selected to evaluate the seismic performance of CCSS in the event of a large earthquake. For the axial force, the axial load applied to the two actual columns (framework), i.e., 1000 kN, was divided, and an axial load of 500 kN was applied to each column.
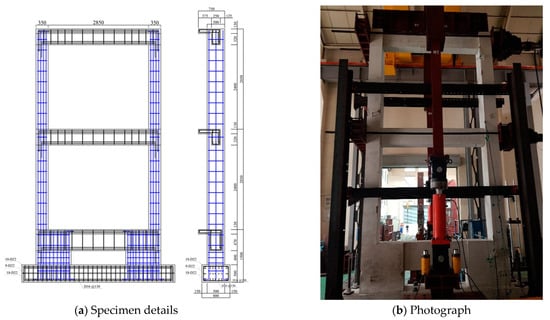
Figure 6.
Detailed configuration of the control specimen (PD-FR): (a) rebar arrangement; (b) photograph.
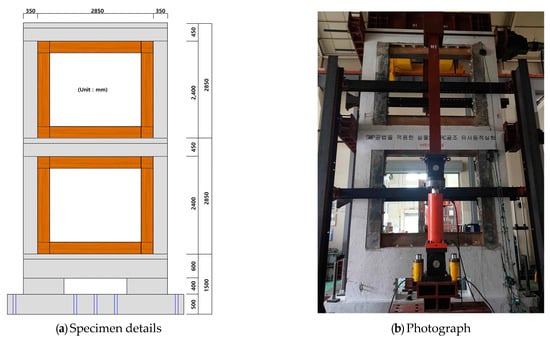
Figure 7.
Detailed configuration of the specimens strengthened using the CCSS system (PD): (a) rebar arrangement; (b) photography.
3.3. CCSS Joint Design
The joint type, embedment depth, and anchor spacing for CCSS were determined based on the anchor equations provided by JBDPA [3]. The joint was designed considering only 40% of the ultimate strength of a single anchor to retain the integrated behavior and ensure the safety of the existing R/C framework and reinforcement frame. The anchor design results for the CCSS method are shown in Table 3. The pseudo-dynamic test specimen reinforced using the CCSS method in Figure 7 was prepared based on a joint with the design details listed in Table 3.
Table 3.
Results of the joint anchor design using the CCSS method.
The shear force that can act on the existing R/C frame was calculated for columns and beams through the equation in Section 6.1, which will be described later, and ΣP in Table 3 was calculated. Based on ΣP, the quantity of anchors was determined considering a strength of 40% of the ultimate strength of a single anchor. Joint connection anchors with a diameter (D) of 16 mm and a spacing of 300 mm were arranged in double layers, and 20 and 18 anchors were used in each beam and column, respectively. The strength of the joint was found to be approximately 2.0 times higher than the lateral strength of the reinforcement frame along the beam length (LB) and 2.2 times higher along the column length (LC). The proposed CCSS method, when applied to the existing R/C framework, is expected to resist seismic loads through an integrated behavior.
4. Pseudo-Dynamic Test System
4.1. Overview of the Pseudo-Dynamic Test
The test methods used to investigate the nonlinear response of a building to earthquakes can be mainly divided into the shaking table test and the pseudo-dynamic test, which includes the cyclic loading test [17]. The shaking table test is a very efficient technique for evaluating the response of a building to earthquakes. Because the size and weight of a structural specimen are limited by the size and capacity of the shaking table, scale models of the specimen are mostly used. This size reduction leads to a similarity problem with the actual building.
Consequently, owing to the limitations caused by the size reduction, the cyclic loading test wherein the load and displacement were controlled was used to evaluate the nonlinear structural behavior of actual buildings. The pseudo-dynamic test was proposed by combining the benefits of the cyclic loading and shaking table tests [18]. It is an experimental method that combines structural testing with numerical integration-based dynamic analysis. It consists of a numerical calculation part using a computer and a specimen loading part via structural testing. In the numerical calculation (computer), the equation of motion is calculated using the numerical integration method and based on the seismic response of the structural specimen to its displacement, which was measured under loading, input seismic acceleration, and seismic response in the present step to calculate the displacement for the seismic response in the next step.
The calculated seismic response displacement was applied to the structural specimen using an actuator to measure the displacement owing to loading. By repeating the above procedure, the seismic performance of the target building specimen was evaluated by applying the response displacement of an earthquake that is similar to the structural specimen and calculating the seismic response (displacement, velocity, and acceleration) using a computer.
The pseudo-dynamic test is similar to the cyclic loading test, excluding the fact that the seismic displacement to be applied to the building is determined during the test via numerical integration using an analytical method. In general, the restoration force characteristics of the building must be assumed during the calculation of the seismic response using nonlinear dynamic analysis. However, the pseudo-dynamic test may have very similar effects to the actual seismic response characteristics when the restoration force of the specimen is directly measured.
4.2. Pseudo-Dynamic Test System
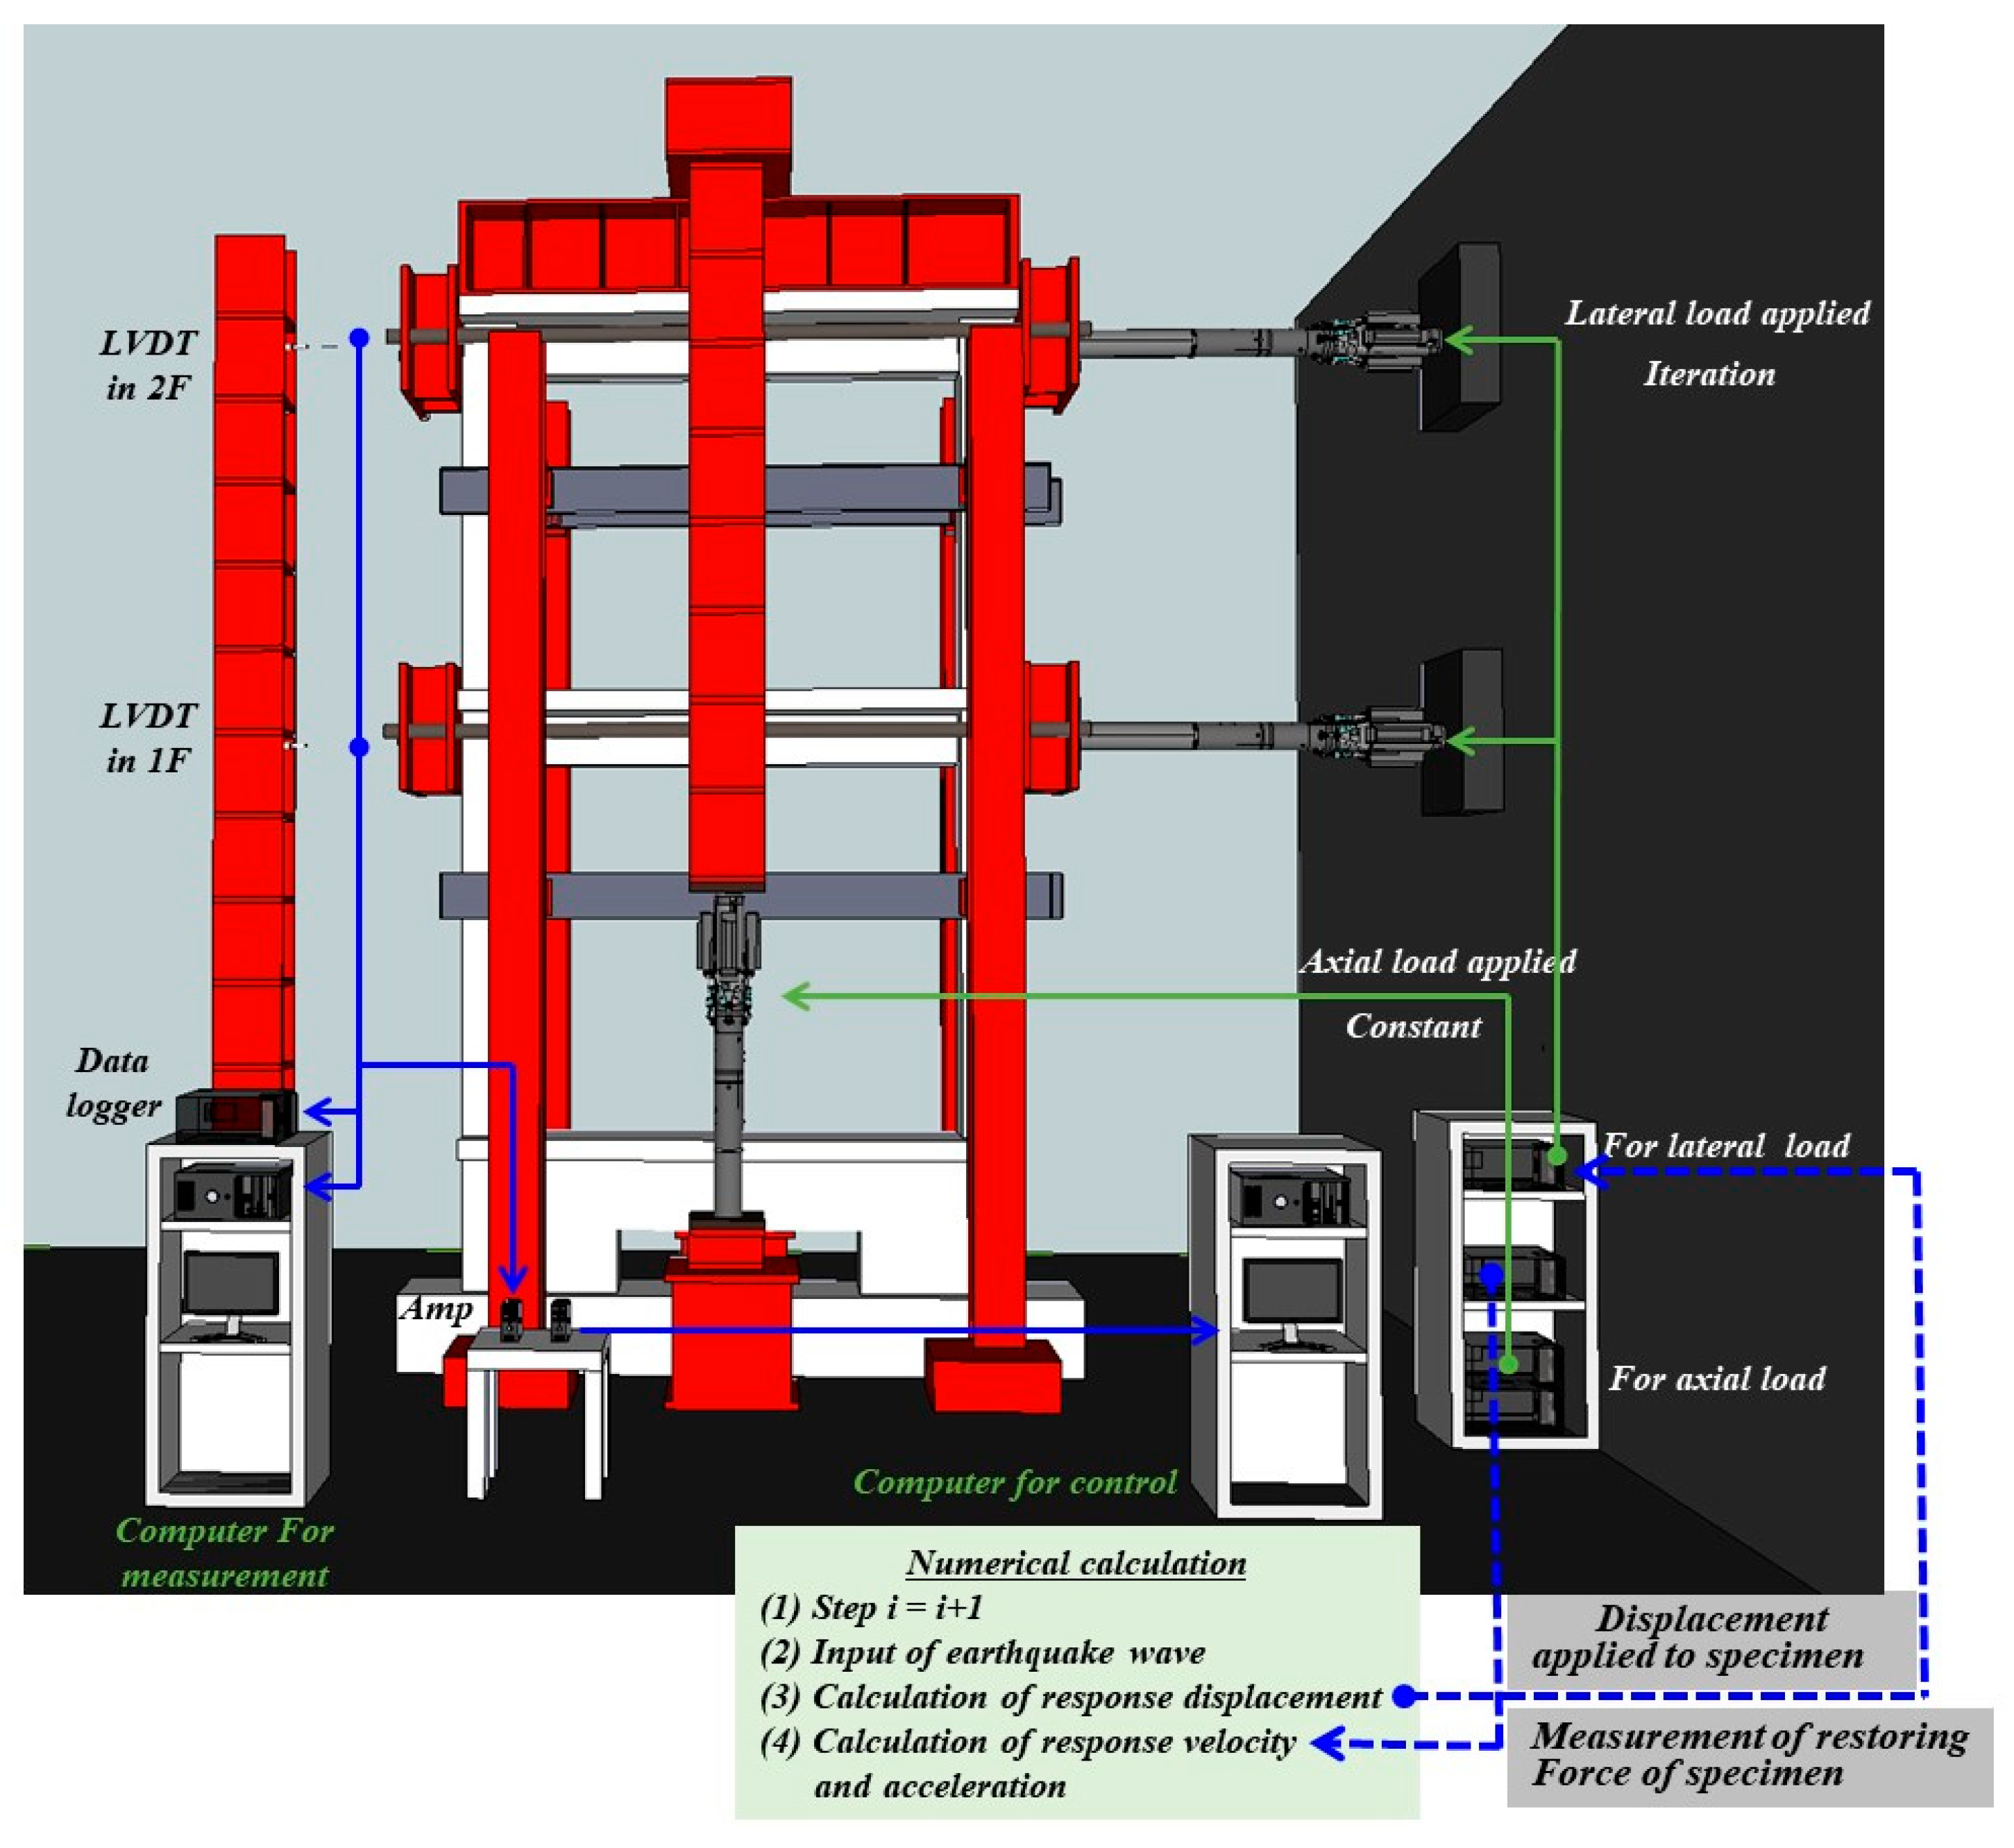
Figure 8 shows the method and pseudo-dynamic specimen setting of the pseudo-dynamic test system used to evaluate the seismic performance of the CCSS method developed in this study. The pseudo-dynamic test conducted in this study can be modeled as a two-degree-of-freedom system, as shown in Figure 8. It consists of a numerical analysis part that is based on the input seismic wave from the control computer and the loading part of the structural specimen. The seismic response displacement calculated in the pseudo-dynamic test was applied to the specimen by two lateral actuators. The restoration force of the framework is measured mechanically during structural testing and used by the control computer to determine the seismic response displacement.
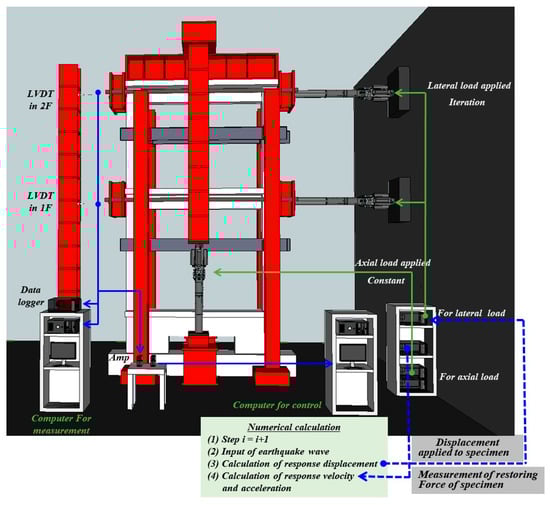
Figure 8.
Proposed pseudo-dynamic testing system.
Data conversion was performed using analog to digital or digital to analog converters [19]. In the pseudo-dynamic test, the seismic response was numerically calculated using the closed-loop control system. For the analysis by the control computer and numerical integration, the pseudo-dynamic testing program developed by MTS [20] was used. In the loading test, the seismic response in the next step was calculated using the equation of motion shown in Equation (1), and based on the numerical integration method, the restoration force of the framework specimen owing to the displacement measured using a displacement meter (LVDT) and the seismic response value in the current step, including the input seismic acceleration.
where M, C, and K are the mass, damping, and stiffness matrix of the structure, respectively, y is the relative displacement vector of each foundation layer mass, is the restoration force vector, and is the input ground acceleration.
The α-method [21] was used for the numerical integration of the equation of motion. Equations (2)–(4) show the algorithms for the numerical integration of the pseudo-dynamic test.
where , , and are the joint displacement, velocity, and acceleration at the same time as i∆t, ∆t is the integration time interval, is the restoration force vector at the joint, and is the external load vector ().
For elastic structures, (K: elastic stiffness matrix of the structure) holds, and α, β, and γ are variables for controlling the numerical characteristics of the algorithms; , , and indicates unconditional stability. The displacement response in the next step was then calculated using Equations (1)–(4) based on the stiffness (K), mass (M), and stiffness proportional damping coefficient (C) of the structure. The damping ratio (ξ) was set to 0.03.
Meanwhile, the seismic displacement value was applied to the structural specimen using the 1000 kN actuators installed on the first and second floors. The horizontal displacement value used to calculate the seismic response displacement value was then measured using the 300 mm displacement meters (LVDTs) installed on each floor (see Figure 8).
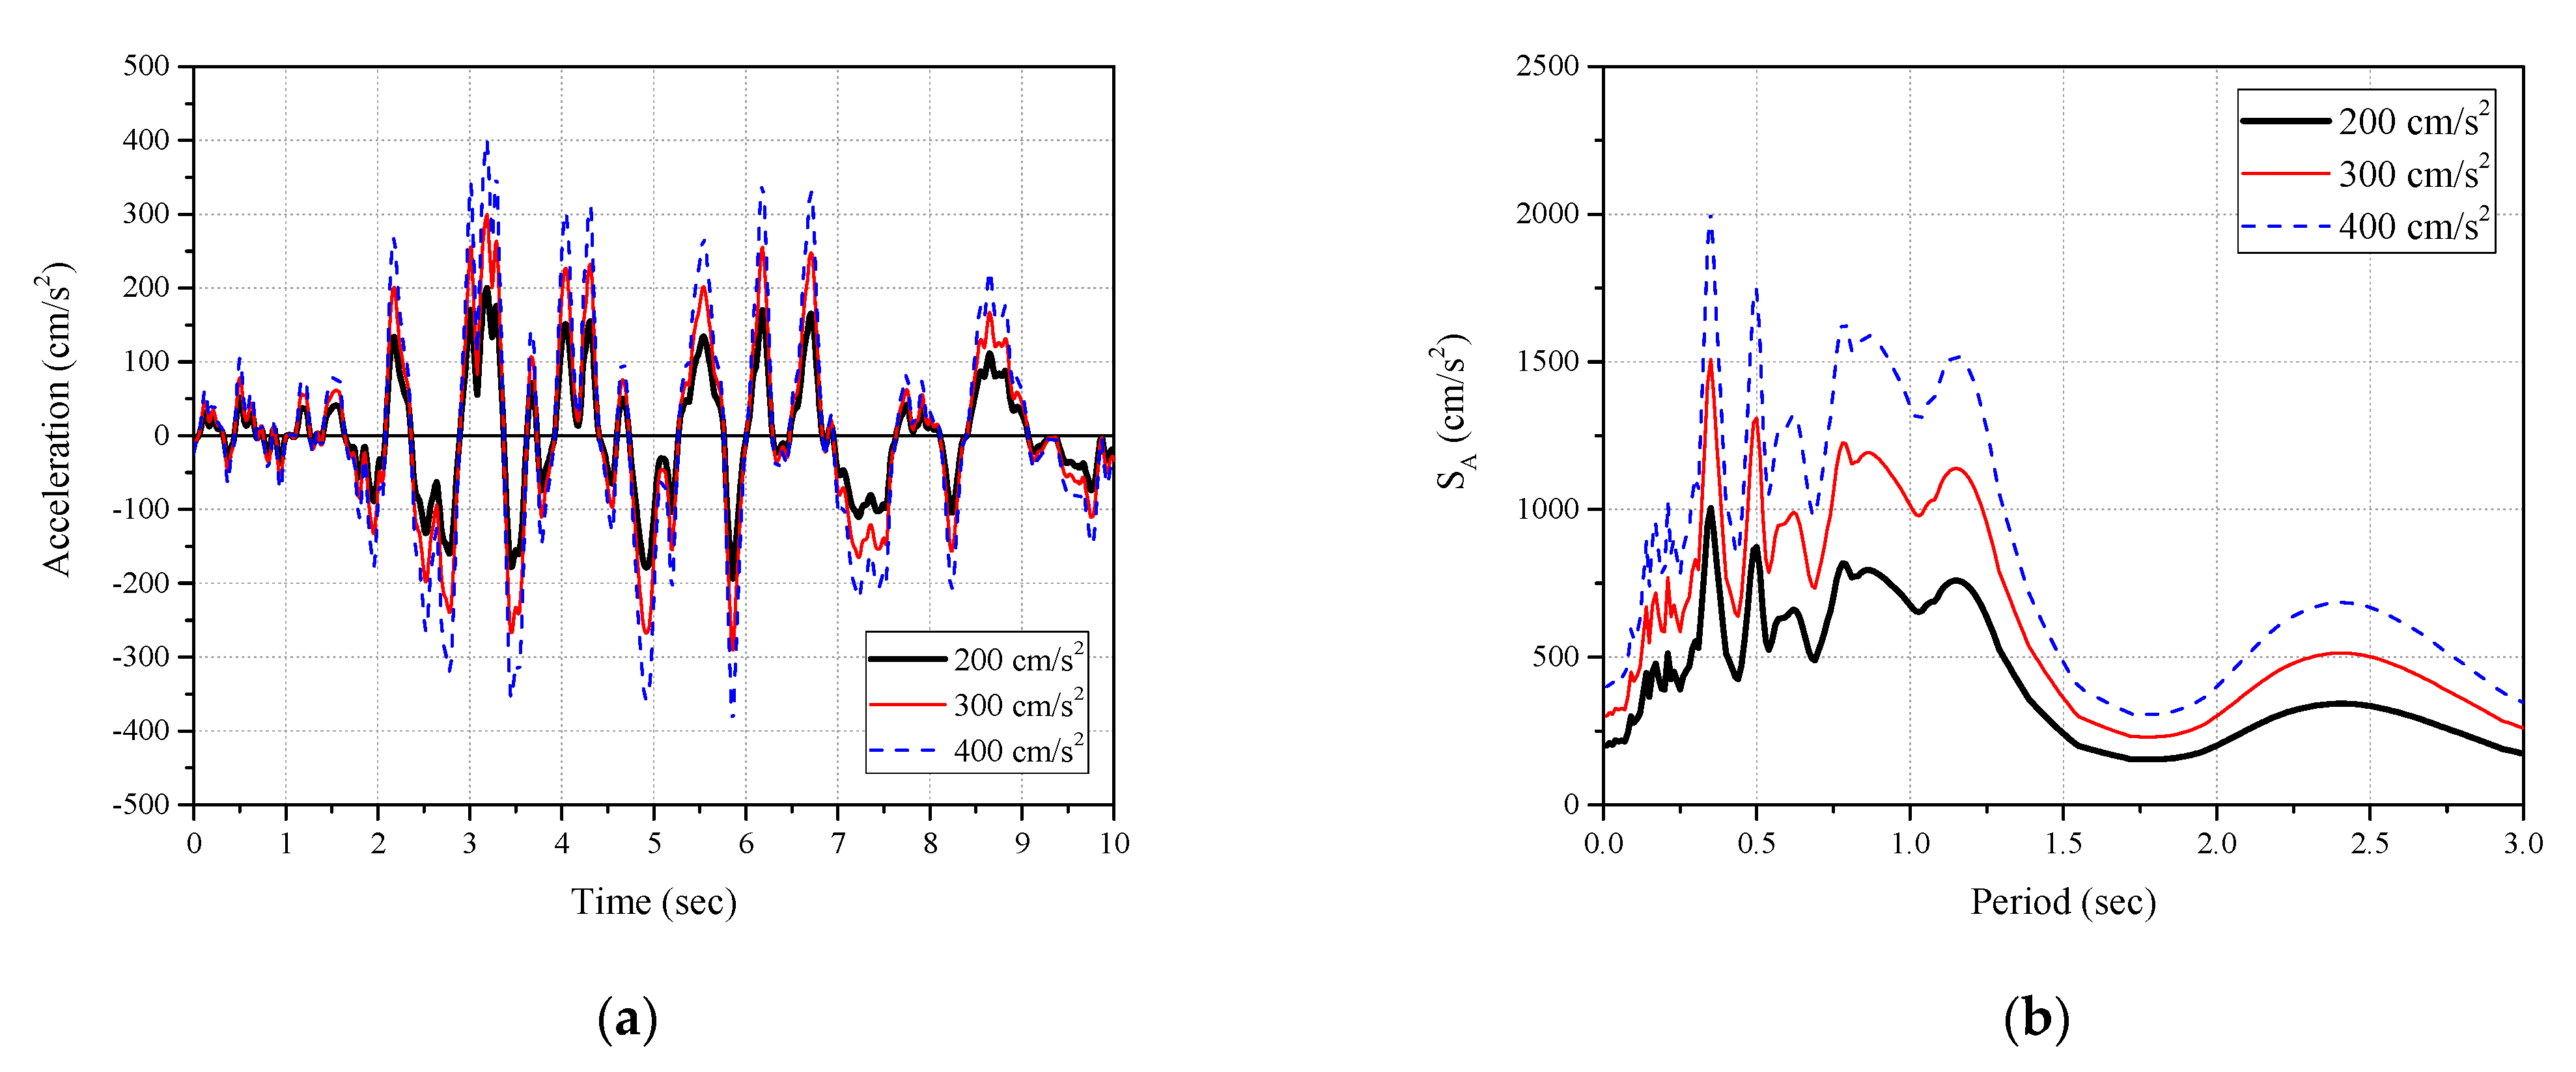
As described in Section 3.2, during the pseudo-dynamic test, the 1000 kN oil jack set was used to apply an axial load (1000 kN) of 500 kN to each of the two actual columns (framework). Figure 9 shows time–acceleration relations of the normalized ground motion accelerations used in the pseudo-dynamic test, respectively, together with their acceleration response spectrum.
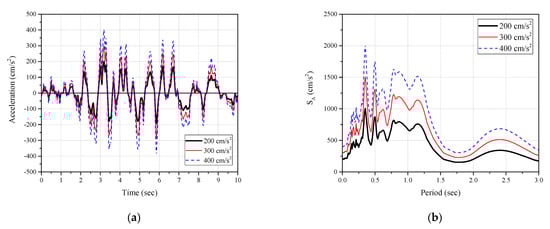
Figure 9.
Seismic waves applied to pseudo-dynamic test: (a) time-acceleration relation and (b) acceleration response spectrum.
5. Pseudo-Dynamic Test Results and Analysis
Failure situations, including cracks, were summarized for the unreinforced pseudo-dynamic specimen and the CCSS-reinforced specimen shown in Table 2. The seismic performance of the PD-CCSS-reinforced specimen was evaluated by comparing it with the unreinforced specimen by examining the restoring force, that is, the load–displacement curve, seismic response displacement, time history curve, and maximum seismic response load and displacement.
5.1. Crack and Failure Pattern
- (1)
- PD-FR unreinforced specimen
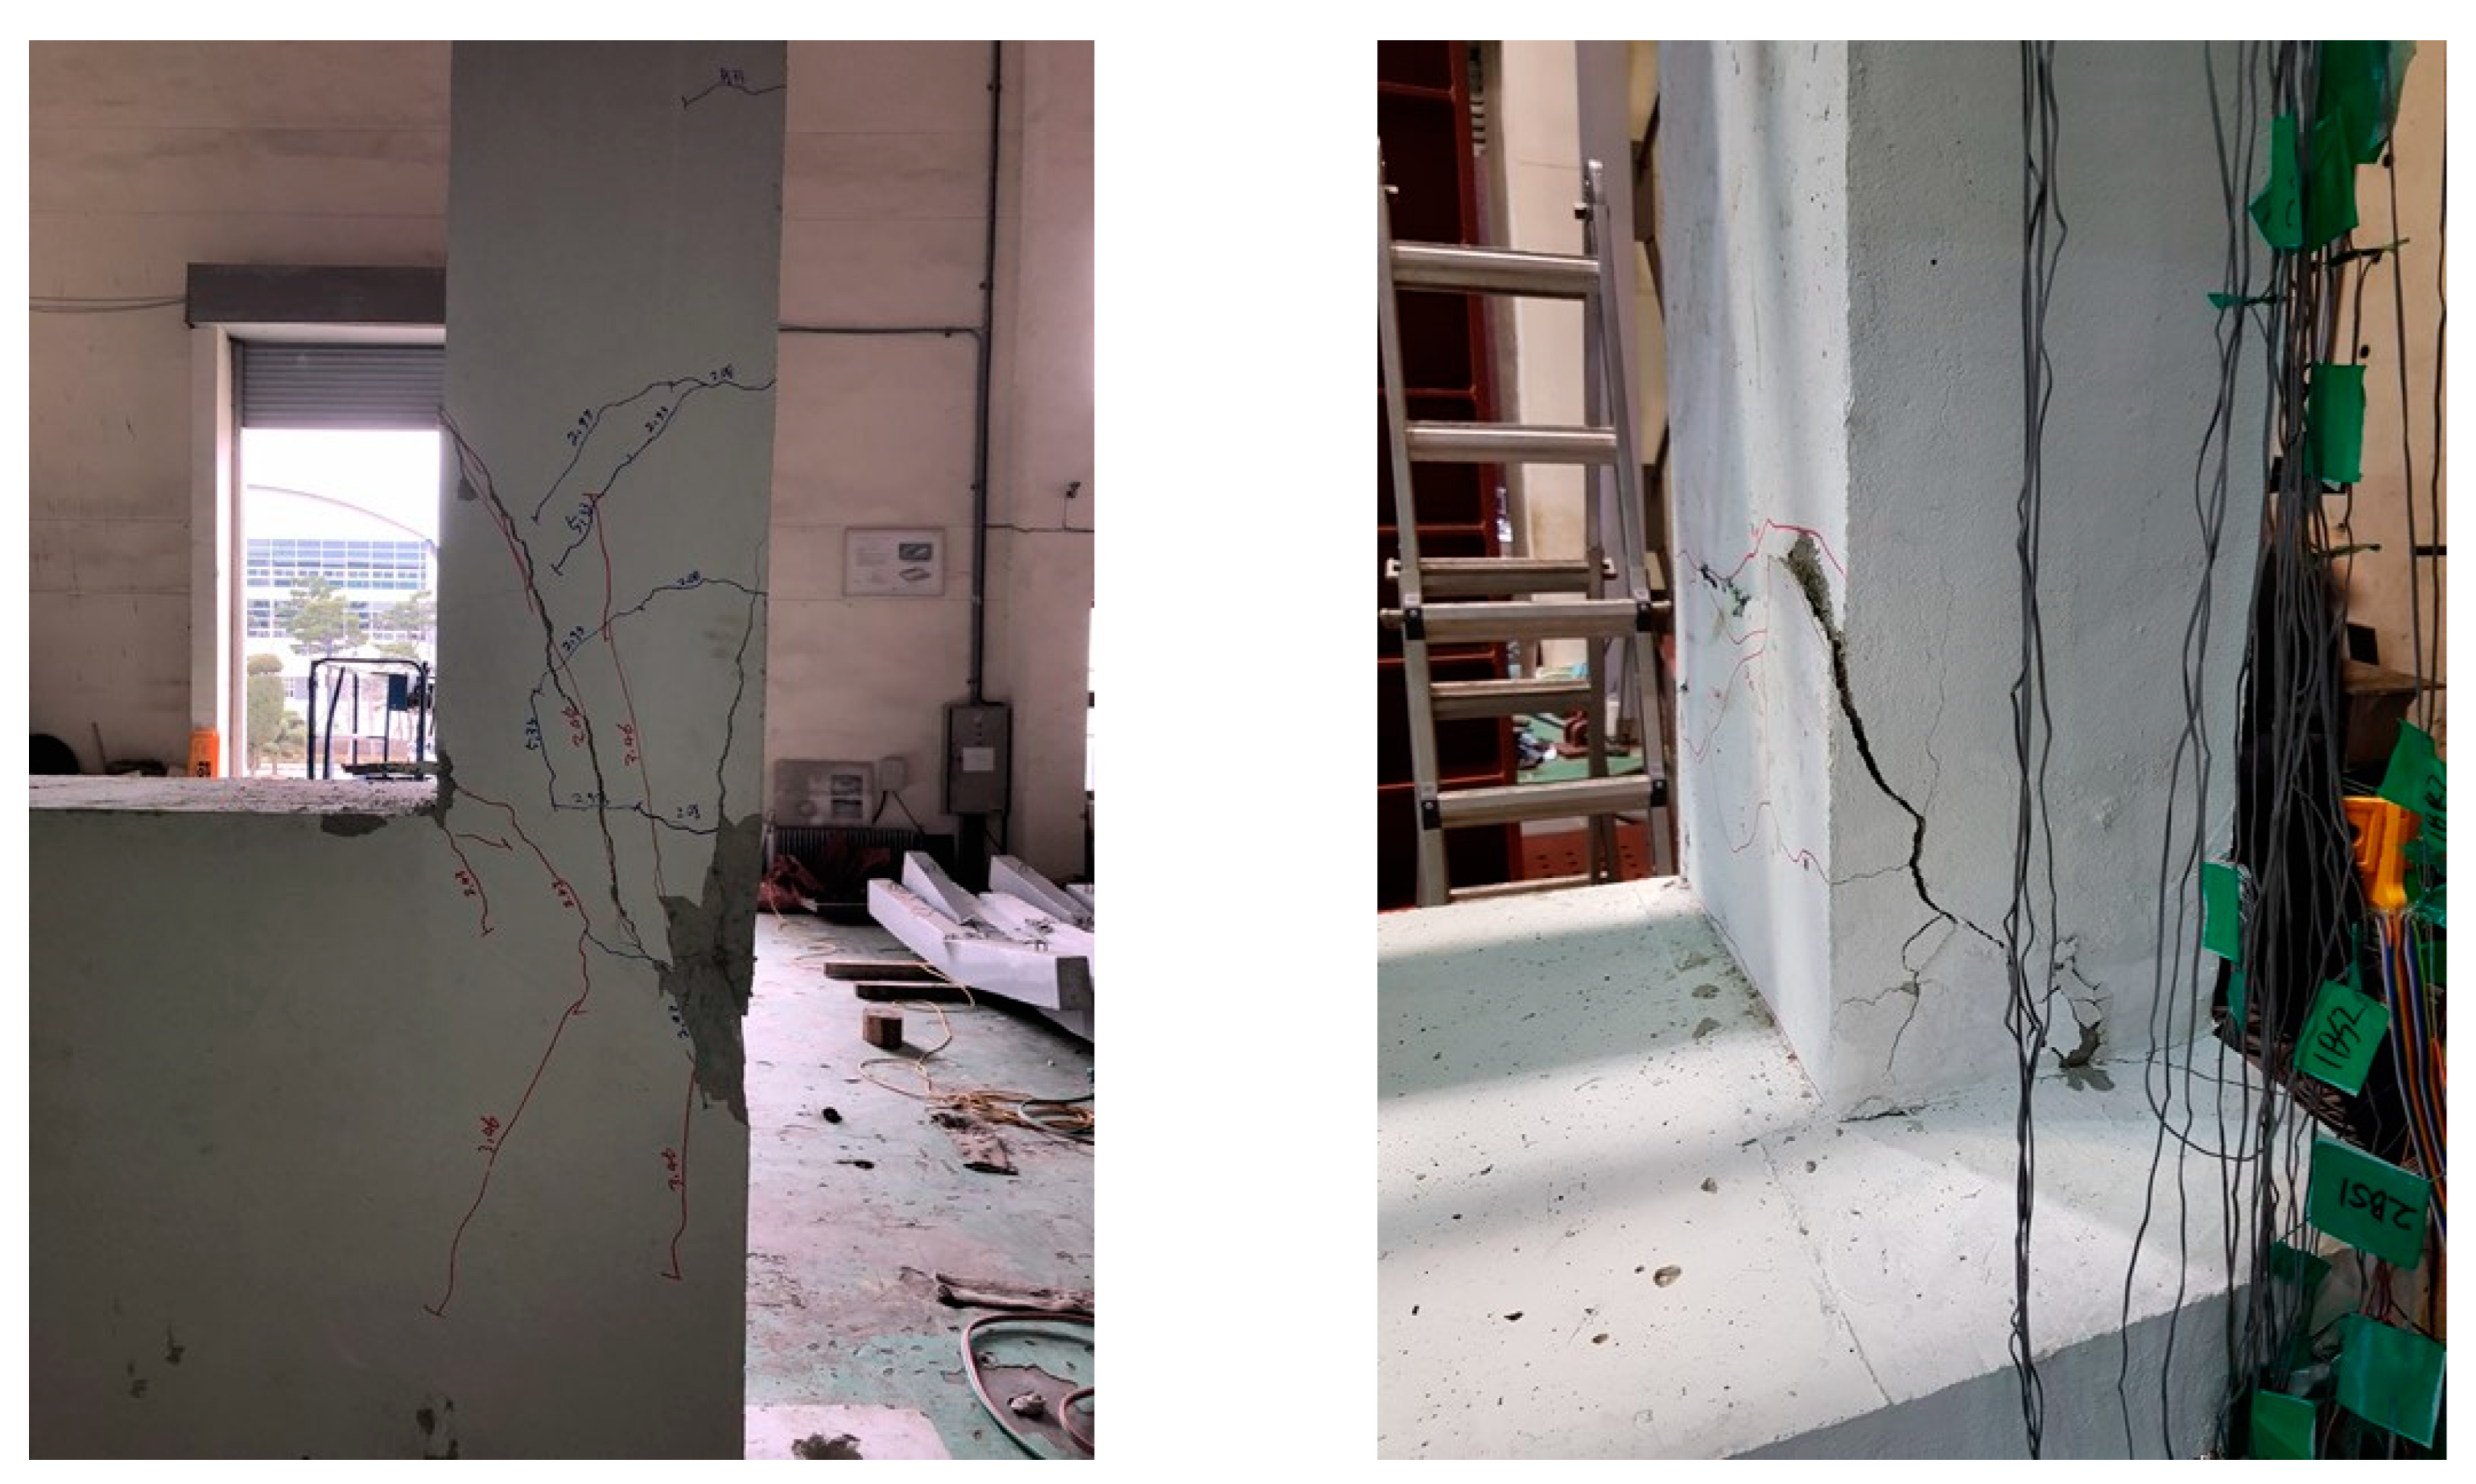
For the PD-FR specimen, initial flexural cracks occurred in the lower part of the column in approximately 2.03 s (6.4 mm) under the seismic wave of 200 cm/s2. The flexural cracks expanded and shear cracks occurred in the upper and lower parts of the column from 2.4 s (17.7 mm). After 2.89 s (38.9 mm), the width of the shear cracks in the lower part of the column increased. At 3.3 s (50.0 mm), severe peeling of concrete began, and the width of shear cracks seriously increased. The maximum displacement occurred at 3.43 s (70.5 mm), and the final collapse was observed as shear failure occurred in the lower part of the framework on the first floor, as shown in Figure 10.

Figure 10.
Test result of PD-FR specimen (200 cm/s2, final).
This is similar to the result of a previous study [12], which suggests that R/C school buildings with non-seismic features are highly likely to exhibit serious seismic damage under the ground motion of 200 cm/s2. This is judged to be important information for securing the seismic safety of R/C buildings without seismic design, i.e., seismic reinforcement.
- (2)
- PD-CCSS (CCSS-reinforced specimen)
Figure 11 shows the final step (10 s) of the PD-CCSS, which is the specimen reinforced with the proposed CCSS, for the seismic wave of 200 cm/s2. At approximately 2.25 s (displacement: 4.11 mm), slight initial flexural cracks were observed in the lower part of the column. After 3.07 s (displacement: 6.8 mm), the number of flexural cracks increased, but the degree of the cracks was minor. After 4.14 s, when the maximum seismic response was observed (displacement: 10.5 mm), the number of flexural cracks gradually increased, but the crack width was small. Finally, light damage occurred.
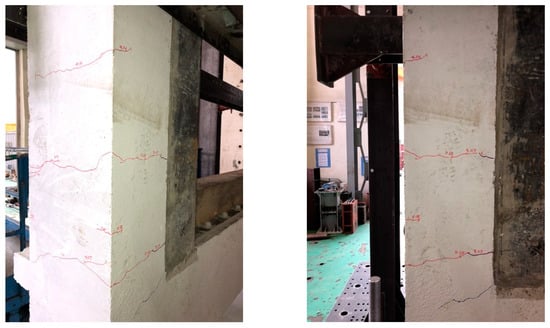
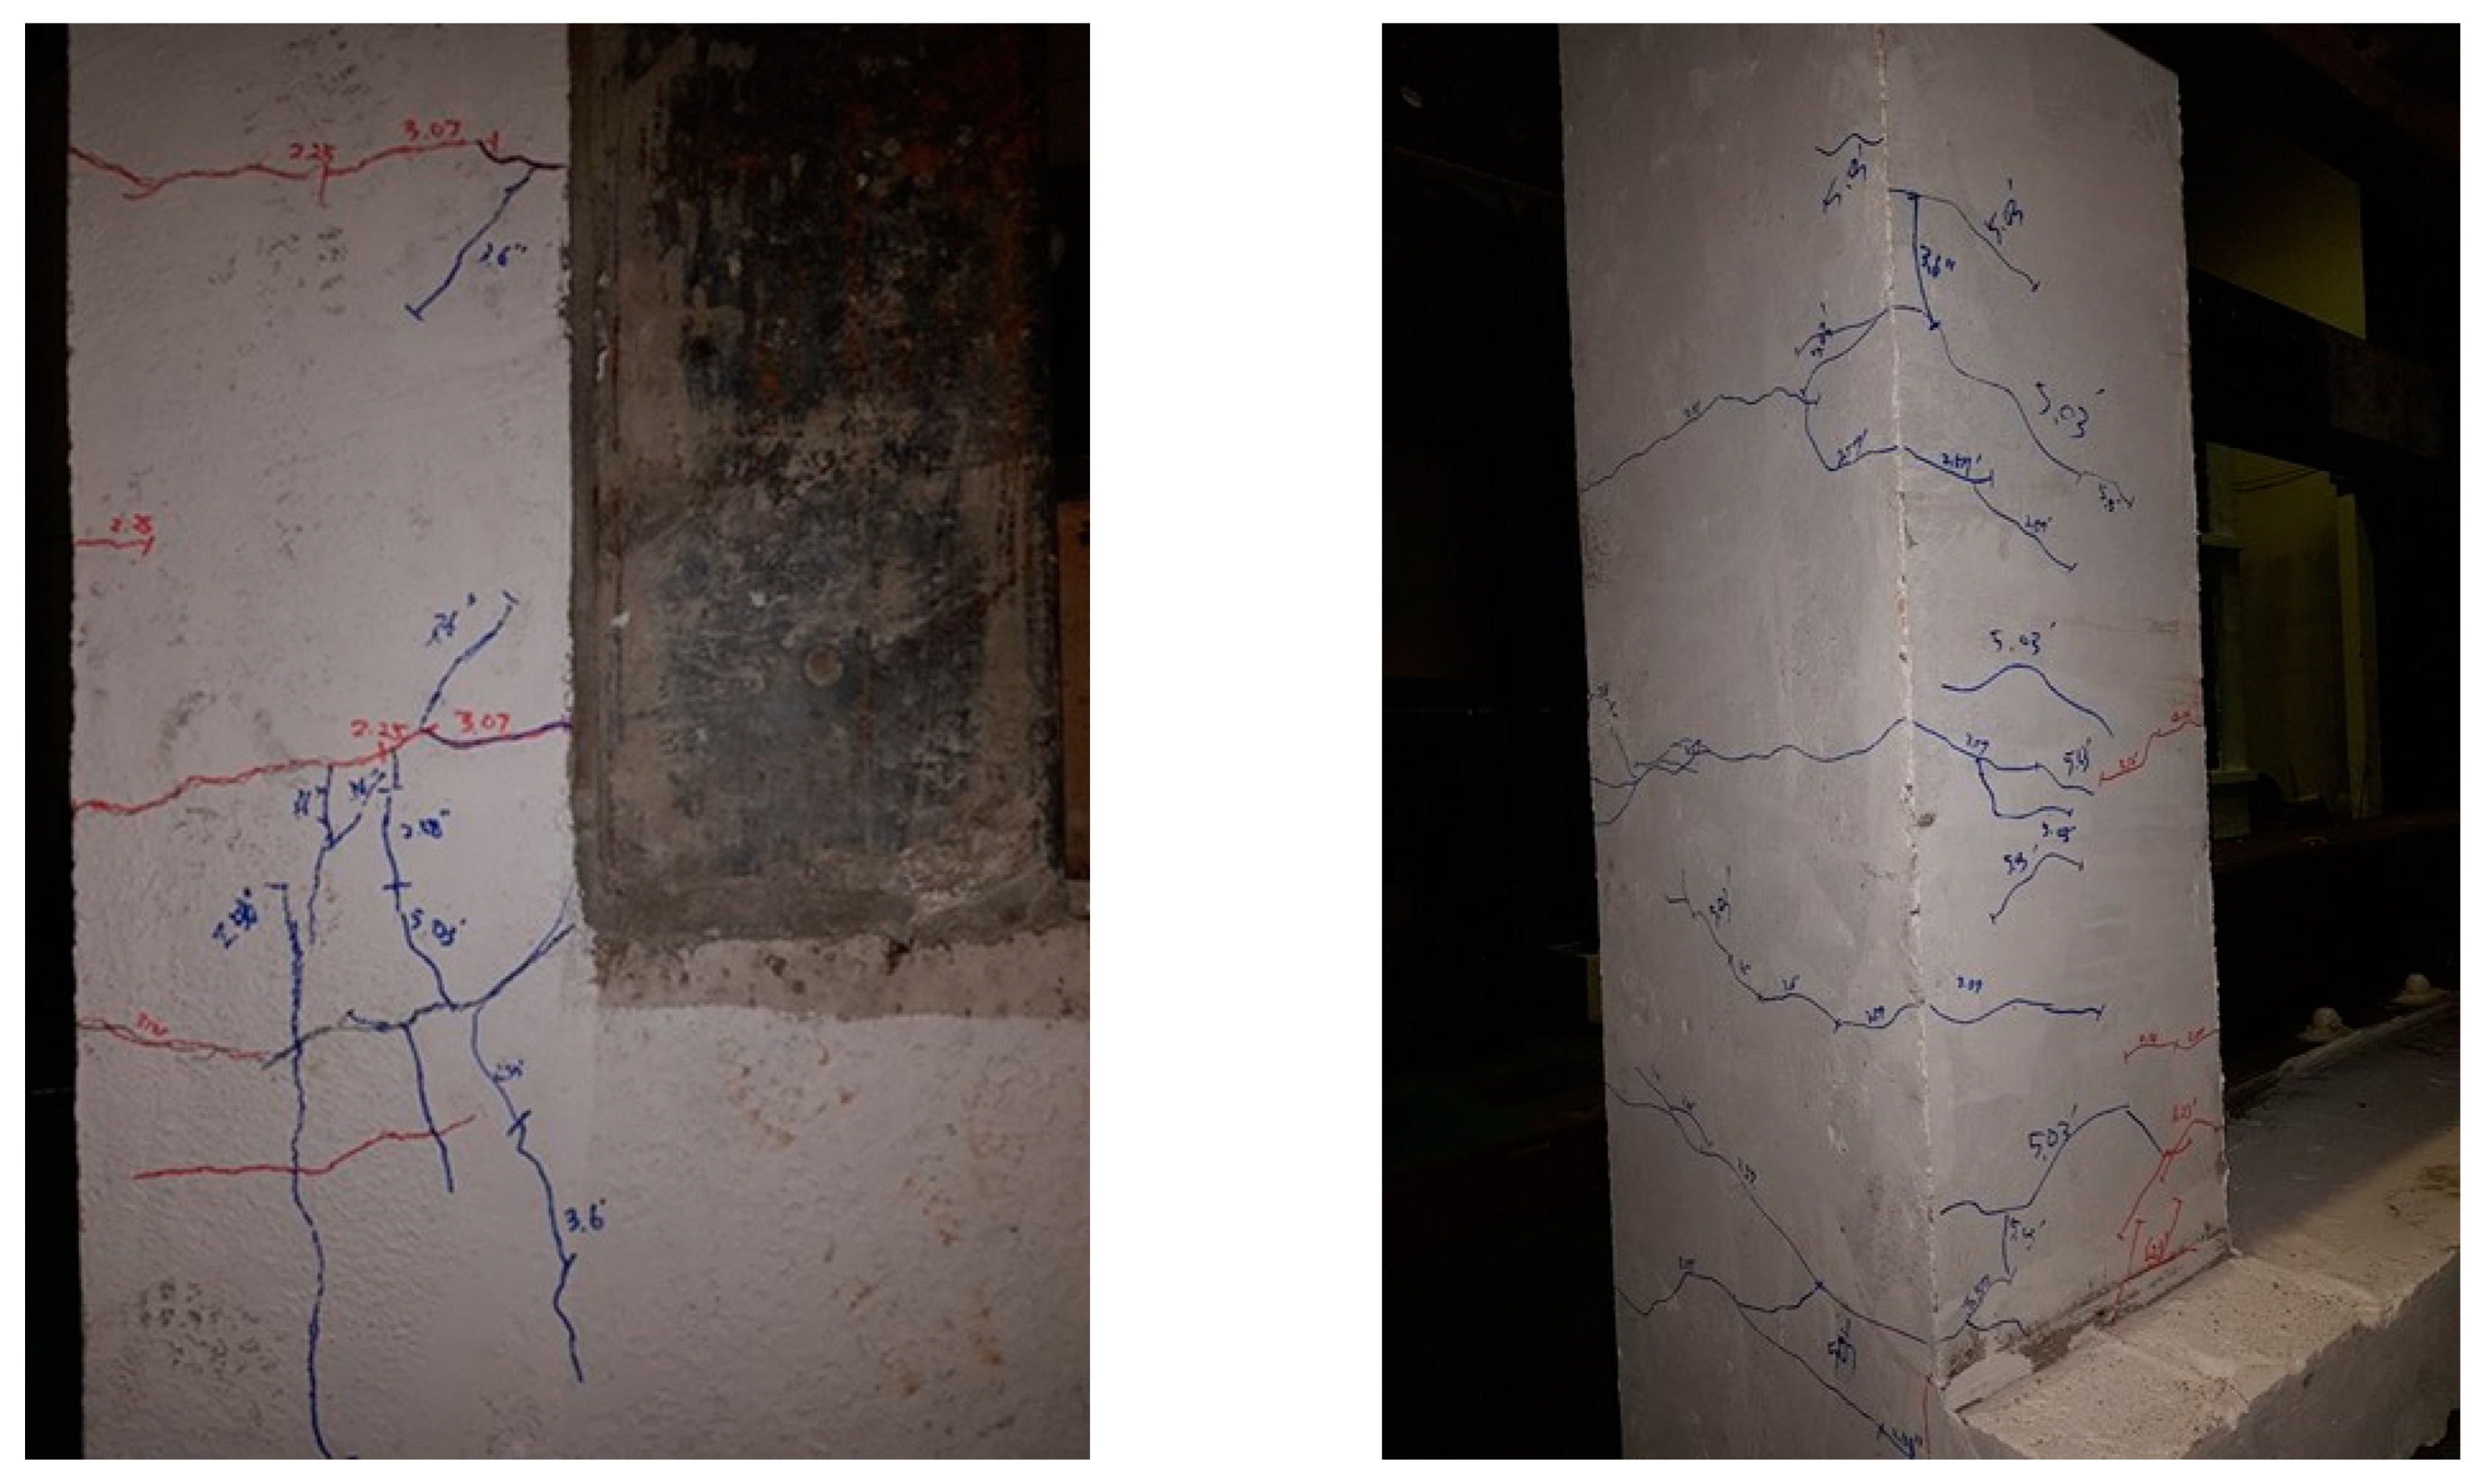
Figure 11.
Test result of the PD-CCSS specimen (200 cm/s2, final).
Meanwhile, under the seismic wave of 300 cm/s2, a small number of flexural cracks were additionally observed at 6.22 s (displacement: 20.0 mm) when the maximum seismic response was observed, as shown in Figure 12. Afterwards, only the size of the cracks slightly increased, but the degree was insignificant. Finally, small cracks occurred unlike the unreinforced PD-FR specimen (shear failure) shown in Figure 10.
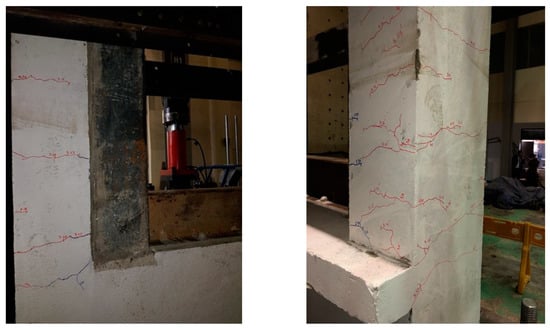
Figure 12.
Test results of the PD-CCSS specimen (300 cm/s2, final).
Figure 13 shows the test results of the final step (10 s) for the input ground motion of 400 cm/s2 assumed to examine the seismic strengthening effect for the CCSS-reinforced specimen in the event of a large earthquake. At 3.6 s (displacement: 35.2 mm), when the maximum displacement response was observed, the degree of flexural and shear cracks was higher than the situation of 300 cm/s2 described above, and the crack width also increased. The size of cracks, however, was suppressed below 1.0 mm, indicating that medium-sized cracks occurred in the PD-CCSS specimen under the ground motion of 400 cm/s2.
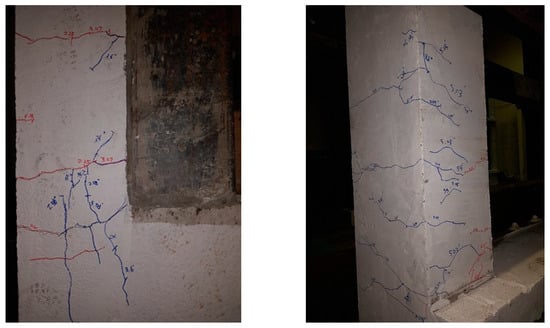
Figure 13.
Test results of the PD-CCSS specimen (400 cm/s2, final).
5.2. Maximum Seismic Response Load and Displacement
Table 4 compares the pseudo-dynamic seismic response maximum load and maximum displacement results with the failure mode and the degree of seismic damage for the control specimen (PD-FR) under the seismic wave of 200 cm/s2 and the PD-CCSS specimen under 200, 300, and 400 cm/s2.
Table 4.
Comparison of the maximum response strength–displacement and degree of earthquake damage.
According to the test results of the unreinforced specimen (PD-FR), the seismic response of a maximum strength of 272.5 kN and a maximum displacement of 70.5 mm was observed under the seismic wave of 200 cm/s2. The degree of seismic damage is expected to be at the collapse level according to the studies by JBDPA [22] and Maeda, Nakano, and Lee [23].
Meanwhile, the PD-CCSS specimen showed a maximum strength of 488.6 kN and a maximum displacement of 10.6 mm under the seismic wave of 200 cm/s2. It exhibited a maximum strength of 708.2 kN and a maximum displacement of 20.4 mm under the seismic wave of 300 cm/s2 and a maximum strength of 864.9 kN and a maximum displacement of 35.2 mm under 400 cm/s2. According to studies by JBDPA [22] and Maeda, Nakano, and Lee [23], the degree of seismic damage to the CCSS-reinforced R/C framework specimens is expected to be light under the input ground motion of 200 cm/s2, small under 300 cm/s2, and moderate under 400 cm/s2, indicating the high seismic strengthening effect of the developed CCSS method.
5.3. Analysis of the Load–Displacement and Displacement–Time History Results
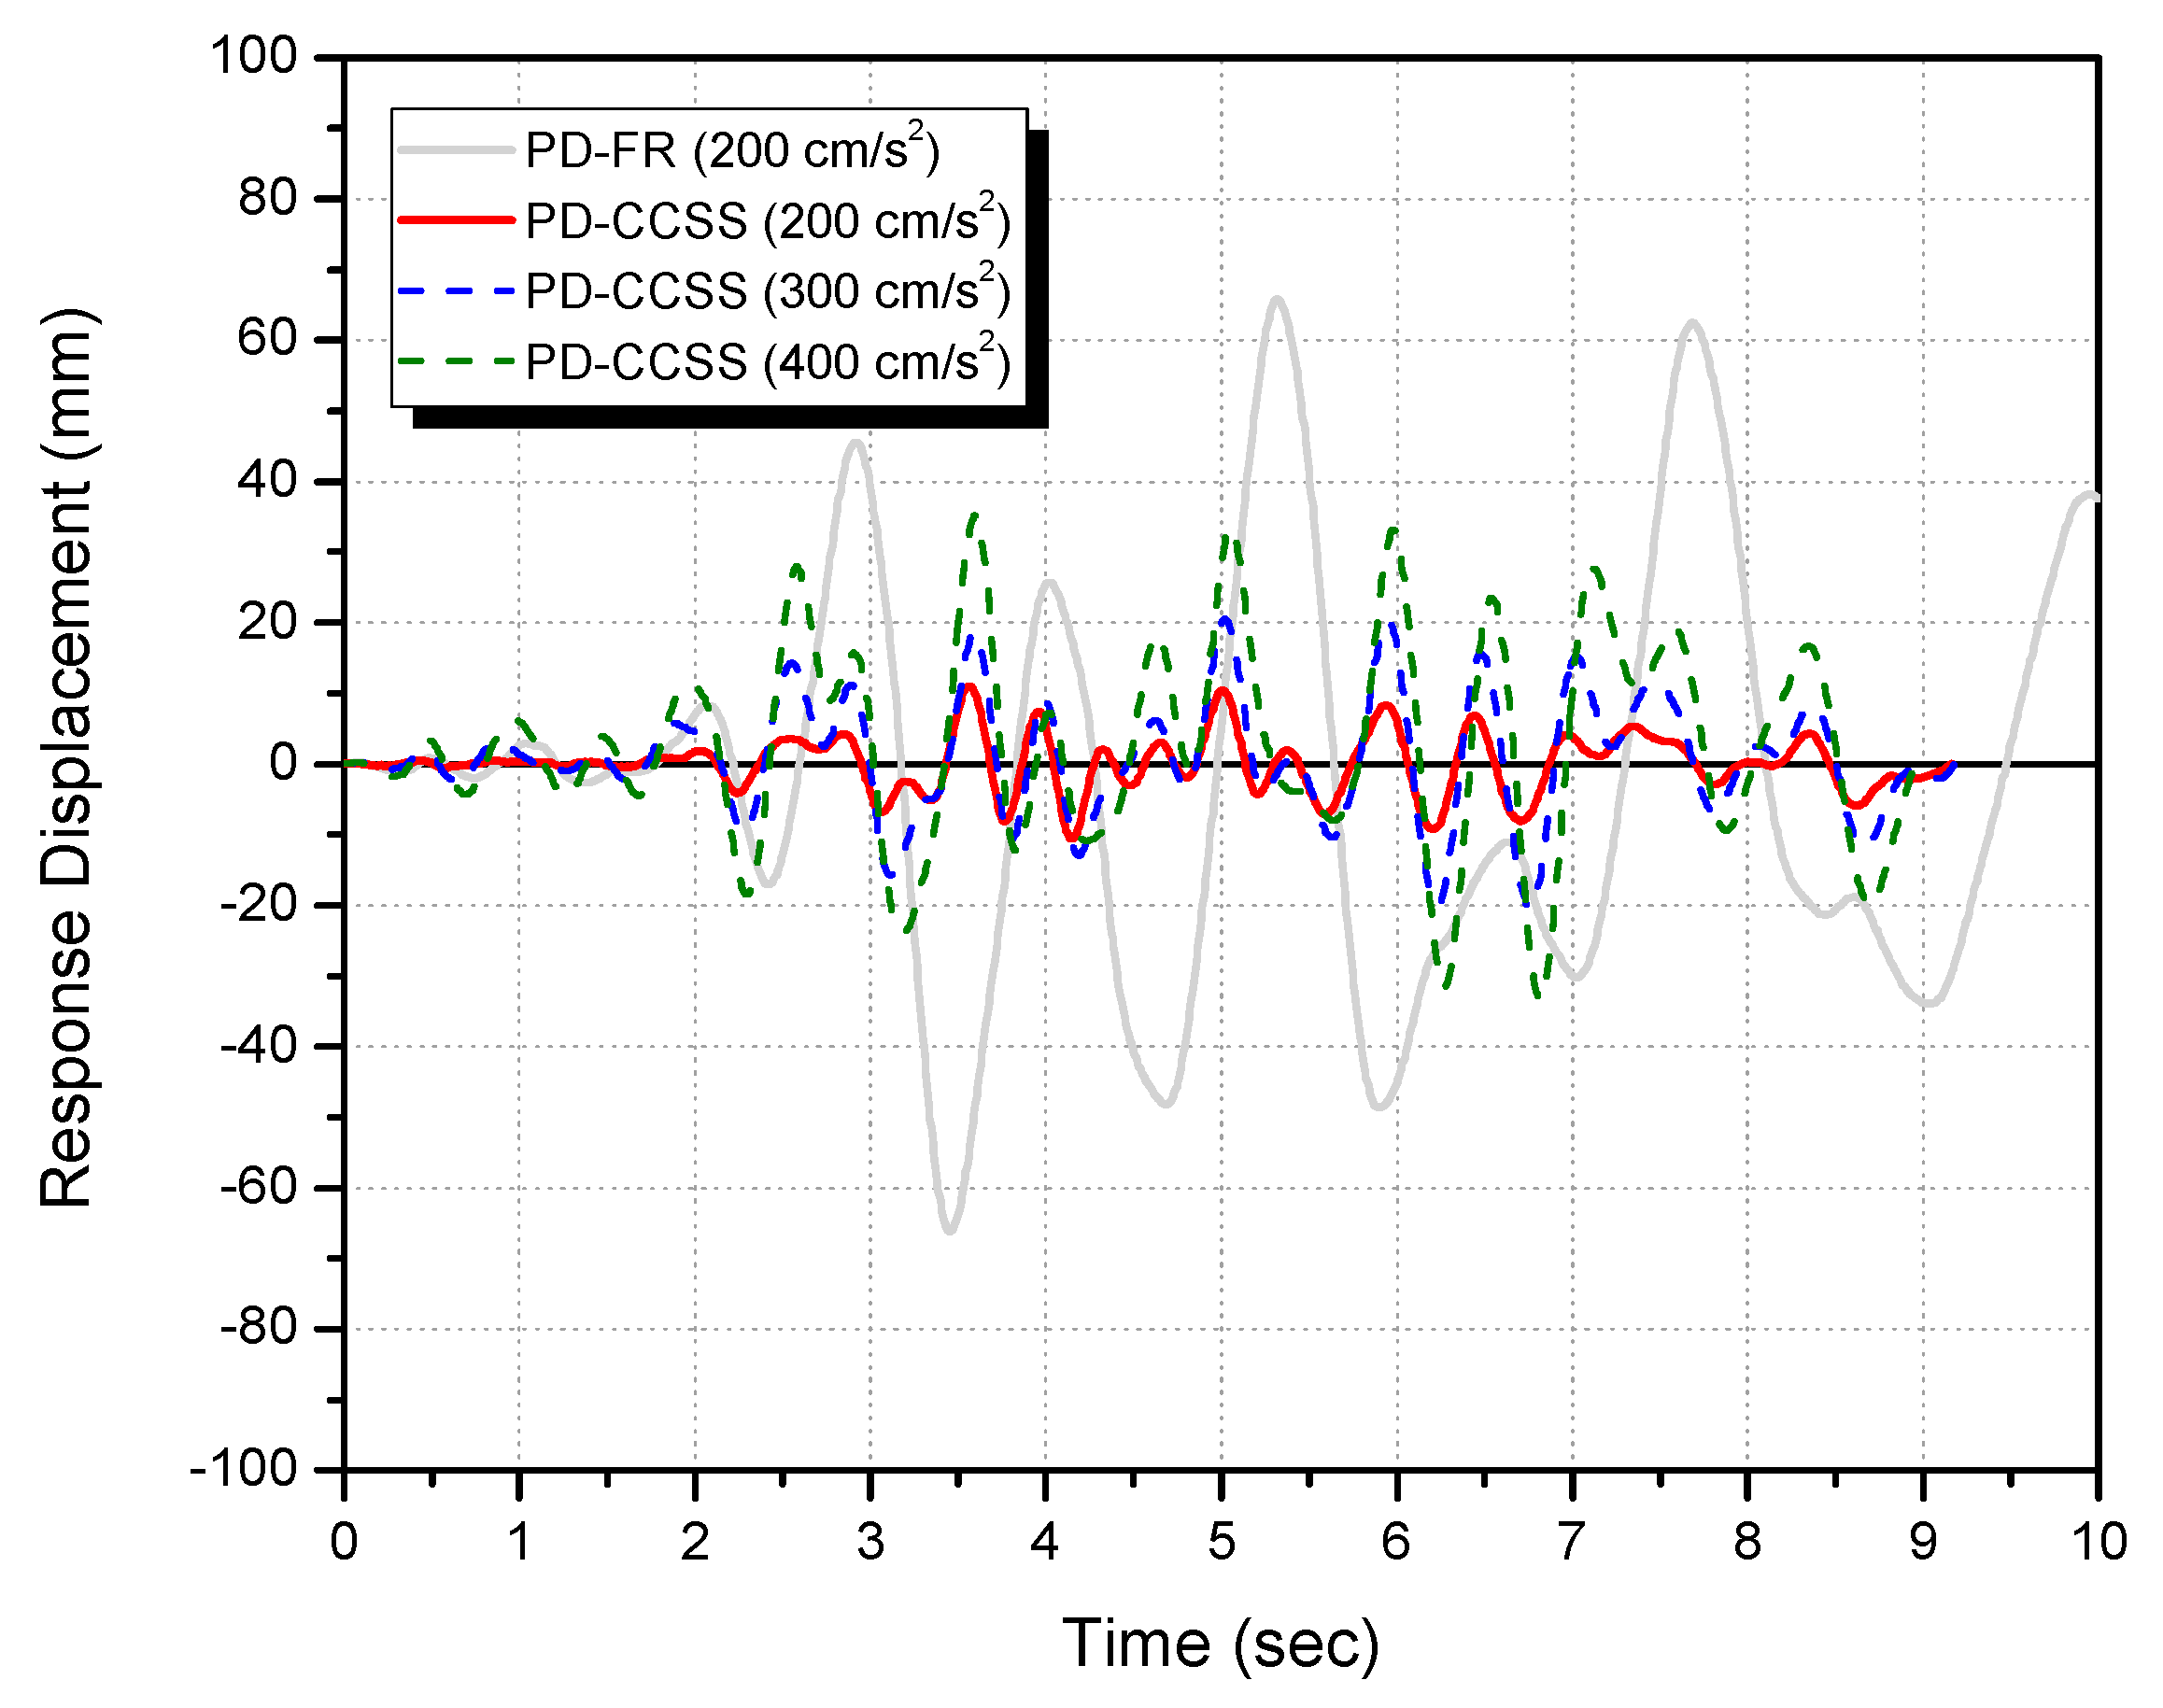
Figure 14 shows the seismic response load–displacement curves for the unreinforced specimen (PD-FR) under the seismic wave of 200 cm/s2 and the CCSS-reinforced specimen under 200, 300, and 400 cm/s2. In addition, Figure 15 shows the seismic response displacement–time history curves for the specimens. In Table 5, among the pseudo-dynamic test results for the specimens, the strength and displacement for the input ground motion, which are key factors for seismic safety assessment, were calculated and listed.
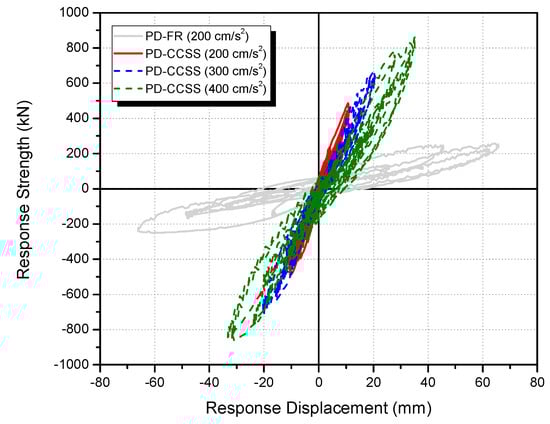
Figure 14.
Comparison of the seismic response strength–displacement curves.
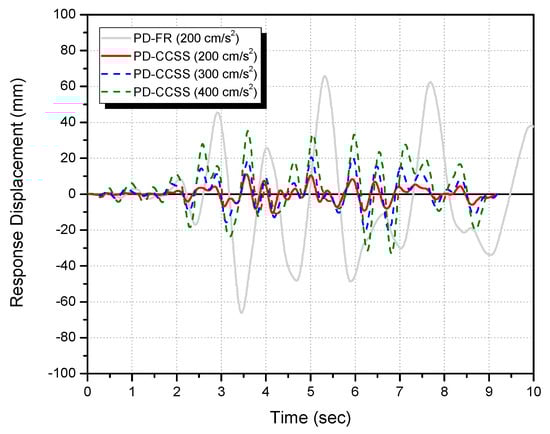
Figure 15.
Comparison of the seismic response displacement–time history curves.
Table 5.
Comparison of the response maximum strength and displacement.
According to the results shown in Figure 14 and Figure 15, and Table 5, compared to the unreinforced specimen (PD-FR) that showed shear failure under the Hachinohe (EW) 200 cm/s2 seismic wave, the maximum strength of the CCSS-reinforced specimen was approximately 1.79 times higher under the seismic wave of 200 cm/s2, 2.6 times higher under 300 cm/s2, and 3.17 times higher under 400 cm/s2. These results are also well reflected in Figure 10 and Figure 13, which show the test results of the final step. The displacement for the seismic waves was suppressed by 0.16 times under 200 cm/s2, 0.29 times under 300 cm/s2, and 0.5 times under 400 cm/s2.
Consequently, compared to the PD-FR specimen with non-seismic features, the seismic response strength of the CCSS-reinforced specimen increased by 1.9 times under the same seismic wave of 200 cm/s2. Furthermore, its maximum seismic response displacement was suppressed by 84%, thereby increasing the seismic energy dissipation capability. This verifies the seismic safety of the developed CCSS method.
6. Comparison of the Pseudo-Dynamic Test and Nonlinear Dynamic Analysis Results
Based on the results of the pseudo-dynamic test conducted on the PD-CCSS specimen described in Section 5, the restoration force characteristics of the beams, columns, and reinforcement (CCSS) for the nonlinear dynamic analysis of the two-story framework specimen reinforced with CCSS were proposed. Nonlinear dynamic analysis was then conducted on the two-story pseudo-dynamic test specimen based on the proposed restoration forces, and the results were compared with the pseudo-dynamic test results.
6.1. Nonlinear Dynamic Analysis Overview
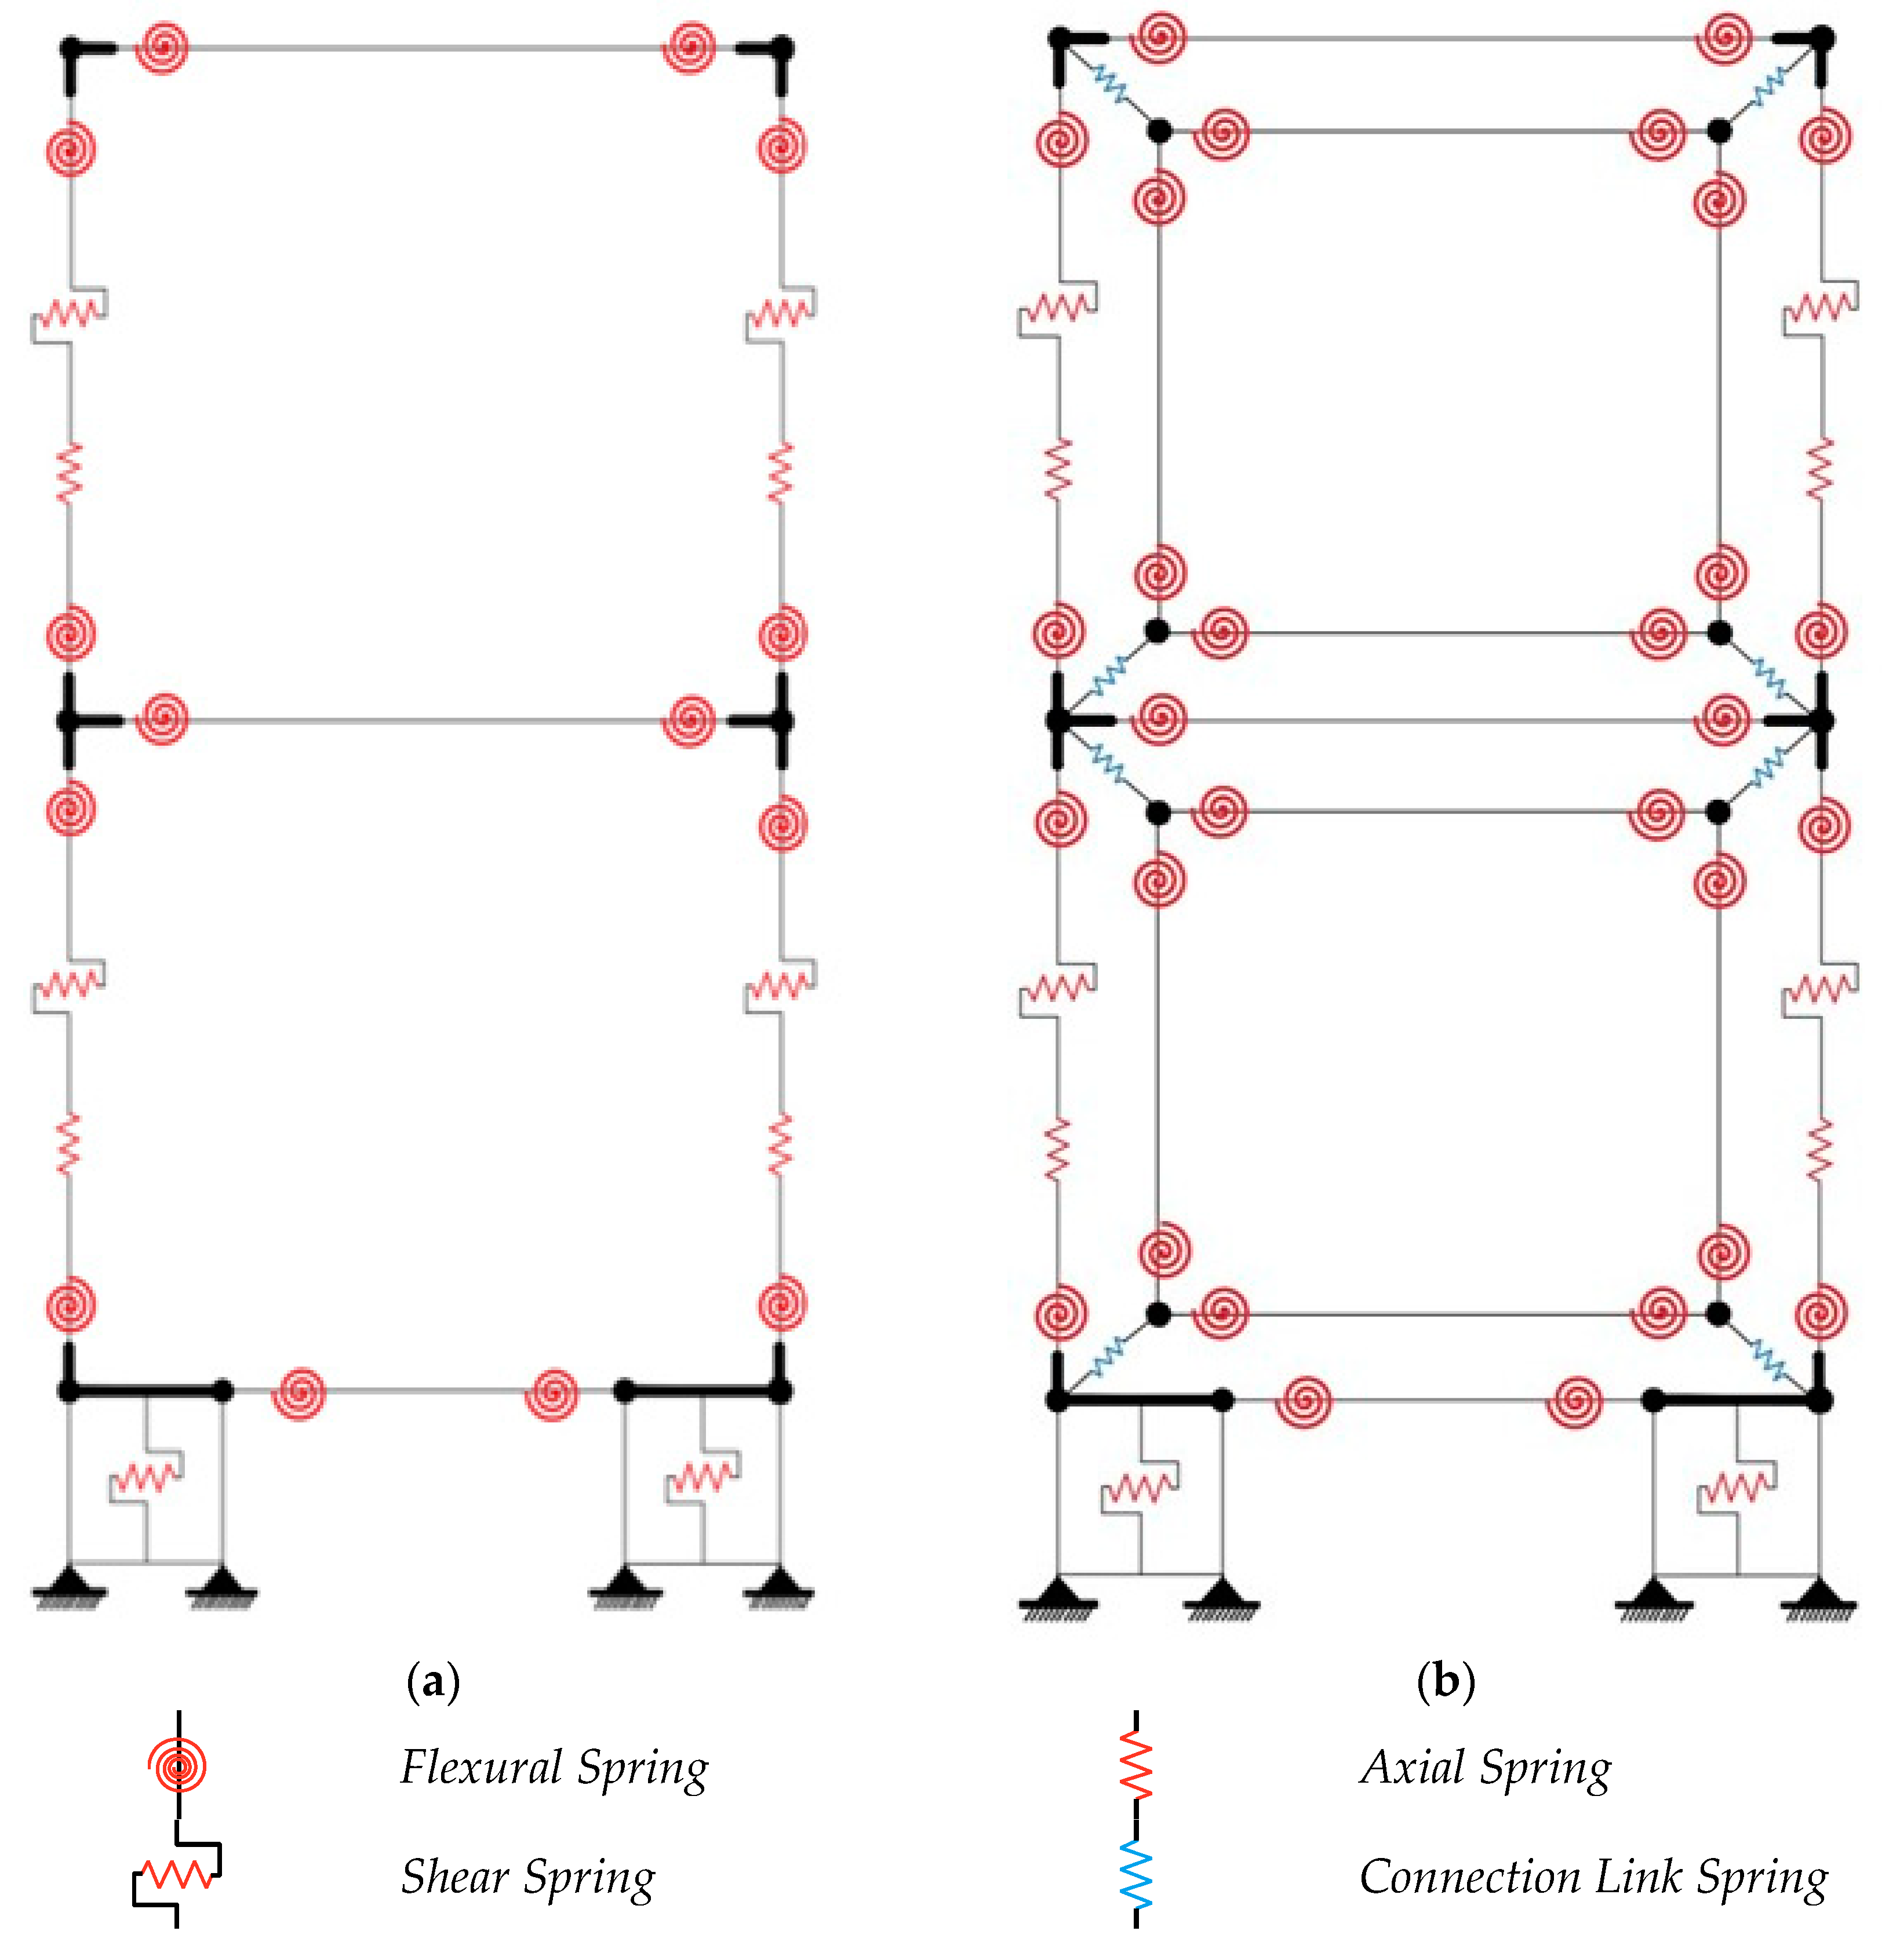
The target specimens of the nonlinear dynamic analysis were the unreinforced two-story R/C framework and the CCSS-reinforced framework shown in Figure 6 and Figure 7 in Section 3.2. Although the actual structures vibrate in three dimensions, they were modeled as plane frames that consider only horizontal seismic forces by replacing the columns, beams, and walls with linear elements. In the structure part, the floor characteristics were evaluated based on the levels of the members, and the assumptions required for analysis are as follows. (1) The location of the yield hinge of each member was determined by referring to the literature [24,25], and the section from the center of each member to the end where the yield hinge occurs is assumed to be rigid. (2) The strength of the beams considers the influence of slab-reinforcing bars within the effective width of the slab, which is the scope of cooperation for beams. In addition, (3) each member is modeled as serially connected flexural, shear, and axial springs, as shown in Figure 16.
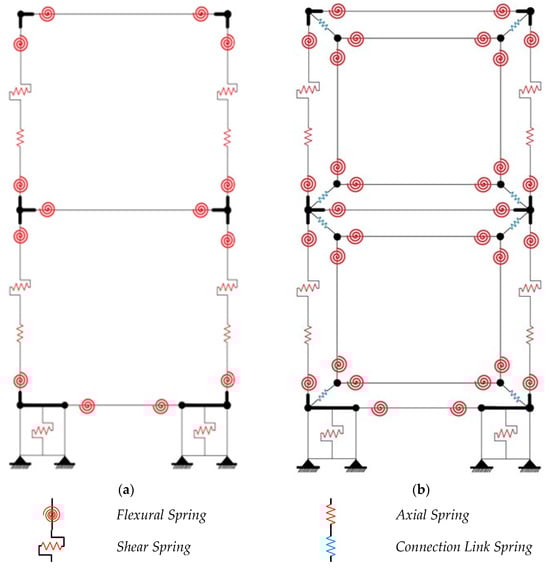
Figure 16.
Nonlinear dynamic analysis model: (a) non-strengthened frame (PD-FR) and (b) CCSS-strengthened frame (PD-CCSS).
The unreinforced framework specimen had ground beams and walls at the foundation, as shown in Figure 16a. It was composed of 12 nodes, including two bottom plates and ground points. Meanwhile, the CCSS-reinforced framework specimen (PD-CCSS) consists of members that connect the CCSS reinforcement to the existing R/C framework, including the nodes of the unreinforced framework specimen, as shown in Figure 16b. It has 20 nodes, including the ground points. Anchor bolts that combine the existing R/C member with the CCSS reinforcement were modeled as link joint elements. For the axial force in the nonlinear dynamic analysis, the axial load applied to the actual existing framework (two columns) used in the pseudo-dynamic test shown in Figure 16, i.e., 1000 kN, was allocated to the upper beam–column joint nodes and a constant axial force of 500 kN was applied. In addition, the additional weight of the R/C framework and CCSS reinforcement was applied to the corresponding nodes.
Nonlinear dynamic analysis was conducted using CANNY (Version C11), a general-purpose software program for three-dimensional nonlinear dynamic analysis that was developed by Li [26]. Table 6 shows the restoration force characteristics of each member used in the nonlinear dynamic analysis. The variables used to determine the restoration forces of each column and beam are listed in Table 6, i.e., the initial flexural stiffness (kB), initial shear stiffness (ks), flexural crack moment (Mc), shear crack strength (Vc), flexural ultimate strength (Mu), and shear ultimate strength (Vu), were determined by the following Equations (5)–(12) based on the research results in JBDPA [3], JBDPA [24], and AIJ [25].
where is the flexural crack moment (N·mm), is the ultimate flexural moment (N·mm), is the initial flexural stiffness (N/mm), is the compressive strength of concrete (N/mm2), and Z is the section modulus (mm3). Additionally, is the shape factor of the beam, is the axial force (N), is the column depth (mm), is the total cross-sectional area of the tensile reinforcing bars (mm2), is the yield strength of the reinforcement bars (N/mm2), and d is the effective depth (mm).
where is the is the shear crack strength (N·mm), is the ultimate shear strength (N), is the initial shear stiffness (N/mm), and is the axial stress in the column (N/mm2). Additionally, is the modification coefficient depending on the cross-section, is the width (mm), is the distance between centroids of tension and compressive force (mm), is the tensile reinforcement ratio (percent), is the shear reinforcement ratio ( = 0.012 for Pw ≥ 0.012), is the yield strength of the shear reinforcing bars (N/mm2), and is the shear span length, with a default value of , where is the clear height of the column (mm).
Table 6.
Restoration force characteristics of each member used in the non-linear dynamic analysis.
Meanwhile, the restoration force characteristics of the shear-failure-type column with non-seismic features (shear spring of column, OO3 in Table 6) were determined using Equation (13), which was proposed based on the structural testing of columns with non-seismic features [12].
where is the ultimate strength at the time of shear failure, is the strength at the time of shear cracking, the displacement at the time of shear failure, and is the displacement at the time of shear cracking.
6.2. Comparison of the Nonlinear Dynamic Analysis and Pseudo-Dynamic Test Results
Nonlinear dynamic analysis was conducted using CANNY based on the restoration force models (Table 6) described in Section 6.1 using Hachinohe (EW) seismic waves of 200 and 300 cm/s2, which were used in the pseudo-dynamic test. As mentioned previously, 200 cm/s2 was applied to the unreinforced specimen in the pseudo-dynamic test, while 200 and 300 cm/s2 were applied to the CCSS-reinforced specimen.
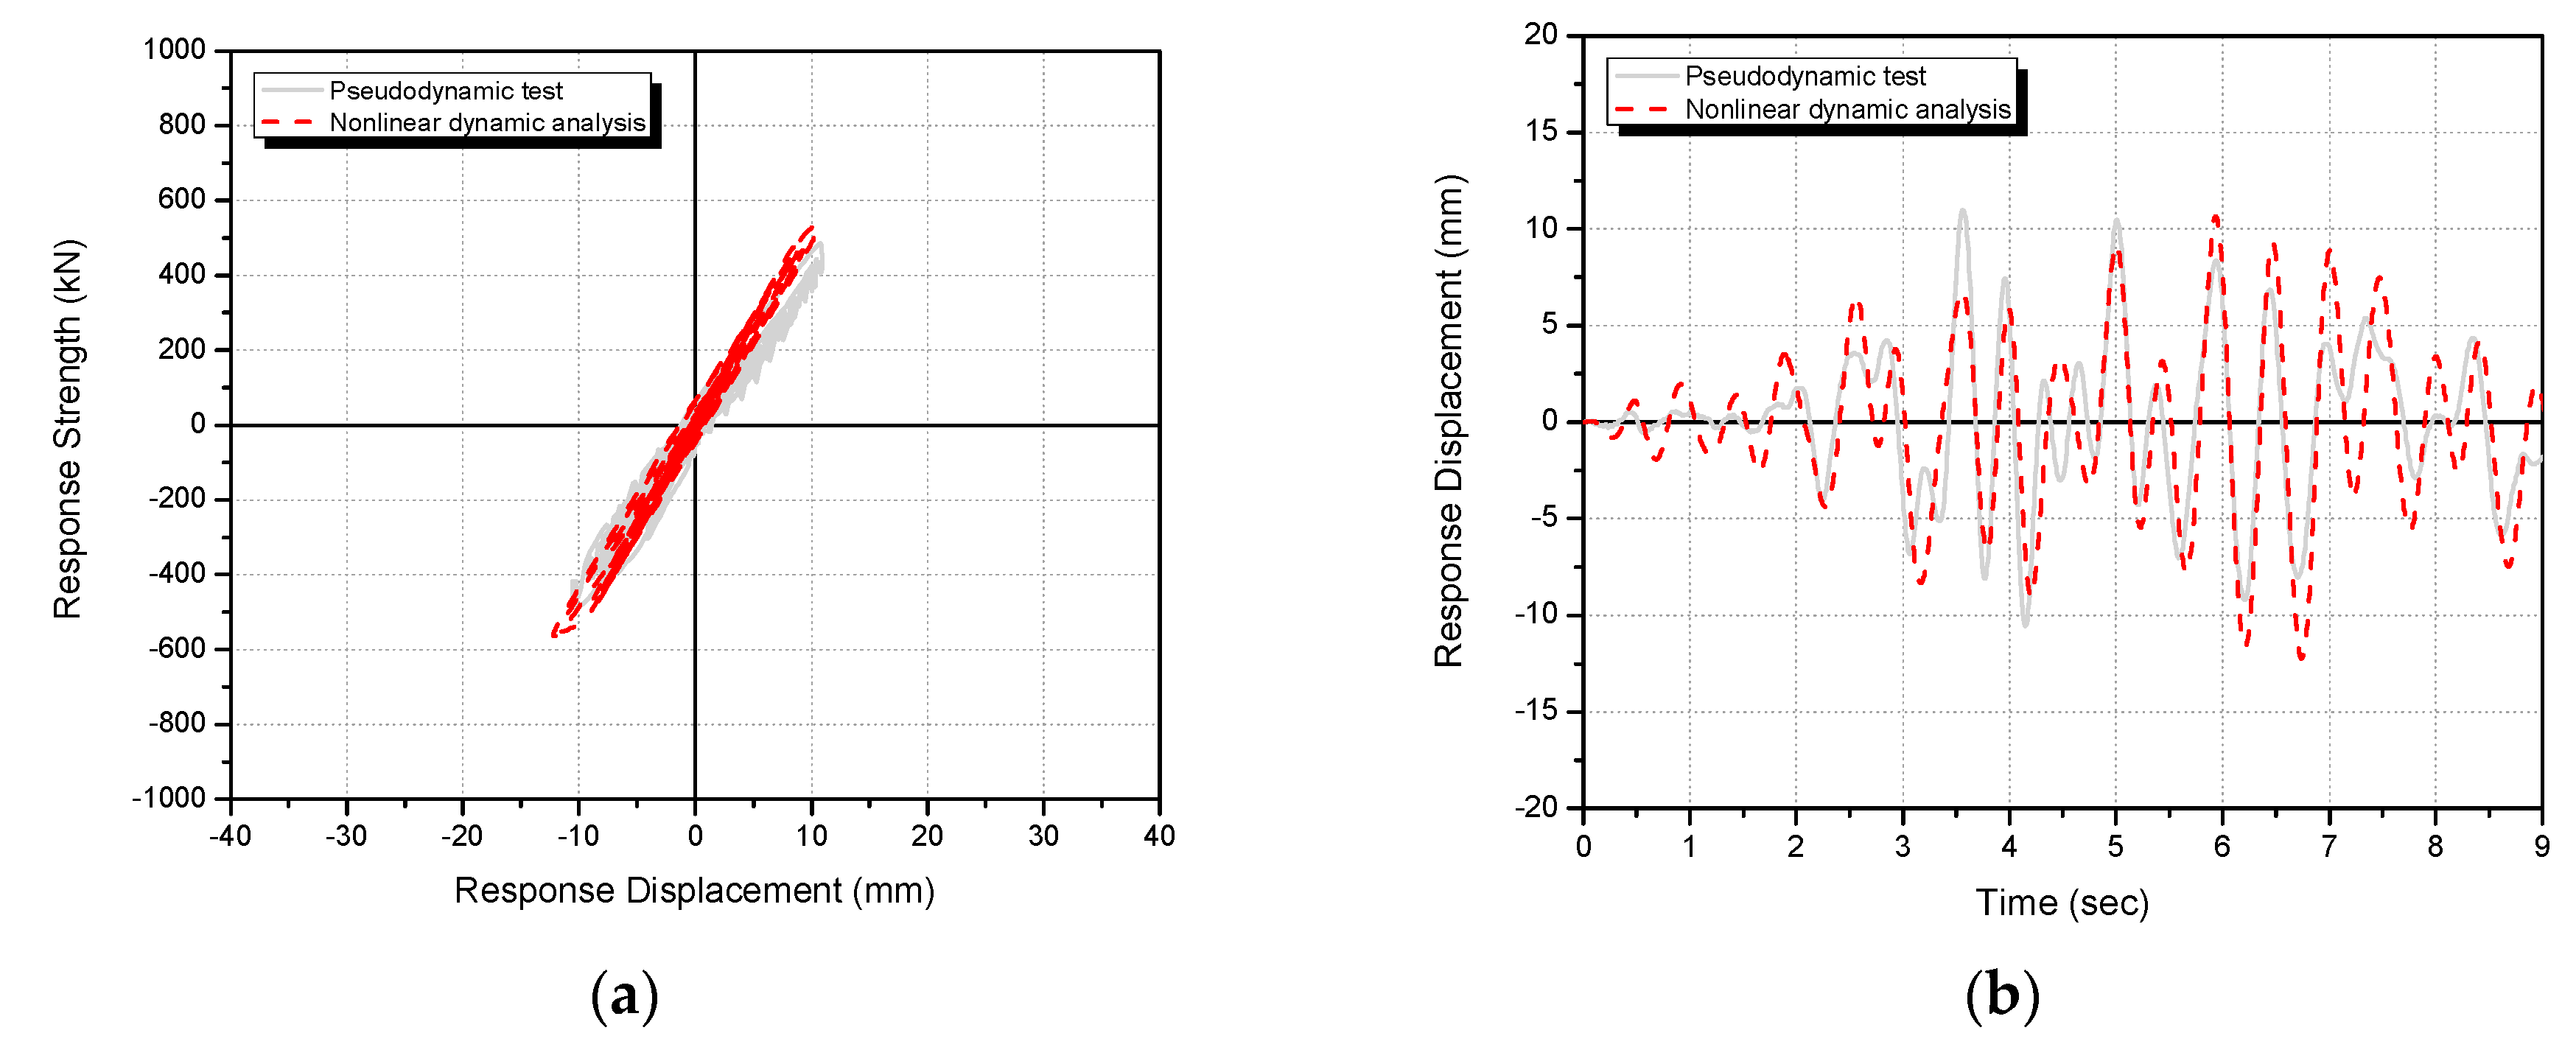
Figure 17 shows the seismic response load–displacement and time–displacement history curves on the first floor from the nonlinear dynamic analysis and pseudo-dynamic test of the unreinforced specimen under 200 cm/s2. Figure 18 and Figure 19 show the seismic response load–displacement and time–displacement history curves from the nonlinear dynamic analysis and pseudo dynamic test of the first-floor framework of the CCSS-reinforced specimen under input ground motions of 200 and 300 cm/s2. In addition, Table 7 compares the maximum response load–displacement relationships by nonlinear dynamic analysis and the pseudo-dynamic test.
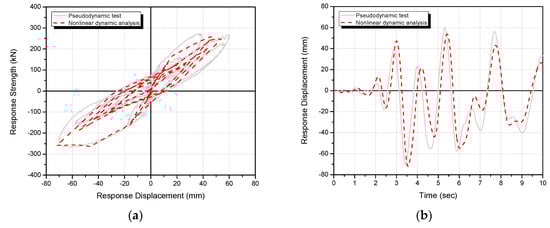
Figure 17.
Comparison of the nonlinear dynamic analysis and pseudo-dynamic test results of the R/C frame with non-reinforcement (PD-FR) (first floor, 200 cm/s2): (a) load–displacement curves and (b) time–displacement history curves.
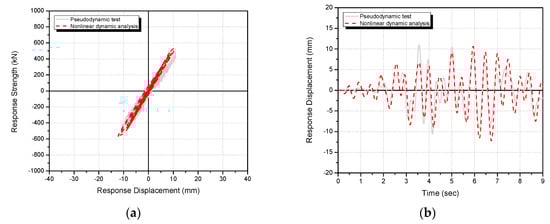
Figure 18.
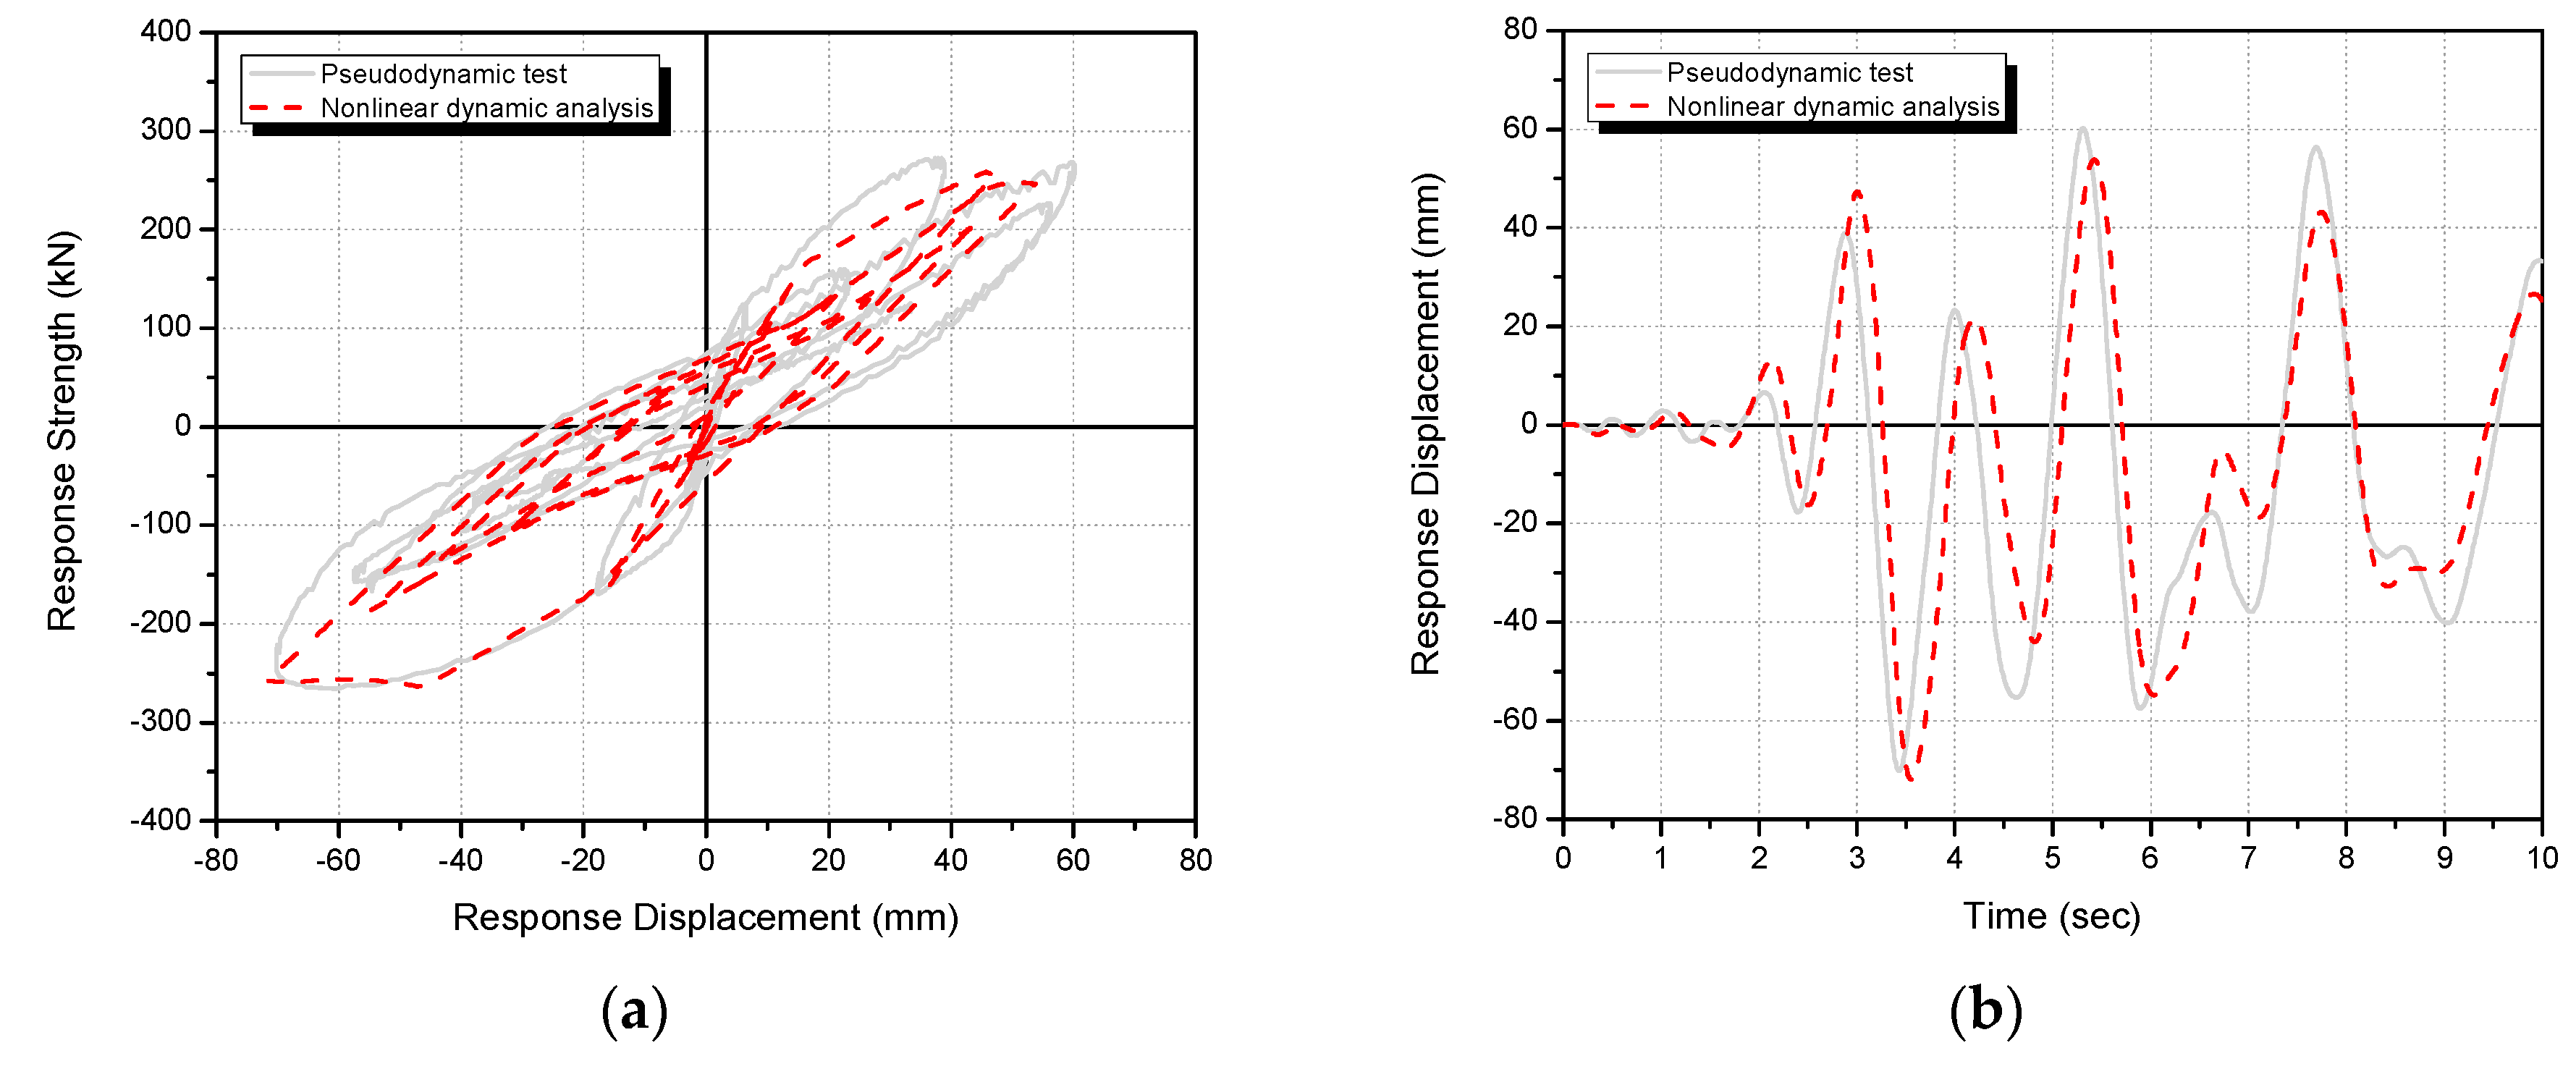
Comparison of the nonlinear dynamic analysis and pseudo-dynamic test results of R/C frame retrofitted with the CCSS system (PD-CCSS) (first floor, 200 cm/s2): (a) load–displacement curves and (b) time–displacement history curves.
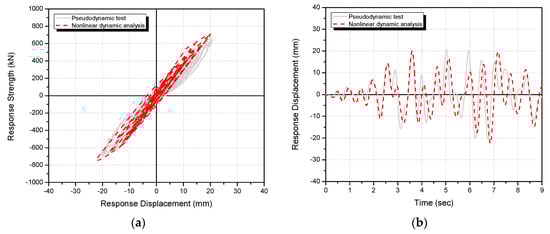
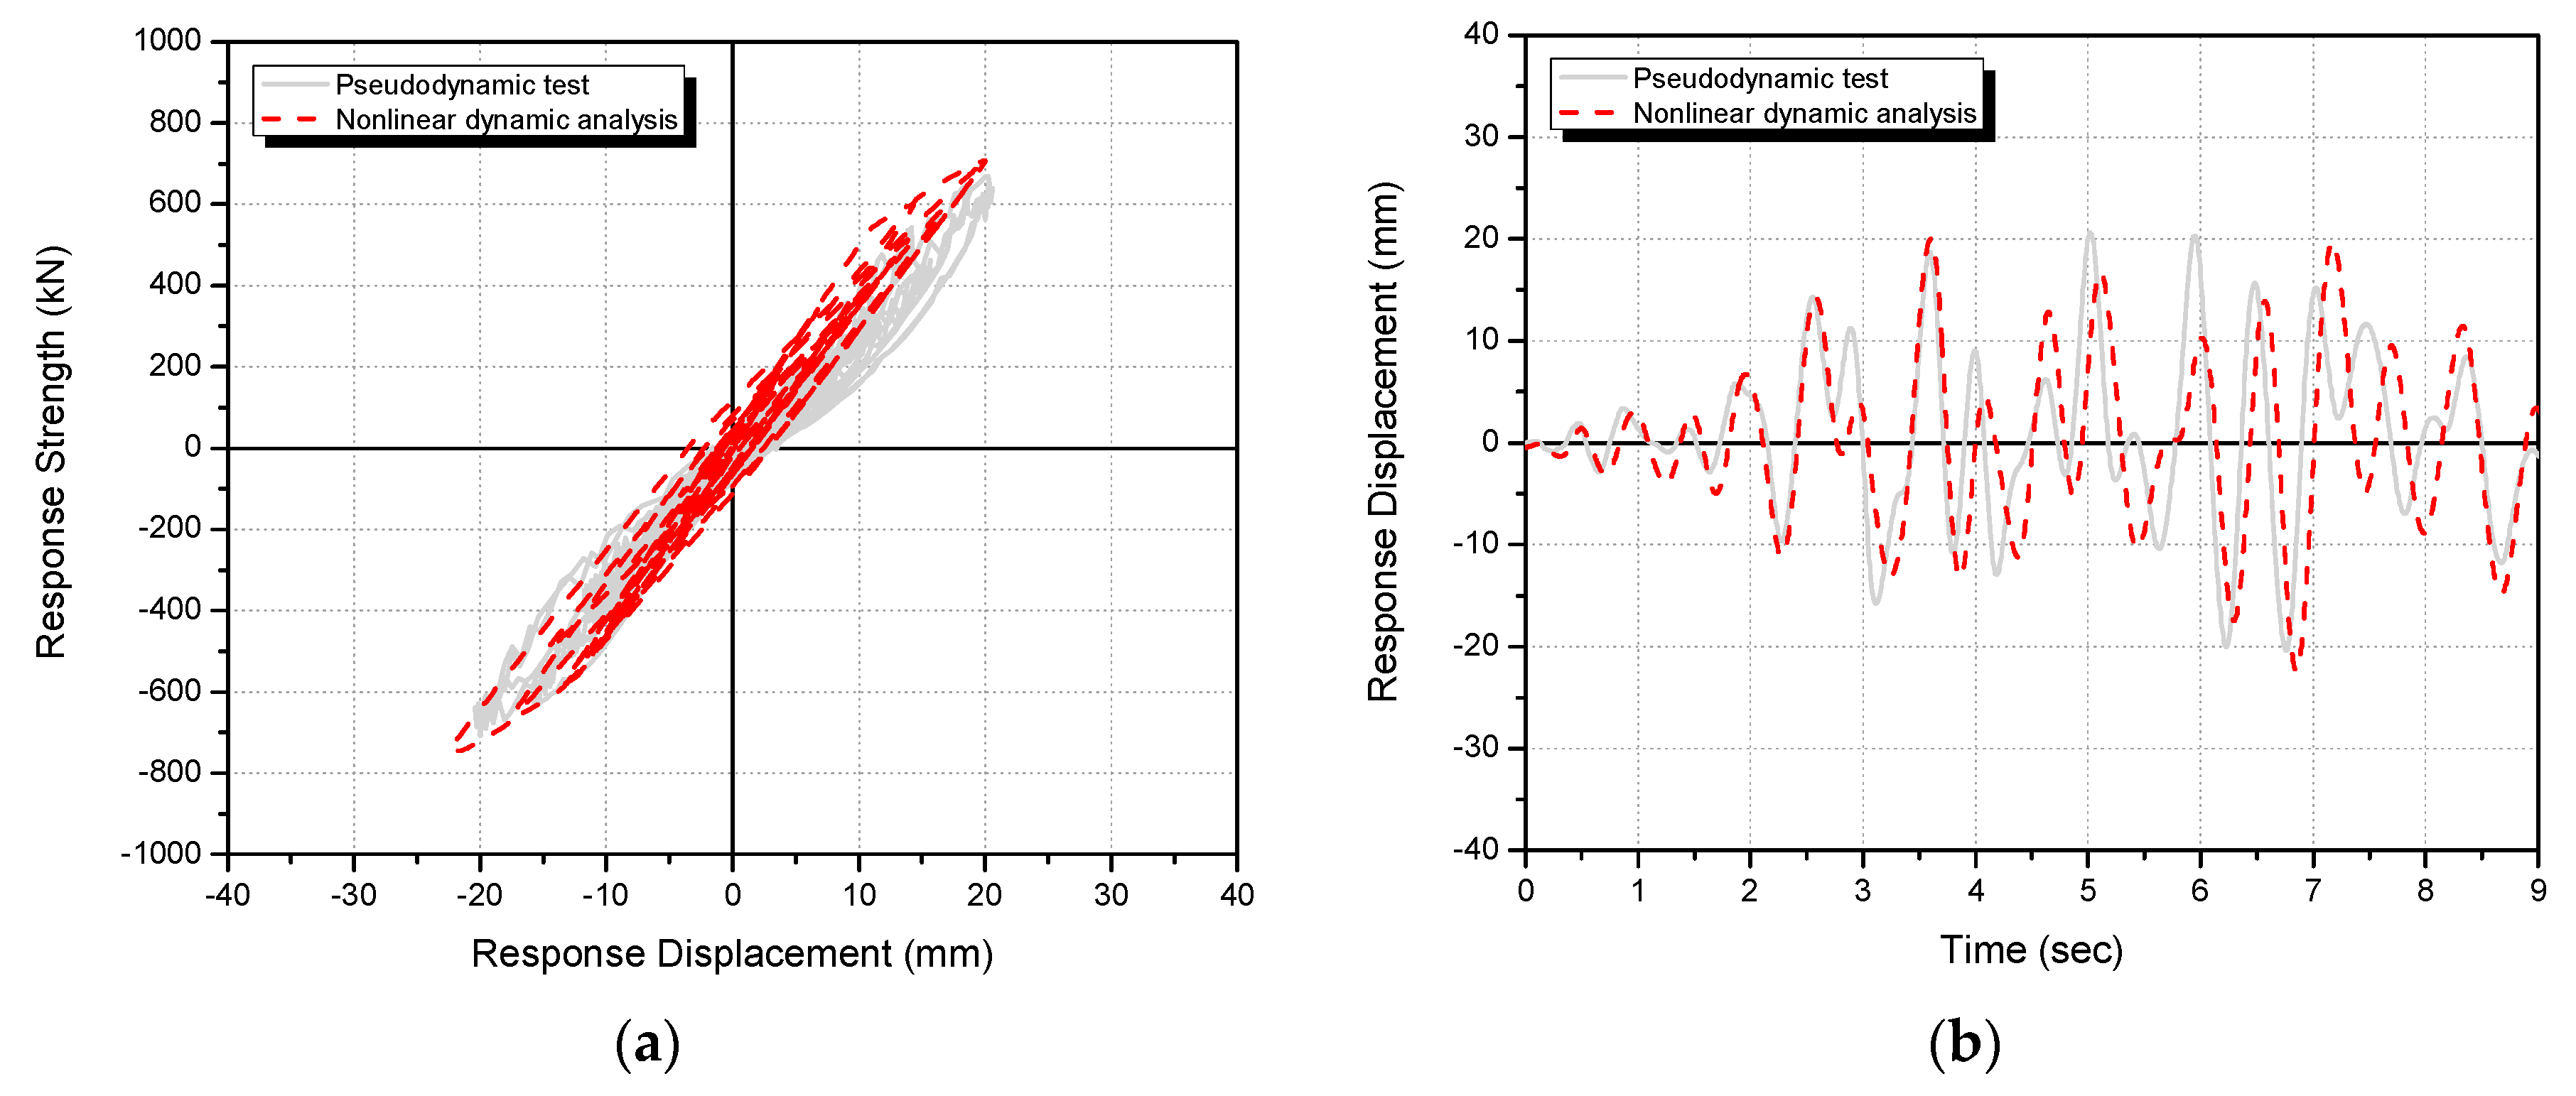
Figure 19.
Comparison of the nonlinear dynamic analysis and pseudo-dynamic test results of R/C frame retrofitted with CCSS system (PD-CCSS) (first floor, 300 cm/s2): (a) load–displacement curves and (b) time–displacement history curves.
Table 7.
Comparison of the maximum response load–displacement relationships between the nonlinear dynamic analysis and pseudo-dynamic test results.
Under an input seismic acceleration of 200 cm/s2, the maximum seismic response load and displacement of the unreinforced specimen (PD-FR) were 263.1 kN and 71.9 mm in the nonlinear dynamic analysis and 272.5 kN and 70.5 mm in the pseudo-dynamic test (Figure 17 and Table 7). Under 200 cm/s2, the maximum seismic response load and displacement of the CCSS-reinforced specimen (PD-CCSS) were 562.9 kN and 12.2 mm in the nonlinear dynamic analysis and 488.6 kN and 11.0 mm in the pseudo-dynamic test (Figure 18 and Table 7). For the ground motion of 200 cm/s2, the nonlinear dynamic analysis and pseudo-dynamic test results were similar as the average difference was approximately 10%. Under the input ground motion of 300 cm/s2, the maximum seismic response load and displacement of the CCSS-reinforced specimen (PD-CCSS) were 748.1 kN and 22.4 mm in the nonlinear dynamic analysis and 708.2 kN and 20.6 mm in the pseudo-dynamic test (Figure 19 and Table 7). Meanwhile, the anchor bolt that combines the existing R/C member and CCSS reinforcement, which was assumed to be a bilinear elastic model in Table 6, showed elastic behavior under all ground motions.
These analysis results show that the nonlinear analysis model and method constructed in this study can simulate the CCSS method and the seismic behavior of the R/C framework reinforced with the method well. Based on the analysis model and method constructed as described in Section 6.1, it is judged that the seismic strengthening effect of the developed CCSS method can be effectively evaluated using nonlinear dynamic analysis.
7. Evaluation of the Seismic Strengthening Design Method and Seismic Performance of the R/C Building Reinforced Using the CCSS Method
7.1. Overview of the Nonlinear Dynamic Analysis
It was found that the nonlinear analysis model and method described in Section 6 can efficiently simulate the seismic performance of the R/C framework reinforced with CCSS. For the commercialization of CCSS, based on the nonlinear analysis model and method presented in Section 6.1, the R/C building with non-seismic features reinforced with CCSS (see Figure 5) was subjected to nonlinear dynamic analysis. The seismic response load and displacement characteristics of the building before and after seismic strengthening were then evaluated, and the seismic strengthening effect was finally verified by examining the degree of damage to the existing member.
As outlined in Section 6, nonlinear dynamic analysis was conducted using CANNY [26]. The analysis was conducted by setting the Hachinohe (EW) to 200 cm/s2, which is the required level for the seismic design of the target building and led to the collapse of the unreinforced framework. Figure 20 shows the modeling of the R/C building before and after strengthening. The seismic reinforcement volume required for the application of CCSS was calculated using Equations (14) and (15). Equations (14) and (15) are used to calculate the required seismic reinforcement volume () for the target performance (), which is then compared to the seismic performance of the R/C building with non-seismic features before seismic strengthening (). The target performance () is the level of performance that leads to less-than-moderate seismic damage (life safety) on the empirical basis under a seismic acceleration of approximately 200 cm/s2. The above equations are proposed based on the seismic performance assessment method [24] and seismic strengthening method [3], which were developed based on Newmark’s equal energy criterion [27,28].
where is the required seismic reinforcement volume for the building (required strength), is the total number of floors in the building, : is the corresponding floor, is the targeted basic seismic capacity index after seismic strengthening, is the basic seismic capacity index of the building before seismic strengthening, is the building weight, is the coefficient for calculating the ductility index of the existing R/C structure (), where is the ductility ratio of the existing building, and is the yield strength of the existing structure expressed in the form of the shear force coefficient ().
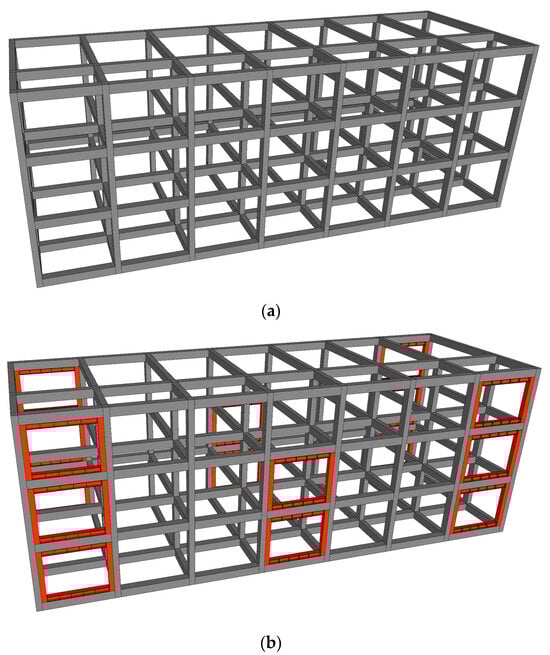
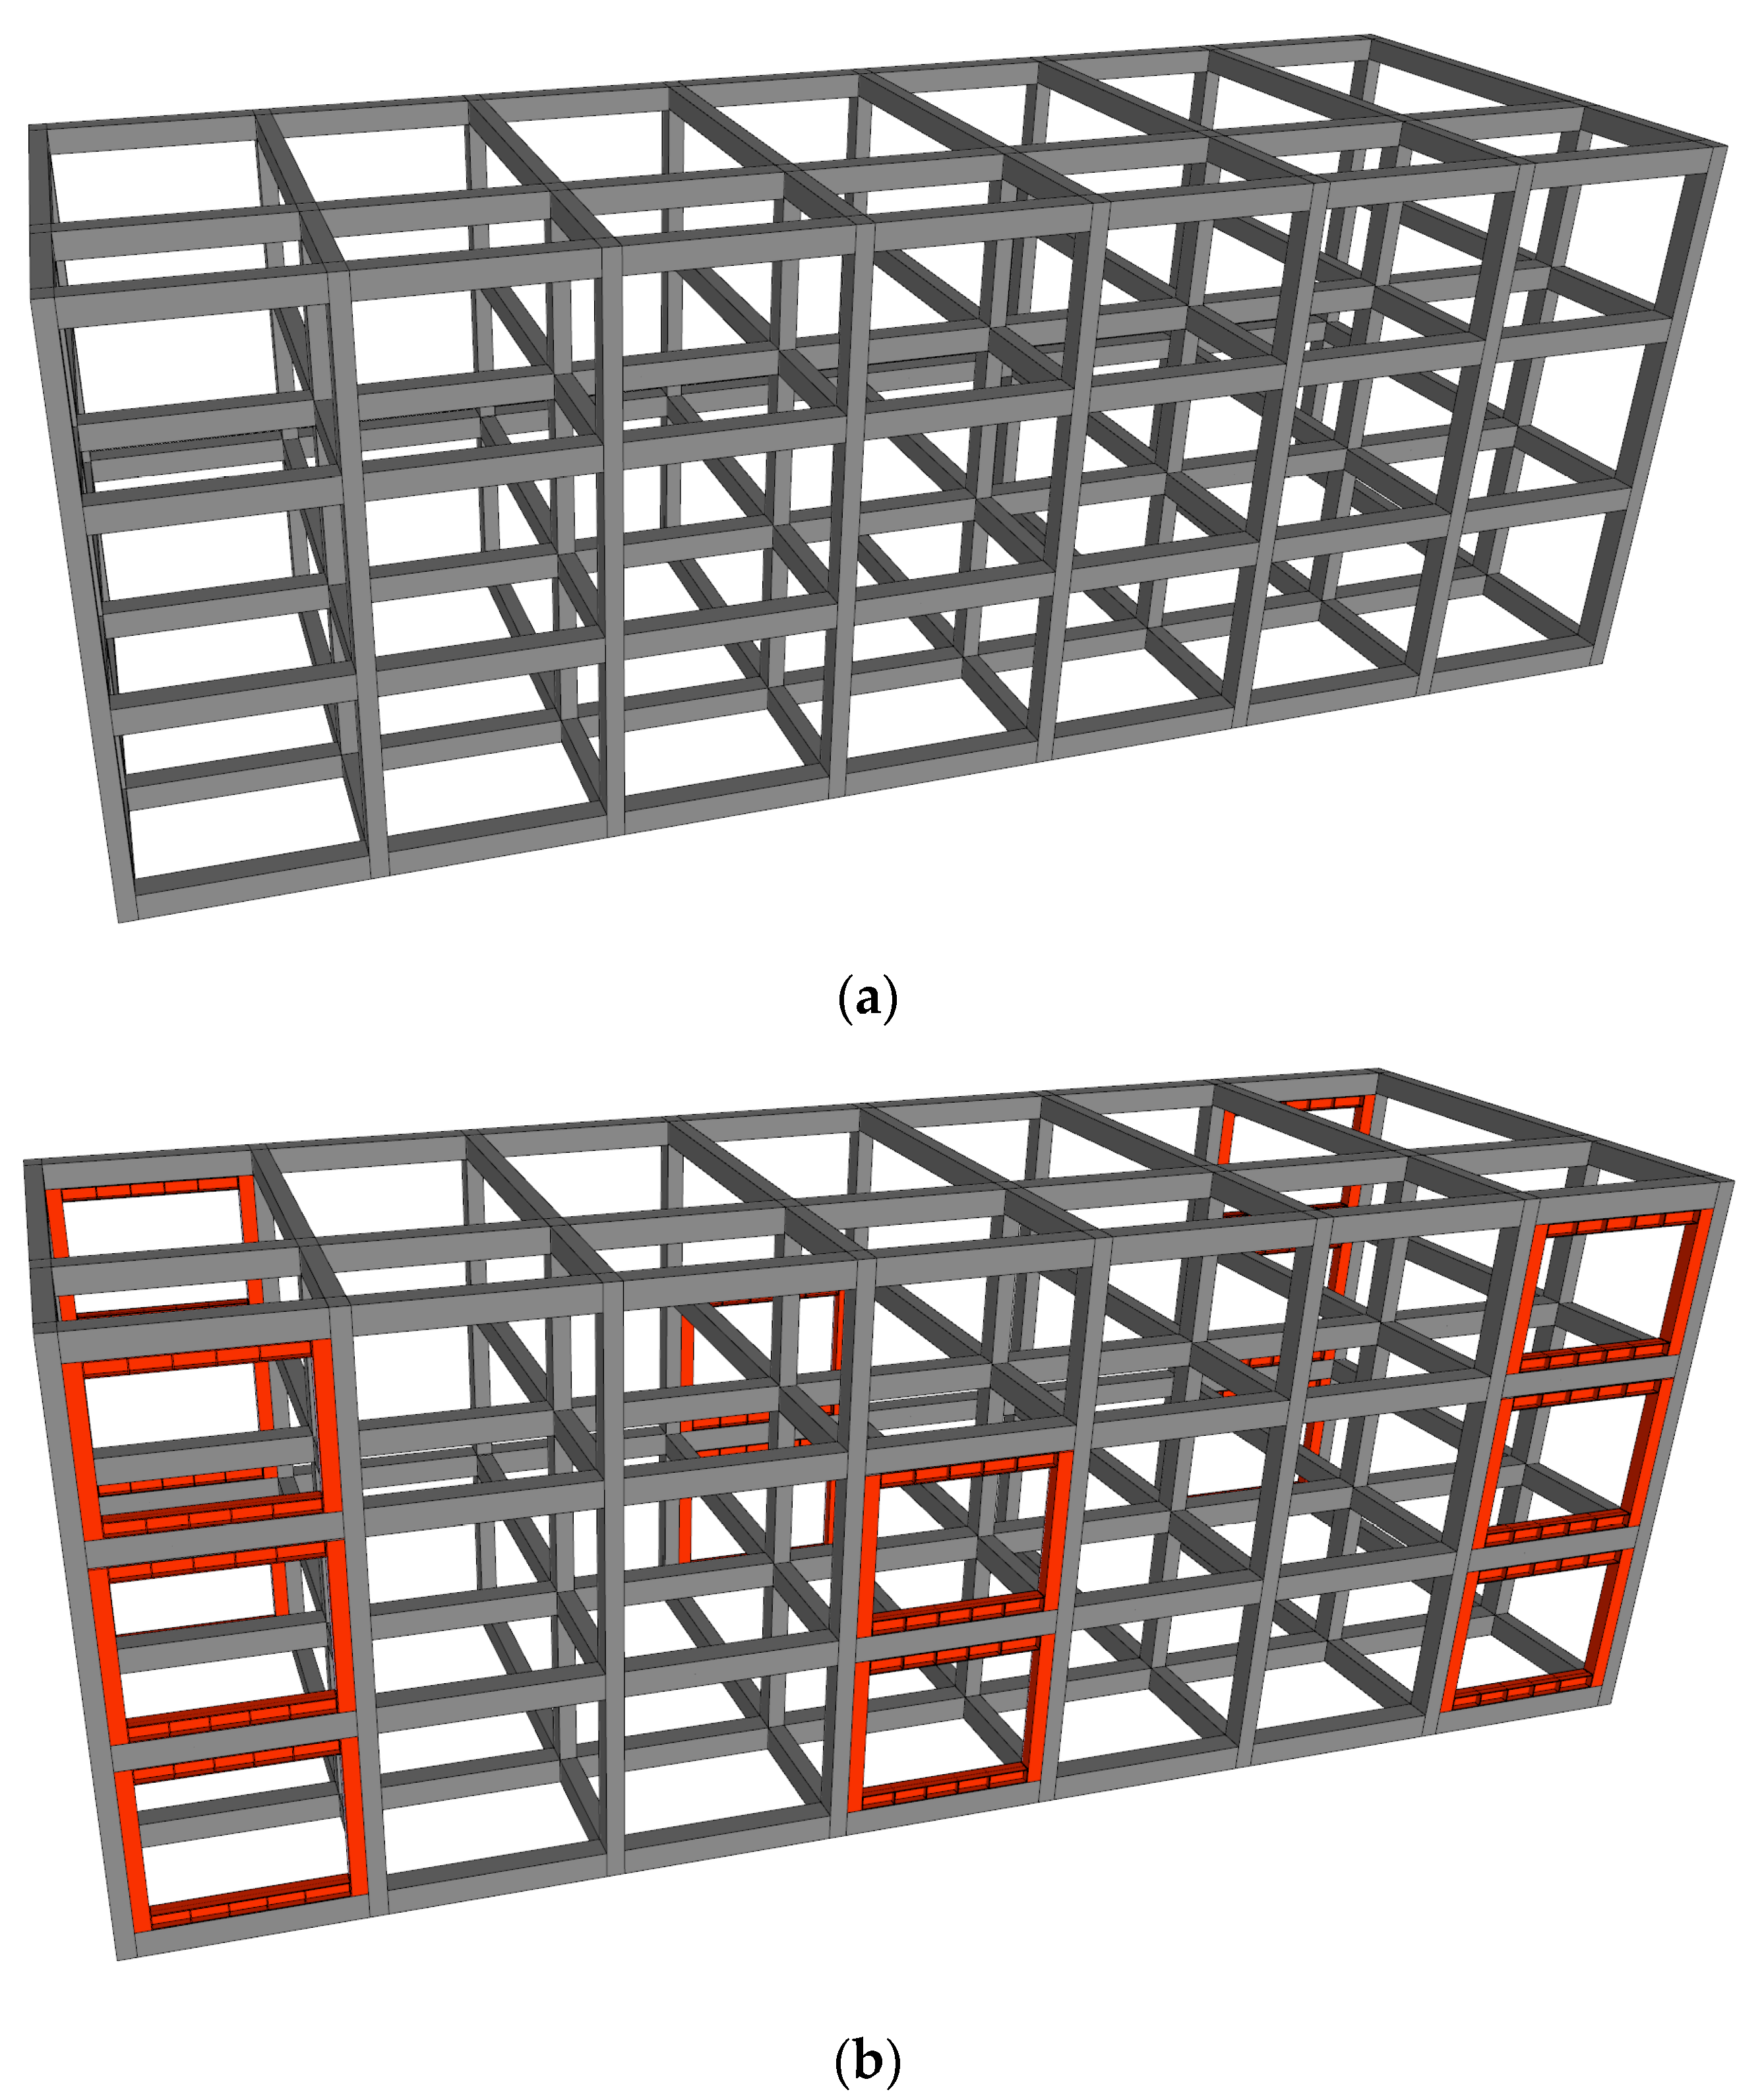
Figure 20.
Modeling of the R/C building before and after seismic strengthening: (a) before seismic strengthening and (b) after seismic strengthening (CCSS system).
In this study, the target seismic performance after seismic strengthening () was set based on Equation (16), which was proposed by [29] in their research on the correlations between various seismic acceleration levels and the basic seismic capacity index for existing R/C buildings. The target performance () is the level of performance that leads to less-than-moderate seismic damage (life safety) under a seismic acceleration, as previously mentioned, of approximately
where α is the level of input ground motion divided by gravitational acceleration (g).
Meanwhile, nonlinear static analysis was conducted to calculate the basic seismic capacity index of the target building before strengthening (Eo), i.e., yield strength (Cy), to determine the volume of CCSS reinforcement required for the building. Figure 21 shows the load–displacement relationship of the existing R/C building obtained through nonlinear static analysis. Table 8 lists the yield displacement, the strength at the time of yielding (yield strength), and the basic seismic capacity index of the target building calculated based on the yield strength. The structure and material properties of the CCSS are the same as the results shown in the specimen overview in Section 3 and those applied in the analysis model in this section, allowing the determination of the required strength of the CCSS for the target building and the number of CCSS units, as shown in Table 9.
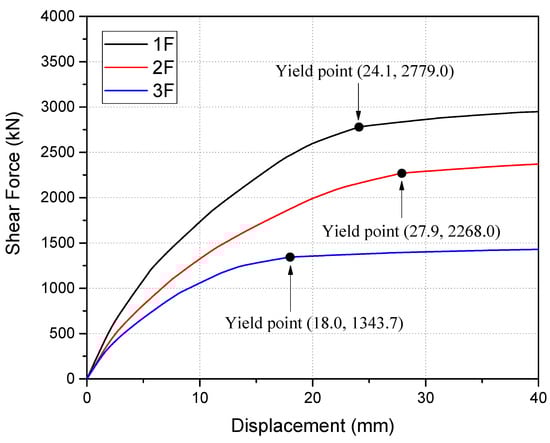
Figure 21.
Load–displacement relations based on the nonlinear static analysis of non-strengthened control buildings.
Table 8.
Basic seismic capacity index (Eo) of non-strengthened control buildings.
Table 9.
Calculated magnitude of the seismic strengthening of CCSS seismic systems.
7.2. Nonlinear Dynamic Analysis Results before and after Seismic Strengthening
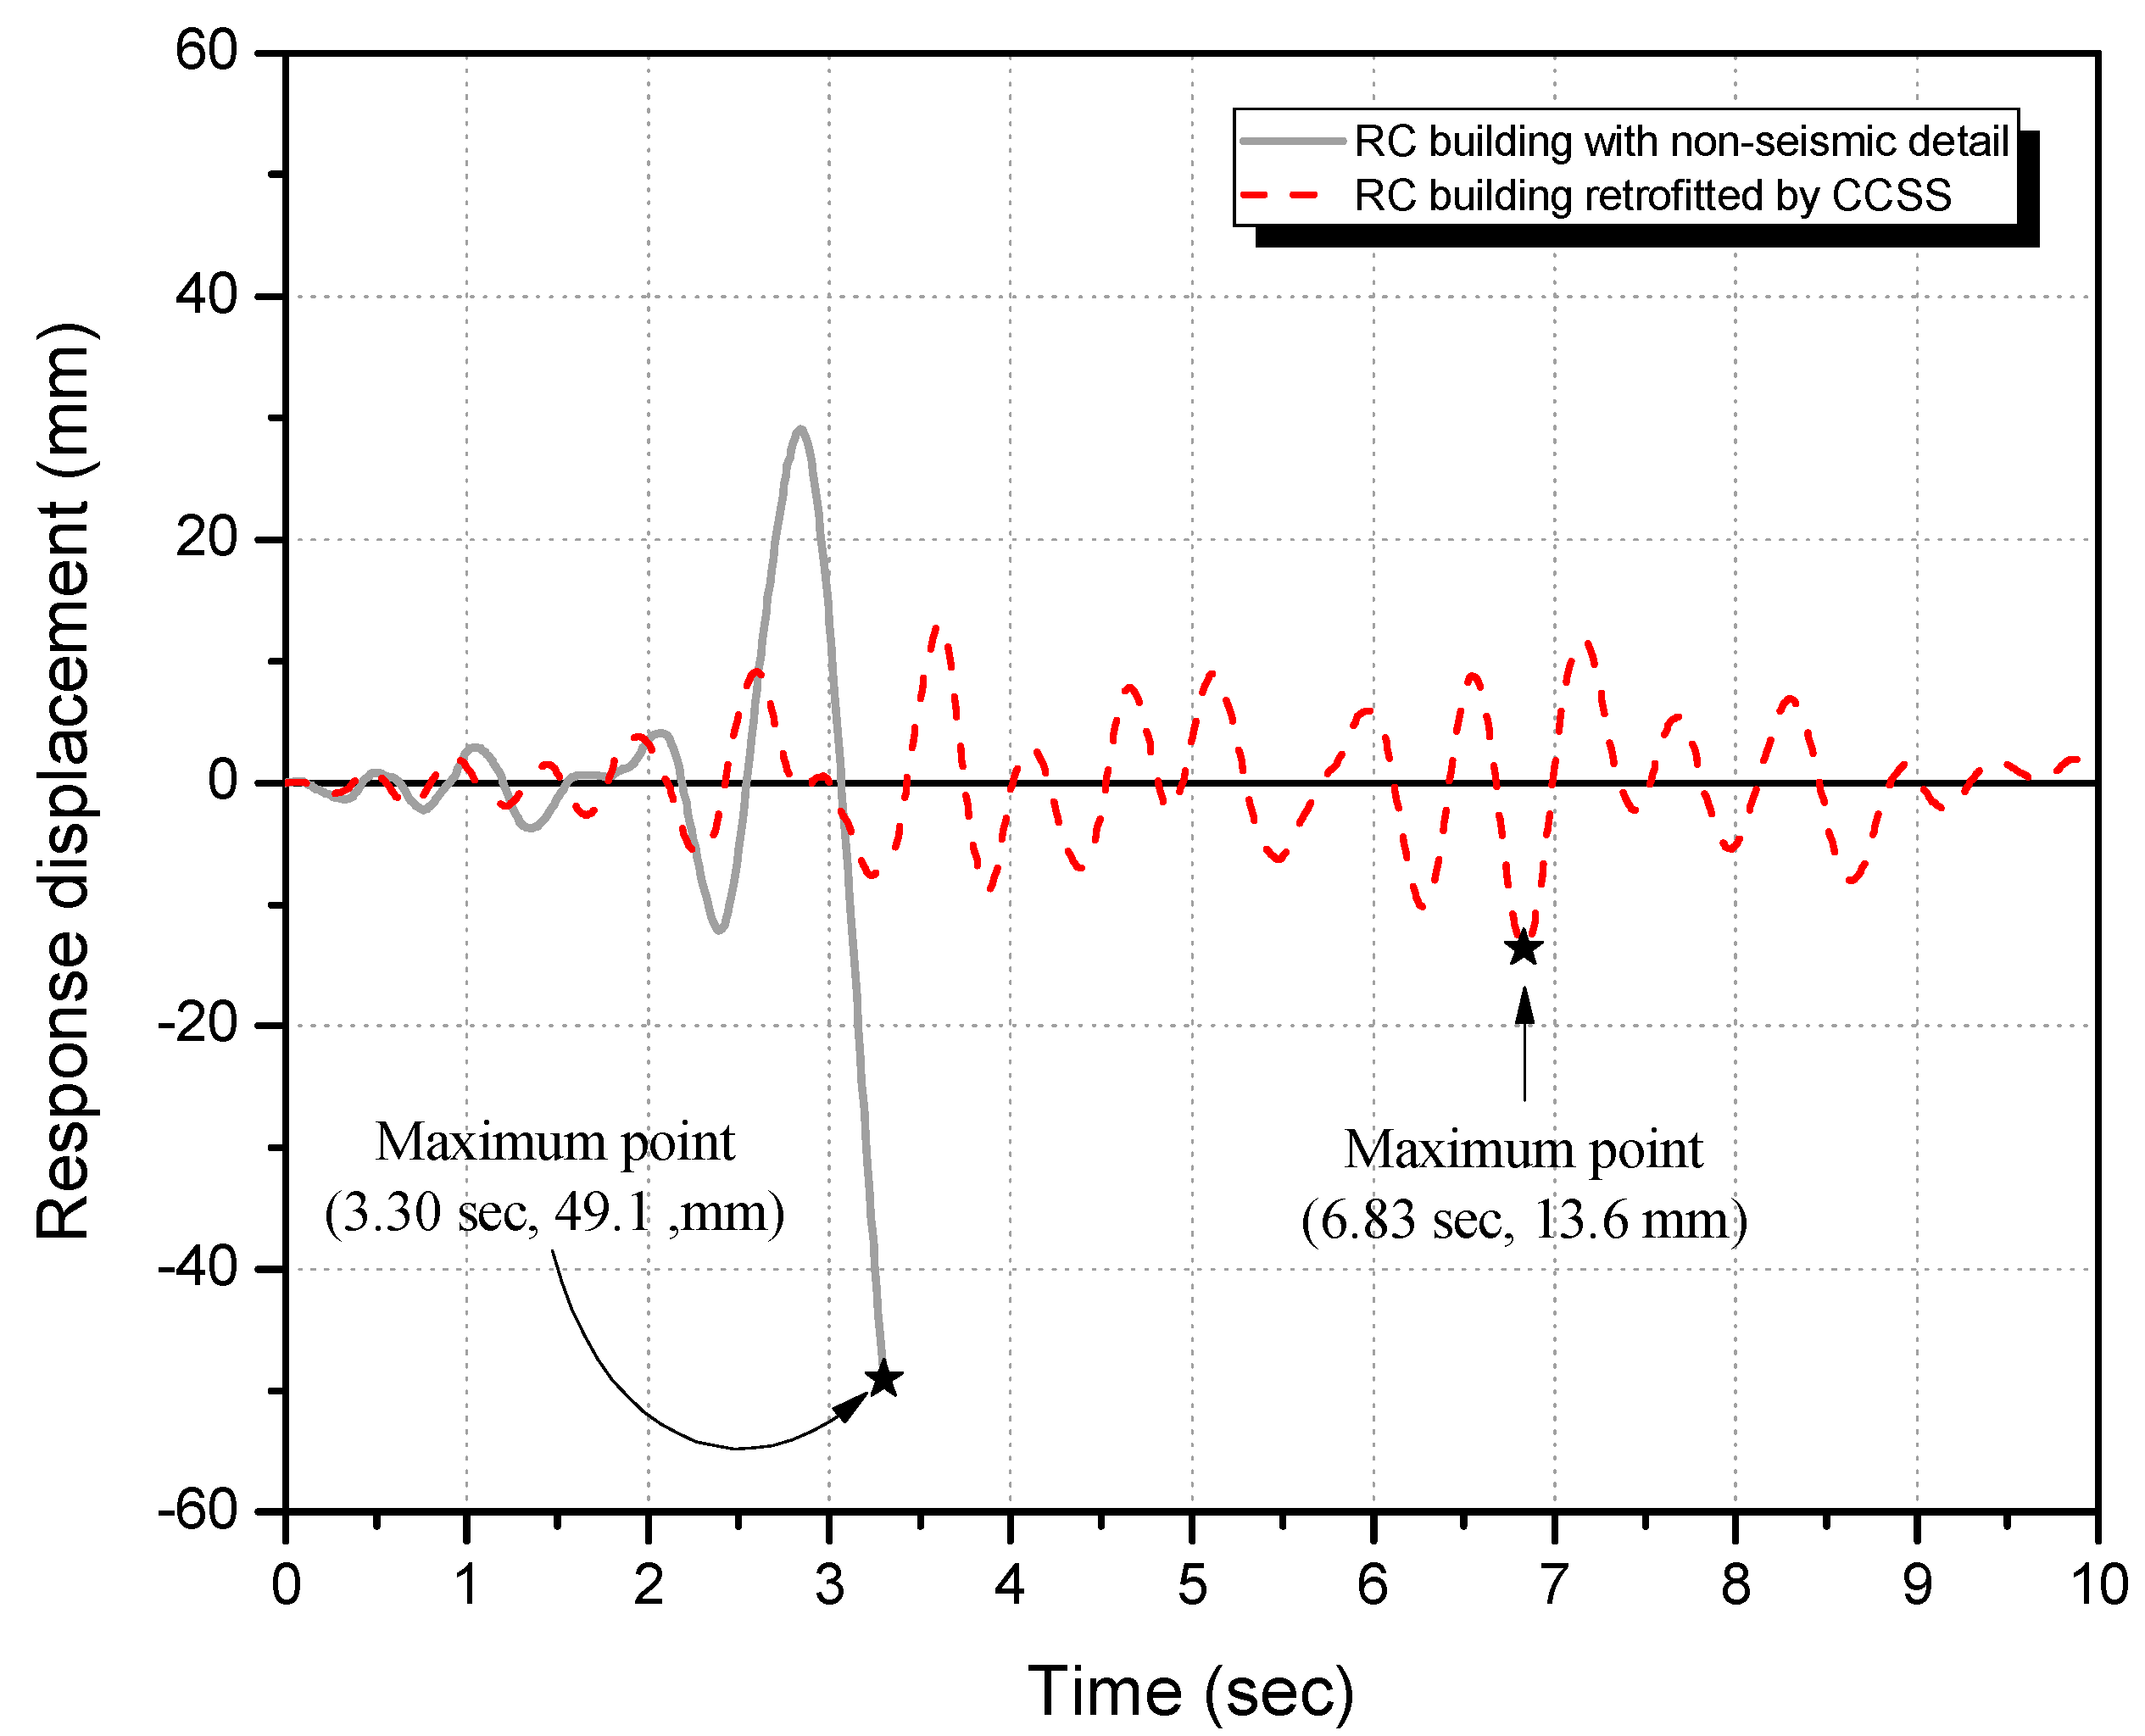
Nonlinear dynamic analysis was conducted based on the seismic strengthening design results shown in Section 7.1 and the analysis models of the target building before and after seismic strengthening. Consequently, for the unreinforced building, shear cracks occurred in the column member at 2.25 s (displacement: 4.7 mm) under 200 cm/s2. A maximum seismic response strength of 3584.2 kN (displacement: 49.1 mm) occurred at 3.3 s, and finally the unreinforced building collapsed due to shear cracks at 3.3 s when the maximum seismic response was observed.
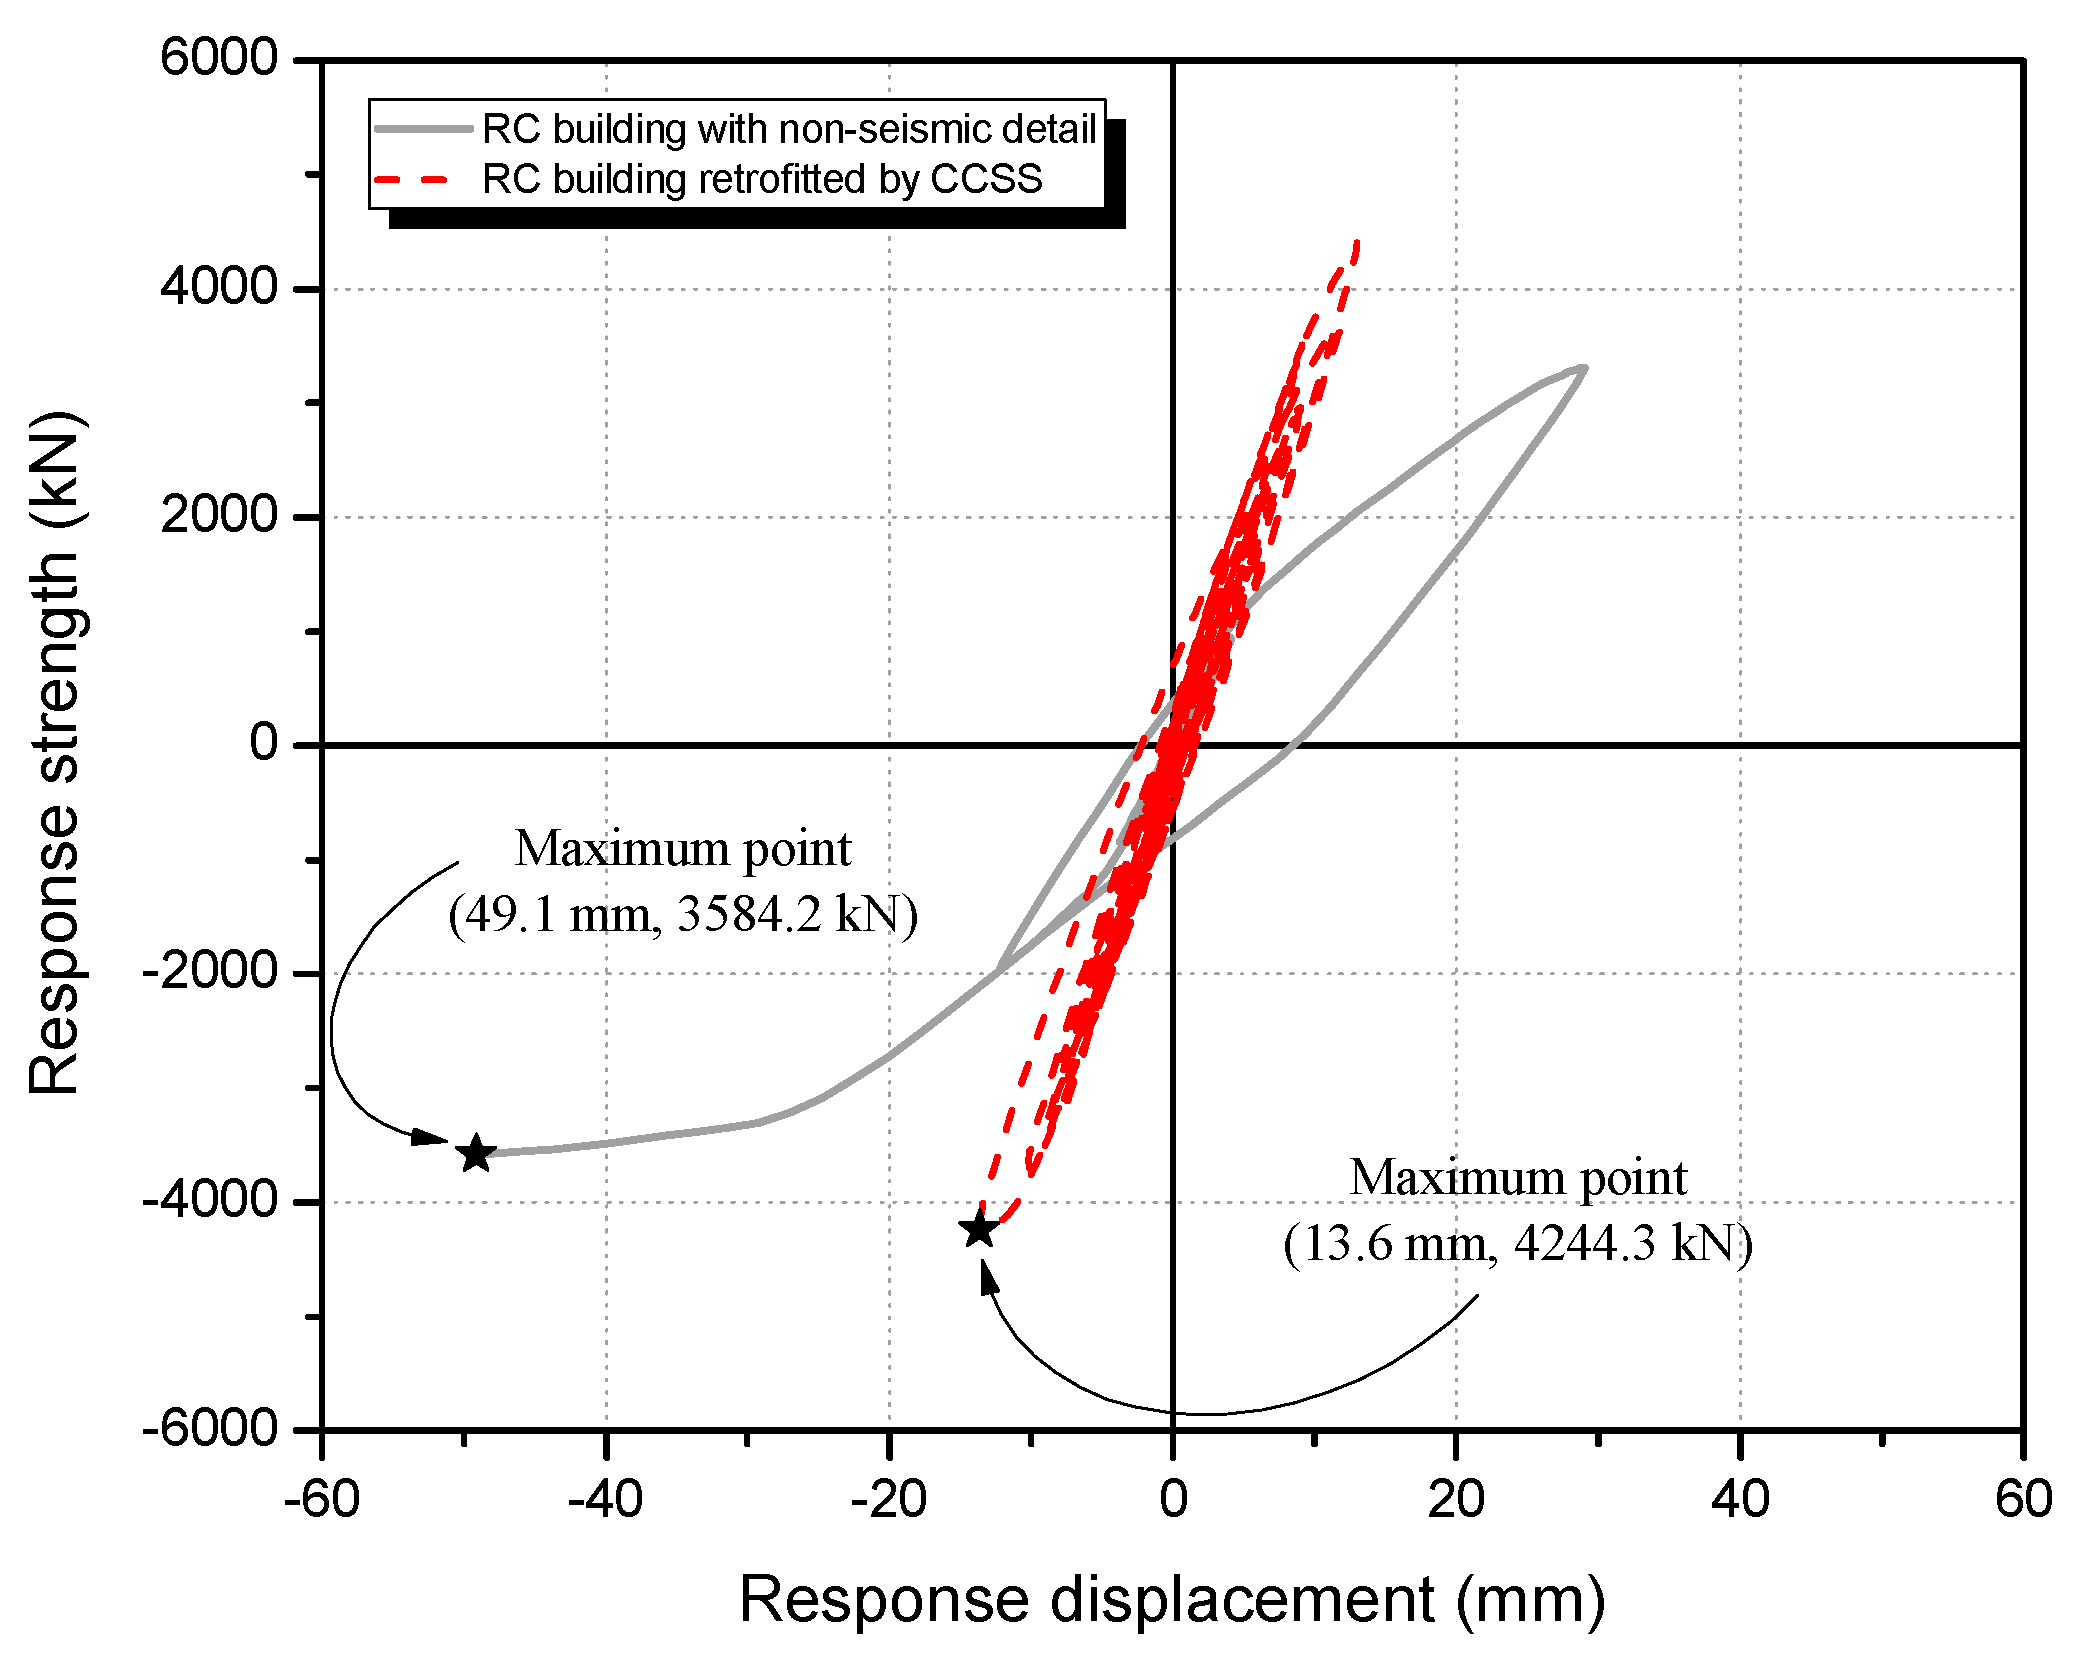
In the case of the target building reinforced with CCSS, shear cracks occurred in the column member at 2.5 s (6.8 mm) under 200 cm/s2. No additional maximum response, however, occurred after showing the maximum seismic response at 6.8 s (13.6 mm), resulting in small seismic damage. Figure 22 shows the load–displacement curves of the unreinforced and CCSS-reinforced buildings on the first floor under 200 cm/s2. Figure 23 shows the time–displacement history curves under the same ground motion. Table 10 shows the maximum response strength, maximum response displacement, and displacement ratio, which are important elements for seismic performance assessment, among the analysis results for the CCSS-reinforced building and unreinforced building under 200 cm/s2.

Figure 22.
Seismic response load–displacement of non-strengthened buildings and buildings strengthened by CCSS (1F).
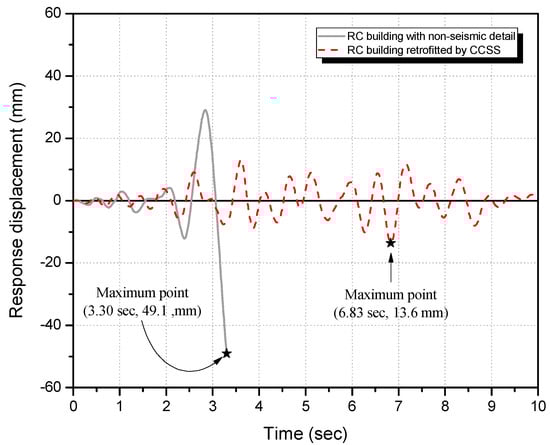
Figure 23.
Seismic response time–displacement history of non-strengthened buildings and buildings strengthened by CCSS (1F).
Table 10.
Comparison of the maximum seismic response and extent of damage before and after seismic strengthening.
According to the above figures and table, compared to the unreinforced building, the CCSS-reinforced building was suppressed by approximately 0.28 times on the first floor, 0.47 times on the second floor, and 0.66 times on the third floor under the input ground motion of 200 cm/s2. This confirmed the validity of the seismic strengthening design method and the proposed CCSS method.
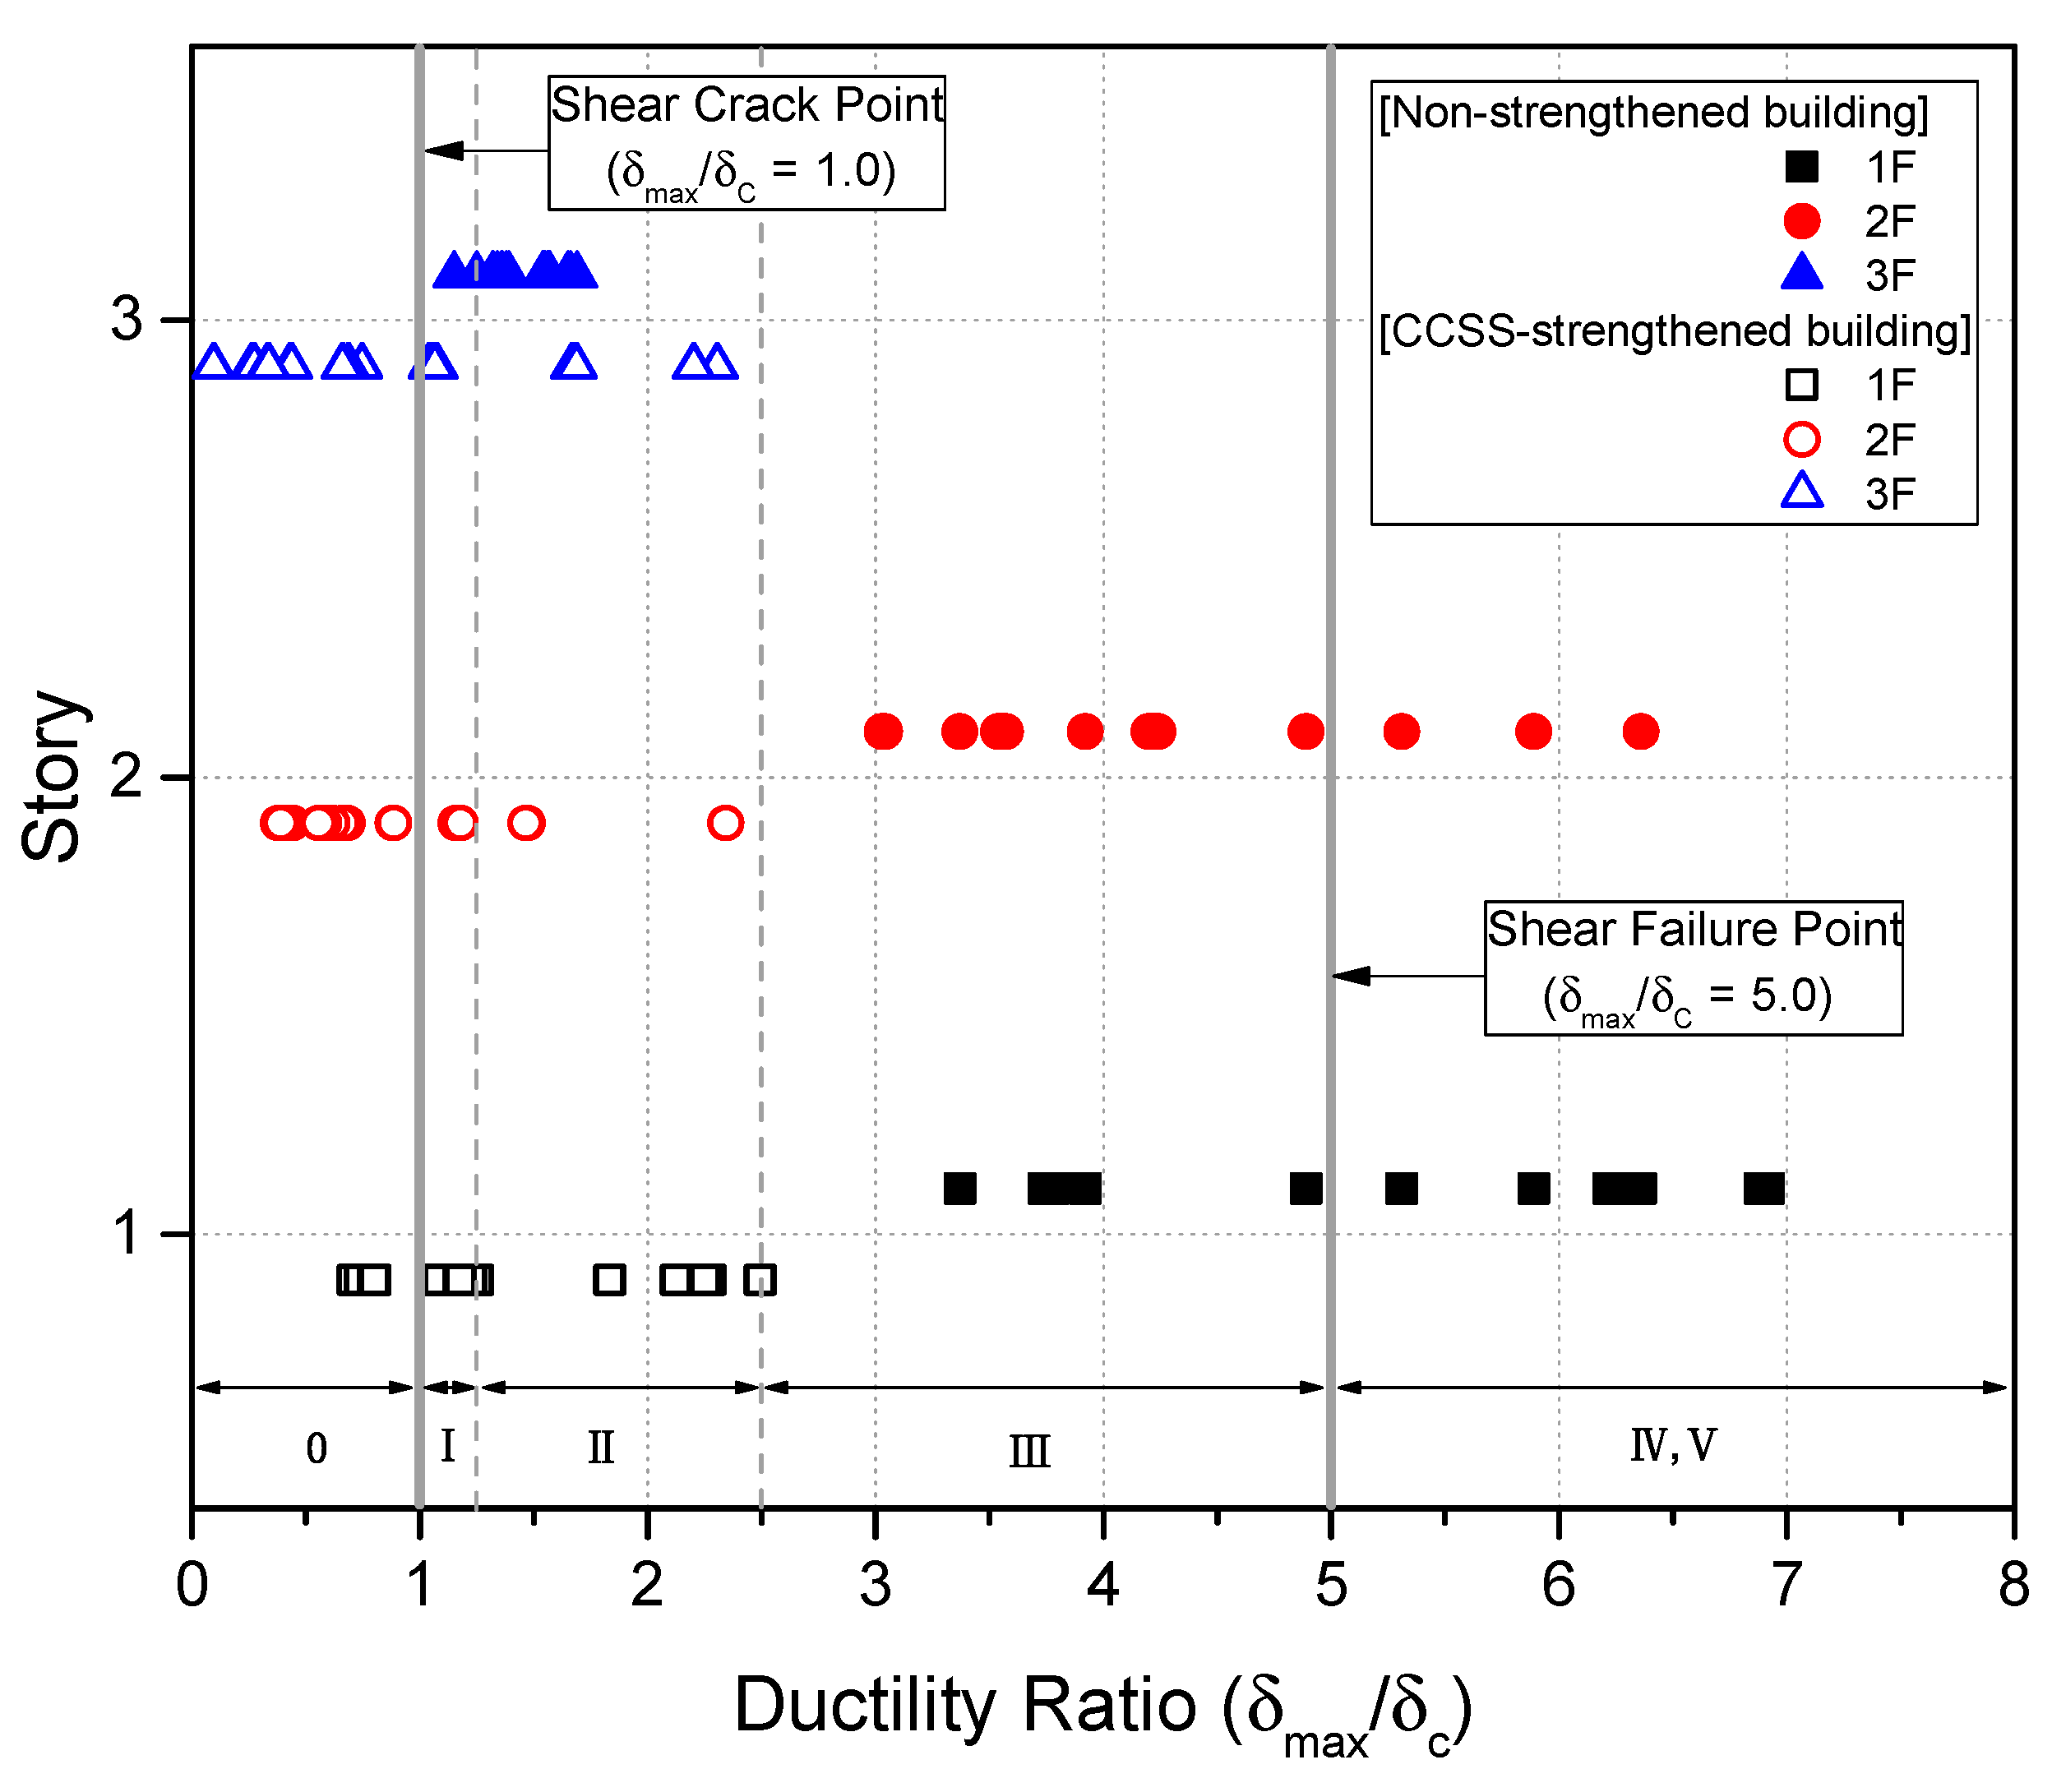
Figure 24 show the ductility ratios () of the column members on each floor with respect to shear deformation in the unreinforced building and CCSS-reinforced building. The ductility ratio in the figures was defined as the ratio of the maximum shear deformation () to the displacement at the time of shear cracking (), which was shown in Equation (13); i.e., . indicates the time of shear cracking, and denotes the time of shear failure. In addition, I, II, III, IV, and V in the figures represent the seismic damage classes described in JBDPA [22] and Maeda, Nakano, and Lee [23].
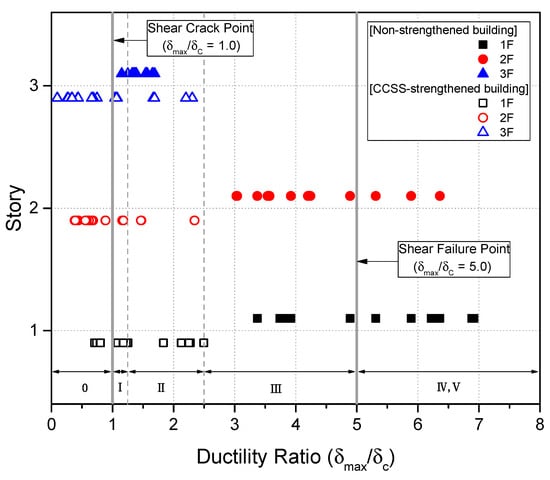
Figure 24.
Distribution of the ductility ratios of columns with respect to the shear deformation of existing non-strengthened buildings and CCSS-strengthened buildings based on the nonlinear dynamic analysis. Note: Damage classes are defined by JBDPA [22] and Maeda, Nakano, and Lee [23].
As shown in Figure 24, shear failure occurred in 15 out of 24 columns on the first floor of the unreinforced building and three columns on the second floor. Shear cracking occurred in all columns on the third floor. In the case of the CCSS-reinforced building shown in Figure 24. However, shear cracking of or less or no cracking (less than ) occurred in the columns on all floors, indicating that no column member exceeded the point of shear failure.
According to JBDPA [22] and Maeda, Nakano, and Lee [23], the seismic damage to the unreinforced building is the level of collapse and the damage to the CCSS-reinforced building can be judged to be small. These results satisfy the level of performance that leads to less-than-moderate seismic damage (life safety), which is the target performance under a seismic load of 200 cm/s2, as described in Section 7.1, indicating the commercializability of the CCSS method.
8. Conclusions
This study proposed a CFT CCSS, which is a new concept that can improve and supplement the vulnerability of existing seismic strengthening methods. The pseudo-dynamic test was conducted on two-story framework specimens based on an existing reinforced concrete (R/C) building with non-seismic features to verify the seismic strengthening effect of applying the CCSS to existing R/C buildings. Based on the pseudo-dynamic test results, restoration force characteristics were proposed for the nonlinear dynamic analysis of the CCSS-reinforced building. Nonlinear dynamic analysis was conducted based on the proposed restoration forces, and the results were compared with the pseudo-dynamic test results. Finally, for the commercialization of the CCSS, nonlinear dynamic analysis was conducted on the existing R/C building with non-seismic features reinforced with the CCSS. The seismic strengthening effect was comprehensively verified by examining the seismic response load, displacement characteristics, and the degree of damage to members before and after seismic strengthening. The study results can be summarized as follows.
- (1)
- The unreinforced pseudo-dynamic test specimen showed a maximum seismic displacement of 70.5 mm (strength: 272.5 kN) at 3.43 s for the DBE (Hachinohe (EW)) seismic wave with a magnitude of 200 cm/s2, and shear failure occurred. This shows that R/C buildings with non-seismic features are highly susceptible to serious seismic damage under a DBE ground motion of 200 cm/s2. This is judged to be important information for securing the seismic safety of R/C buildings without seismic design, i.e., seismic reinforcement.
- (2)
- In the case of the CCSS-reinforced framework specimen, the maximum displacement was 10.6 mm (strength: 488.6 kN) under a DBE ground motion of 200 cm/s2, and minor flexural and shear cracks were observed. Under an MCE of 300 cm/s2, the maximum seismic response displacement was 20.4 mm (strength: 708.1 kN), and small flexural and shear cracks were observed. Under a seismic wave of 400 cm/s2, which represents a large earthquake, the maximum displacement was 35.2 mm (strength: 864.9 kN), and the degree of seismic damage was moderate.
- (3)
- The CCSS is judged to be a typical seismic strengthening method considering that the maximum strength increased by approximately 1.79 times under the seismic wave of 200 cm/s2, 2.6 times under 300 cm/s2, and 3.17 times under 400 cm/s2 compared to that of the specimen with non-seismic features (PD-FR), which showed shear failure under the Hachinohe (EW) 200 cm/s2 seismic wave. For the specimen reinforced with the CCSS method, the seismic displacement was suppressed by approximately 84% under the same seismic wave, i.e., 200 cm/s2, compared to the control specimen. This verified the seismic safety of the developed CCSS method.
- (4)
- Based on the pseudo-dynamic test results of CCSS, the restoration force characteristics of the beams, columns, and reinforcement (CCSS) were proposed for the nonlinear dynamic analysis of the two-story framework specimen reinforced with the CCSS. Based on the proposed restoration forces, nonlinear dynamic analysis was conducted on the pseudo-dynamic test specimens, and the results were compared with the pseudo-dynamic test results. The results were found to be similar, and the average difference in the seismic response load and displacement was less than 10%. This indicates that the seismic strengthening effect of the CCSS can be effectively evaluated using nonlinear dynamic analysis based on the nonlinear analysis model and the method developed in this study.
- (5)
- For investigating the commercialization of the CCSS, the CCSS method seismic retrofit design procedure was proposed for existing R/C buildings with non-seismic characteristics, and the nonlinear dynamic analysis results before and after reinforcement were analyzed. As a result of the comparison, the unreinforced building with non-seismic details suffered collapse-level damage in an earthquake of 200 cm/s2, which is the DBE level, while the displacement of the CCSS-reinforced building was reduced by more than 50%, suppressing slight level damage.
- (6)
- The proposed CCSS method is a method that improves the shortcomings of the existing CFT reinforcement method and significantly improves the constructability of the joint between the existing R/C frame and the reinforcement. In particular, it was confirmed that the seismic performance of existing R/C buildings with non-seismic characteristics can be efficiently improved through the seismic performance of the CCSS method and the established seismic strengthening design procedure.
- (7)
- In order to promote the commercialization of the technology, it is necessary to propose additional external joining methods that allow buildings to be used even during CCSS construction, and verification of different building topologies with different characteristics for different seismic hazard levels is required. Therefore, as a recommendation for future research, detailed and experimental research on the application of external joining and verification through nonlinear dynamic analysis is necessary.
Author Contributions
All authors have contributed to the development of the research and the elaboration of this article. Particularly, H.-J.B. contributed to the methodology, the experimental research, and conceptualization; J.-S.J. contributed to the experimental research and the dynamic analysis; K.-S.L. contributed to the experimental research and the dynamic analysis; B.-G.L. contributed to the methodology, the experimental research, and the dynamic analysis and edited the manuscript. All authors have read and agreed to the published version of the manuscript.
Funding
This research was supported by the Basic Research Program through the National Research Foundation of Korea (NRF) funded by the MSIT (RS-2023-00220751) and by a grant (RS-2023-00213104) from the National Research Foundation of Korea (NRF) and the Ministry of Science and ICT (MSIT, Korea government).
Institutional Review Board Statement
Not applicable.
Informed Consent Statement
Not applicable.
Data Availability Statement
All datasets are available from the corresponding author on reasonable request. The data are not publicly available due to privacy.
Conflicts of Interest
The authors declare no conflict of interests.
References
- Architectural Institute of Korea (AIK). Site Inspection and Damage Investigation of Buildings by Earthquakes in Gyoungju and Pohang; Architectural Institute of Korea: Seoul, Republic of Korea, 2018; 347p. [Google Scholar]
- Federal Emergency Management Agency (FEMA) 356. Prestandard and Commentary for Seismic Rehabilitation of Buildings; FEMA: Washington, DC, USA, 2000; 500p.
- Japan Building Disaster Prevention Association (JBDPA). Guideline for Seismic Strengthening of Existing Reinforced Concrete Buildings; JBDPA: Tokyo, Japan, 2017; 450p. [Google Scholar]
- Seismic Strengthening Research Group (SSRG). Seismic Strengthening of RC Buildings; Ohmsha Press: Tokyo, Japan, 2008; 230p. [Google Scholar]
- Pankaj, M.; Singh, S.B. Out-of-plane response of ECC-strengthened masonry walls. J. Struct. Integr. Maint. 2020, 5, 18–30. [Google Scholar]
- Corey, T.G. Multi-performance retrofits to commercial buildings in seismic zones. J. Struct. Integr. Maint. 2017, 2, 133–142. [Google Scholar]
- Alahi, F.N.; Vatandoost, M. Single diagonal precast prestressed concrete bracing for strengthening existing concrete frames. Int. J. Adv. Struct. Eng. 2018, 10, 339–347. [Google Scholar] [CrossRef]
- Choi, C.G.; Cheong, S.H.; Moom, H.J.; Kim, H.Y.; Lee, K.S. Experimental Study on Seismic Capacity of Reinforced Concrete Composite Columns Based on a High-ductile Fiber Cementitious Composite. Int. J. Concr. Struct. Mater. 2019, 13, 1–10. [Google Scholar]
- Lee, K.S.; Lee, B.G.; Jung, J.S. Nonlinear dynamic response of R/C buildings strengthened with novel stud-typed seismic control system using non-buckling slit damper. Eng. Struct. 2021, 244, 112749. [Google Scholar] [CrossRef]
- Hwang, J.S.; Lee, K.S. Seismic Strengthening Effects Based on Pseudodynamic Testing of a Reinforced Concrete Building Retrofitted with a Wire-Woven Bulk Kagome Truss Damper. Shock. Vib. 2016, 2016, 1–17. [Google Scholar] [CrossRef]
- Lee, K.S.; Wi, J.D.; Kim, Y.I.; Lee, H.H. Seismic Safety Evaluation of Korean R/C School Buildings Built in the 1980s. J. Korea Inst. Struct. Maint. Insp. 2009, 13, 1–11. [Google Scholar]
- Lee, K.S.; Jung, J.S. A Seismic Capacity of R/C Building Damaged by the 2016 Gyeongju Earthquake Based on the Non-linear Dynamic Analysis. J. Korea Inst. Struct. Maint. Insp. 2018, 22, 137–146. [Google Scholar]
- KS B 0801; Test Pieces for Tension Test for Metallic Materials. Korean Industrial Standards: Seoul, Republic of Korea, 2017.
- Ministry of Eduaction (MOE) and Korea Institute of Educational Environment (KIEE). Guideline for Seismic Evaluation and Rehabilitation of Existing School Buildings in Korea; MOE and KIEE: Seoul, Republic of Korea, 2011; 108p. [Google Scholar]
- Korean Design Standard 41 (KDS 41). In Korean Design Standard 41; Architectural Institute of Korea: Seoul, Republic of Korea, 2019.
- Lee, K.S. Seismic Capacity Requirements for Low-Rise R/C Buildings Controlled by Both Shear and Flexure. J. Adv. Concr. Technol. 2010, 8, 75–91. [Google Scholar] [CrossRef]
- Umemura, H. Earthquake Resistant Design of Reinforced Concrete Buildings, Accounting for the Dynamic Effects of Earthquakes; Giho-do Publishing Co.: Tokyo, Japan, 1973; 650p. [Google Scholar]
- Takanashi, K.; Udagawa, K.; Tanaka, H. Pseudo-dynamic tests on a 2-storey steel frame by a computer-load test apparatus hybrid system. In Proceedings of the Seventh World Conference on Earthquake Engineering, Istanbul, Turkey, 8–13 September 1980; Volume 7, pp. 225–232. [Google Scholar]
- Tokyo Soki Kenkyujo Company (TSKC): DA-16A. 2023. Tokyo, Japan. Available online: https://www.tml.jp/e/ (accessed on 29 March 2023).
- MTS. Pseudodynamic Testing for 793 Controllers; MTS Systems Corporation: Eden Prairie, MI, USA, 2002. [Google Scholar]
- Hilbert, H.B.; Hughes, T.R.J.; Taylor, R.L. Improved numerical dissipation for time integration algorithms in structural dynamics. Earthq. Eng. Struct. Dyn. 1977, 5, 283–292. [Google Scholar] [CrossRef]
- Japan Building Disaster Prevention Association (JBDPA). Standard for Damage Level Classification; JBDPA: Tokyo, Japan, 2015; 310p. [Google Scholar]
- Maeda, M.; Nakano, Y.; Lee, K.S. Post-Earthquake Damage Evaluation for R/C Buildings Based on Residual Seismic Capacity. In Proceedings of the 13th World Conference on Earthquake Engineering, Vancouver, Canada, 1–6 August 2004; Volume 1179. [Google Scholar]
- Japan Building Disaster Prevention Association (JBDPA). Standard for Seismic Evaluation of Existing Reinforced Concrete Buildings; JBDPA: Tokyo, Japan, 2017; 368p. [Google Scholar]
- AIJ (Architectural Institute of Japan). Standard for Structural Calculation of Reinforced Concrete Structures; AIJ: Tokyo, Japan, 2010. (In Japanese) [Google Scholar]
- Li, K.N. Canny (Version C11): A 3-dimensional Nonlinear Dynamic Structural Analysis Computer Program, User Manual; CANNY Structural Analysis: Vancouver, BC, Canada, 2009. [Google Scholar]
- Nakano, Y. Seismic Capacity of Existing Reinforced Concrete Buildings. In Proceedings of the 7th Japan Earthquake Engineering Symposium, Tokyo-Kyoto, Japan, 2–9 August 1986; pp. 2041–2046. [Google Scholar]
- Okada, T. Development and present status of seismic evaluation and seismic retrofit of existing reinforced concrete buildings in Japan. Proc. Jpn. Acad. Ser. B 2021, 97, 402–422. [Google Scholar] [CrossRef] [PubMed]
- Jung, J.-S.; Lee, K.S. A methodology for evaluating seismic capacity and seismic risk assessment of reinforced concrete buildings in Korea. J. Asian Arch. Build. Eng. 2020, 19, 103–122. [Google Scholar] [CrossRef]


Disclaimer/Publisher’s Note: The statements, opinions and data contained in all publications are solely those of the individual author(s) and contributor(s) and not of MDPI and/or the editor(s). MDPI and/or the editor(s) disclaim responsibility for any injury to people or property resulting from any ideas, methods, instructions or products referred to in the content. |
© 2023 by the authors. Licensee MDPI, Basel, Switzerland. This article is an open access article distributed under the terms and conditions of the Creative Commons Attribution (CC BY) license (https://creativecommons.org/licenses/by/4.0/).