Featured Application
The COP26 UN climate conference was held from 31 October to 13 November 2021, in Glasgow, Scotland, United Kingdom. The Glasgow Climate Pact was the first climate deal to explicitly address the need for a reduction in unabated coal power, which is a major contributor to climate change. However, substituting coal fly ash for Portland cement is a proven effective method for carbon reduction. In Taiwan, the price of coal fly ash has risen significantly due to the implementation of coal reduction policies. This study focused on finely grinding bottom ash, a byproduct of coal combustion, for use as a substitute for Portland cement. A comparison was made between finely ground bottom ash and coal fly ash from the same power plant. Apart from workability, no discernible differences that would affect structural safety were found. Therefore, utilizing low-cost bottom ash by finely grinding it to replace Portland cement in concrete is feasible, achieving both carbon reduction and economic viability.
Abstract
This study investigates the use of finely ground coal bottom ash (FGCBA) as a substitute for Portland cement in concrete, comparing it with coal fly ash from the same power plant. The incorporation of this ash necessitates the addition of a superplasticizer to achieve the desired slump at the same replacement rate. The results demonstrate that at an optimal 20% replacement rate, as determined by 91-day compressive strength tests, the maximum strength achieved by FGCBA is 97.7% of the control group with pure cement, whereas coal fly ash reaches 114.0%. Drying shrinkage tests indicate for both materials have similar volume stability, while rapid chloride permeability tests show their effectiveness in reducing chloride ion permeability, with superior performance from FGCBA. Under optimal conditions, the result of the RCPT test was only 559 coulombs, which is significantly better compared to the 4108 coulombs when using fly ash from coal combustion. Our results demonstrate that utilizing low-cost bottom ash by finely grinding it to replace Portland cement in concrete is feasible, achieving both carbon reduction and economic viability.
1. Introduction
The urgent global need to address climate change has made it essential to decrease coal usage in energy generation and industrial processes. This is largely due to coal combustion being a major source of greenhouse gas emissions. The rise of renewable energy technologies and sustainable alternatives is gradually reducing the prevalence of coal in the energy sector. Studies like those by Sims et al. [1] underscore the effectiveness of solar energy as an alternative to coal-fired power plants, and Lu et al. [2] have shown how wind energy can ease coal dependence. The construction industry is also moving away from coal. New building materials, such as low-carbon cement alternatives, are showing promise in minimizing the carbon footprint. For example, research by Lin and Chen [3] on using slag and fly ash in concrete indicates a significant decrease in the need for traditional coal-reliant Portland cement. Furthermore, progress in carbon capture and storage (CCS) technology, explored by Bui et al. [4], offers a way to reduce emissions from existing coal-based facilities. As efforts toward a sustainable future are intensifying globally, reducing coal consumption remains a key focus of scientific research and technological advances. Furthermore, studies on carbon sequestration by concrete have been published. Xu et al. [5] focused on enhancing the properties of rankinite (C3S2) cement through the use of triethylene glycol (TEG) as a modifier. Their results demonstrated that the addition of TEG facilitates the formation of aragonite whiskers, significantly improving both the flexural and compressive strength of cement. Furthermore, they found that aragonite formation is more favorable in a suspension with a high concentration of Ca2+ and a minimal Mg2+/Ca2+ molar ratio higher than 0.12.
Continuing efforts to mitigate the environmental impact of construction activities have led to the exploration of industrial byproducts as supplementary cementitious materials (SCMs). Among these, coal fly ash, a residue generated from coal combustion in power plants, has gained attention for its pozzolanic properties, which allow for its use in replacing a portion of Portland cement in concrete. The incorporation of coal fly ash not only addresses issues of waste management but also reduces the carbon footprint associated with cement production. It has been documented in studies by researchers such as Tosti et al. [6] that the integration of fly ash into concrete mixtures not only allows for the conservation of natural resources but also enhances the durability and performance of the resulting concrete. Furthermore, research by Naik et al. [7] provides evidence that the appropriate incorporation of fly ash can lead to improved workability and long-term strength of concrete structures. As explored by Kurda et al. [8], the economic advantages of using fly ash are substantial in providing a cost-effective substitute for traditional cement and enhancing the economic sustainability of construction projects. While the incorporation of fly ash in concrete shows great promise, a shift in power generation methods is expected to result in decreased fly ash production. In light of this, if the quantity of construction projects remains unaffected, it becomes crucial to identify suitable pozzolanic materials as alternatives.
In this study, we chose coal bottom ash, a material akin to coal fly ash, as our research object. The selection was made in the context of existing regulations and the manufacturing processes of ready-mixed concrete plants, which have yet to undergo changes. Our approach is aligned with the current trend of reducing coal usage. It is important to note that as coal usage diminishes, the availability of coal combustion fly ash, which can substitute cement, will also decrease. Therefore, our decision not to increase cement use represents a solution that is pragmatic and quick to implement. This approach strikes a balance between regulatory compliance, cost, verification, and users’ concerns, making it effective in the current industrial landscape. Oruji et al. [9] conducted a study in which coal bottom ash was ground to double and triple the fineness of cement using a high-energy vibratory ball mill. This process was observed to not only increase the final setting time of cement mortar but to also significantly improve its strength activity and microstructure. Mansor et al. [10] examined the effects of fly ash and finely ground bottom ash on the performance of porous asphalt concrete and found that after 8000 rutting test cycles, the finely ground bottom ash had higher rut depths, likely due to its higher unburned carbon content. Singh et al. [11] used coal bottom ash (CBA) and finely ground coal bottom ash (FGCBA) as replacements for fine aggregates and Portland cement, respectively, and noted that their combined use in concrete resulted in pozzolanic reactions and pore filling, improving the microstructure, carbonation resistance, and compressive strength of concrete.
Mangi et al. [12] evaluated the impact of FGCBA on concrete properties by replacing 10%, 20%, and 30% of cement by weight. Their findings indicated that the slump, density, compressive strength, and splitting tensile strength of the concrete decreased with the addition of FGCBA, although a 10% replacement could achieve the 28-day target compressive strength, suggesting its potential as a supplementary cementitious material. In subsequent research assessing the performance of different fineness levels of FGCBA as a supplementary cementitious material in seawater, the addition of 10% of FGCBA with fineness values of 3836 cm2/g and 3895 cm2/g resulted in a reduction in concrete weight and a significant decrease in chloride ion permeability at 180 days by 45.4% and 42.4%, respectively. The strength also increased at 90 and 180 days, indicating that FGCBA can serve as a supplementary cementitious material in both standard and marine environments [13].
Hamzah et al. [14] created self-compacting concrete (SCC) in which some fine aggregates were replaced with coal bottom ash and studied its chloride ion permeability in a seawater environment. They discovered that replacing 10% of the fine aggregates yielded the best performance, but over-addition had a negative impact on the SCC’s properties. Menéndez et al. [15] combined coal fly ash with finely ground bottom ash in various ratios and replaced 10%, 25%, or 35% of the cement mass for testing. They observed that the pozzolanic reactions of both materials were initially slow but increased over time, indicating that FGCBA is a promising new material whose pozzolanic properties can rival those of coal fly ash. In Kamal et al. [16], FGCBA of 45 μm, 75 μm, and 100 μm fineness was used to replace 5%, 10%, and 15% of cement together with water–binder ratios of 0.40, 0.45, and 0.50 in a concrete mix design. An RSM analysis of 28-day compressive strength indicated that an increase in the replacement rate of FGCBA led to a decrease in compressive strength due to its water-absorbing characteristics. However, with an appropriate water–binder ratio and optimal proportion of FGCBA, the hydration process could completed, which significantly increased strength development.
Khongpermgoson et al. [17] made a new binder concrete with finely ground bottom ash and calcium carbide in a 7:3 ratio, showing that despite a 28-day compressive strength lower than that of ordinary concrete, this new binder concrete still had good compressive strength, permeability, and chloride ion penetration resistance. Argiz et al. [18] compared FGCBA and coal fly ash regarding their effect on ion permeability resistance and found that the FGCBA displayed superior performance. Pyo and Kim [19] substituted fly ash, coal bottom ash, and two types of slag powder, each with distinct fineness properties, for silica fume in UHPC, assessing slump flow, compressive strength, porosity, setting time, and drying shrinkage and conducting a thermogravimetric analysis. The results demonstrated that coal fly ash and coal bottom ash could effectively replace silica fume without significant workability and strength development loss; setting time tests showed no notable difference when adding coal bottom ash compared to silica fume, and the strength loss caused by the addition of coal bottom ash was not significant. The thermogravimetric analysis suggested that the coal bottom ash had a higher hydration level than silica fume but lower strength, likely due to weaker hydration products. In another study by Kim [20], coal bottom ash sieved through No. 40 mesh was added to high-strength mortar, which showed higher pozzolanic reactivity and similar compressive strength at 3 and 28 days compared to high-strength mortar containing only cement and fly ash. In our study, finely ground coal-fired bottom ash is used instead of fly ash in cement to understand its impact on the performance of freshly mixed concrete in terms of hardening and durability. The use of FGCBA and FA as replacements for Portland cement was tested at replacement rates of 0%, 20%, 40%, and 60%. Activity index tests were conducted on both raw materials. In terms of fresh properties, workability, unit weight, air content, and setting time were measured. For hardened properties, compressive strength and drying shrinkage were assessed. As for the determination of durability, a rapid chloride ion penetration test and a hardened concrete porosity test were employed.
2. Materials and Methods
2.1. Raw Materials
In this study, the materials used for testing included Type I Portland cement, coal fly ash (FA), finely ground coal bottom ash (FGCBA), natural river sand, 3/8-inch gravel, ¾-inch gravel, and a water-reducing agent. The Type I Portland cement was sourced from a Taiwan cement company. Both the FA and FGCBA were obtained from the same unit at the Taichung power station to minimize experimental variance. The size distribution of the powders, characterized using an INSITEC laser diffraction particle size analyzer (Malvern Panalytical, Malvern, UK), is shown in Figure 1, with mean values of 9.82 µm and 11.83 µm. The physical properties of the fine and coarse aggregates are presented in Table 1, and the results of a sieve analysis are shown in Figure 2. A Type G liquid water-reducing agent capable of reducing the water content by 20% (Sika Taiwan Ltd., Taoyuan City, Taiwan) was utilized. The relationship between the grinding duration and the specific surface area of the finely ground coal bottom ash (FGCBA) is detailed in Table 2, and the chemical properties of the FA and FGCBA are presented in Table 3. Both have similar chemical properties. Due to equipment limitations, extending the grinding time did not significantly increase the specific surface area. Consequently, coal bottom ash milled for 48 h was selected as the experimental material.
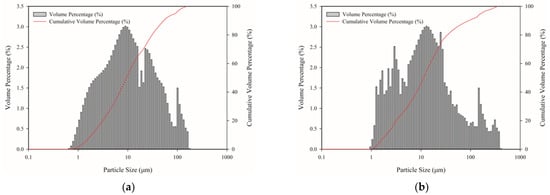
Figure 1.
Particle size distribution of powders, determined using a laser diffraction particle size analyzer: (a) fly ash; (b) FGCBA.

Table 1.
The properties of the aggregates used in this study.
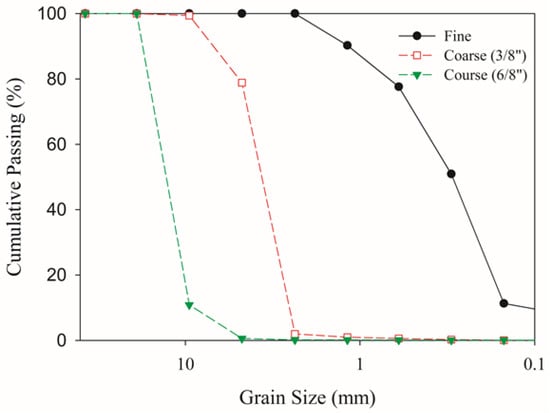
Figure 2.
Sieve analysis of fine and coarse aggregates.
Table 2.
The fineness of the bottom ash and the associated grinding time.
Table 3.
The chemical properties of the FA and FGCBA used in this study.
2.2. Sample Preparation, Mixing, and Curing
The impact of adding FGCBA to standard concrete was investigated by varying water–binder ratios (0.4, 0.45, and 0.5) and replacement rates (0%, 20%, 40%, and 60%), with the corresponding rates of FA serving as a control. The specimen proportions are given in Table 4. Mixing and curing were conducted in strict accordance with ASTM C31 [21]. With respect to reference ASTM C94 [22], the batching process begins with a portion of the total mixing water, followed by the addition of aggregates. Cement is then added, ensuring effective blending with the pre-introduced water and aggregates. The remaining water is incorporated, sometimes in stages, to achieve the desired consistency. Chemical admixtures, if used, are introduced during water incorporation. The process culminates in a final mixing phase to ensure a uniform mixture, adhering to the minimum required mixing time to achieve the optimal consistency and quality of the concrete. This involves curing the specimens in saturated lime water until the set aging period is reached, at which point they are removed for relevant testing. The basic aging periods are 7, 14, 28, 56, and 91 days. In compressive strength tests, an extended aging period of 180 days is added to ensure that there is no decrease in strength in the long term.
Table 4.
The concrete proportions in this study.
2.3. Pozzolanic Strength Activity Index
In accordance with ASTM C311 standards [23], the evaluation of the pozzolanic activity index involves preparing a blend of pozzolan and ordinary Portland cement, typically at a 20% replacement level. This mixture is used to create mortar specimens adhering to strict mix design guidelines, ensuring consistent proportions and ratios of water to cementitious material. These specimens are then subjected to controlled curing in a moisture-regulated environment for a standard period, often 28 days. The key assessment involves measuring the compressive strength of these specimens and comparing it to that of a control mortar composed solely of Portland cement. The pozzolanic activity index is calculated from this comparison, offering a quantifiable measure of the pozzolan’s effectiveness in enhancing the concrete’s strength. This standardized procedure ensures a reliable and reproducible evaluation of pozzolanic materials in concrete applications. The compressive strengths of mortar cubes at 7, 28, 56, 91, and 180 days were evaluated by substituting 20% of the cement mass with FA or FGCBA. The specimen dimensions were 5 cm × 5 cm × 5 cm. This assessment was conducted under steady flow conditions and compared with control samples devoid of FA to examine the reactivity of various raw materials.
2.4. Workability
This test was carried out with reference to ASTM C143 [24]. Fresh concrete was deposited and consolidated through rodding within a conical, frustum-shaped mold. Upon lifting the mold, the concrete settled, and the slump was determined by measuring the vertical displacement of the concrete’s central peak from its initial height, which was then recorded as the slump measurement of the concrete.
2.5. Unit Weight and Air Content Test
This test was performed in accordance with ASTM C138 [25]. According to the mixing conditions in Section 2.2, a scoop was used to place concrete into the measure, ensuring even distribution and minimal segregation. The concrete was then divided into three equal layers with a rod in each layer [25]. After rodding each layer, the measured sides were tapped 15 times to seal voids and release air bubbles. Care was taken to avoid overfilling the final layer. The concrete surface was leveled off using a strike-off plate, using a sawing motion used to cover and smooth the surface and finishing with a few strokes to ensure a smooth surface. Finally, the concrete was accurately weighed and measured as per requirements.
2.6. Setting Time Test
This test was carried out with reference to ASTM C403 [26]. To analyze mortar, first, sieve a representative portion of fresh concrete to separate the mortar. This mortar is then placed into a container and maintained at a pre-determined ambient temperature. The mortar’s resistance to penetration is periodically tested using standardized needles. By charting the penetration resistance against time, the initial and final setting times of the mortar were established, and the intensity corresponding to the initial setting was 3.5 MPa, and the final setting was 27.6 MPa.
2.7. Compressive Strength Test
To determine the influence of the mixtures of different proportions on compressive strength, specimens of all mix proportions were mixed according to Section 2.2 and formed into 15 cm × 30 cm cylinders, which were hardened via standard curing. Compressive strength tests were carried out with reference to ASTM C39 [27]. The cylinders were placed into a compression tester according to curing ages of 3, 7, 14, 28, 56, 91, and 180 days for compressive strength tests, and the strength was measured and recorded. Three samples were taken for each test, and the test results were discussed on the basis of the average of these three samples.
2.8. Drying Shrinkage Test
Although, it can be anticipated that volume stability will be higher when using FA than cement, the difference in volume stability between using FGCBA and non-ash is unclear and a topic worthy of discussion. Therefore, it was necessary to measure long-term volume stability. The drying shrinkage mold used in this study was a 75 mm × 75 mm × 285 mm steel die, and measurement ages corresponding to day 3, 7, 14, 28, 56, and 91 were considered. Measurements were taken after the instruments were correctly calibrated and according to the conditions specified in reference ASTM C157 [28], that is, a temperature of 23 °C. However, it is difficult to reach 50% humidity considering that the location of the test site was in Taiwan; therefore, the humidity was set to 70%.
2.9. Test of Chloride Penetration Resistance
In this study, a 91-day old specimen was chosen for examination using the ASTM C1202 method [29]. Upon extracting the specimen from the water, any surplus moisture was blotted, and the specimen was immediately placed within a sealed container to ensure the maintenance of at least 95% relative humidity. For the specimen mounting process, a two-part sealant was prepared in a quantity of approximately 20 to 40 g. The sealant was then evenly applied next to the voltage cell body using a trowel after positioning filter paper on the cell screen. Following the application, the filter paper was gently removed, and the specimen was pressed onto the screen, ensuring any excess sealant was neatly addressed at the specimen–cell boundary.
To protect the exposed specimen surface, an impermeable layer such as a rubber or plastic sheet was used. A rubber stopper was then inserted into the fill hole of the cell to minimize any moisture exchange, and the sealant was allowed to cure as per the manufacturer’s instructions. These procedures were replicated on the opposite side of the cell.
Subsequently, the compartment directly above the specimen surface was filled with a 3.0% NaCl solution, and the opposite compartment was filled with a 0.3 N NaOH solution. Lead wires were affixed to the cell’s banana posts and connected to the voltage application and data acquisition system. The test was completed within 6 h, ensuring that the testing process remained succinct and efficient.
2.10. Density, Absorption, and Voids in Hardened Concrete Test
In this study, a 180-day old specimen was chosen for testing according to ASTM C642 [30]. The sample’s dry mass was determined after oven-drying the sample at 100–110 °C and allowing it to stabilize at 20–25 °C in a dry atmosphere, with subsequent mass measurements confirming its dry state. This dry mass, deemed Value A, served as a benchmark for subsequent comparisons. Following this, the sample underwent 48 h of immersion in water at 21 °C, with mass readings taken at 24 h intervals until the increase was less than 0.5%, providing Value B. The immersion process was succeeded by a 5 h boiling period and a 14 h cooling period, after which the surface-dry mass, noted as Value C, was ascertained. The sample’s apparent mass in water, recorded as Value D, was the final step in this sequence, ensuring a thorough evaluation of the material’s density and absorption characteristics. The absorption, bulk density, and voids were determined as follows:
where
Absorption after immersion, % = [(B − A]/A] × 100,
Absorption after immersion and boiling, % = [(C − A)/A] × 100,
Bulk density, dry = [A/(C − D)]·ρ = g1
Bulk density after immersion = [B/(C − D)]·ρ
Bulk density after immersion and boiling = [C/(C − D)]·ρ
Apparent density = [A/(A − D)]·ρ = g2
Volume of permeable pore space (voids), % = (g2 − g1)/g2 × 100,
- A = mass of oven-dried sample in air, g;
- B = mass of surface-dry sample in air after immersion, g;
- C = mass of surface-dry sample in air after immersion and boiling, g;
- D = apparent mass of sample in water after immersion and boiling, g;
- g1 = bulk density, dry, Mg/m3;
- g2 = apparent density, Mg/m3;
- ρ = density of water = 1 Mg/m3 = 1 g/cm3.
3. Results and Discussion
3.1. Pozzolanic Strength Activity Index
The results of the pozzolanic activity index test are shown in Table 5, which indicates that the FGCBA also exhibits a trend of late strength development, albeit not as pronounced as that of FA. Despite a 7-day activity index of only 67.34%, the index at 28 days reached 86.43%, surpassing the minimum requirement of 75% as stipulated by ASTM C618 [31]. This suggests that FGCBA can be effectively incorporated into concrete as a pozzolanic material. Data from 180 days demonstrate that the late-stage pozzolanic activity of the FGCBA can exceed that of Type I cement. Even though its rates of strength gain and development are not as notable as those of FA, it still shows considerable potential for development. This result is similar to that of Cheah et al. [32], who mixed finely ground coal bottom ash with cement.
Table 5.
Pozzolanic strength activity index determined for each material.
3.2. Slump
Based on the data presented in Table 6, the influence of replacing cement with FA and FGCBA on the slump of fresh concrete was investigated across various water–binder (W/B) ratios.
Table 6.
Effect of replacing cement with FA and FGCBA on the slump of fresh concrete.
At a W/B ratio of 0.4, the control mixture without any replacement exhibited a slump of 9 cm, which indicates a relatively stiff consistency. Upon the introduction of FA, the slump increased progressively with each level of replacement, reaching 18 cm at 60% replacement, suggesting an enhancement in workability with a higher FA content. In contrast, FGCBA demonstrated a peak in workability at 20% replacement with a slump of 13 cm but showed a decrease at the 60% replacement level, achieving a slump of 13 cm, possibly due to the different particle sizes and shapes affecting the mix’s consistency.
At a W/B ratio of 0.45, the control mixture without replacement had a slump of 17 cm. Replacing cement with FA and FGCBA resulted in varied effects on slump. FA replacements at 20%, 40%, and 60% yielded slumps of 18 cm, 20 cm, and 21 cm, respectively, indicating a consistent increase in workability. Conversely, FGCBA replacements showed a slump of 18 cm at 20%, decreasing slightly at 40% to 15 cm and then to 13 cm at 60% replacement. This decrease suggests that the FGCBA may have a diminishing effect on the workability of the concrete mix at higher replacement percentages.
For a W/B ratio of 0.5, the control mix without any FA or FGCBA exhibited a slump of 23 cm. FA replacements demonstrated an increasing trend in workability, with the slump reaching 27 cm at a 60% replacement rate. FGCBA, however, presented a different pattern, with the slump starting at 24 cm for a 20% replacement, dropping to 13 cm at 40%, and then slightly increasing to 12.5 cm at 60%. This behavior might be indicative of the varying effects of FGCBA shape on the fresh concrete’s consistency.
In summary, the data suggest that FA generally tends to improve the slump and workability of concrete as the replacement percentage increases across all water–binder ratios. On the other hand, FGCBA shows an initial enhancement of slump at lower replacement levels but a reduction at higher percentages. These findings highlight the potential for FA to be used as a replacement material to enhance workability, whereas FGCBA may require careful consideration in mix design to achieve desired slump properties, especially at higher replacement rates.
3.3. Air Content and Unit Weight of Freshly Mixed Concrete
Analyzing the data from Table 7, the effects of cement replacement with fly ash (FA) and finely ground coal bottom ash (FGCBA) on the air content and unit weight of fresh concrete are presented, taking into account different water–binder (W/B) ratios.
Table 7.
Effect of replacing cement with FA and FGCBA on air content and unit weight of fresh concrete.
At a W/B ratio of 0.4, a unit weight of 2301.81 kg/cm3, featuring an air content of 1%, was recorded for concrete without any replacement. As FA was introduced, there was a slight decrease in unit weight and a corresponding increase in air content with higher percentages of replacement, suggesting that FA contributes to a lighter and more aerated concrete mix. For FGCBA, the unit weight decreased to 2149.29 kg/cm3 at a 60% replacement rate with a lower air content of 1.4%, indicating a more substantial impact on the density and air content compared to FA.
With a W/B ratio of 0.45, the control mix demonstrated a unit weight of 2267.73 kg/cm3 and an air content of 1.2%. The introduction of FA saw a decrease in unit weight across all replacement levels, with the air content rising to 1.8% at 60% replacement. FGCBA replacements exhibited a similar trend in reducing unit weight, with the air content peaking at 1.7% at a 40% replacement rate and then slightly decreasing to 1.6% at 60% replacement. This trend indicates that both FA and FGCBA may contribute to the formation of a lighter concrete mix, with varied impacts on air entrainment.
For the 0.5 W/B ratio, the control mix started at 2235.36 kg/cm3 with an air content of 1.5%. The mixes with FA used as replacement showed a consistent reduction in unit weight, reaching 2133.61 kg/cm3 at 60% replacement, and an increase in air content to 1.8%. The FGCBA mixes followed a comparable pattern, ending at a unit weight of 2097.38 kg/cm3 and an air content of 1.7% at the same replacement level. This suggests that at higher W/B ratios, both FA and FGCBA lead to a more pronounced decrease in unit weight with a modest increase in air content, contributing to a less dense concrete mix with a slightly higher air content.
In conclusion, the data from Table 6 highlight that replacing cement with FA or FGCBA can reduce the unit weight and moderately increase the air content of fresh concrete. The extent of these changes depends on the type of replacement material and the W/B ratio. FA consistently demonstrated an increase in air content with a reduction in unit weight across all W/B ratios. Meanwhile, FGCBA had a variable impact on air content but also contributed to a lighter concrete; this impact was particularly noticeable at higher replacement rates and higher W/B ratios. These findings suggest that both materials can be effectively used to tailor fresh concrete properties for specific structural or construction requirements. Similar results were obtained when using coal bottom ash to replace fine aggregate [33] and cement [34].
3.4. Setting Time
According to Figure 3 and Figure 4, the results in Figure 5 and Figure 6 can be determined using the interpolation method. Based on Figure 5 and Figure 6, we can discuss the effects of FA and FGCBA on the initial and final setting times of concrete across various water–binder (W/B) ratios.
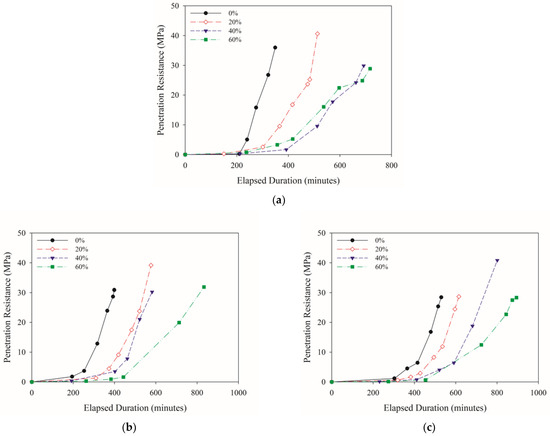
Figure 3.
Influence of various FA replacement ratios on elapsed time and impedance resistance profiles at W/B ratios of (a) 0.4, (b) 0.45, and (c) 0.5.
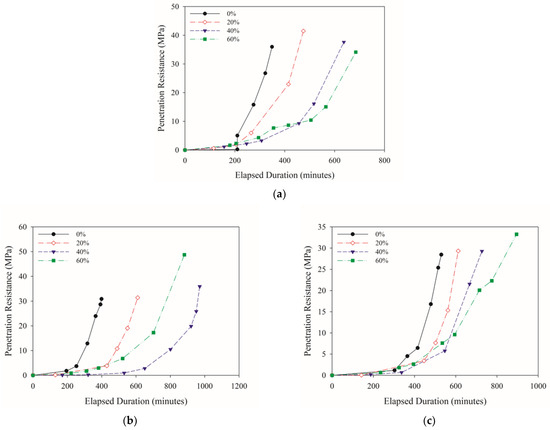
Figure 4.
Influence of various FGCBA replacement ratios on elapsed time and impedance resistance profiles at W/B ratios of (a) 0.4, (b) 0.45, and (c) 0.5.
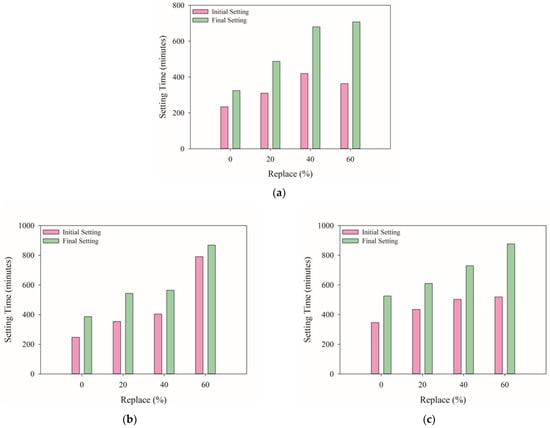
Figure 5.
Effect of different FA replacement ratios on setting time at W/B ratios of (a) 0.4; (b) 0.45; (c) 0.5.
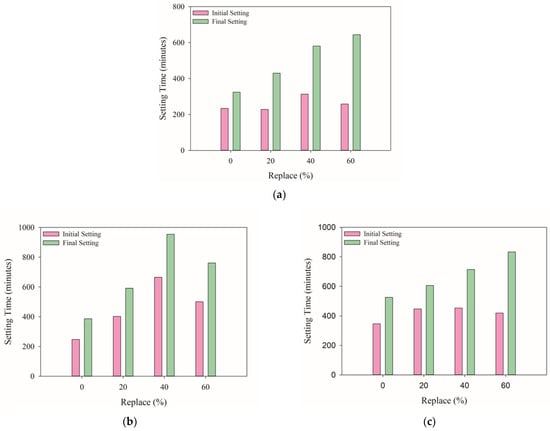
Figure 6.
Effect of different FGCBA replacement ratios on setting time at W/B ratios of (a) 0.4; (b) 0.45; (c) 0.5.
The data indicate that at a W/B ratio of 0.4, the initial setting times for concrete with no replacement (FA or FGCBA) were relatively quick at 233.88 min. However, as the replacement level of FA increased to 40%, the initial setting time significantly rose to 419.82 min, and the final setting time extended to 679.97 min, suggesting a delay in the setting process due to the inclusion of FA. Interestingly, at 60% FA replacement, the initial setting time decreased to 363.39 min, while the final setting time peaked at 707.55 min, which may be indicative of the varying reactivity of FA at different replacement levels. In comparison, FGCBA replacements exhibited a decrease in initial setting time at 20%, followed by an increase at 40% and a decrease at 60%, with final setting times following a generally increasing trend.
At a W/B ratio of 0.45, for FA, the initial setting times increased with the replacement level, with the longest duration recorded at 867.66 min for 60% replacement, which also corresponded to the highest final setting time at 790.16 min. For FGCBA, the initial setting time showed a dramatic increase at 40% replacement, reaching 665.12 min, with the final setting time at a striking 954.48 min. This suggests that the FGCBA may have a significant impact on retarding the setting process, particularly at higher replacement percentages. Interestingly, when the substitution rate of FGCBA was increased to 60%, both the initial and final setting times were shorter than those at 40% substitution rate, which may be related to the pores of FGCBA, which absorbed the excess water and resulted in a faster setting rate.
The patterns were similar when the W/B ratio was raised to 0.5, with FA replacements resulting in an increase in both initial and final setting times, but the increments were not as pronounced as those observed with FGCBA replacements. The final setting times for FGCBA at 40% and 60% replacements were notably high, at 714.10 min and 833.13 min, respectively, which could reflect a substantial retardation effect at these higher replacement rates.
The data from this study reveal that both FA and FGCBA have discernible impacts on the setting times of concrete, with the effects becoming more pronounced as the W/B ratio increases. The inclusion of these materials, especially at higher replacement levels, tends to delay the setting process, which could be beneficial in applications in which extended workability is required. However, the substantial increases in setting times, particularly with FGCBA at higher W/B ratios, may necessitate adjustments in construction scheduling or the use of set accelerating admixtures to offset delays for practical applications.
3.5. Compressive Strength Development
The experimental data presented in Figure 7 and Figure 8 offer a nuanced perspective on the role of supplementary cementitious materials such as FA and FGCBA within the concrete matrix. The interaction between these materials and the hydration process is critical for understanding the mechanical properties of concrete, particularly its compressive strength across various curing times.
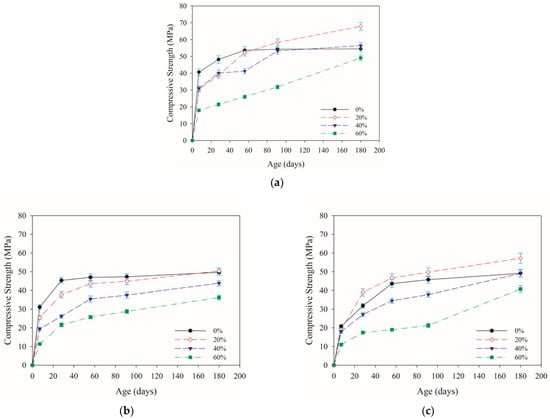
Figure 7.
Compressive strength trends with FA as a cement substitute at W/B ratios of (a) 0.4; (b) 0.45; (c) 0.5.
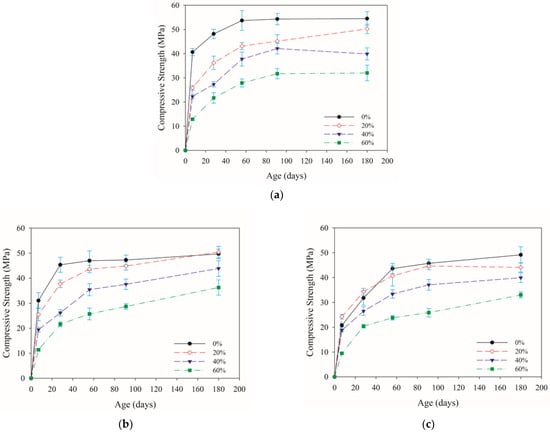
Figure 8.
Compressive strength trends with FGCBA as a cement substitute at W/B ratios of (a) 0.4; (b) 0.45; (c) 0.5.
Starting with a water–binder ratio of 0.4, the control mix without any cement replacement sets a benchmark with a 7-day compressive strength of 40.66 MPa. This establishes a point of comparison for concrete mixes in which cement has been partially replaced. When 20% of cement is substituted with FA, there is an observable decline in early compressive strength, registering 30.53 MPa at 7 days. This initial reduction may be attributed to the slower reactive nature of FA compared to Portland cement. Despite this initial setback, the FA mix exhibits remarkable recovery in the long term, with the compressive strength escalating to 67.89 MPa at 180 days. The data reveal that the pozzolanic reaction of FA, although delayed, continues to contribute to strength gain over time, suggesting its viability for structures for which long-term performance is crucial. Since the pozzolanic activity index test also involves a 20% replacement, it can be observed from Table 5 that with a 180-day activity index at 166.88% and a 7-day activity index at 91.23%, the trend in compressive strength bears a strikingly similar relationship to the activity index.
When the cement replacement level increases to 60% with FA, the early strength at 7 days further drops to 17.93 MPa. This significant reduction could be due to the dilution of cement content, which initially limits the formation of calcium silicate hydrate (C-S-H), the primary strength-contributing phase. However, over time, the pozzolanic action of the FA continues to form additional C-S-H, which is reflected in the considerable strength of 49.14 MPa achieved by 180 days. This indicates that while high volumes of FA can impede early strength, they do not necessarily compromise the long-term strength potential of concrete.
Conversely, mixes with FGCBA as replacement at a 0.4 W/B ratio present a different pattern of strength development. At a 20% replacement level, there is an initial 7-day strength of 25.84 MPa, significantly lower than that of the control mix. The strength gain over time is less pronounced with FGCBA, reaching 50.24 MPa at 180 days which, although representing an increase, is not as substantial as that seen with FA. At a 60% replacement level, the initial strength is markedly low at 12.88 MPa, gradually increasing to 32.04 MPa at 180 days. This modest increase points to the less reactive nature of FGCBA, which may limit its effectiveness in enhancing the long-term strength of concrete.
At a water–binder ratio of 0.45, the influence of cementitious replacements on compressive strength exhibits similar trends but with notable differences in magnitude. The control mix shows an initial 7-day strength of 31.07 MPa, which marginally increases to 49.67 MPa at 180 days. This is indicative of the inherent curing capacity of concrete with this particular W/B ratio. At this ratio, FA replacement at the 20% level starts at 22.88 MPa and impressively increases to 63.87 MPa at 180 days, reaffirming the material’s long-term beneficial effects on strength development. For 60% FA replacement, there is also an increase from a lower initial strength of 14.30 MPa to 46.21 MPa at 180 days.
For FGCBA replacement at a 0.45 W/B ratio, the initial strength is 25.51 MPa at 20% replacement, reaching 50.43 MPa at 180 days. At 60% replacement, the initial strength is only 11.37 MPa, increasing to 36.27 MPa by 180 days. The trend suggests that while FGCBA does contribute to strength development over time, it does so at a reduced rate compared to FA.
Increasing the water–binder ratio to 0.5 offers a broader view of the materials’ performance. The control mix without replacements exhibits an initial strength of 20.78 MPa, ascending to 49.15 MPa over 180 days. When 20% of the cement is replaced with FA, the 7-day strength is lower at 18.92 MPa but undergoes a significant enhancement, reaching 57.19 MPa at 180 days. This robust long-term strength amplifies the efficacy of FA in high W/B ratio mixes, potentially offering an optimized solution for applications requiring a balance between workability and durability.
For FA, 60% replacement at a 0.5 W/B ratio starts with a 7-day strength of 11.00 MPa, which substantially increases to 40.75 MPa by 180 days. Though the initial strength is lower than the control, the significant gain by 180 days demonstrates the potential of high-volume FA mixes in structural applications in which long-term performance is emphasized.
For FGCBA replacement at a 0.5 W/B ratio, 20% substitution results in a 7-day strength of 24.27 MPa, with a 180-day strength of 44.10 MPa. At 60% replacement, the initial strength is 9.49 MPa, showing a considerable rise to 33.02 MPa at 180 days. Although the increase is notable, the overall strength development with FGCBA is less pronounced compared to FA, suggesting its application may be more suitable for scenarios in which moderate strength gains are acceptable. Such results were also found by Wang et al. in their research on high-volume fly ash concrete [35].
In summary, the contrasting roles of FA and FGCBA in the evolution of concrete’s compressive strength can be elucidated from the data. FA exhibits a pronounced impact on long-term strength across all W/B ratios, particularly at lower replacement levels. Despite early strength reductions with higher volumes of FA, the ultimate strength is substantially enhanced, advocating for its use in scenarios in which durability and strength over an extended period are paramount. FGCBA, while beneficial for long-term strength development, shows a more subdued and gradual increase, which may necessitate careful consideration when optimizing for specific performance objectives.
3.6. Drying Shrinkage
The comprehensive data presented in Figure 9 and Figure 10 provide a detailed evaluation of the drying shrinkage behavior in concrete mixes modified with FA and FGCBA at different aging periods. In the analysis of concrete with a W/B ratio of 0.4, it is evident that the inclusion of FA and FGCBA significantly affects the shrinkage characteristics. The shrinkage strain tends to increase with the age of the concrete, which is typical behavior resulting from the progressive loss of moisture over time. At 20% replacement with FA, the strain starts at −32.433 × 10⁻⁶ at day 1 and increases to −713.045 × 10⁻⁶ at day 91, indicating a consistent expansion of the drying shrinkage with time. When the replacement level is increased to 60%, a lower initial value of strain is recorded at −11.258 × 10⁻⁶, but it eventually reaches −1059.861 × 10−6, demonstrating a substantial increase in shrinkage which might be attributed to the higher volume of the porous FA particles contributing to the overall shrinkage of the concrete.
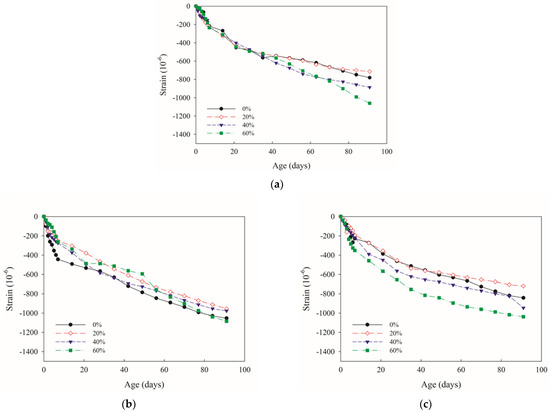
Figure 9.
Drying shrinkage of various proportions with age fort different amounts of FA replacing cement at W/B ratios of (a) 0.4; (b) 0.45; (c) 0.5.
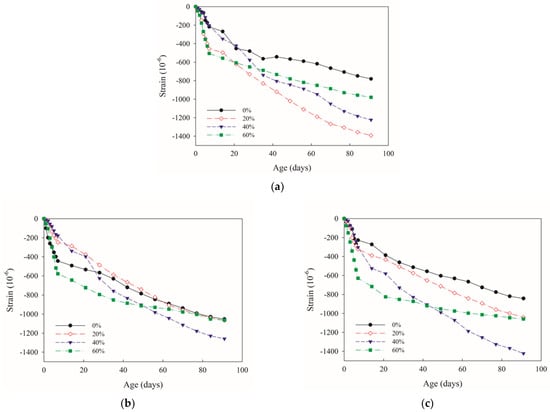
Figure 10.
Drying shrinkage of various proportions with age for different amounts of FGCBA replacing cement at W/B ratios of (a) 0.4; (b) 0.45; (c) 0.5.
The mixes with FGCBA replacements at the same W/B ratio show a trend of comparatively lower initial shrinkage strain than the FA mixes but experience a significant increase over time. For instance, it starts at −32.181 × 10⁻⁶ and escalates to −1391.693 × 10−6 on day 91 for 20% replacement with FGCBA, the highest among all mixes. This suggests that FGCBA might contribute to an increased propensity for drying shrinkage, potentially due to its physical and chemical properties.
At a W/B ratio of 0.45, the shrinkage strain follows a similar pattern, with the FA replacement mixes demonstrating more pronounced long-term shrinkage compared to the control mix. For example, the 20% FA replacement demonstrates an initial strain of −75.757 × 10⁻⁶ which rises to −955.161 × 10⁻⁶ by day 91. Interestingly, at this ratio, the strain values for the 60% FA replacement reveal a somewhat lower final shrinkage of −1084.783 × 10−6 compared to the 20% replacement, suggesting a nonlinear relationship between FA content and drying shrinkage.
With FGCBA, for 20% replacement at a W/B ratio of 0.45, there is an initial shrinkage strain of −8.046 × 10⁻⁶ which escalates to −1066.815 × 10−6 by day 91. It is noticeable that the shrinkage strain tends to be lower in FGCBA mixes than FA mixes at early ages but they converge or exceed as time progresses, indicating a complex interaction between the binder materials and the concrete matrix in terms of moisture movement and internal stresses.
Regarding the mixes with a W/B ratio of 0.5, the control mix starts with an initial strain of −33.275 × 10⁻⁶ and reaches −842.288 × 10⁻⁶ by day 91. The 20% FA replacement mix begins at −19.331 × 10⁻⁶, showing a lower initial shrinkage but a final strain of −720.078 × 10⁻⁶, which is slightly below that of the control. This implies that at higher W/B ratios, the presence of FA could mitigate shrinkage to some degree. In contrast, the 60% FA replacement exhibits a higher rate of shrinkage over time, with the strain reaching −1038.084 × 10−6.
For concrete containing FGCBA, the 20% replacement mix at a W/B ratio of 0.5 starts with a strain of −27.407 × 10⁻⁶, increasing to −1041.909 × 10−6 by day 91. The 60% replacement mix shows a notable increase in shrinkage strain over time, starting at −75.049 × 10⁻⁶ and culminating at −1058.602 × 10−6.
In summary, the data indicate that both FA and FGCBA contribute to the drying shrinkage of concrete, with the extent of their impact varying according to the W/B ratio and the percentage of replacement. The relationship between the replacement material content and the shrinkage strain is complex, with FA generally demonstrating a more consistent pattern of increased shrinkage over time. In contrast, FGCBA exhibits a somewhat variable influence on shrinkage, potentially offering slightly lower initial strains but similar or higher long-term strains compared to FA. This suggests that while the use of these materials can be beneficial for certain properties like long-term strength, their impact on shrinkage must be carefully considered in the mix design to ensure the dimensional stability of concrete structures. In a study by Singh et al., the situation was found to be similar for finely ground coal bottom ash-replaced cement [36].
3.7. RCPT
The RCPT test results are shown in Figure 11. At the W/B ratio of 0.5, concrete samples with 20% FA replacement exhibit a marked improvement in durability, with a total charge passed that is significantly lower than the control mix. This improvement highlights the pozzolanic activity of FA, which results in the refinement of the pore structure and reduced permeability. However, as the FA replacement level increases to 40% and 60%, the total charge passed increases, indicating that there may be an optimal threshold for FA replacement at which durability is maximized without compromising the other properties.
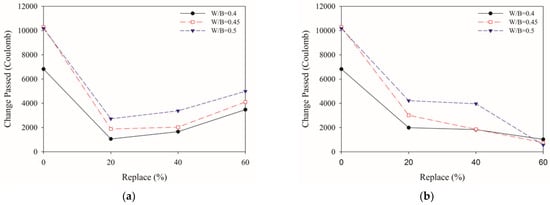
Figure 11.
RCPT at different W/B ratios and cement replacement levels for (a) fly ash; (b) FGCBA.
In contrast, the concrete samples with FGCBA replacements at a W/B ratio of 0.5 present an intriguing trend. With increasing replacement percentages, there is a consistent decrease in the total charge passed which is particularly notable at the 60% replacement level, which suggests that FGCBA may be particularly effective in producing a more impermeable concrete matrix at higher replacement ratios. This could be attributed to the physical characteristics of FGCBA, which may lead to a denser microstructure, thus enhancing the material’s resistance to chloride ion ingress.
When examining the results at a W/B ratio of 0.45, the trend in charge passed for concrete samples with FA replacements shows an initial decrease followed by an increase at the 60% replacement level. The increase in total charge passed at higher FA contents could potentially be due to an imbalance in the pozzolanic reaction kinetics or a limit to the amount of calcium hydroxide available for reaction with FA.
The FGCBA replacements at a W/B ratio of 0.45 again demonstrate their superior performance, with the total charge passed decreasing as the replacement percentage increases. The results indicate that FGCBA might be particularly advantageous for use in concrete when high resistance to chloride penetration is required, making it a promising option for structures exposed to aggressive environments.
At the lower W/B ratio of 0.4, the effectiveness of both FA and FGCBA as cement replacements is reaffirmed in terms of enhancing concrete durability. The samples with FA replacement show a considerable decrease in the total charge passed, suggesting that a lower water content coupled with FA leads to lower permeability. The FGCBA replacements mirror this trend, with even lower total charges passed at higher replacement levels, further underscoring the potential of FGCBA in reducing concrete permeability.
Across all W/B ratios, the decrease in the total charge passed with the incorporation of FA and FGCBA highlights the potential of these materials to significantly enhance the durability of concrete. Although the replacement ratios of finely ground coal-fired bottom ash are different in the study by Argiz et al. [18], the results of the RCPT test are related to the overall proportion of concrete. The RCPT results indicate the better performance of using finely ground coal-fired bottom ash to replace cement compared to pure cement. The results suggest that there are optimal replacement levels for both FA and FGCBA for which the highest resistance to chloride penetration is achieved, which is vital for extending the service life of reinforced concrete structures, especially those susceptible to chloride-induced corrosion. These findings have important implications for the design of durable concrete mixtures in which both sustainability and performance are key considerations.
3.8. Absorption, Density, and Voids in Hardened Concrete
Focusing first on the absorption characteristics after immersion and subsequent boiling, as shown in Figure 12 and Figure 13, a comparison across different water–binder ratios indicates that the absorption capacity of concrete tends to increase with the percentage of cement replacement. For instance, at a W/B ratio of 0.50, samples with no replacement exhibit absorption values of 9% after immersion which slightly increase after boiling. However, with the introduction of FA and FGCBA, there is a discernible increase in absorption, particularly in the samples with higher replacement rates. This suggests that while FA and FGCBA may contribute to a denser microstructure, as evidenced by the lower absorption rates at lower replacement levels, higher concentrations may result in the introduction of more voids or channels that facilitate moisture ingress.
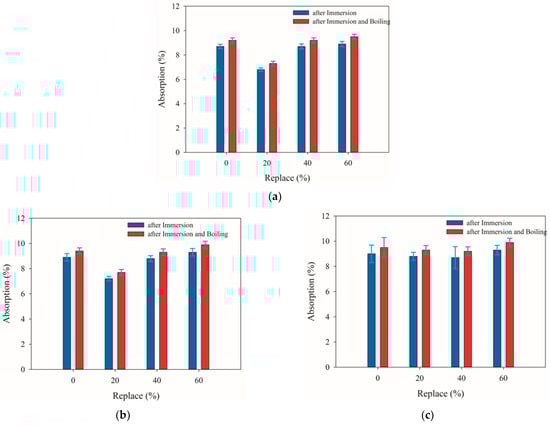
Figure 12.
Water absorption of concrete with FA as cement replacement at different W/B ratios of (a) 0.4; (b) 0.45; (c) 0.5.
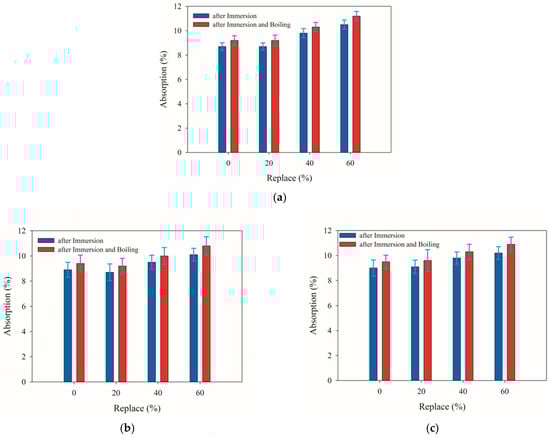
Figure 13.
Water absorption of concrete with FGCBA as cement replacement at different W/B ratios of (a) 0.4; (b) 0.45; (c) 0.5.
Through the bulk and apparent density results, as shown as Figure 14 and Figure 15, it can be seen that the introduction of FA and FGCBA generally leads to a slight decrease in these values compared to the control samples. This reduction could be associated with the lower specific gravity of the replacement materials compared to that of cement. Despite the decrease, the densities remain within a range that suggests the mixes maintain a solid matrix, which is crucial for structural integrity. It is noteworthy that the samples with higher percentages of FGCBA tend to exhibit a more pronounced decrease in density, which could be a factor in the increased absorption seen in these samples.
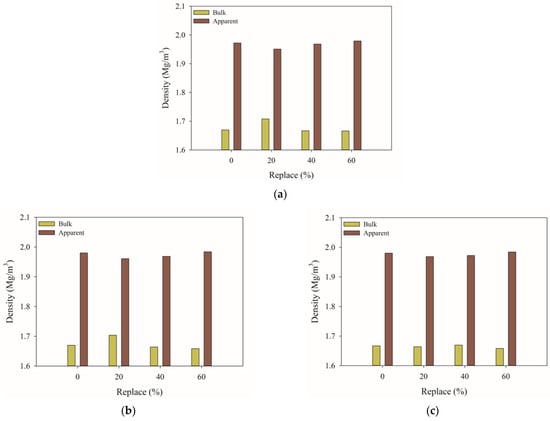
Figure 14.
Density variation in concrete using FA as a cement substitute at various W/B ratios of (a) 0.4; (b) 0.45; (c) 0.5.
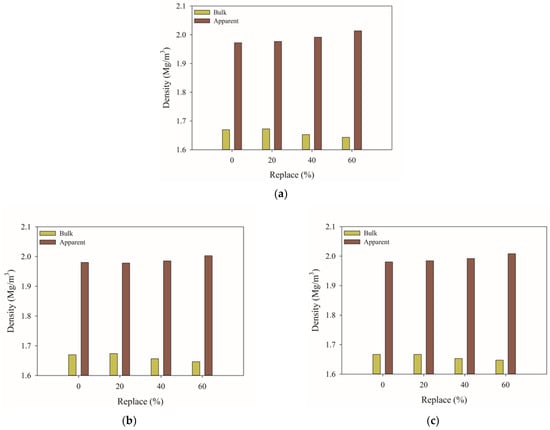
Figure 15.
Density variation in concrete using FGCBA as a cement substitute at various W/B ratios of (a) 0.4; (b) 0.45; (c) 0.5.
The volume of permeable pore space within concrete is a crucial indicator of durability, reflecting the material’s vulnerability to harmful agents. As depicted in Figure 16, increasing amounts of both FA and FGCBA as cement replacements correspond to a rise in voids, a pattern that is especially prominent at the 0.40 water–binder ratio. This elevation in void percentage may heighten the potential for degradation from environmental factors, including freeze–thaw cycles, chemical exposure, and reinforcing steel corrosion.
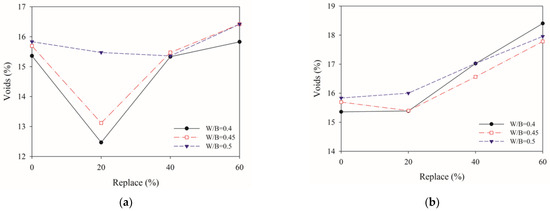
Figure 16.
Voids in concrete at different W/B ratios and cement replacement levels for (a) FA; (b) FGCBA.
At the 0.40 W/B ratio, the void content for the control mix is lower compared to those with replacements. The voids increase from 15.36% to as high as 18.40% as the replacement level of FGCBA rises to 60%. This increase in void content correlates with the absorption data, reinforcing the notion that higher replacement levels can adversely affect concrete’s resistance to the penetration of water and, potentially, chlorides.
The trends observed in the 0.45 and 0.50 W/B ratio mixes are consistent with those at 0.40, suggesting that the relationships between replacement material content, absorption, density, and void content are not significantly altered by changes in the W/B ratio within the tested range. However, it should be noted that the overall absorption values and void content are slightly lower for mixes with W/B ratios of 0.45 and 0.50, indicating that the mix’s ability to resist moisture ingress improves with increasing water content.
In summary, while the use of FA and FGCBA as partial replacements for cement can positively influence certain aspects of concrete’s durability, such as reduced chloride permeability and improved long-term strength, there are trade-offs in terms of increased absorption and void content, especially at higher replacement levels. These findings underscore the importance of optimizing the amount of replacement material to balance benefits against potential drawbacks. Understanding these trade-offs is critical for engineers and material scientists who strive to design concrete mixtures that not only meet structural requirements but also exhibit enhanced durability for a prolonged service life.
4. Conclusions
The findings of this study have high potential for practical application. The use of new pozzolanic materials is crucial for the quality of engineering projects. FA is already an accepted pozzolanic material in ready-mix concrete, and market acceptance is likely to be even higher for FGCBA, which has a similar chemical composition. More importantly, there are limited storage tanks in ready-mix concrete plants, and it was demonstrated in this study that FGCBA can be used in ready-mix concrete by simply adding a water-reducing agent. This enables FA and FGCBA to be co-utilized in the same storage tank without needing to control their proportions before storage.
- (1)
- The study reveals that FGCBA has notable pozzolanic potential, particularly in its ability to surpass ASTM C618 requirements at 28 days and exhibit superior long-term strength compared to Type I cement.
- (2)
- FA enhances workability, evidenced by increased slumps at all tested water–binder ratios. Conversely, the amount of FGCBA used as replacement requires careful consideration in terms of the mix design as it improves workability only up to a 20% replacement level before the slump values decrease.
- (3)
- In terms of air content and unit weight, both FA and coal bottom ash reduce the density of concrete, with FA creating a lighter mix. The impact on air content becomes more pronounced with higher percentages and water–binder ratios.
- (4)
- The setting time is extended through the addition of both materials, which is beneficial for prolonged workability but may necessitate schedule adjustments or the use of admixtures in construction.
- (5)
- FA is particularly effective at enhancing long-term compressive strength, making it suitable for durability and performance needs. FGCBA contributes to gradual strength gains, indicating its appropriateness in applications in which moderate strength development is adequate.
- (6)
- Drying shrinkage is influenced by both materials and varies with water–binder ratios and replacement percentages. FA consistently increases shrinkage over replacement percentages, while the effect of FGCBA is more variable, necessitating careful consideration in the mix design for structural stability.
- (7)
- Chloride permeability tests show that 20% FA replacement optimizes durability by reducing permeability. At higher replacement levels, the effectiveness diminishes. FGCBA significantly improves impermeability, especially at increased replacement percentages, enhancing the material’s potential in durable concrete formulations.
- (8)
- The use of FGCBA as a cement replacement in concrete notably influences its absorption, density, and voids. Higher FGCBA replacement levels lead to increased absorption and void content, suggesting a more porous structure. While enhancing certain durability aspects, these changes highlight the need for careful consideration in mix design, especially at elevated replacement rates, to maintain concrete’s structural integrity and durability.
Author Contributions
Conceptualization, T.-A.C.; methodology, T.-A.C.; validation, T.-A.C.; investigation, C.-W.C.; resources, T.-A.C.; data curation, T.-A.C.; writing—original draft preparation, C.-W.C.; writing—review and editing, T.-A.C. and R.H.; visualization, T.-A.C.; supervision, T.-A.C.; project administration, T.-A.C.; funding acquisition, T.-A.C. All authors have read and agreed to the published version of the manuscript.
Funding
This research was funded by the Ministry of Science and Technology, Taiwan, ROC, under grant MOST 109-2622-E-019-008.
Institutional Review Board Statement
Not applicable.
Informed Consent Statement
Not applicable.
Data Availability Statement
The data presented in this study are available on request from the corresponding author. The data are not publicly available due to Chun-Wei Chuang has not graduated yet.
Conflicts of Interest
Author Tai-An Chen was the founder of the Astray Limited Company. The remaining authors declare that the research was conducted in the absence of any commercial or financial relationships that could be construed as a potential conflict of interest. The authors declare that they have no known competing financial interests or personal relationships that could have appeared to influence the work reported in this paper. Tai-An Chen is employee of Astray Limited Company, who provided funding and teachnical support for the work. The funder had no role in the design of the study; in the collection, analysis, or interpretation of data, in the writing of the manuscript, or in the decision to publish the results.
References
- Sims, R.E.; Rogner, H.H.; Gregory, K. Carbon emission and mitigation cost comparisons between fossil fuel, nuclear and renewable energy resources for electricity generation. Energy Policy 2003, 31, 1315–1326. [Google Scholar] [CrossRef]
- Lu, H.; Wang, C.; Li, Q.; Wiser, R.; Porter, K. Reducing wind power curtailment in China: Comparing the roles of coal power flexibility and improved dispatch. Clim. Policy 2019, 19, 623–635. [Google Scholar] [CrossRef]
- Lin, C.-Y.; Chen, T.-A. Effects of composition type and activator on fly ash-based alkali activated materials. Polymers 2022, 14, 63. [Google Scholar] [CrossRef] [PubMed]
- Bui, M.; Adjiman, C.S.; Bardow, A.; Anthony, E.J.; Boston, A.; Brown, S.; Fennell, P.S.; Fuss, S.; Galindo, A.; Hackett, L.A.; et al. Carbon capture and storage (CCS): The way forward. Energy Environ. Sci. 2018, 11, 1062–1176. [Google Scholar] [CrossRef]
- Xu, Z.; Yu, L.; Lu, B.; Sun, J.; Liu, Z.; Naguib, H.M.; Hou, G. Aragonite formation induced by triethylene glycol and its enhancement to flexural strength in carbonated rankinite cement. Constr. Build. Mater. 2023, 408, 133514. [Google Scholar] [CrossRef]
- Tosti, L.; van Zomeren, A.; Pels, J.R.; Comans, R.N. Technical and environmental performance of lower carbon footprint cement mortars containing biomass fly ash as a secondary cementitious material. Resour. Conserv. Recycl. 2018, 134, 25–33. [Google Scholar] [CrossRef]
- Naik, T.R.; Ramme, B.W.; Kraus, R.N.; Siddique, R. Long-term performance of high-volume fly ash. ACI Mater. J. 2003, 100, 150–155. [Google Scholar]
- Kurda, R.; Silvestre, J.D.; de Brito, J. Toxicity and environmental and economic performance of fly ash and recycled concrete aggregates use in concrete: A review. Heliyon 2018, 4, e00611. [Google Scholar] [CrossRef]
- Oruji, S.; Brake, N.A.; Nalluri, L.; Guduru, R.K. Strength activity and microstructure of blended ultra-fine coal bottom ash-cement mortar. Constr. Build. Mater. 2017, 153, 317–326. [Google Scholar] [CrossRef]
- Mansor, S.; Haron, S.; Joohari, M.I.; Razali, M.; Ramli, R. The effect of utilizing fly ash and bottom ash as a replacement of mineral filler in porous asphalt mixtures. In Proceedings of the IOP Conference Series: Materials Science and Engineering, Batu Pahat, Malaysia, 1–2 December 2020; Volume 1144, p. 012086. [Google Scholar] [CrossRef]
- Singh, N.; Nassar, R.U.D.; Shehnazdeep, K.; Anjani, B. Microstructural characteristics and carbonation resistance of coal bottom ash based concrete mixtures. Mag. Concr. Res. 2021, 22, 515–522. [Google Scholar] [CrossRef]
- Mangi, S.A.; Ibrahim, M.H.W.; Jamaluddin, N.; Shahidan, S.; Arshad, M.F.; Memon, S.A.; Jaya, R.P.; Mudjanarko, W.W.; Setiawan, M.I. Influence of ground coal bottom ash on the properties of concrete. Int. J. Sustain. Constr. Eng. Technol. 2018, 9, 26–34. [Google Scholar] [CrossRef]
- Mangi, S.A.; Ibrahim, M.H.W.; Jamaluddin, N.; Arshad, M.F.; Jaya, R.P. Short-term effects of sulphate and chloride on the concrete containing coal bottom ash as supplementary cementitious material. Eng. Sci. Technol. Int. J. 2019, 22, 515–522. [Google Scholar] [CrossRef]
- MH, W.I.; Hamzah, A.F.; Jamaluddin, N.; Mangi, S.A.; Ramadhansyah, P.J. Influence of bottom ash as a sand replacement material on durability of self-compacting concrete exposed to seawater. J. Eng. Sci. Technol. 2020, 15, 555–571. [Google Scholar]
- Menéndez, E.; Argiz, C.; Sanjuán, M.Á. Reactivity of ground coal bottom ash to be used in Portland cement. J 2021, 4, 223–232. [Google Scholar] [CrossRef]
- Kamal, N.L.M.; Shafiq, N.; Alaloul, W.S.; Beddu, S.; Abd Manan, T.S.B. Application of response surface methodology for the optimization of mix design concrete using coal bottom ash as cement replacement material. In Proceedings of the International Conference on Civil, Offshore and Environmental Engineering, Kuching, Malaysia, 13–15 June 2021; Springer: Singapore, 2021; pp. 396–404. [Google Scholar]
- Khongpermgoson, P.; Abdulmatin, A.; Tangchirapat, W.; Jaturapitakkul, C. Evaluation of compressive strength and resistance of chloride ingress of concrete using a novel binder from ground coal bottom ash and ground calcium carbide residue. Constr. Build. Mater. 2019, 214, 631–640. [Google Scholar] [CrossRef]
- Argiz, C.; Moragues, A.; Menéndez, E. Use of ground coal bottom ash as cement constituent in concretes exposed to chloride environments. J. Clean. Prod. 2018, 170, 25–33. [Google Scholar] [CrossRef]
- Pyo, S.; Kim, H.K. Fresh and hardened properties of ultra-high performance concrete incorporating coal bottom ash and slag powder. Constr. Build. Mater. 2017, 131, 459–466. [Google Scholar] [CrossRef]
- Kim, H.K. Utilization of sieved and ground coal bottom ash powders as a coarse binder in high-strength mortar to improve workability. Constr. Build. Mater. 2015, 91, 57–64. [Google Scholar] [CrossRef]
- ASTM C31-23; Standard Practice for Making and Curing Concrete Test Specimens in the Field. ASTM International: West Conshohocken, PA, USA, 2023.
- ASTM C94-23; Standard Specification for Ready-Mixed Concrete. ASTM International: West Conshohocken, PA, USA, 2023.
- ASTM C311-21; Standard Test Methods for Sampling and Testing Fly Ash or Natural Pozzolans for Use in Portland-Cement Concrete. ASTM International: West Conshohocken, PA, USA, 2021.
- ASTM C143-20; Standard Test Method for Slump of Hydraulic-Cement Concrete. ASTM International: West Conshohocken, PA, USA, 2020.
- ASTM C138-23; Standard Test Method for Density (Unit Weight), Yield, and Air Content (Gravimetric) of Concrete. ASTM International: West Conshohocken, PA, USA, 2023.
- ASTM C403-23; Standard Test Method for Time of Setting of Concrete Mixtures by Penetration Resistance. ASTM International: West Conshohocken, PA, USA, 2023.
- ASTM C39-21; Standard Test Method for Compressive Strength of Cylindrical Concrete Specimens. ASTM International: West Conshohocken, PA, USA, 2021.
- ASTM C157-17; Standard Test Method for Length Change of Hardened Hydraulic-Cement Mortar and Concrete. ASTM International: West Conshohocken, PA, USA, 2017.
- ASTM C1202-22e1; Standard Test Method for Electrical Indication of Concrete’s Ability to Resist Chloride Ion Penetration. ASTM International: West Conshohocken, PA, USA, 2022.
- ASTM C642-21; Standard Test Method for Density, Absorption, and Voids in Hardened Concrete. ASTM International: West Conshohocken, PA, USA, 2021.
- ASTM C618-23e1; Standard Specification for Coal Fly Ash and Raw or Calcined Natural Pozzolan for Use in Concrete. ASTM International: West Conshohocken, PA, USA, 2023.
- Cheah, C.B.; Liew, J.J.; Kevin, K.L.P.; Siddique, R.; Tangchirapat, W. Influence of milling parameters on the properties of ground coal bottom ash and its blended cement. Constr. Build. Mater. 2023, 363, 129745. [Google Scholar] [CrossRef]
- Hamada, H.; Alattar, A.; Tayeh, B.; Yahaya, F.; Adesina, A. Sustainable application of coal bottom ash as fine aggregates in concrete: A comprehensive review. Case Stud. Constr. Mater. 2022, 16, e01109. [Google Scholar] [CrossRef]
- Al Biajawi, M.I.; Embong, R.; Muthusamy, K.; Ismail, N.; Obianyo, I.I. Recycled coal bottom ash as sustainable materials for cement replacement in cementitious Composites: A review. Constr. Build. Mater. 2022, 338, 127624. [Google Scholar] [CrossRef]
- Wang, X.Y.; Park, K.B. Analysis of compressive strength development of concrete containing high volume fly ash. Constr. Build. Mater. 2015, 98, 810–819. [Google Scholar] [CrossRef]
- Singh, N.; Bhardwaj, A. Reviewing the role of coal bottom ash as an alternative of cement. Constr. Build. Mater. 2020, 233, 117276. [Google Scholar] [CrossRef]
Disclaimer/Publisher’s Note: The statements, opinions and data contained in all publications are solely those of the individual author(s) and contributor(s) and not of MDPI and/or the editor(s). MDPI and/or the editor(s) disclaim responsibility for any injury to people or property resulting from any ideas, methods, instructions or products referred to in the content. |
© 2023 by the authors. Licensee MDPI, Basel, Switzerland. This article is an open access article distributed under the terms and conditions of the Creative Commons Attribution (CC BY) license (https://creativecommons.org/licenses/by/4.0/).