Article

A Systematic Decision-Making Approach for Quality Function Deployment Based on Hesitant Fuzzy Linguistic Term Sets

School of Economics and Management, China Jiliang University, Hangzhou 310018, China
*
Author to whom correspondence should be addressed.
Appl. Sci. 2023, 13(24), 13104; https://doi.org/10.3390/app132413104
Submission received: 21 October 2023 / Revised: 2 December 2023 / Accepted: 3 December 2023 / Published: 8 December 2023

Abstract

:
As a powerful tool for improving customer satisfaction, quality function deployment (QFD) can convert customer requirements (CRs) into engineering characteristics (ECs) during product development and design. Aiming to address the deficiencies of traditional QFD in expert evaluation, CRs’ weight determination and ECs’ importance ranking, this paper proposes an enhanced QFD model that integrates hesitant fuzzy binary semantic variables, the Best–Worst Method (BWM), and the Technique for Order Preference by Similarity to an Ideal Solution (TOPSIS). The objective is to determine the prioritization of product engineering characteristics. Indeed, hesitant fuzzy linguistic term sets (HFLTS) have found extensive application in decision-making problems. Compared to other fuzzy language methods, HFLTS offers greater convenience and flexibility in addressing decision-makers’ hesitations and uncertainties. Initially, the combination of hesitant fuzzy linguistic term sets with interval binary tuple language variables is employed to articulate the uncertainty in the assessment information provided by QFD team members. Subsequently, the improved BWM and TOPSIS methods based on HFLTS are used to improve the accuracy of the importance ranking of engineering characteristics by determining the weights of CRs and prioritizing ECs in two stages. Finally, the feasibility and effectiveness of the proposed method are validated through an illustrative example.

1. Introduction

With the intensification of market competition, it is essential for enterprises to expedite the creation of novel products that align with diverse customer requirements to sustain their competitive edge. Quality function deployment (QFD) emerges as a helpful instrument for the development of new products, aiming to accurately capture potential customer requirements (CRs) and transform them into relevant engineering characteristics (ECs) to promote customer satisfaction [1,2]. In addition, implementing QFD reasonably can shorten the product development cycle, reduce product production costs, and improve research and development quality and efficiency [3,4,5]. QFD is not only used in new product development and optimization [1,6], but has also been successfully applied in other aspects of enterprise value creation, such as improving product or service quality [7,8,9] and selecting and evaluating suppliers [4,10].
In the process of applying QFD, the configuration of the house of quality (HOQ) matrix is crucial as it can facilitate the translation of CRs (WHATs) into the corresponding ECs (HOWs) [11]. Typically, building a HOQ involves determining the weights of CRs, the interrelation matrix between WHATs and HOWs, the auto-correlation matrix between HOWs, and the importance ranking of ECs. The prioritization of ECs, a crucial outcome in the QFD planning process, can provide valuable guidance to engineering designers for resource allocation, decision-making, and further QFD analysis [12]. Extensive research has been conducted on QFD theory and application in academia, which has greatly expanded the research scope, perspective, and application fields of QFD. However, with the changing market environment and increasingly heterogeneous customer demands, product development faces various uncertain and fuzzy evaluation information, and the adaptability of traditional QFD methods is limited. This is primarily evident through the following aspects: (1) Traditional QFD requires experts to assess the correlation between CRs and ECs using score coefficients such as 1-3-9 or 1-5-9, but the subjectivity and fuzziness inherent in experts themselves make the evaluation results lack accuracy and reliability [12,13]; (2) The traditional QFD method determines the importance of customer requirements based on customer evaluations, without conducting structured pairwise comparisons of customer requirements [12,14]; and (3) Traditional QFD employs a basic approach of weighted arithmetic mean computation for calculating the significance of ECs, which fails to fully consider the decision-makers preference behaviors [15].
To address these issues, the academic community has conducted a large amount of research on improving the QFD method. On one hand, due to various mutual constraints and dependencies between CRs and ECs, there exist issues such as information fuzziness and data redundancy in the different parts of the House of Quality (HOQ). In addressing problems related to uncertain and imprecise information, Torra introduced the theory of hesitant fuzzy sets (HFSs), which has rapidly gained application and development. As an extension of HFSs, Rodriguez et al. [16] proposed HFLTSs to handle situations in which decision-makers hesitate between several possible linguistic values or when considering richer expressions than a single linguistic term in the assessment of indicators, alternative variables, etc. In comparison to other fuzzy language methods, HFLTSs offer greater convenience and flexibility when managing decision-makers’ hesitation and uncertainty in practical applications, and are more consistent with actual evaluation information when expressing evaluation information [17]. To avoid losing linguistic information in the decision-making process, Martinez and Herrera [18] introduced a binary semantic computing model, which could directly calculate semantic terms, and the results of the set formation and operation often corresponded to the semantically evaluated information defined in advance, ensuring the completeness of the linguistic information. In the early research, Li [19] applied the binary linguistic representation model in a multigranular linguistic context to construct the HOQ. Ko [20] employed a binary linguistic computation technique to create Failure Mode and Effects Analysis (FMEA) utilizing the HOQ framework. Karsak and Dursun [21] amalgamated fuzzy data and binary semantic models within the context of QFD for the determination of supplier selection criteria weights and supplier ratings. Recently, Labella et al. [22] introduced a novel fuzzy linguistic representation model for comparing linguistic expressions. This model capitalizes on the strengths of the binary linguistic representation model to enhance the interpretability and precision of results in the word assignment process, thereby extending the range of comparative linguistic expressions with symbolic translation.
On the other hand, QFD represents a collaborative decision-making approach typically executed by an interdisciplinary team comprising professionals from marketing, design, quality, and production, and may also include customer participation [23]. Therefore, several Multi-Criteria Decision Making (MCDM) techniques have been applied to augment conventional QFD. Chen et al. [24] introduced an innovative integrated MCDM method to improve QFD, employing HFLTS to address fuzziness in the evaluation process. They used fuzzy DEMATEL to determine CRs’ weights and then introduced an extended MULTIMOORA method, combining entropy weighting, to rank ECs. Jin et al. [25] devised an interval-valued spherical fuzzy ORESTE approach, which relied on a three-dimensional HOQ model for EC ranking. Dilshad et al. [26] proposed two new aggregation operators and applied them to develop a systematic approach for handling multi-attribute decision-making (MADM) scenarios involving complex intuitionistic fuzzy data in the context of design. TOPSIS is a commonly used and efficient method in MCDM that comprehensively, reasonably, and accurately ranks various alternatives. Compared to the traditional multivariate statistical analysis methods used for evaluation problems, the TOPSIS method has the advantages of intuitive analytical principles, simple calculations, and low sample requirements. In recent years, it has been successfully applied to address various MCDM problems [27,28]. However, one challenge with the TOPSIS method is the requirement for external attribute weights. In past research, the Analytic Hierarchy Process (AHP) was commonly used to calculate CRs’ weights in QFD. Although pairwise comparisons between attributes ensured comprehensive evaluation, inconsistencies often arise among decision-makers, especially when dealing with a large number of alternative solutions, increasing the complexity of solving MCDM problems. Rezaei [29] introduced the Best–Worst Method (BWM), which reduces the number of pairwise comparisons by establishing a new pairwise comparison structure. This structure only compares the best and worst attributes with others, thereby reducing the inherent inconsistency in pairwise comparisons as the number of alternative solutions increases. As a result, BWM has found extensive application in the decision-making field [30,31]. For instance, Guo and Zhao [32] introduced Fuzzy BWM, an extension of traditional BWM in a fuzzy environment. This method replaces discrete pairwise comparison matrices with linguistic expressions of fuzzy comparative judgments, making it more convenient for decision-makers. Asif and Tabasam [33] extended traditional BWM to uncertain situations and, for multi-criteria decision-making problems, proposed the HFBWM using hesitant fuzzy multiplicative preference relations. The integration of hesitant fuzzy language with MCDM has become a significant improvement direction in addressing multi-objective decision-making problems in QFD.
Based on the above analysis, this paper attempts to propose an improved QFD method in the context of hesitant fuzzy language. The main contributions are summarized as follows. First, the use of HFLTSs can effectively reflect various hesitant and uncertain linguistic expressions of QFD team members, avoiding information loss. This enables QFD team members to use more flexible and rich language to express their subjective judgments more realistically. Second, we propose an improved BWM that incorporates hesitant fuzzy language. In contrast to traditional BWM, which constructs comparison vectors based on precise values, the expert evaluation information expressed by hesitant fuzzy semantic sets is ultimately represented in the form of interval numbers. This representation enhances comparison consistency, resulting in more reliable weights. Third, we introduce an improved TOPSIS method that integrates hesitant fuzzy language. Compared to the calculation based solely on one-dimensional numerical values, the algorithm combining binary semantic information better reflects the real decision opinions of experts. This leads to the more accurate and trustworthy prioritization of ECs, facilitating correct decision-making regarding engineering characteristic planning goals.
The rest of this paper is structured as follows. In Section 2, we provide an introduction to the preparatory knowledge of HFLTS theory and binary semantics. Section 3 presents the QFD framework proposed using the HFLTS-BWM and HFLTS-TOPSIS methods. In Section 4, we illustrate the practical application of the proposed methods through a specific case and conduct a comparative analysis with other relevant QFD approaches. Finally, Section 5 summarizes some conclusions and provides suggestions for future research.

2. Preliminaries

In this section, we will review several ideas concerning Hesitant Fuzzy Linguistic Term Sets (HFLTS) and Binary Linguistic Models to provide a foundation for comprehending the innovations presented in this paper.

2.1. Hesitant Fuzzy Linguistic Term Sets

As an extended form of Hesitant Fuzzy Sets, Rodriguez et al. introduced the concept of HFLTS to address scenarios in which decision-makers are indecisive when selecting suitable linguistic terms for evaluating expressions. In the subsequent text, some fundamental definitions of HFLTS are provided.
Definition 1
[16]. Let S be a linguistic term set, S = s i : i = 0 , 1 , 2 , , g , and HFLTS, H s , be an ordered finite subset of the consecutive linguistic term of S . S can be formulated as follows:
S = s 0 : r e m a r k a b l y   l o w , s 1 : l o w , s 2 :   s l i g h t l y   l o w , s 3 : m e d i u m , s 4 : s l i g h t l y   h i g h , s 5 : h i g h , s 6 : r e m a r k a b l y   h i g h ,
let  ϑ be a linguistic variable, then two hesitant fuzzy sets of different granularity might be H ˜ s ϑ 1 = s 3 , s 4 , s 5 and H ˜ s ϑ 2 = s 3 , s 4 .
Definition 2
[16]. The upper bound and lower bound of the HFLTS are expressed as follows:
H ˜ s + = max s i = s j ,   s i H s   a n d   s i s j i ,
H ˜ s = min s i = s j ,   s i H s   a n d   s i s j i ,
It is assumed that a team of l groups of experts E k = k = 1 , 2 , , l evaluates the linguistic variable item ϑ i i = 1 , 2 , , m . The hesitant fuzzy linguistic term set obtained is H ˜ s k ϑ i . H ˜ s ϑ i and H ˜ s + ϑ i , respectively, stand for the lower and upper bounds of the HFLTS obtained by the l th expert’s evaluation. The min–upper and max–lower operators [27] aggregate expert evaluation information. The steps are as follows:
Step 1: Calculate the optimal semantic evaluation of the HFLTS lower bound set and the worst semantic evaluation of the upper bound set, respectively, as follows.
H ˜ s max ϑ i = max H ˜ s 1 ϑ i , H ˜ s 2 ϑ i , H ˜ s k ϑ i ,
H ˜ s min + ϑ i = min H ˜ s + 1 ϑ i , H ˜ s + 2 ϑ i , H ˜ s + k ϑ i ,
Step 2: Integrate the semantic evaluation information to determine the aggregated result.
s r i , s t i = H ˜ s ϑ i = H ˜ min ϑ i , H ˜ max ϑ i .
where H ˜ max ϑ i = max H ˜ s min + ϑ i , H ˜ s max ϑ i , H ˜ min ϑ i = min H ˜ s min + ϑ i , H ˜ s max ϑ i , and s t i and s r i represent the upper and lower bounds of the semantic interval, respectively.

2.2. The 2-Tuple Linguistic Method

In instances concerning qualitative aspects that prove challenging to evaluate with exact values, this paper introduces the Binary Semantic Model to handle fuzzy linguistic information. This method is a continuous information representation model that can prevent information loss and inadequacy during the aggregation process. To articulate it, the following will introduce binary semantic pairs representing linguistic information and the binary semantic operators used for transforming and aggregating linguistic information.
The expert evaluation information after aggregation expresses a semantic interval number, and this paper adopts a binary semantic word calculation method to convert the semantic interval number into a numerical interval number. The binary semantic calculation process is relatively simple, and the calculation result is more accurate. The primary focus lies in the formulation of a linguistic representation model that encapsulates the decision maker’s linguistic information using 2-tuples s i , α i , s i S and α i 0.5 , 0.5 , where s i denotes the linguistic description of the information, and α i is a numerical value signifying the extent of transformation from the initial outcome β to the nearest index label i within the linguistic term set s i S , a process referred to as symbolic translation.
Definition 3
[34]. Given a semantic evaluation term set S , S = s i : i = 0 , 1 , 2 , , g , s i S is any semantic evaluation term, and its corresponding 2-tuple can be obtained through the conversion function φ as follows:
φ : S S × 0.5 , 0.5 φ s i = s i , 0 ,
Definition 4
[34]. Let S = s i : i = 0 , 1 , 2 , , g  be a linguistic term set and β 0 , g a value that underpins the outcome of the symbolic aggregation operation; the 2-tuple, conveying information equivalent to β , is derived using the following function:
Δ 0 , g S × 0.5 , 0.5 ,
Δ β = s i , α i s i   , i = r o u n d β α i = β i   , α i 0.5 , 0.5   ,
where round denotes the standard rounding operation, s i  signifies the index label closest to the value “ β ”, and “ α ” represents the symbolic translation value.
Conversely, let s i , α i be a 2-tuple; there always exists a function Δ 1 that, when applied to a 2-tuple, yields its corresponding numerical value β 0 , g and the following function is considered:
Δ 1 : S × 0.5 , 0.5 0 , g ,
Δ 1 s i , α i = i + α i = β .

3. Proposed QFD Approach

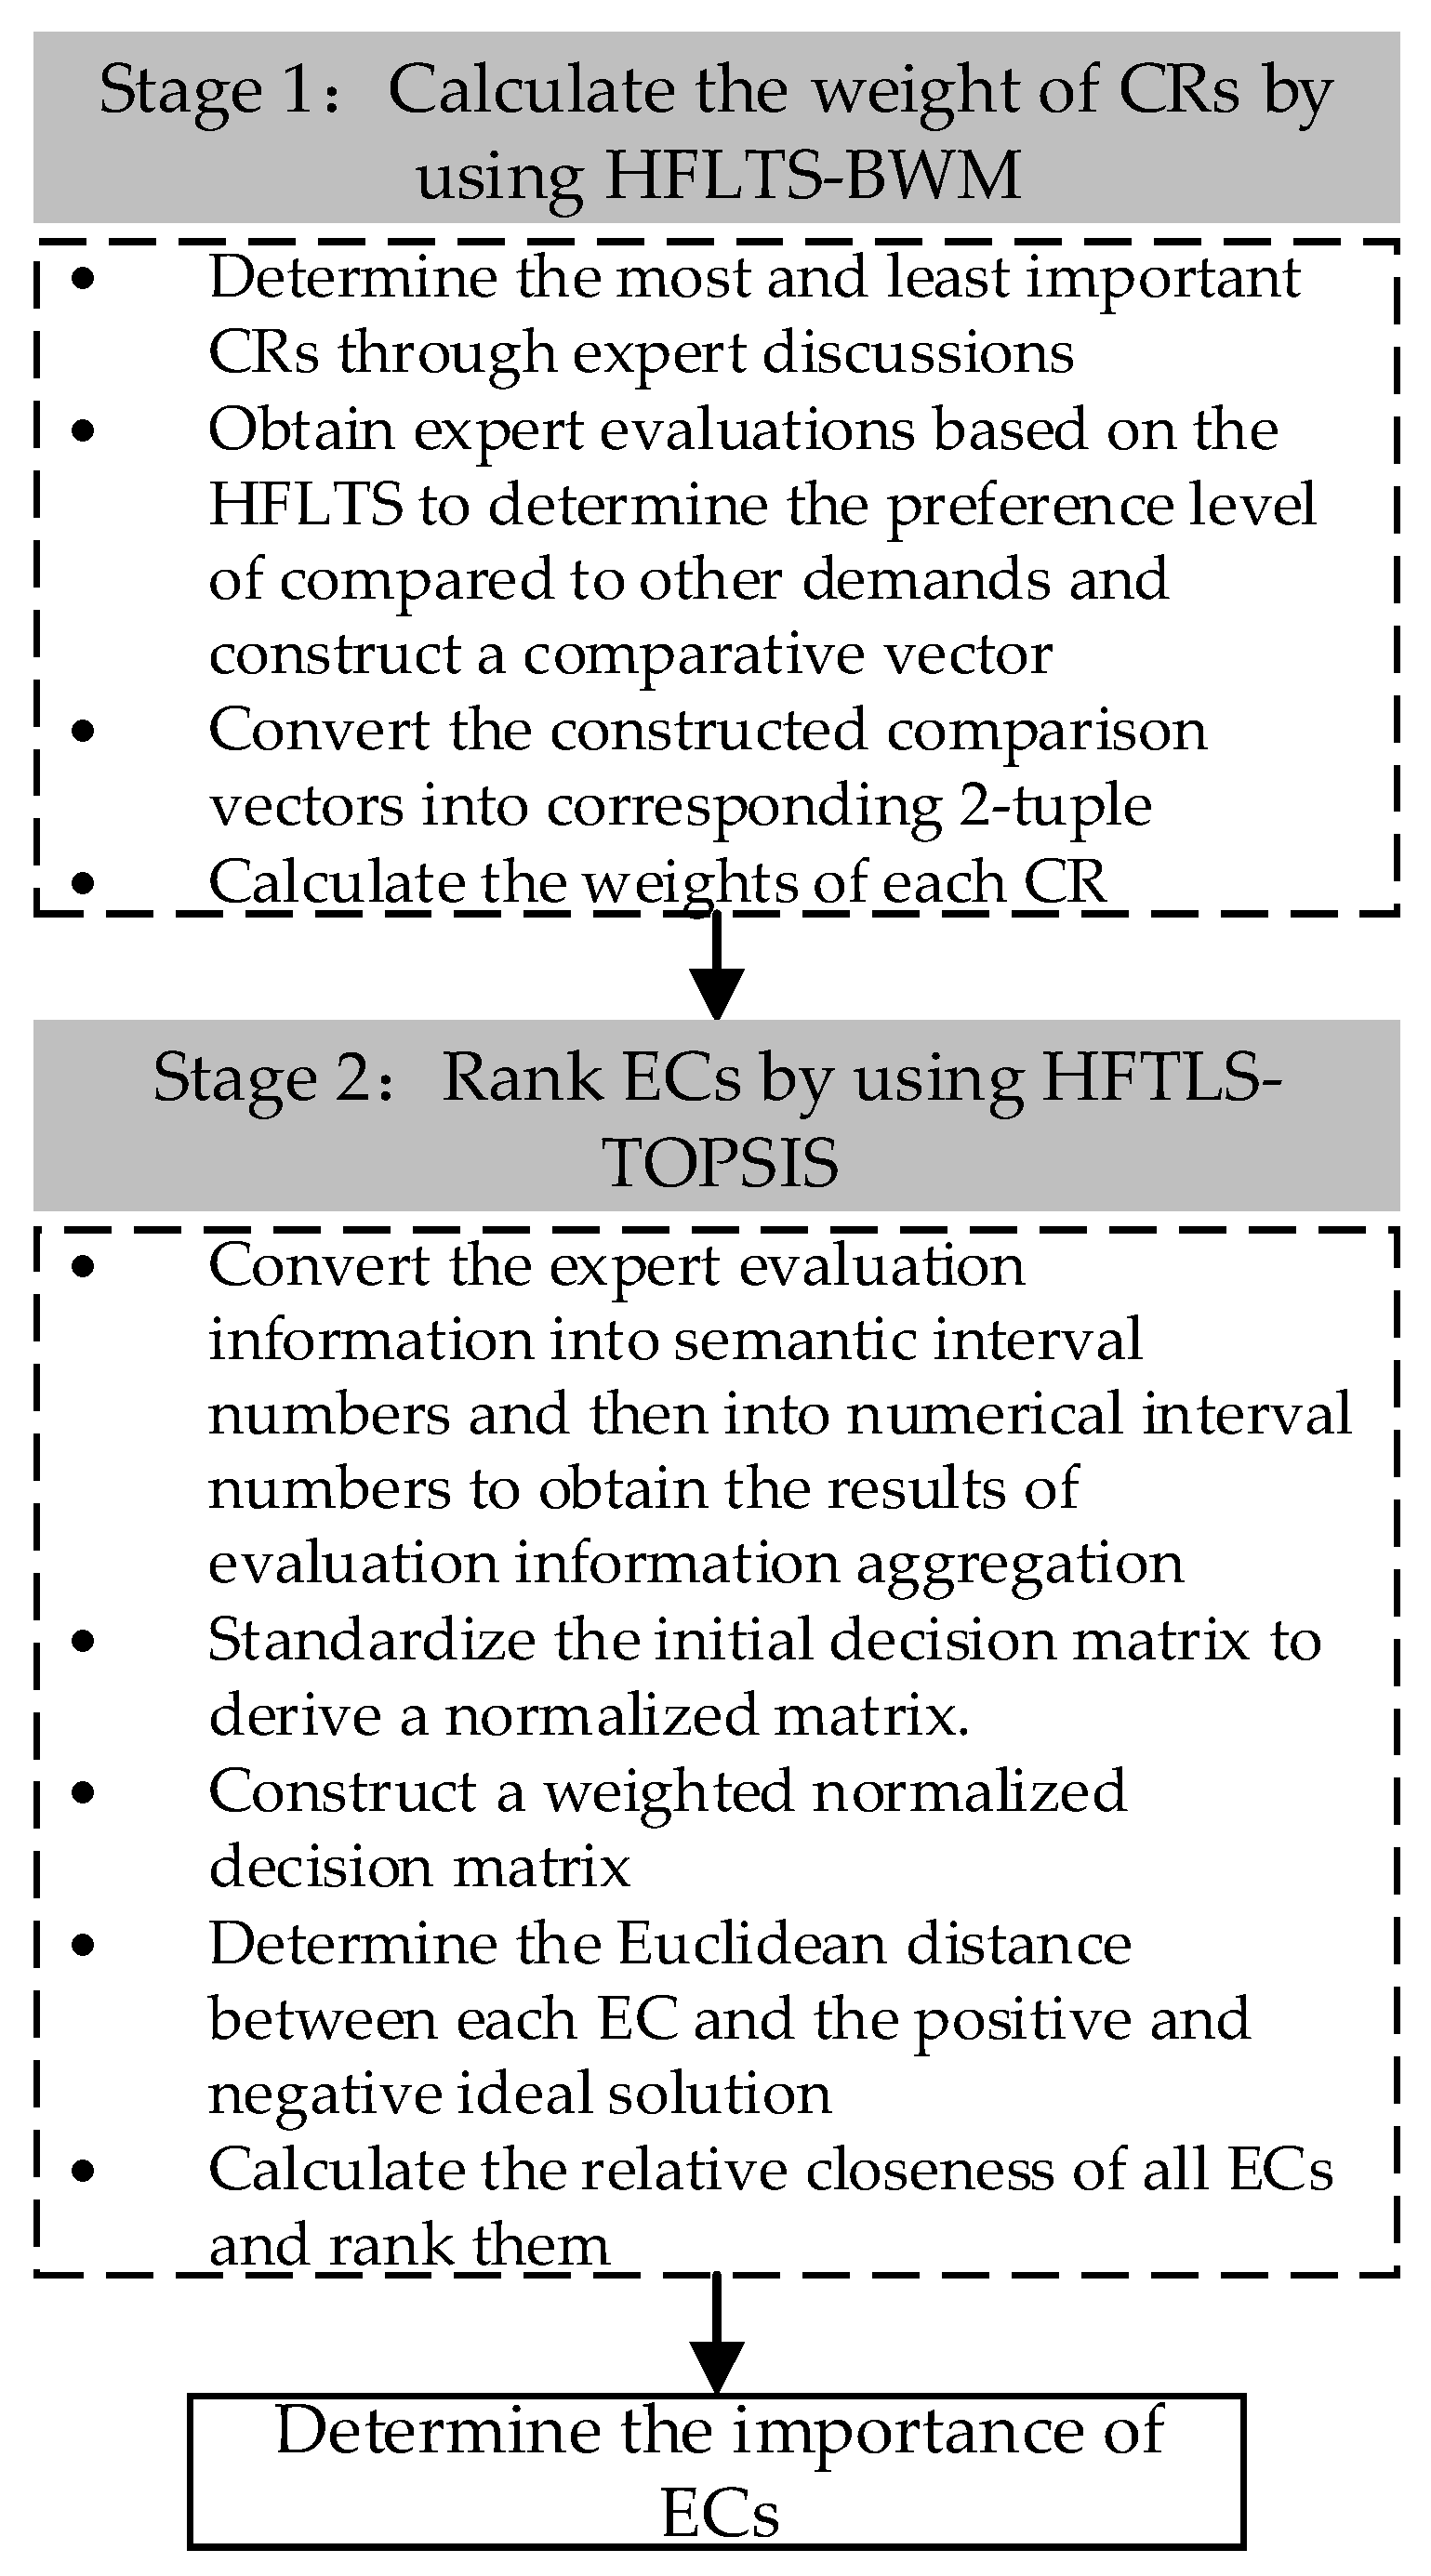
In this section, we propose a comprehensive analytical model that combines hesitant 2-tuple linguistic term sets, an improved version of the BWM and the TOPSIS. To summarize, the QFD approach presented in this study comprises two primary stages: the first stage involves using the HFLTS-BWM method to calculate the relative weights of CRs, and the second stage involves using HFLTS-TOPSIS to determine the priority ranking of ECs. The detailed steps of the proposed new QFD method are illustrated in the figure below. The analytical processes for the two stages of QFD will be further elaborated in the following subsections. The Figure 1 presents the flowchart of the proposed method.

3.1. Determine the Weights of CRs Based on HFLTS-BWM

The Best–Worst Method (BWM), proposed by Rezaei [29], takes into account pairwise comparison matrices. It determines the best and worst attributes through expert discussions and compares them with other attributes. The entire process only requires 2 n 3 times, simplifying the evaluation process while reducing errors and yielding more reliable results. In this paper, hesitant fuzzy linguistic term sets are introduced in combination with traditional BWM, allowing experts to evaluate customer needs using multiple semantics simultaneously. The calculation of the weights of CRs in HFLTS-BWM differs from traditional BWM in that traditional BWM constructs comparison vectors using precise values and uses mathematical programming models to obtain optimal weights, whereas HFLTSs represent expert assessment data as interval numbers, necessitating an extension of the current foundation for building a novel model to address interval weight vectors. The detailed procedure unfolds as follows:
Step 1. In the customer demand set C 1 , C 2 , C 3 , , C n , determine the most critical and least essential customer demands based on the opinions of both customers and experts, denoted as C B and C W , respectively.
Step 2. Obtain expert evaluations based on the hesitant fuzzy linguistic set to determine the preference level of C B compared to other demands C j , and construct a comparative vector A B = a B 1 , a B 2 , , a B n , where a B j j = 1 , 2 , , n represents the degree of preference of C B compared to C j . Similarly, the preference level of C j compared to C W is determined for all other demands, and a comparative vector A W = a 1 W , a 2 W , , a n W is constructed, where a j W j = 1 , 2 , , n represents the degree of preference of C j compared to C W .
Step 3. Convert the constructed comparison vectors into corresponding 2-tuple using Formula (6), and then convert the 2-tuple information into corresponding numerical values according to Formulas (9) and (10), obtaining comparison vectors H A B and H A W :
H A B = a B 1 L , a B 1 U , a B 2 L , a B 2 U , a B n L , a B n U ,
H A W = a 1 W L , a 1 W U , a 2 W L , a 2 W U , a n W L , a n W U ,
where a B j L . a B j U signifies the level of preference of C B compared to other demands C j , and a j W L . a j W U signifies the level of preference of other demands C j compared to C W .
Step 4. Calculate the weights of each CR. Based on the following model [35], apply Lingo to obtain the interval weight vector w ¯ j = w ¯ 1 L , w ¯ 1 U , w ¯ 2 L , w ¯ 2 U , , w ¯ n L , w ¯ n U :
  min ξ s . t . w B L w j U a B j L ξ ,   w B U w j L a B j U ξ w j L w W U a j w L ξ ,   w j U w W L a j W U ξ w k L + j = 1 , j k n w j U 1 w k U + j = 1 , j k n w j L 1 0 w j L w j U , j = 1 , 2 , , n
The proposed approach uses the idea of combined weights to construct the following optimization model to obtain the best weight w j * that minimizes the deviation of the interval weight:
min Z = j = 1 n w j * w ¯ j L 2 + w j * w ¯ j U 2 s . t .   j = 1 n w j * = 1   ,     j = 1 , 2 , , n
The optimal weight w j * = w 1 * , w 2 * , , w n * and ξ * for customer demand C 1 , C 2 , C 3 , , C n are obtained by applying the above model.
Finally, the results of the improved BWM method need to be subjected to consistency analysis, the formula for which is
C R = 1 2 ξ δ * L + ξ δ * U
where δ * U = max j = 1 , 2 , , n a B j U max j = 1 , 2 , , n a B j U + max j = 1 , 2 , , n a B j L + 1 4 + 1 2 , and δ * L = max j = 1 , 2 , , n a B j U 2 max j = 1 , 2 , , n a B j U + 1 4 + 1 2 . For different a B W , the acceptable range of consistency is 0~0.15 [36]. The lower the value is, the higher the reliability of the calculation results becomes.

3.2. Determining the Ranking of ECs Based on HFLTS-TOPSIS

In the QFD analysis, it is assumed that there are m engineering characteristics of a product, which form a set A = A 1 , A 2 , , A m , and there are n customer requirements, represented as C = C 1 , C 2 , C 3 , , C n . The improved BWM method in the previous section calculates the corresponding CRs weights. A team of l groups of experts E k k = 1 , 2 , , l is asked to evaluate the relationship between CRs and Ecs based on the semantic term set S = s i : i = 0 , 1 , 2 , , g and use hesitant fuzzy language to express the evaluation results. In this study, we implement the TOPSIS to compute the relative proximity coefficient for each EC and rank Ecs based on the closeness coefficient’s magnitude. The detailed procedure is outlined below.
Step 1. Let x ˜ i j k represent the evaluation of expert E k on the correlation between CRs and Ecs. Use Formulas (3) to (5) to convert the expert evaluation information into semantic interval numbers, and then use the 2-tuple calculation method to convert the semantic interval numbers into numerical interval numbers a ˜ i j according to Formulas (9) and (10). Establish the initial decision matrix X ˜ based on the numerical interval numbers a ˜ i j = x i j , u i j from the expert evaluation results:
X ˜ = a ˜ i j = x ˜ 11 , u ˜ 11 x ˜ 12 , u ˜ 12 x ˜ 1 n , u ˜ 1 n x ˜ 21 , u ˜ 21 x ˜ 22 , u ˜ 22 x ˜ 2 n , u ˜ 2 n x ˜ m 1 , u ˜ m 1 x ˜ m 2 , u ˜ m 2 x ˜ m n , u ˜ m n ,
where i = 1 , 2 , , m ;   j = 1 , 2 , , n .
Step 2. Utilize equation (16) to normalize the initial decision matrix and derive the standardized matrix denoted as X ¯ .
x ¯ i j m × n = 2 x i j i = 1 m x i j + i = 1 m u i j ,   u ¯ i j m × n = 2 u i j i = 1 m x i j + i = 1 m u i j ,
X ¯ = a ¯ i j = x ¯ 11 , u ¯ 11 x ¯ 12 , u ¯ 12 x ¯ 1 n , u ¯ 1 n x ¯ 21 , u ¯ 21 x ¯ 22 , u ¯ 22 x ¯ 2 n , u ¯ 2 n x ¯ m 1 , u ¯ m 1 x ¯ m 2 , u ¯ m 2 x ¯ m n , u ¯ m n ,
where i = 1 , 2 , , m   ;   j = 1 , 2 , , n .
Step 3. Construct a weighted normalized decision matrix X ^ and calculate the product of the customer demand weights and matrix x ¯ according to Formula (18):
x ^ i j = x ¯ i j × w j * ,   u ^ i j = u ¯ i j × w j * ,
X ^ = a ^ i j = x ^ 11 , u ^ 11 x ^ 12 , u ^ 12 x ^ 1 n , u ^ 1 n x ^ 21 , u ^ 21 x ^ 22 , u ^ 22 x ^ 2 n , u ^ 2 n x ^ m 1 , u ^ m 1 x ^ m 2 , u ^ m 2 x ^ m n , u ^ m n ,
Step 4. Define the positive and negative ideal solutions, respectively, as follows:
A + = x 1 + , u 1 + , x 2 + , u 2 + , , x n + , u n + ,
A = x 1 , u 1 , x 2 , u 2 , , x n , u n ,
where x j + = max 1 i m x ^ i j , u j + = max 1 i m u ^ i j , x j = min 1 i m x ^ i j , and u j = min 1 i m u ^ i j .
Step 5. Determine the Euclidean distance between each EC and the positive and negative ideal solutions by applying Formulas (21) and (22):
D A i , A + = 1 2 j = 1 n x ^ i j x j + 2 + u ^ i j u j + 2 ,
D A i , A = 1 2 j = 1 n x ^ i j x j 2 + u ^ i j u j 2 ,
Step 6. Compute the relative proximity coefficient for all ECs concerning the positive ideal solution and rank the values from largest to smallest:
S i = D A i , A D A i , A + D A i , A +         i = 1 , 2 , , m .

4. Case Study

To showcase the efficacy and suitability of the presented QFD approach, this section presents a concise summary of a case study involving the utilization of QFD analysis for market segmentation evaluation and selection [37]. Additionally, a comparative examination is carried out in conjunction with other established QFD methods to highlight its superior performance.

4.1. Background

In a fiercely competitive market, market segmentation selection is a significant marketing activity for companies. Due to the multi-dimensional characteristics of market segmentation, QFD furnishes a robust structure for assessing and opting for market segments. To enhance the corporation’s presence in both local and global markets, it’s crucial for management to pinpoint the optimal market segment, ensuring profit maximization. First, a team of five groups of experts E k k = 1 , 2 , , 5 is assembled to undertake the QFD analysis. Through market research and expert interviews, market segmentation features (CRs) are identified as the segment growth rate ( C 1 ), expected profit ( C 2 ), competition intensity ( C 3 ), required capital ( C 4 ), and technology utilization level ( C 5 ). The company’s business advantages (ECs) are selected as relative cost position ( A 1 ), delivery reliability ( A 2 ), technology position ( A 3 ), and management strength and depth ( A 4 ). To facilitate illustration, we assess the relationship between CRs and ECs using unstructured expressions from a seven-point linguistic term set S :
S = s 0 : r e m a r k a b l y   l o w , s 1 : l o w , s 2 :   s l i g h t l y   l o w , s 3 : m e d i u m , s 4 : s l i g h t l y   h i g h , s 5 : h i g h , s 6 : r e m a r k a b l y   h i g h .
Using hesitant fuzzy linguistic sets for evaluation, the four features can be defined as benefit indicators, meaning that the higher the value, the better the evaluation. Similarly, for C 4 , where the lower the required capital, the better the evaluation; this feature is defined as a cost-type indicator, signifying that a lower value corresponds to a more favorable assessment.

4.2. Implementation

4.2.1. Calculating Weights of CRs Using the HFLTS-BWM Method

By synthesizing customers’ and experts’ opinions, the most important feature is determined as the growth rate of the segments ( C 1 ), and the least important feature is the level of technical utilization ( C 5 ). Hesitant fuzzy linguistic sets are used to evaluate the comparisons between CRs. The evaluation information provided by the five groups of experts are shown in Table 1, Table 2, Table 3, Table 4 and Table 5, where each element represents the degree of superiority or inferiority of other features compared to features C 1 and C 5 . For example, the comparison result s 1 , s 2 between C 2 and the most important feature C 1 represents a hesitant fuzzy set indicating that C 1 is lower and slightly lower than C 2 , respectively. The evaluation information from five expert groups is consolidated using Formulas (3) to (5), and the results are shown in Table 6. Finally, by employing the 2-tuple approach in conjunction with Equations (9) and (10), the semantic interval figures are converted into numerical interval values, and the outcomes are presented in Table 7.
Based on the data in Table 7, the interval weight vector is solved using Lingo with a mathematical model (13). Then, the weight interval values are converted to precise numerical values using model (14) to compute the most favorable weights for the CRs, which are found to be w * = (0.227, 0.139, 0.225, 0.344, 0.065) and ξ * = 0.417. In addition, a B W = [4, 6], and the consistency ratio is calculated to be 0.133 < 0.15, which is acceptable according to Formula (15).

4.2.2. Ranking ECs Using the HFLTS-TOPSIS Method

In the second stage, the expert team evaluated four company business advantage types (ECs) based on five market segmentation features (CRs) using hesitant fuzzy sets to represent the evaluation results. The evaluation information from the QFD team regarding the relationship between CRs and ECs is presented in Table 8. Subsequently, the evaluations from each group of experts are aggregated, as shown in Table 9. Table 10 shows the results of the evaluation information aggregation in the form of a numerical interval representation.
The obtained expert evaluation information in numerical interval form (Table 10) is used as the initial decision matrix. The decision matrix is normalized using Formula (17), and the results are presented in Table 11. The standardized decision matrix is weighted using Formula (19), and the results are shown in Table 12.
Initially, we derive the positive and negative ideal solutions utilizing Formulas (21) to (25). Subsequently, we compute the Euclidean distance between each solution and the positive and negative ideal solutions, resulting in the relative closeness coefficient for each solution. The solutions are then sorted in descending order of their relative closeness coefficient. The results are shown in Table 13.
It is easy to see that S 1 > S 3 > S 2 > S 4 , i.e., A 1 is the optimal solution. Therefore, for this case, the top priority when choosing the best market segmentation should be assigned to A 1 , representing the most critical company business advantage, followed by A 3 , A 2 , and A 4 in descending order of importance.

4.3. Comparisons

In this section, to validate the effectiveness of the proposed QFD method, it is compared and analyzed against traditional QFD, fuzzy QFD [38], and an extended linguistic QFD method based on discrete numbers [39] on the same issue of market segmentation assessment. Table 14 displays the results of the ranking results of ECs obtained through these four methods. The implementation details of the traditional QFD method are omitted here. Next, we will only describe the application processes of the fuzzy QFD and the linguistic QFD methods.
For the Fuzzy QFD method, a panel of five decision-makers is assembled to analyze the correlation between CRs and ECs, and the used linguistic rating set is U = {VL, L, M, H, VH}, where VL = Very Low = (0.0, 0.1, 0.2), L = Low = (0.1, 0.3, 0.5), M = Medium = (0.4, 0.5, 0.7), H = High = (0.5, 0.7, 0.9), and VH = Very High = (0.8, 0.9, 1.0). The fuzzy evaluations provided by the experts are shown in Table 15. After converting them into fuzzy numbers, the fuzzy values for the weights of each “HOW” attribute are obtained by averaging the total weighted correlation scores with the total weights of “WHAT”, and then they are ranked based on the importance weights of “HOWs”.
For the linguistic QFD method, a decision-making team consisting of three members is established. The three decision-makers compared the four alternatives ( x i ( i = 1 , 2 , 3 , 4 ) ) using the linguistic term set T, where T = { t 1 = extremely poor, t 2 = very poor, t 3 = poor, t 4 = slightly poor, t 5 = fair, t 6 = slightly good, t 7 = good, t 8 = very good, t 9 = extremely good}, and constructed linguistic preference relations R k ( k = 1 , 2 , 3 ) , respectively, as shown in Table 16, Table 17 and Table 18. To determine the optimal alternative, two new aggregation operators are developed, which can be used to aggregate preference information in the form of linguistic variables. Based on the LGA and LHGA operators, the preference degrees of each alternative relative to the others can be obtained, facilitating the ranking process.

4.4. Discussion

According to Table 14, it is evident that the ranking of the importance of the ECs obtained by the QFD model proposed in this paper is consistent with the rankings obtained by traditional QFD, fuzzy QFD, and linguistic QFD methods. This to some extent verifies the accuracy and effectiveness of the QFD method proposed in this paper. However, compared with traditional QFD and its improved methods, the QFD method proposed in this paper has the following advantages:
  • The use of HFLTSs can effectively reflect various hesitant and uncertain linguistic expressions of QFD team members, avoiding information loss. This enables QFD team members to use more flexible and rich language to express their subjective judgments more realistically;
  • An improved BWM method based on hesitant fuzzy language is proposed, in which the use of linguistic variables for reference comparison of alternatives and criteria is more valuable than the use of clear values in the decision-making process, and combined with 2-tuple, the evaluation information is ultimately expressed in the form of interval numbers, which has a higher comparative consistency, and thus the weights obtained are more reliable;
  • The improved TOPSIS method combining hesitant fuzzy language and 2-tuple is proposed. Compared with the calculation of the one-dimensional numerical value, the algorithm combined with a 2-tuple better reflects the real decision-making opinions of experts, which makes the ranking of the importance of engineering characteristics more accurate and credible. And it is conducive to the correct decision-making for the planning objectives of engineering characteristics.
However, it is necessary to acknowledge the research limitations of this work. Firstly, the use of hesitant fuzzy language may involve a certain degree of subjectivity and semantic uncertainty. Differences in the understanding of fuzzy terms among QFD team members may exist. Therefore, when constructing HFLTSs, it is important to consider these subjective differences, which could lead to model inconsistency. Secondly, the BWM method involves subjective judgments in weight allocation, and expert judgments may influence the final results, particularly in weight distribution, introducing subjectivity and inconsistency. Similarly, TOPSIS may introduce a degree of subjectivity when defining ideal and negative-ideal solutions. Thirdly, the validation of this method is based on a comparative analysis of selected cases in market segmentation assessment, which may not fully capture the complexity and diversity of real-world scenarios. Dealing with hesitant fuzzy language in real-world situations may require more complex mathematical calculations and models, potentially increasing computational complexity. This could pose a challenge, especially in large-scale and real-time applications, given limited resources.

5. Conclusions

To address the constraints inherent in conventional QFD methods, this paper proposed combining HFLTS-BWM and HFLTS-TOPSIS into the QFD process for product planning and development in hesitant fuzzy environments. HFLTSs are an effective tool for expressing human decision-making hesitation, which serves to capture the variety and vagueness inherent in subjective assessments provided by QFD team members. The interval 2-tuple linguistic model is used to process the obtained language evaluation information, which can effectively mitigate the risk of information loss and distortion during linguistic computations. Specifically, the HFLTS-BWM method is used to analyze the interrelationships between CRs and determine the weights of CRs, while the HFLTS-TOPSIS method evaluates the correlation between CRs and ECs and accurately ranks ECs. Ultimately, the efficacy and relevance of the proposed QFD model are demonstrated by taking the issue of market segmentation evaluation and selection as an example, and the resulting outcomes are then juxtaposed with those generated by alternative QFD techniques.
In response to the potential limitations and challenges of the proposed method, future research could focus on the following aspects. First, while the proposed analytical approach employs uniformly and symmetrically distributed linguistic term sets to handle QFD team members’ expressions, experts may sometimes use the unbalanced linguistic term sets [40] or the linguistic term sets with different levels of uncertainty granularity [41,42] to convey their opinions. Therefore, future work should extend the QFD approach outlined in this paper to accommodate unbalanced languages or linguistic environments with multiple granularities. Second, future research could consider adopting more objective and systematic approaches to address the issue of subjective judgments by experts. This might involve incorporating multiple experts, using weighted averages to mitigate the impact of individual expert subjectivity, or exploring data-driven methods to determine weights and ideal solutions. Third, to assess the applicability of the proposed method in different application domains, future research can enhance the reliability of the method through validation with a broader range of real-world cases and domains. Additionally, consideration should be given to introducing more evaluation criteria for a comprehensive assessment of method performance. Lastly, exploring more efficient computational models to handle fuzzy language and reduce computational complexity is crucial. Real-time data and analysis could be introduced to enable QFD to respond more rapidly to market changes. Combining real-time learning algorithms from the field of artificial intelligence could facilitate a more dynamic and adaptive decision-making process [43].

Author Contributions

Writing—original draft, S.C.; Writing—review and editing, Y.Z. and J.G. All authors have read and agreed to the published version of the manuscript.

Funding

This research received no external funding.

Institutional Review Board Statement

Not applicable.

Informed Consent Statement

Not applicable.

Data Availability Statement

The data presented in this study are available in reference [37].

Acknowledgments

The authors would like to express sincere gratitude to School of Economics and Management of China Jiliang University.

Conflicts of Interest

The authors declare no conflict of interest.

References

  1. Ji, P.; Jin, J.; Wang, T.; Chen, Y. Quantification and integration of Kano’s model into QFD for optimising product design. Int. J. Prod. Res. 2014, 52, 6335–6348. [Google Scholar] [CrossRef]
  2. Peng, J.-G.; Xia, G.; Sun, B.-Q.; Wang, S.-J. Systematical decision-making approach for quality function deployment based on uncertain linguistic term sets. Int. J. Prod. Res. 2018, 56, 6183–6200. [Google Scholar] [CrossRef]
  3. Ocampo, L.A.; Labrador, J.J.T.; Jumao-as, A.M.B.; Rama, A.M.O. Integrated multiphase sustainable product design with a hybrid quality function deployment—Multi-attribute decision-making (QFD-MADM) framework. Sustain. Prod. Consum. 2020, 24, 62–78. [Google Scholar] [CrossRef]
  4. Carnevalli, J.A.; Miguel, P.C. Review, analysis and classification of the literature on QFD—Types of research, difficulties and benefits. Int. J. Prod. Econ. 2008, 114, 737–754. [Google Scholar] [CrossRef]
  5. Wang, Z.; Fung, R.Y.K.; Li, Y.-L.; Pu, Y. An integrated decision-making approach for designing and selecting product concepts based on QFD and cumulative prospect theory. Int. J. Prod. Res. 2017, 56, 2003–2018. [Google Scholar] [CrossRef]
  6. Chen, L.-H.; Ko, W.-C.; Yeh, F.-T. Approach based on fuzzy goal programing and quality function deployment for new product planning. Eur. J. Oper. Res. 2017, 259, 654–663. [Google Scholar] [CrossRef]
  7. Buttigieg, S.C.; Dey, P.K.; Cassar, M.R. Combined quality function deployment and logical framework analysis to improve quality of emergency care in Malta. Int. J. Health Care Qual. Assur. 2016, 29, 123–140. [Google Scholar] [CrossRef] [PubMed]
  8. Kurtulmuşoğlu, F.B.; Pakdil, F. Combined analysis of service expectations and perceptions in lodging industry through quality function deployment. Total Qual. Manag. Bus. Excell. 2016, 28, 1393–1413. [Google Scholar] [CrossRef]
  9. Elhegazy, H.; Ebid, A.; Mahdi, I.; Haggag, S.; Abdul-Rashied, I. Implementing QFD in decision making for selecting the optimal structural system for buildings. Constr. Innov. 2021, 21, 345–360. [Google Scholar] [CrossRef]
  10. Tavana, M.; Yazdani, M.; Di Caprio, D. An application of an integrated ANP–QFD framework for sustainable supplier selection. Int. J. Logist. Res. Appl. 2016, 20, 254–275. [Google Scholar] [CrossRef]
  11. Chan, L. A systematic approach to quality function deployment with a full illustrative example. Omega 2005, 33, 119–139. [Google Scholar] [CrossRef]
  12. Jia, W.; Liu, Z.; Lin, Z.; Qiu, C.; Tan, J. Quantification for the importance degree of engineering characteristics with a multi-level hierarchical structure in QFD. Int. J. Prod. Res. 2015, 54, 1627–1649. [Google Scholar] [CrossRef]
  13. Wang, Z.; Fung, R.Y.K.; Li, Y.-L.; Pu, Y. A group multi-granularity linguistic-based methodology for prioritizing engineering characteristics under uncertainties. Comput. Ind. Eng. 2016, 91, 178–187. [Google Scholar] [CrossRef]
  14. Abdel-Basset, M.; Mohamed, R.; Zaied, A.E.-N.H.; Smarandache, F. A Hybrid Plithogenic Decision-Making Approachwith Quality Function Deployment for Selecting Supply Chain Sustainability Metrics. Symmetry 2019, 11, 903. [Google Scholar] [CrossRef]
  15. Sivasamy, K.; Arumugam, C.; Devadasan, S.R.; Murugesh, R.; Thilak, V.M.M. Advanced models of quality function deployment: A literature review. Qual. Quant. 2015, 50, 1399–1414. [Google Scholar] [CrossRef]
  16. Rodriguez, R.M.; Martinez, L.; Herrera, F. Hesitant Fuzzy Linguistic Term Sets for Decision Making. IEEE Trans. Fuzzy Syst. 2012, 20, 109–119. [Google Scholar] [CrossRef]
  17. Martínez, L.; Labella, Á.; Rodríguez, R.M. An Overview on Fuzzy Modelling of Complex Linguistic Preferences in Decision Making. Int. J. Comput. Intell. Syst. 2016, 9, 81–94. [Google Scholar] [CrossRef]
  18. Martinez, L.; Herrera, F. A 2-tuple fuzzy linguistic representation model for computing with words. IEEE Trans. Fuzzy Syst. 2000, 8, 746–752. [Google Scholar] [CrossRef]
  19. Li, M. The Extension of Quality Function Deployment Based on 2-Tuple Linguistic Representation Model for Product Design under Multigranularity Linguistic Environment. Math. Probl. Eng. 2012, 2012, 989284. [Google Scholar] [CrossRef]
  20. Ko, W.-C. Exploiting 2-tuple linguistic representational model for constructing HOQ-based failure modes and effects analysis. Comput. Ind. Eng. 2013, 64, 858–865. [Google Scholar] [CrossRef]
  21. Karsak, E.E.; Dursun, M. An integrated fuzzy MCDM approach for supplier evaluation and selection. Comput. Ind. Eng. 2015, 82, 82–93. [Google Scholar] [CrossRef]
  22. Romero, A.L.; Rodriguez, R.M.; Martinez, L. Computing with Comparative Linguistic Expressions and Symbolic Translation for Decision Making: ELICIT Information. IEEE Trans. Fuzzy Syst. 2020, 28, 2510–2522. [Google Scholar] [CrossRef]
  23. Chin, K.-S.; Wang, Y.-M.; Yang, J.-B.; Gary Poon, K.K. An evidential reasoning based approach for quality function deployment under uncertainty. Expert Syst. Appl. 2009, 36, 5684–5694. [Google Scholar] [CrossRef]
  24. Chen, Y.; Ran, Y.; Huang, G.; Xiao, L.; Zhang, G. A new integrated MCDM approach for improving QFD based on DEMATEL and extended MULTIMOORA under uncertainty environment. Appl. Soft Comput. 2021, 105, 107222. [Google Scholar] [CrossRef]
  25. Jin, C.; Ran, Y.; Wang, Z.; Zhang, G. Prioritization of key quality characteristics with the three-dimensional HoQ model-based interval-valued spherical fuzzy-ORESTE method. Eng. Appl. Artif. Intell. 2021, 104, 104271. [Google Scholar] [CrossRef]
  26. Alghazzawi, D.; Liaqat, M.; Razaq, A.; Alolaiyan, H.; Shuaib, U.; Liu, J.-B. Selection of Optimal Approach for Cardiovascular Disease Diagnosis under Complex Intuitionistic Fuzzy Dynamic Environment. Mathematics 2023, 11, 4616. [Google Scholar] [CrossRef]
  27. Estrella, F.J.; Cevik Onar, S.; Rodríguez, R.M.; Oztaysi, B.; Martínez, L.; Kahraman, C. Selecting firms in University technoparks: A hesitant linguistic fuzzy TOPSIS model for heterogeneous contexts. J. Intell. Fuzzy Syst. 2017, 33, 1155–1172. [Google Scholar] [CrossRef]
  28. Deng, X.; Chen, C. Novel linear programming models based on distance measure of IFSs and modified TOPSIS method for portfolio selection. Egypt. Inform. J. 2022, 23, 13–31. [Google Scholar] [CrossRef]
  29. Rezaei, J. Best-worst multi-criteria decision-making method. Omega 2015, 53, 49–57. [Google Scholar] [CrossRef]
  30. Labella, Á.; Dutta, B.; Martínez, L. An optimal Best-Worst prioritization method under a 2-tuple linguistic environment in decision making. Comput. Ind. Eng. 2021, 155, 107141. [Google Scholar] [CrossRef]
  31. Liu, P.; Zhu, B.; Wang, P. A weighting model based on best–worst method and its application for environmental performance evaluation. Appl. Soft Comput. 2021, 103, 107168. [Google Scholar] [CrossRef]
  32. Guo, S.; Zhao, H. Fuzzy best-worst multi-criteria decision-making method and its applications. Knowl.-Based Syst. 2017, 121, 23–31. [Google Scholar] [CrossRef]
  33. Ali, A.; Rashid, T. Hesitant fuzzy best-worst multi-criteria decision-making method and its applications. Int. J. Intell. Syst. 2019, 34, 1953–1967. [Google Scholar] [CrossRef]
  34. Herrera, F.; Martinez, L. A model based on linguistic 2-tuples for dealing with multigranular hierarchical linguistic contexts in multi-expert decision-making. IEEE Trans. Syst. Man Cybern B Cybern 2001, 31, 227–234. [Google Scholar] [CrossRef] [PubMed]
  35. Xu, D.; Li, W.; Ren, X.; Shen, W.; Dong, L. Technology selection for sustainable hydrogen production: A multi-criteria assessment framework under uncertainties based on the combined weights and interval best-worst projection method. Int. J. Hydrogen Energy 2020, 45, 34396–34411. [Google Scholar] [CrossRef]
  36. Ren, J.; Ren, X.; Dong, L.; Manzardo, A.; He, C.; Pan, M. Multiactor multicriteria decision making for life cycle sustainability assessment under uncertainties. AIChE J. 2018, 64, 2103–2112. [Google Scholar] [CrossRef]
  37. Wang, Z.-L.; You, J.-X.; Liu, H.-C. Uncertain Quality Function Deployment Using a Hybrid Group Decision Making Model. Symmetry 2016, 8, 119. [Google Scholar] [CrossRef]
  38. Dat, L.Q.; Phuong, T.T.; Kao, H.-P.; Chou, S.-Y.; Nghia, P.V. A new integrated fuzzy QFD approach for market segments evaluation and selection. Appl. Math. Model. 2015, 39, 3653–3665. [Google Scholar] [CrossRef]
  39. Xu, Z. A method based on linguistic aggregation operators for group decision making with linguistic preference relations. Inf. Sci. 2004, 166, 19–30. [Google Scholar] [CrossRef]
  40. Estrella, F.J.; Espinilla, M.; Martínez, L. Fuzzy Linguistic Olive Oil Sensory Evaluation Model based on Unbalanced Linguistic Scales. J. Mult.-Valued Log. Soft Comput. 2014, 22, 501–520. [Google Scholar]
  41. Morente-Molinera, J.A.; Pérez, I.J.; Ureña, M.R.; Herrera-Viedma, E. On multi-granular fuzzy linguistic modeling in group decision making problems: A systematic review and future trends. Knowl.-Based Syst. 2015, 74, 49–60. [Google Scholar] [CrossRef]
  42. Dong, Y.; Wu, Y.; Zhang, H.; Zhang, G. Multi-granular unbalanced linguistic distribution assessments with interval symbolic proportions. Knowl.-Based Syst. 2015, 82, 139–151. [Google Scholar] [CrossRef]
  43. Wang, F.-Y.; Yang, J.; Wang, X.; Li, J.; Han, Q.-L. Chat with chatgpt on industry 5.0: Learning and decision-making for intelligent industries. IEEE/CAA J. Autom. Sin. 2023, 10, 831–834. [Google Scholar] [CrossRef]
Figure 1. Flowchart of the proposed QFD approach.
Applsci 13 13104 g001
Table 1. Semantic evaluation of inter-CRs comparison of the first expert group.
C 1 C 2 C 3 C 4 C 5
C 1 s 3 s 1 , s 2 s 2 , s 3 , s 4 s 1 s 3 , s 4
C 5 s 3 , s 4 s 3 , s 4 , s 5 s 5 s 3 , s 4 , s 5 , s 6 s 3
Table 2. Semantic evaluation of inter-CRs comparison of the second expert group.
C 1 C 2 C 3 C 4 C 5
C 1 s 4 , s 5 s 1 , s 2 , s 3 s 0 , s 1 s 0 , s 1 , s 2 s 5
C 5 s 1 , s 2 s 2 , s 3 s 5 , s 6 s 6 s 3 , s 4
Table 3. Semantic evaluation of inter-CRs comparison of the third expert group.
C 1 C 2 C 3 C 4 C 5
C 1 s 2 , s 3 , s 4 s 0 , s 1 s 1 , s 2 s 1 , s 2 , s 3 , s 4 s 2
C 5 s 0 , s 1 , s 2 s 3 s 4 , s 5 s 3 , s 4 s 1 , s 2
Table 4. Semantic evaluation of inter-CRs comparison of the fourth expert group.
C 1 C 2 C 3 C 4 C 5
C 1 s 2 s 0 , s 1 , s 2 s 2 s 1 , s 2 s 5 , s 6
C 5 s 4 , s 5 , s 6 s 1 , s 2 s 2 , s 3 s 5 s 4
Table 5. Semantic evaluation of inter-CRs comparison of the fifth expert group.
C 1 C 2 C 3 C 4 C 5
C 1 s 2 , s 3 s 3 , s 4 , s 5 s 1 , s 2 , s 3 s 0 s 3 , s 4 , s 5
C 5 s 5 s 3 , s 4 s 4 s 3 , s 4 , s 5 s 2 , s 3 , s 4
Table 6. Results of the information set of expert group evaluation based on inter-CRs.
C 1 C 2 C 3 C 4 C 5
C 1 s 2 , s 4 s 1 , s 3 s 1 , s 2 s 0 , s 1 s 2 , s 5
C 5 s 2 , s 5 s 2 , s 3 s 3 , s 5 s 4 , s 6 s 2 , s 4
Table 7. Expert group evaluation information expressed in numerical intervals.
C 1 C 2 C 3 C 4 C 5
C 1 [2, 4][1, 3][1, 2][0, 1][2, 5]
C 5 [2, 5][2, 3][3, 5][4, 6][2, 4]
Table 8. Evaluation information of relationships between CRs and ECs obtained by the QFD team.
WHATs
(CRs)
Expert
Group
HOWs (ECs)
A 1 A 2 A 3 A 4
C 1 E 1 s 3 , s 4 , s 5 s 1 , s 2 s 0 , s 1 , s 2 s 2
E 2 s 3 , s 4 s 2 , s 3 , s 4 s 1 , s 2 , s 3 s 1 , s 2 , s 3
E 3 s 4 , s 5 s 3 , s 4 , s 5 s 2 , s 3 s 3 , s 4
E 4 s 6 s 2 , s 3 s 2 s 4
E 5 s 5 , s 6 s 3 s 3 , s 4 s 4 , s 5
C 2 E 1 s 5 , s 6 s 4 , s 5 s 3 , s 4 , s 5 s 6
E 2 s 6 s 5 , s 6 s 5 , s 6 s 2 , s 3 , s 4 , s 5
E 3 s 4 , s 5 s 6 s 4 , s 5 , s 6 s 4 , s 5
E 4 s 3 , s 4 , s 5 s 4 , s 5 s 5 s 4 , s 5 , s 6
E 5 s 5 s 3 , s 4 , s 5 s 6 s 4 , s 5
C 3 E 1 s 6 s 5 , s 6 s 3 , s 4 , s 5 , s 6 s 5
E 2 s 4 , s 5 , s 6 s 6 s 5 , s 6 s 5 , s 6
E 3 s 5 s 3 , s 4 , s 5 s 5 , s 6 s 4 , s 5
E 4 s 4 , s 5 s 5 s 4 , s 5 , s 6 s 3 , s 4 , s 5
E 5 s 4 s 4 , s 5 s 5 , s 6 s 6
C 4 E 1 s 3 , s 4 , s 5 s 3 s 3 , s 4 s 4 , s 5
E 2 s 3 , s 4 s 4 , s 5 s 2 , s 3 , s 4 s 3
E 3 s 2 , s 3 s 5 , s 6 s 5 , s 6 s 3 , s 4
E 4 s 5 s 2 , s 3 , s 4 , s 5 s 6 s 0 , s 1 , s 2 , s 3
E 5 s 4 , s 5 s 3 , s 4 , s 5 s 4 , s 5 s 2 , s 3
C 5 E 1 s 4 s 1 , s 2 , s 3 s 2 , s 3 s 4 , s 5
E 2 s 3 , s 4 s 1 s 3 , s 4 , s 5 s 3
E 3 s 4 , s 5 , s 6 s 3 , s 4 s 3 s 2 , s 3
E 4 s 5 , s 6 s 3 s 5 , s 6 s 5
E 5 s 5 s 3 , s 4 , s 5 s 4 , s 5 s 4 , s 5 , s 6
Table 9. Results of assembled expert group evaluation information.
C 1 C 2 C 3 C 4 C 5
A 1 s 4 , s 6 s 5 , s 6 s 4 , s 6 s 3 , s 5 s 4 , s 5
A 2 s 2 , s 3 s 5 , s 6 s 5 , s 6 s 3 , s 5 s 1 , s 3
A 3 s 2 , s 3 s 5 , s 6 s 5 , s 6 s 4 , s 6 s 3 , s 5
A 4 s 2 , s 4 s 5 , s 6 s 5 , s 6 s 3 , s 4 s 3 , s 5
Table 10. Expert group evaluation information expressed by the numerical interval.
C 1 C 2 C 3 C 4 C 5
A 1 [4, 6][5, 6][4, 6][3, 5][4, 5]
A 2 [2, 3][5, 6][5, 6][3, 5][1, 3]
A 3 [2, 3][5, 6][5, 6][4, 6][3, 5]
A 4 [2, 4][5, 6][5, 6][3, 4][3, 5]
Table 11. Standardized decision matrix.
C 1 C 2 C 3 C 4 C 5
A 1 [0.023, 0.034][0.029, 0.034][0.023, 0.034][0.017, 0.029][0.023, 0.029]
A 2 [0.011, 0.017][0.029, 0.034][0.029, 0.034][0.017, 0.029][0.006, 0.017]
A 3 [0.011, 0.017][0.029, 0.034][0.029, 0.034][0.023, 0.034][0.017, 0.029]
A 4 [0.011, 0.023][0.029, 0.034][0.029, 0.034][0.017, 0.023][0.017, 0.029]
Table 12. Weighted standardized decision matrix.
C 1 C 2 C 3 C 4 C 5
A 1 [0.005, 0.008][0.004, 0.005][0.005, 0.008][0.006, 0.01][0.001, 0.002]
A 2 [0.003, 0.004][0.004, 0.005][0.006, 0.008][0.006, 0.010][0.000, 0.001]
A 3 [0.003, 0.004][0.004, 0.005][0.006, 0.008][0.008, 0.012][0.001, 0.002]
A 4 [0.003, 0.005][0.004, 0.005][0.006, 0.008][0.006, 0.008][0.001, 0.002]
Table 13. Relative closeness and ranking results of ECs.
D A i , A + D A i , A S i Ranking
A 1 0.00210.00360.62961
A 2 0.00390.00160.28993
A 3 0.00320.00340.51752
A 4 0.00410.00140.25824
Table 14. Ranking results of ECs by the listed methods.
ECsQFDFuzzy QFDLinguistic QFDProposed Approach
w i Ranking w ˜ i Ranking w ^ i Ranking
A 1 7.1931(0.267, 0.475, 0.724)1 t 5.26 11
A 2 6.2483(0.231, 0.415, 0.659)3 t 4.72 33
A 3 6.9722(0.253, 0.448, 0.689)2 t 5.15 22
A 4 5.8264(0.217, 0.400, 0.641)4 t 4.12 44
Table 15. The linguistic values of “HOWs”–“WHATs”.
HOWsWHATsDecision Makers
D 1 D 2 D 3 D 4 D 5
A 1 C 1 HHVHHH
C 2 VHVHVHHH
C 3 HHHVHVH
C 4 MHMMH
C 5 HHHHH
A 2 C 1 MMMMM
C 2 HHVHHH
C 3 HHHVHVH
C 4 MMMMM
C 5 HHMMH
A 3 C 1 LHMLMM
C 2 HHVHVHH
C 3 VHVHVHVHVH
C 4 HHHHH
C 5 MHHMH
A 4 C 1 MMMMM
C 2 HVHHHH
C 3 HHHVHVH
C 4 HHMMH
C 5 LMLLM
Table 16. Linguistic preference relation R 1 .
x 1 x 2 x 3 x 4
x 1 / t 2 t 4 t 3
x 2 t 8 / t 5 t 4
x 3 t 6 t 5 / t 2
x 4 t 7 t 6 t 8 /
Table 17. Linguistic preference relation R 2 .
x 1 x 2 x 3 x 4
x 1 / t 3 t 4 t 6
x 2 t 7 / t 7 t 4
x 3 t 6 t 3 / t 4
x 4 t 4 t 6 t 6 /
Table 18. Linguistic preference relation R 3 .
x 1 x 2 x 3 x 4
x 1 / t 2 t 6 t 4
x 2 t 8 / t 4 t 3
x 3 t 4 t 6 / t 5
x 4 t 6 t 7 t 5 /
Disclaimer/Publisher’s Note: The statements, opinions and data contained in all publications are solely those of the individual author(s) and contributor(s) and not of MDPI and/or the editor(s). MDPI and/or the editor(s) disclaim responsibility for any injury to people or property resulting from any ideas, methods, instructions or products referred to in the content.

