
Exact Solution of the Raman Response Function of Chalcogenide Fiber and Its Influence on the Mid-Infrared Supercontinuum

Abstract
:1. Introduction
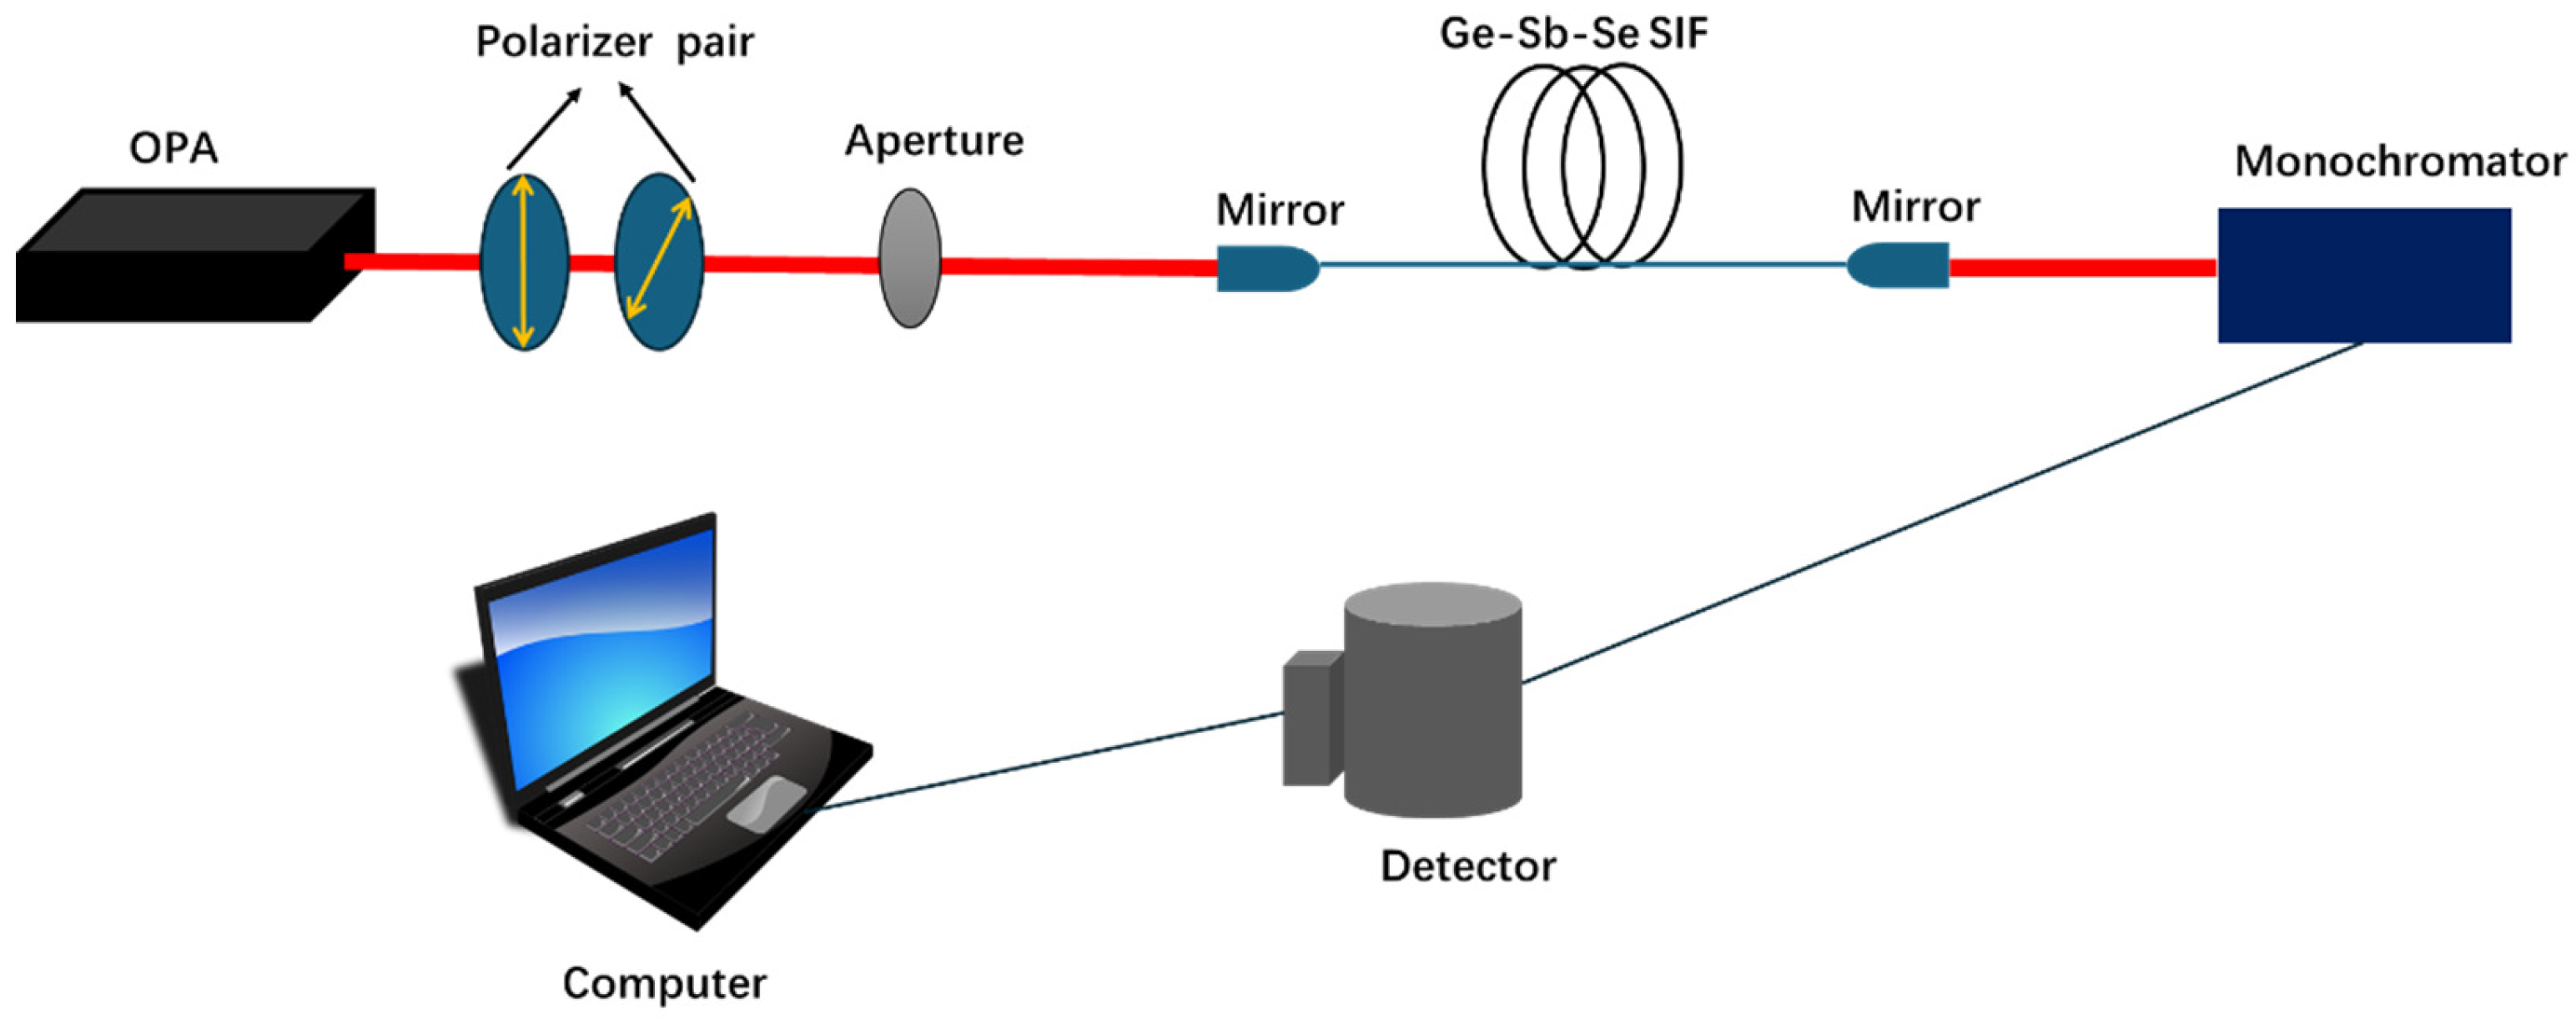
2. Experimental
3. Theoretical Model
3.1. Numerical Simulation
3.2. The Raman Response Function Solved Using the Multiple Vibrational Mode Model
4. Results and Discussion
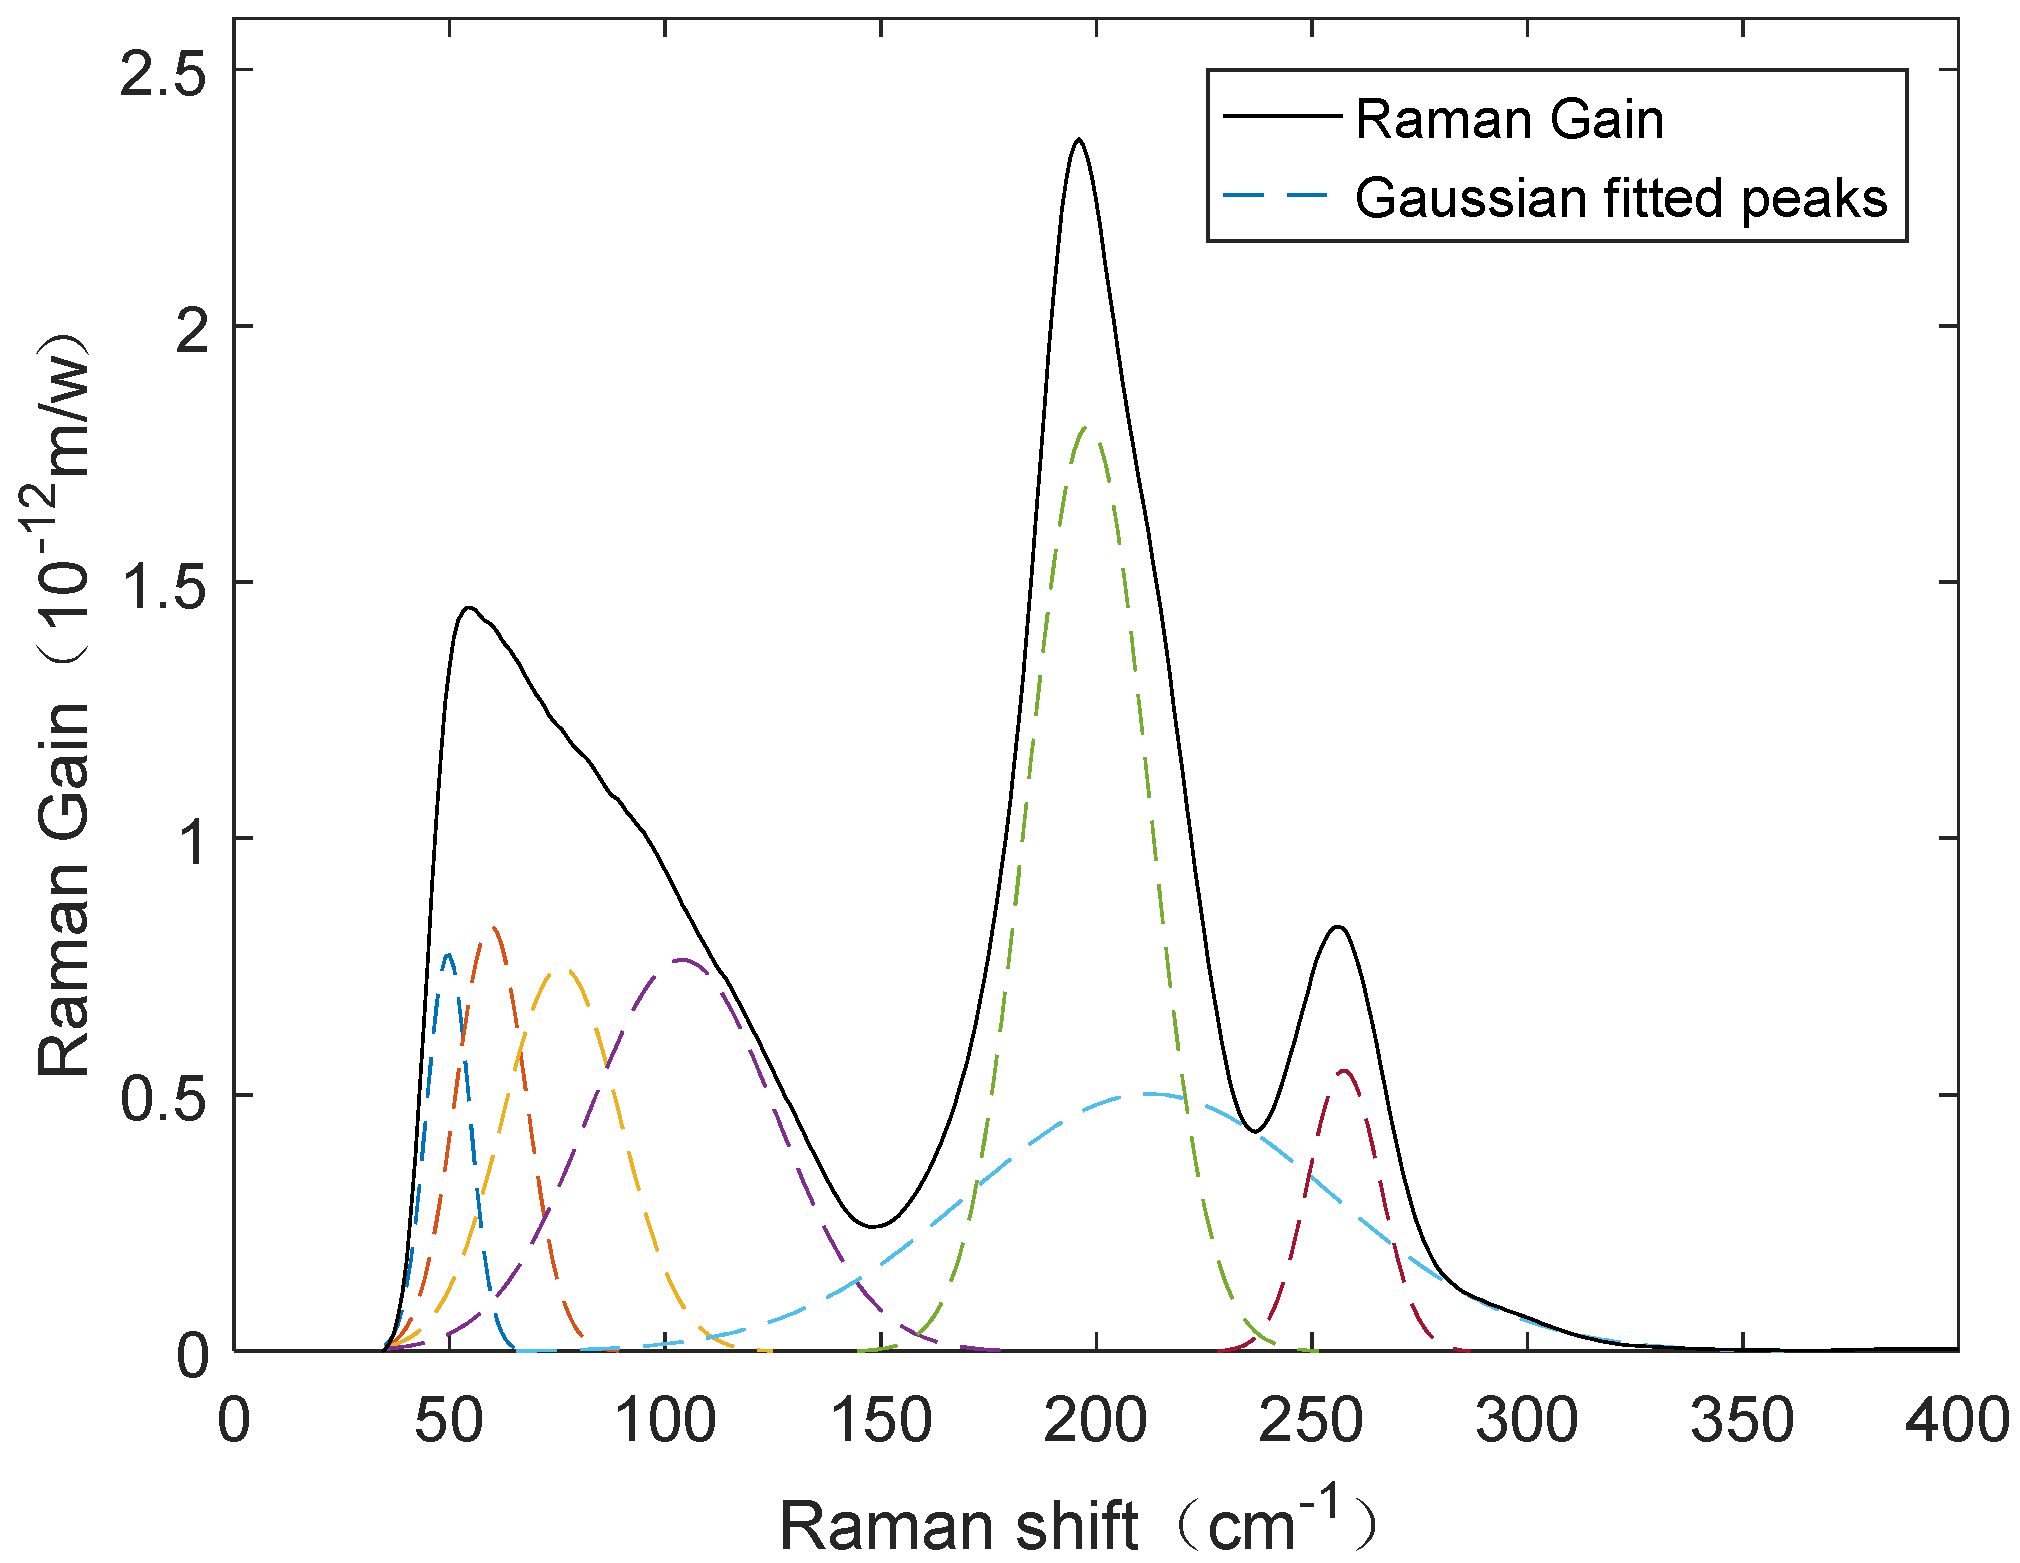
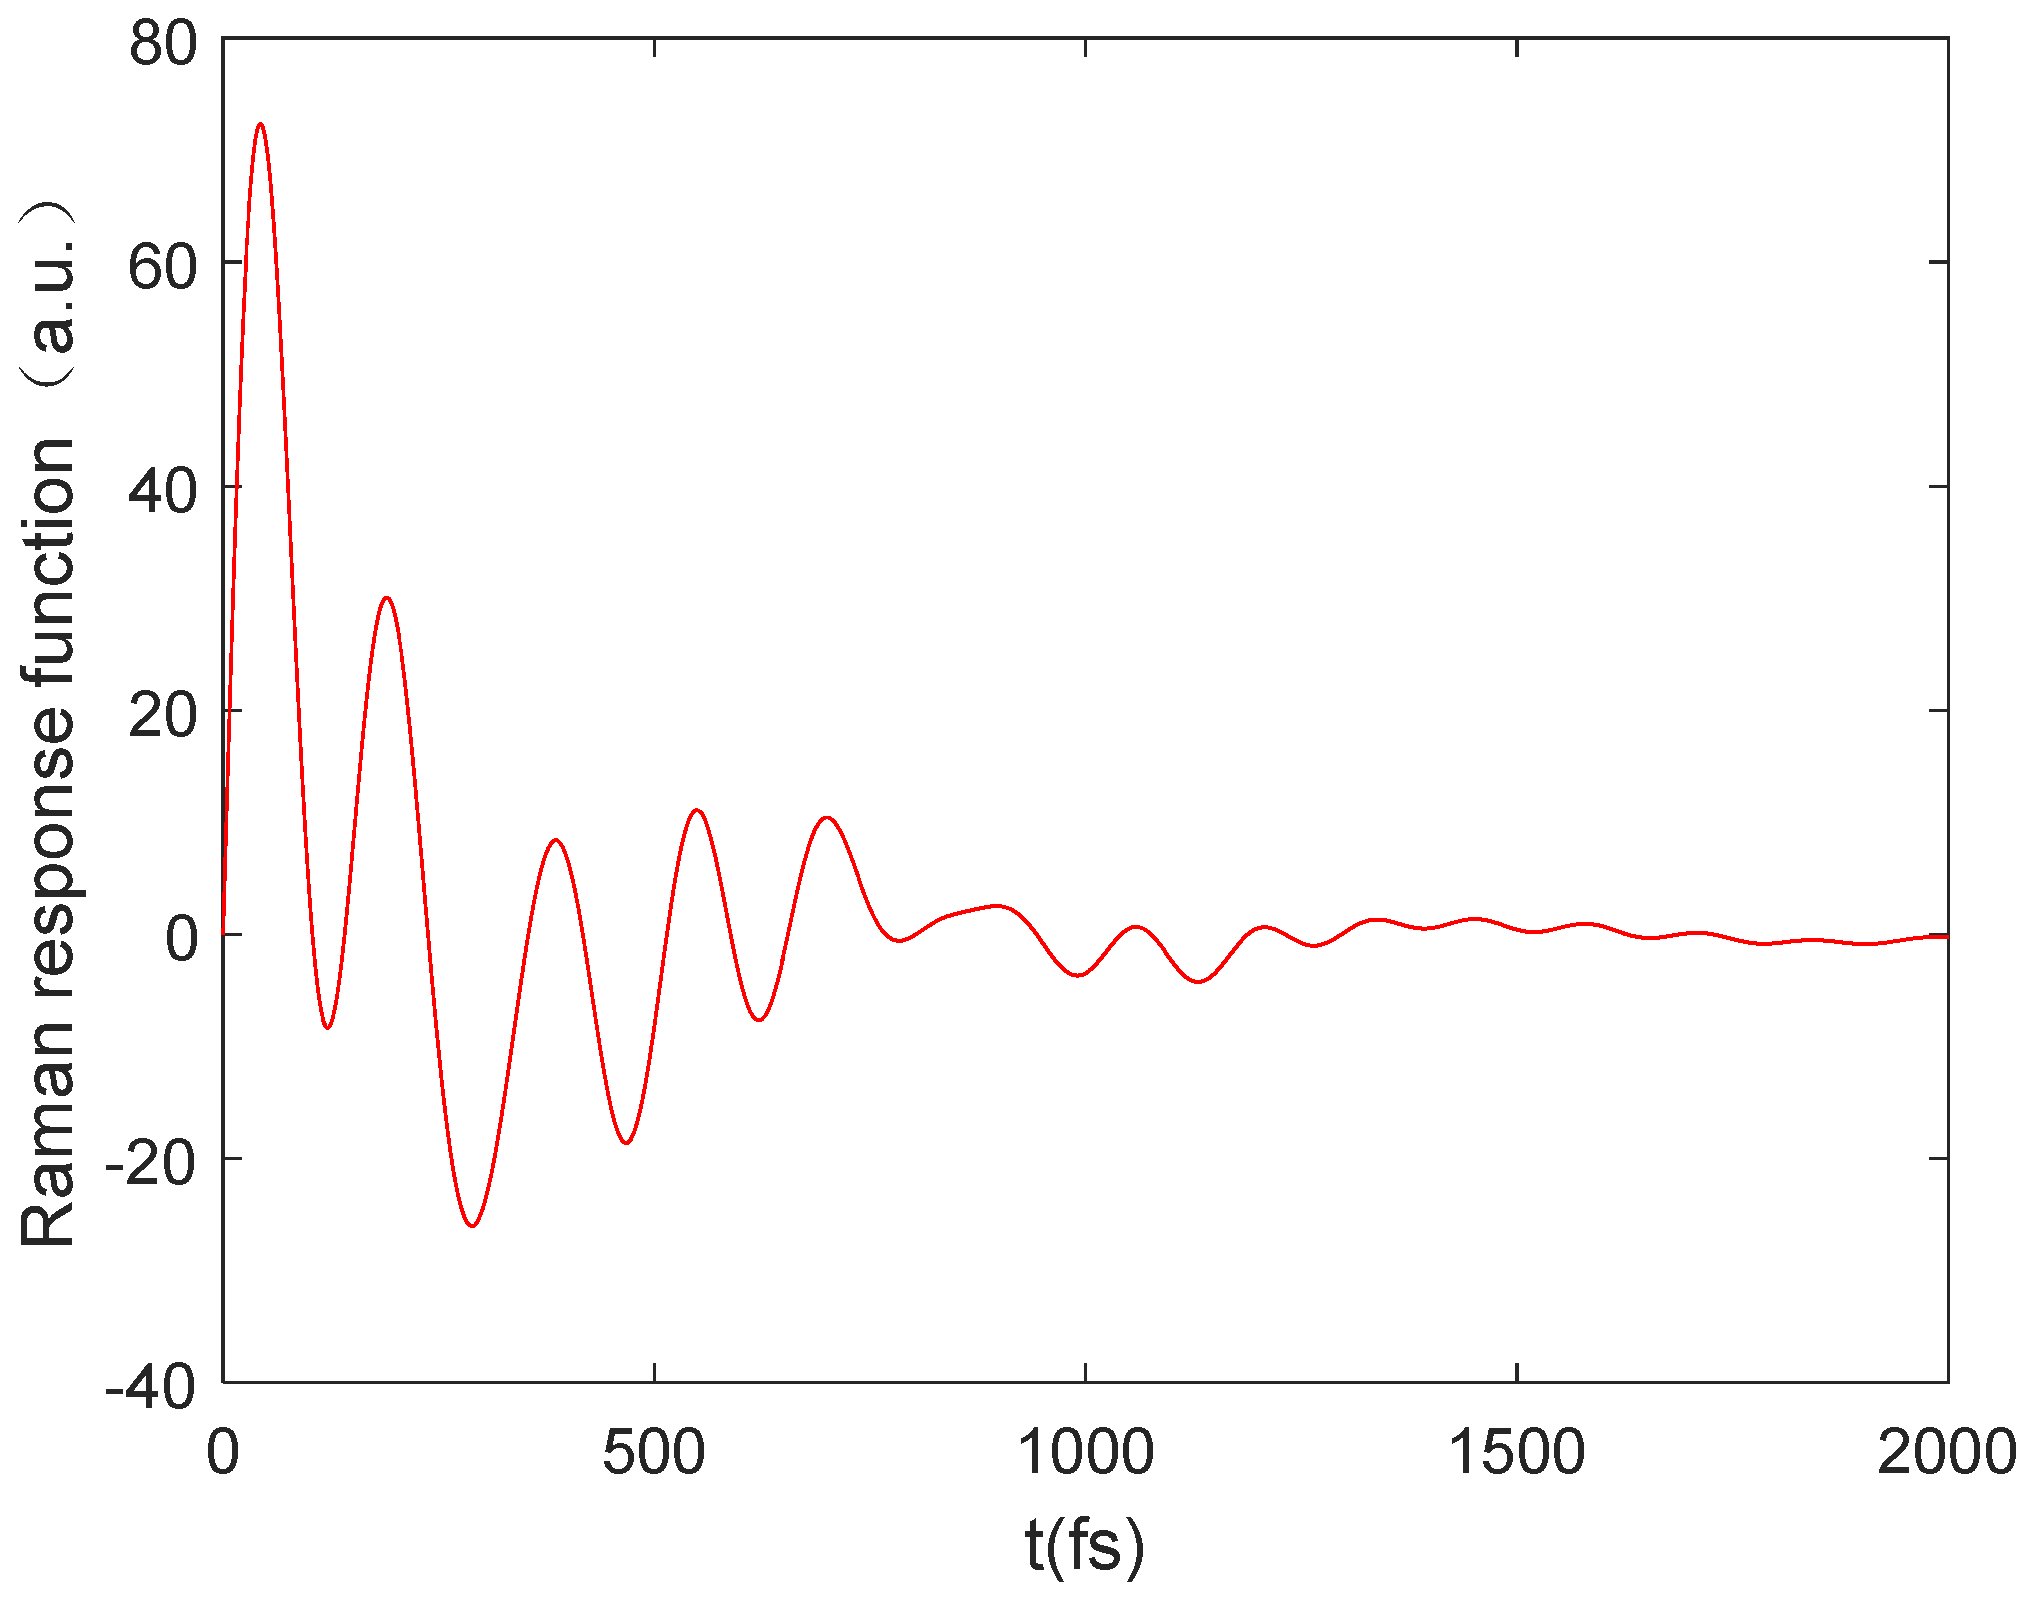
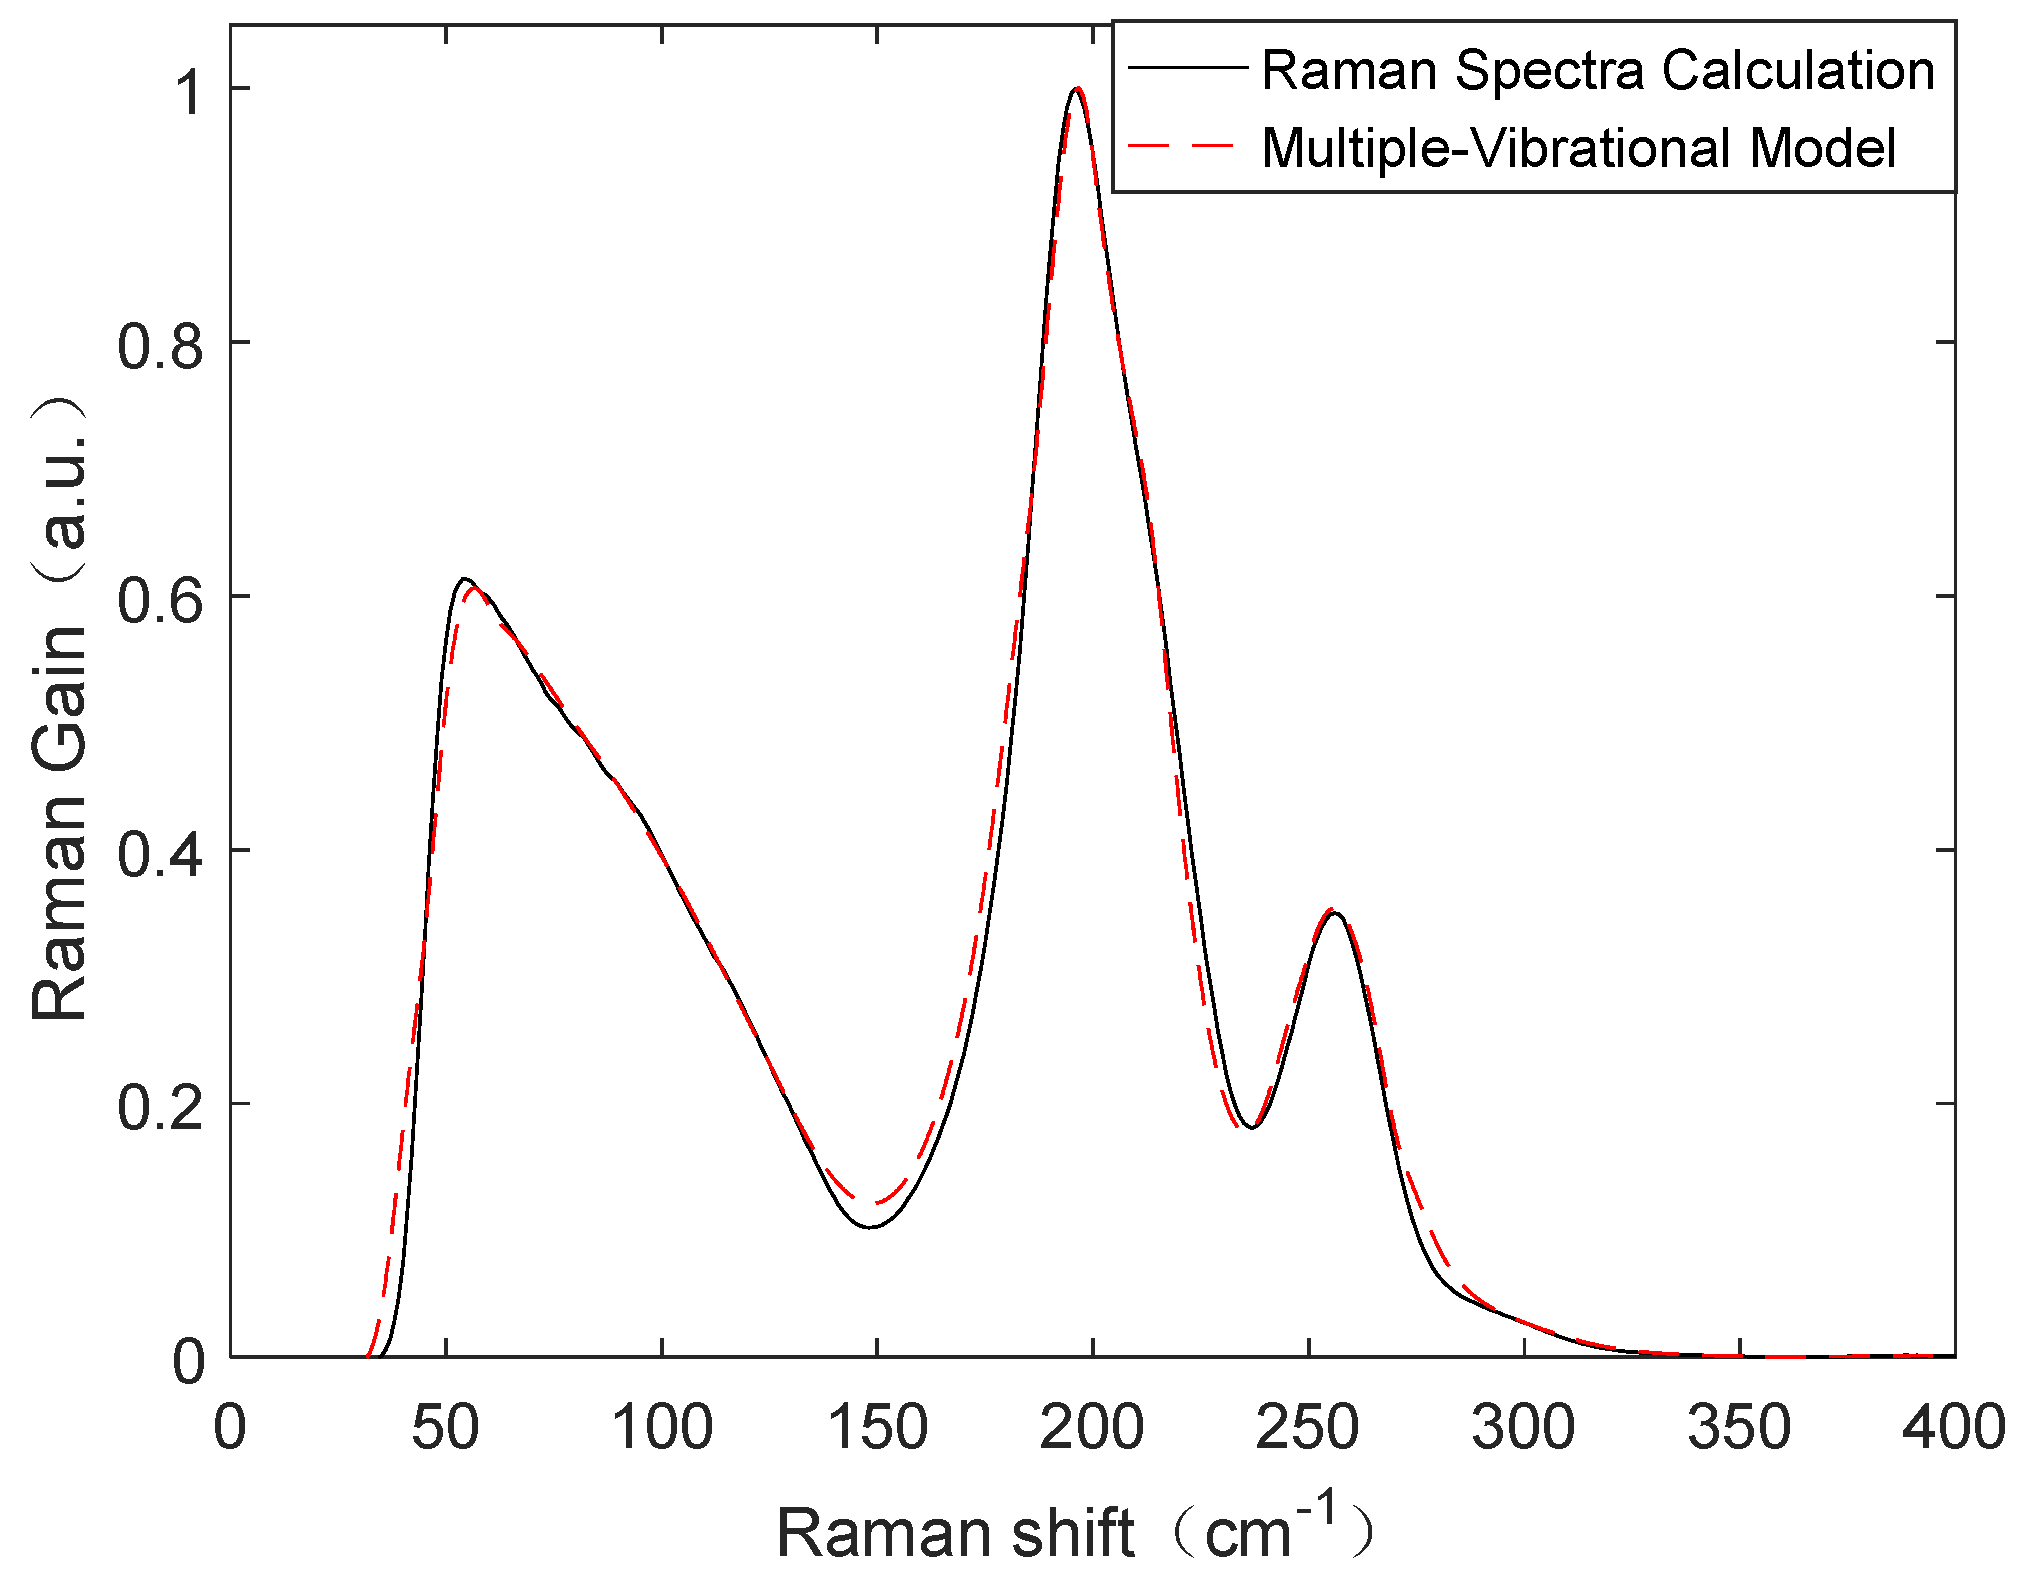
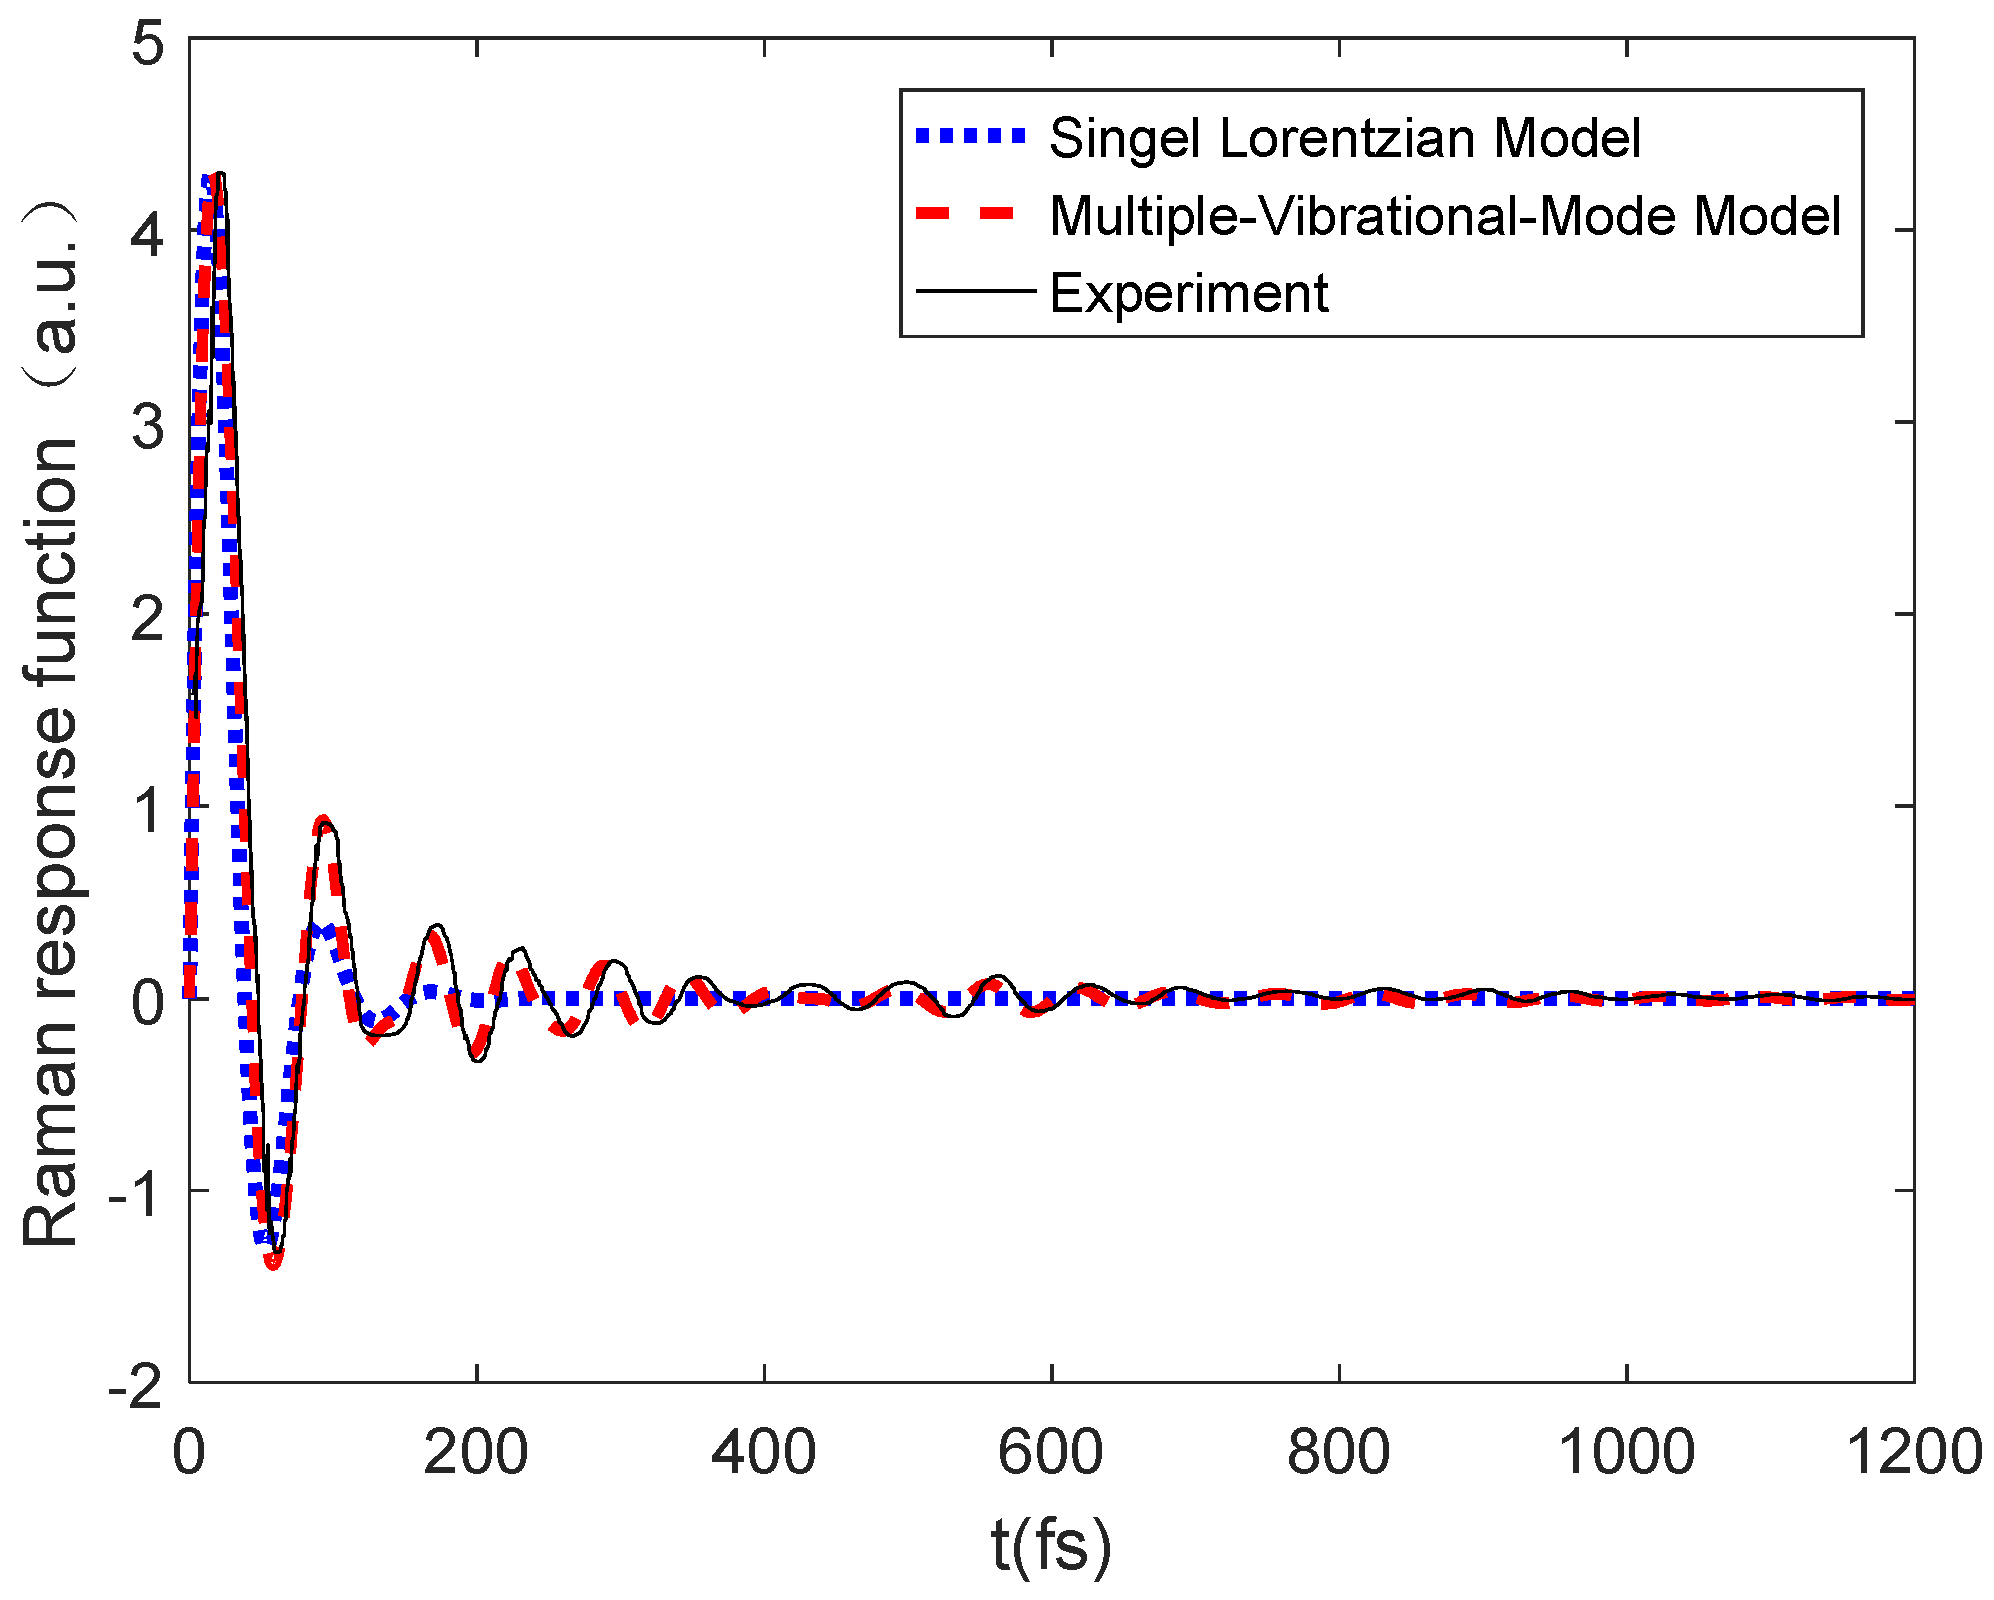
4.1. The Raman Response Function of Ge–Sb–Se Glass
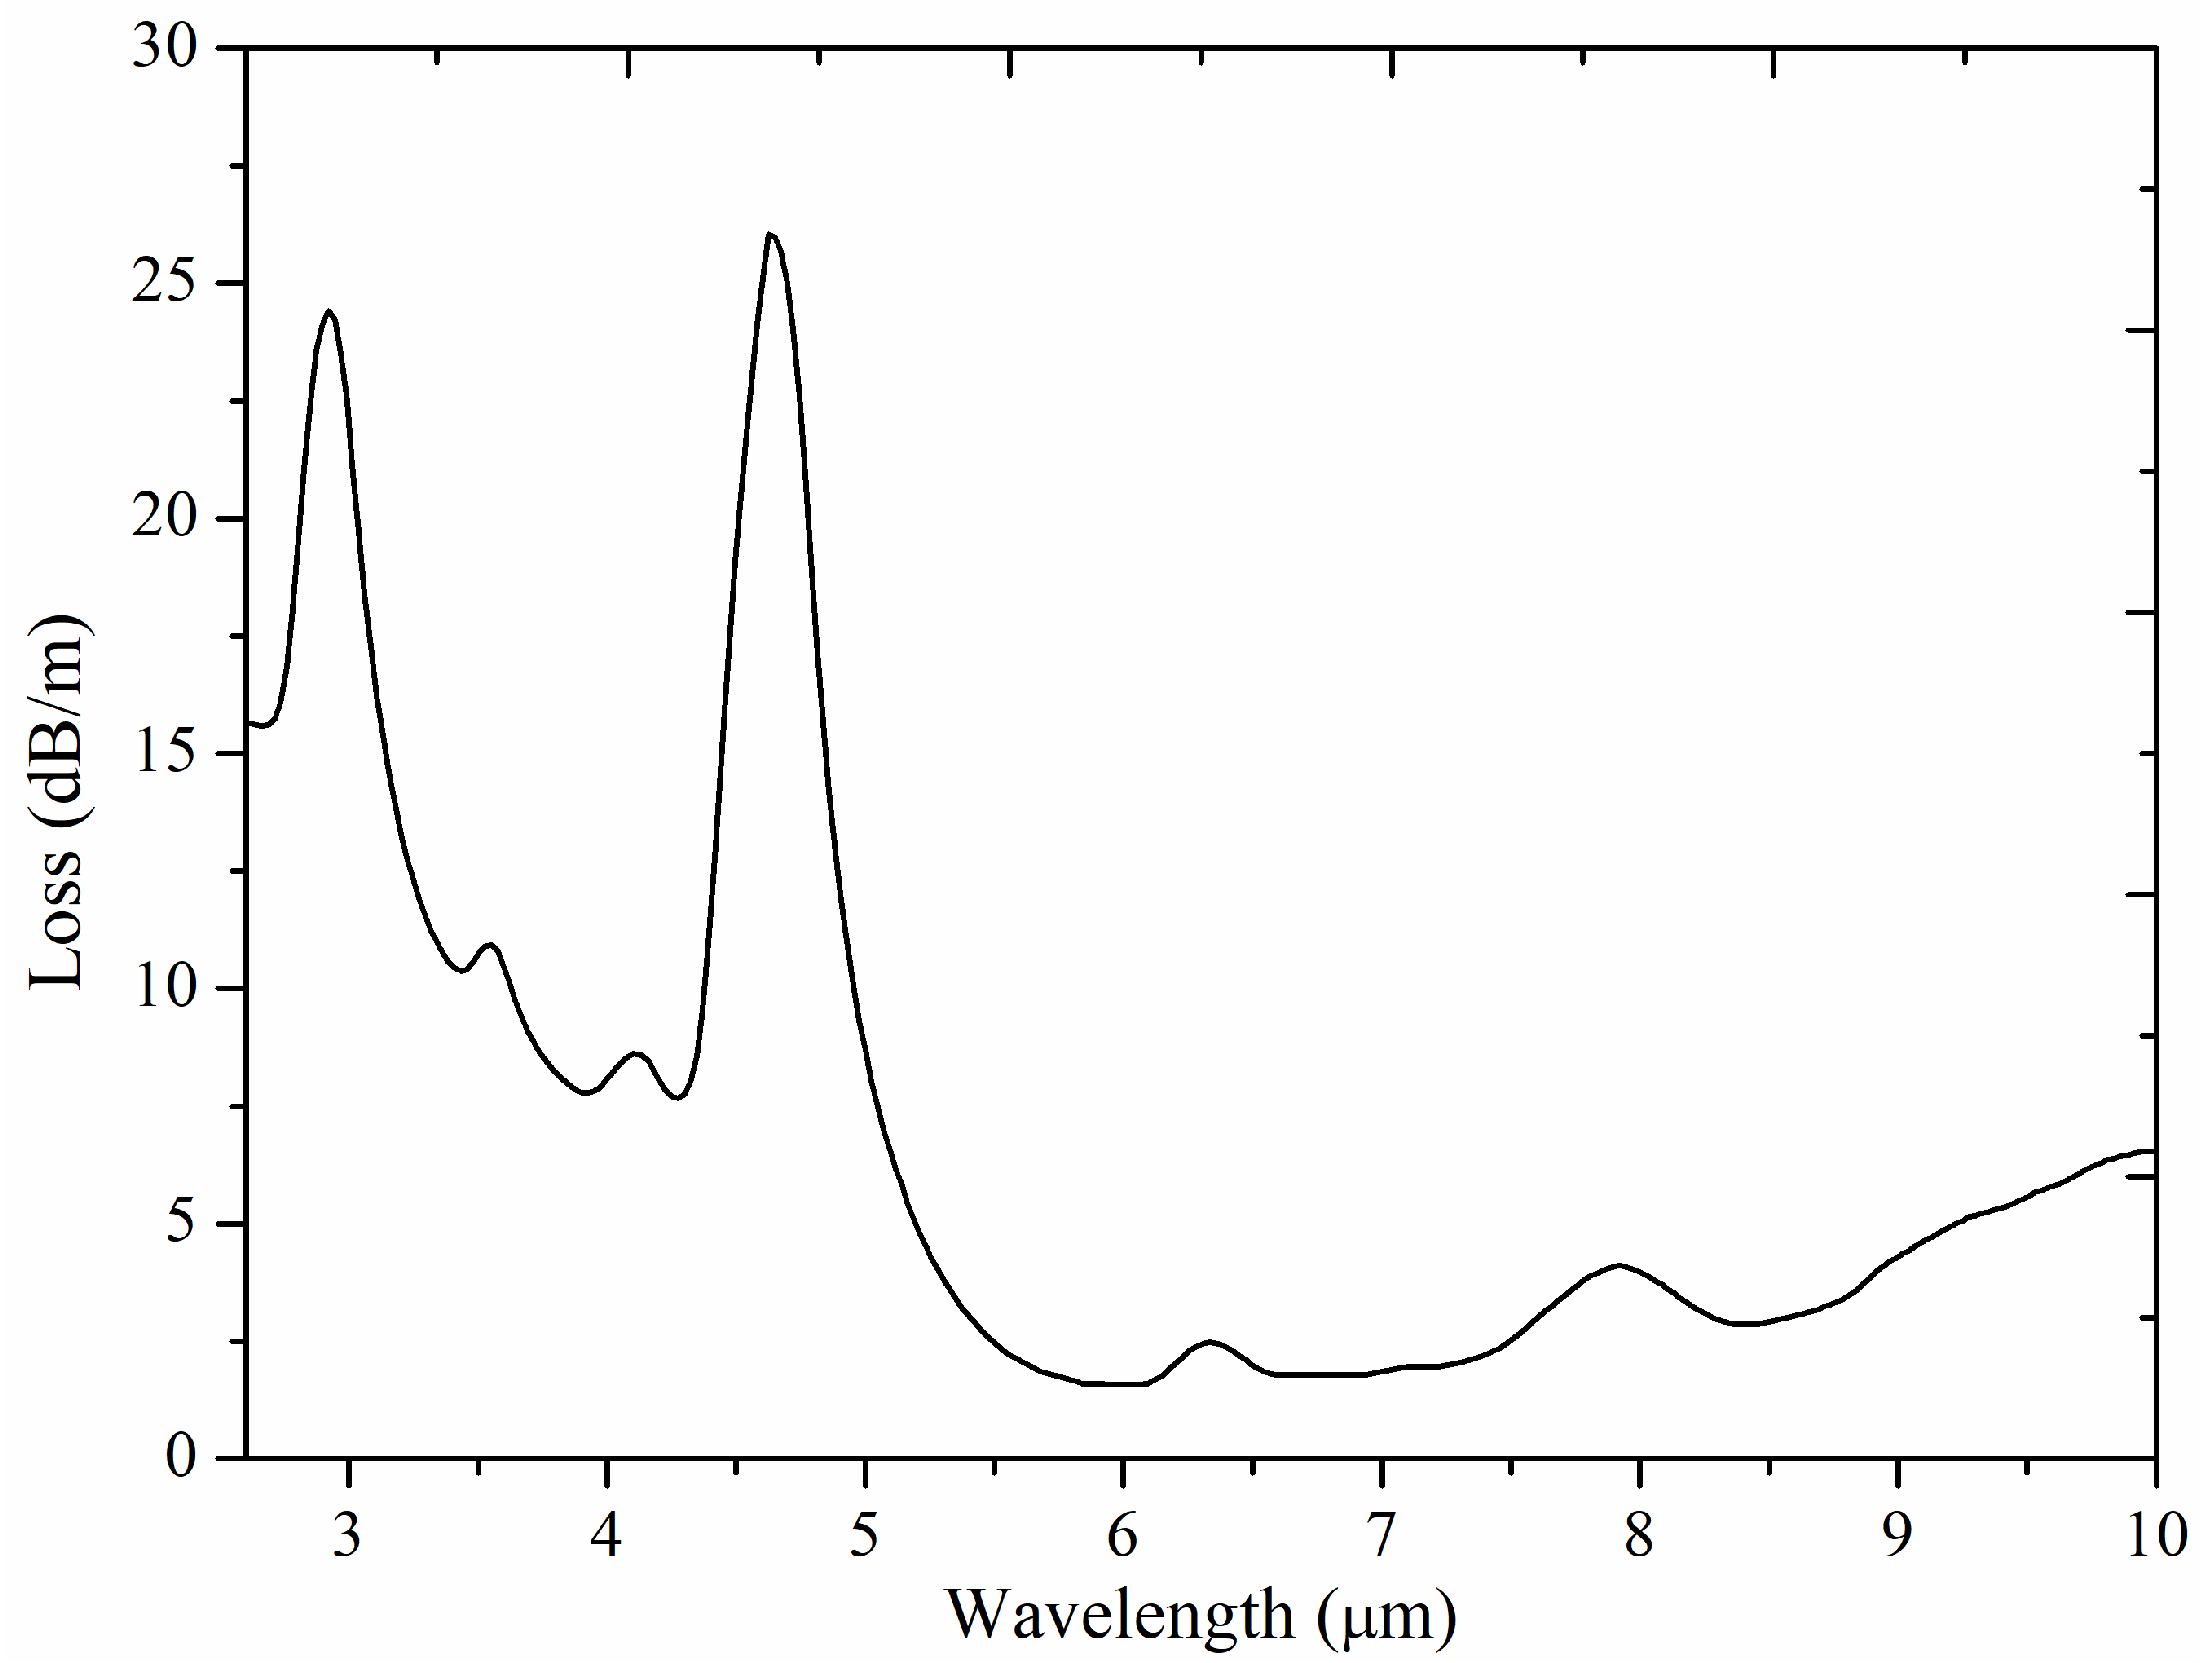
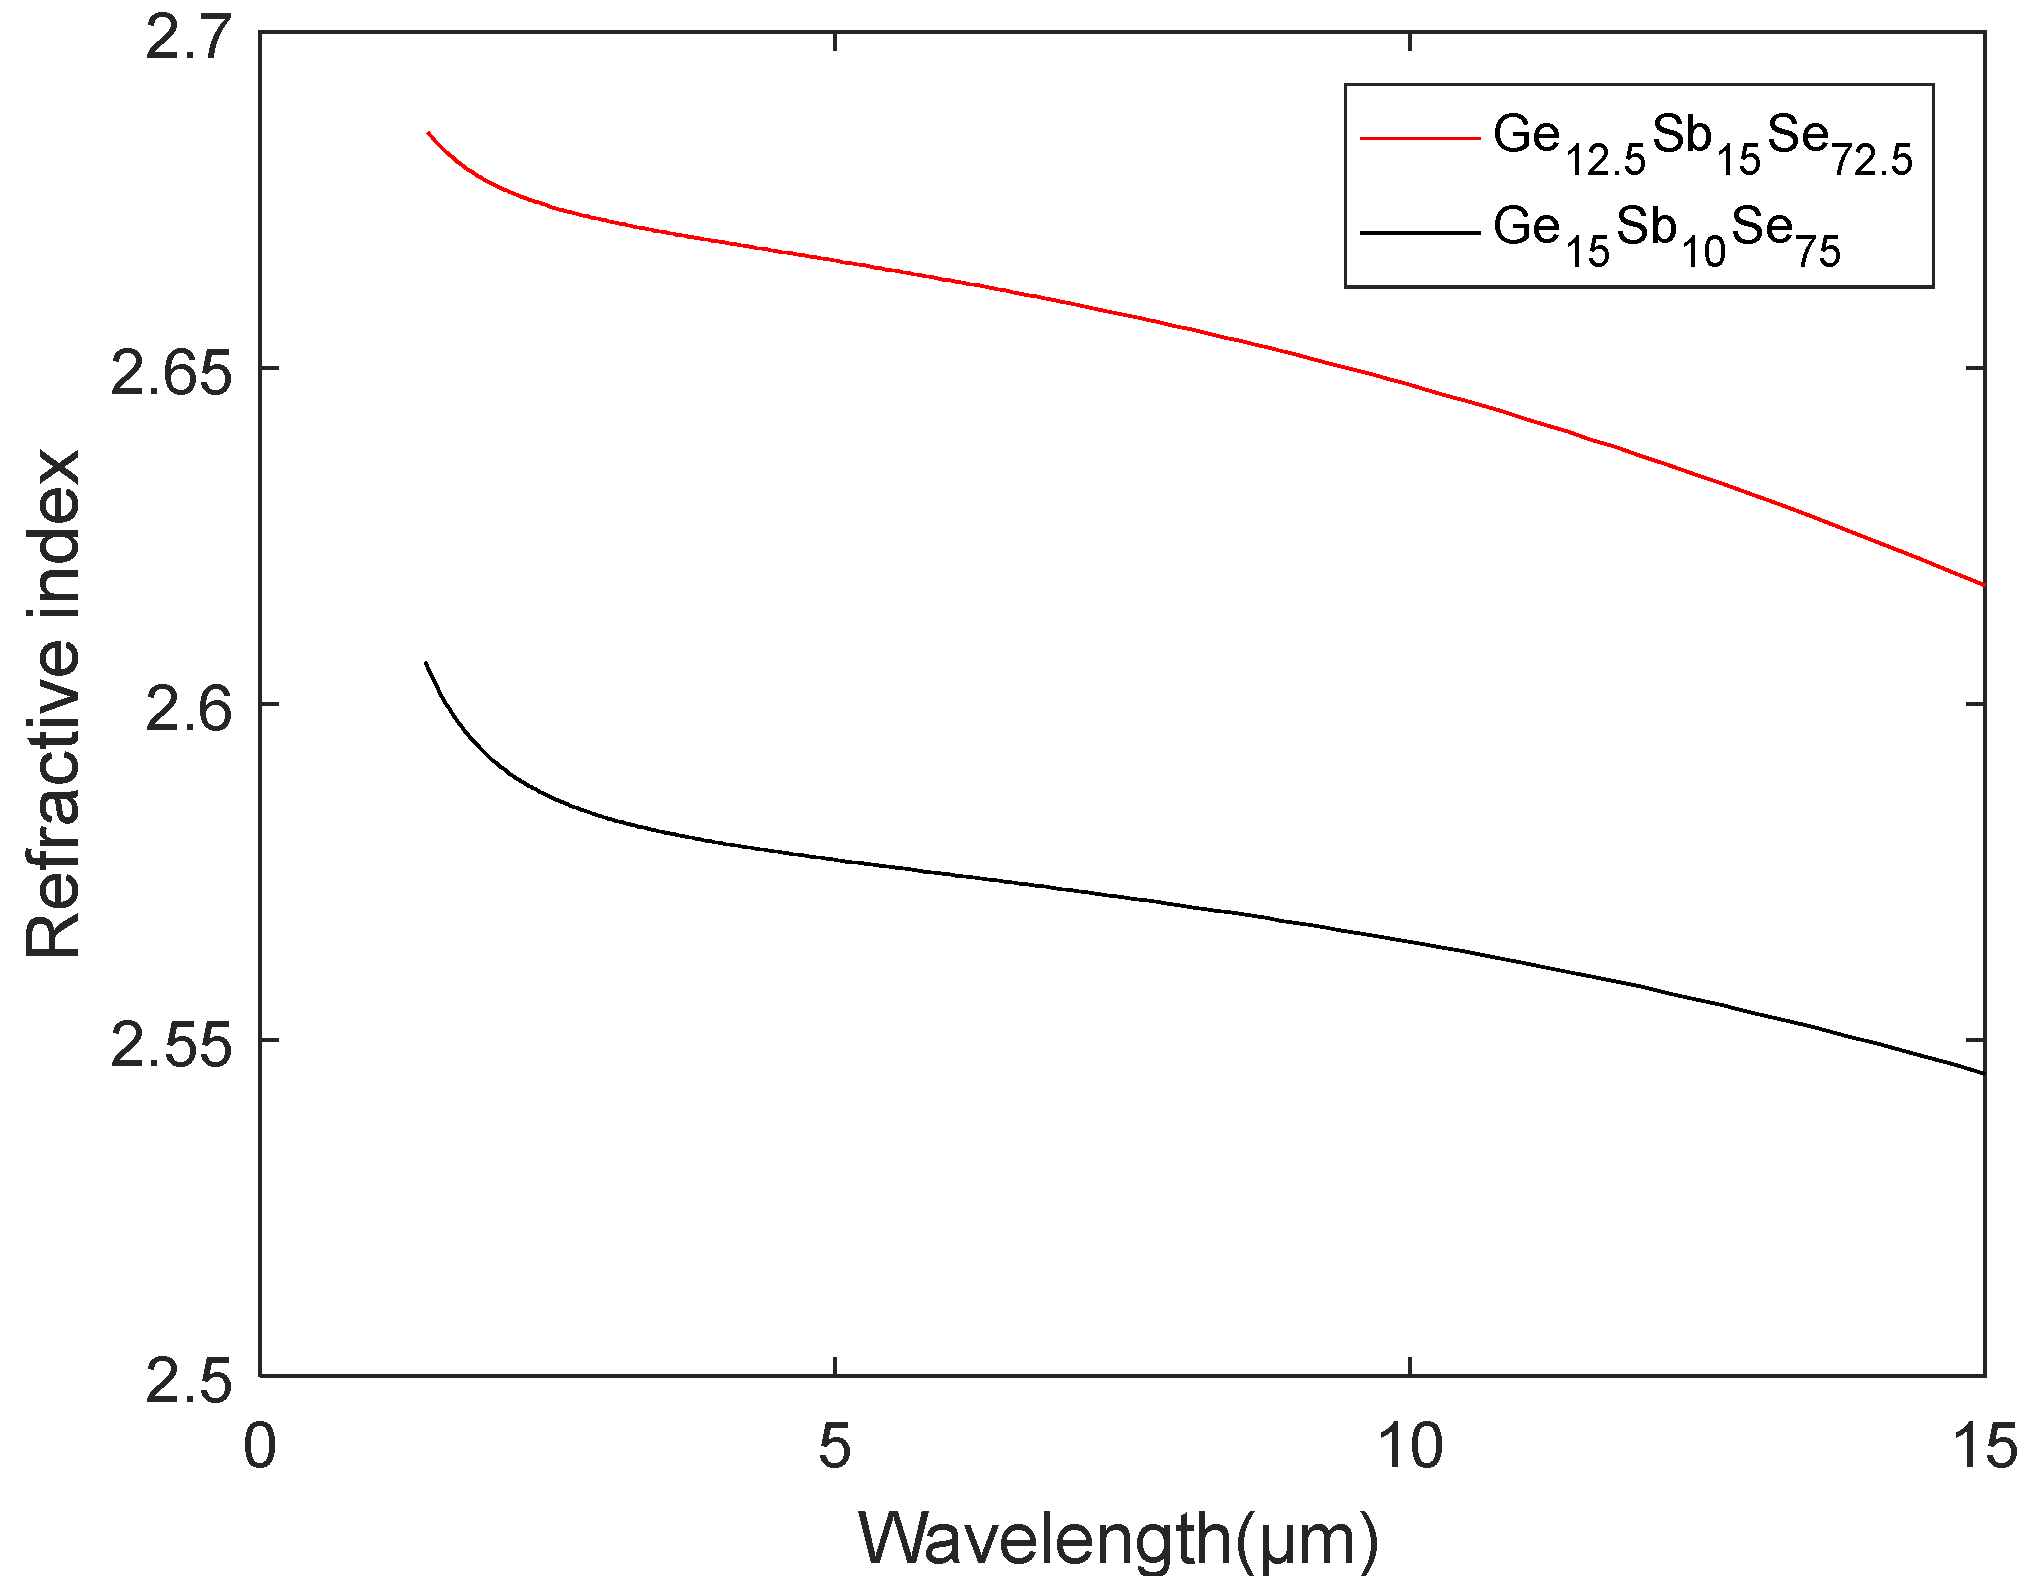
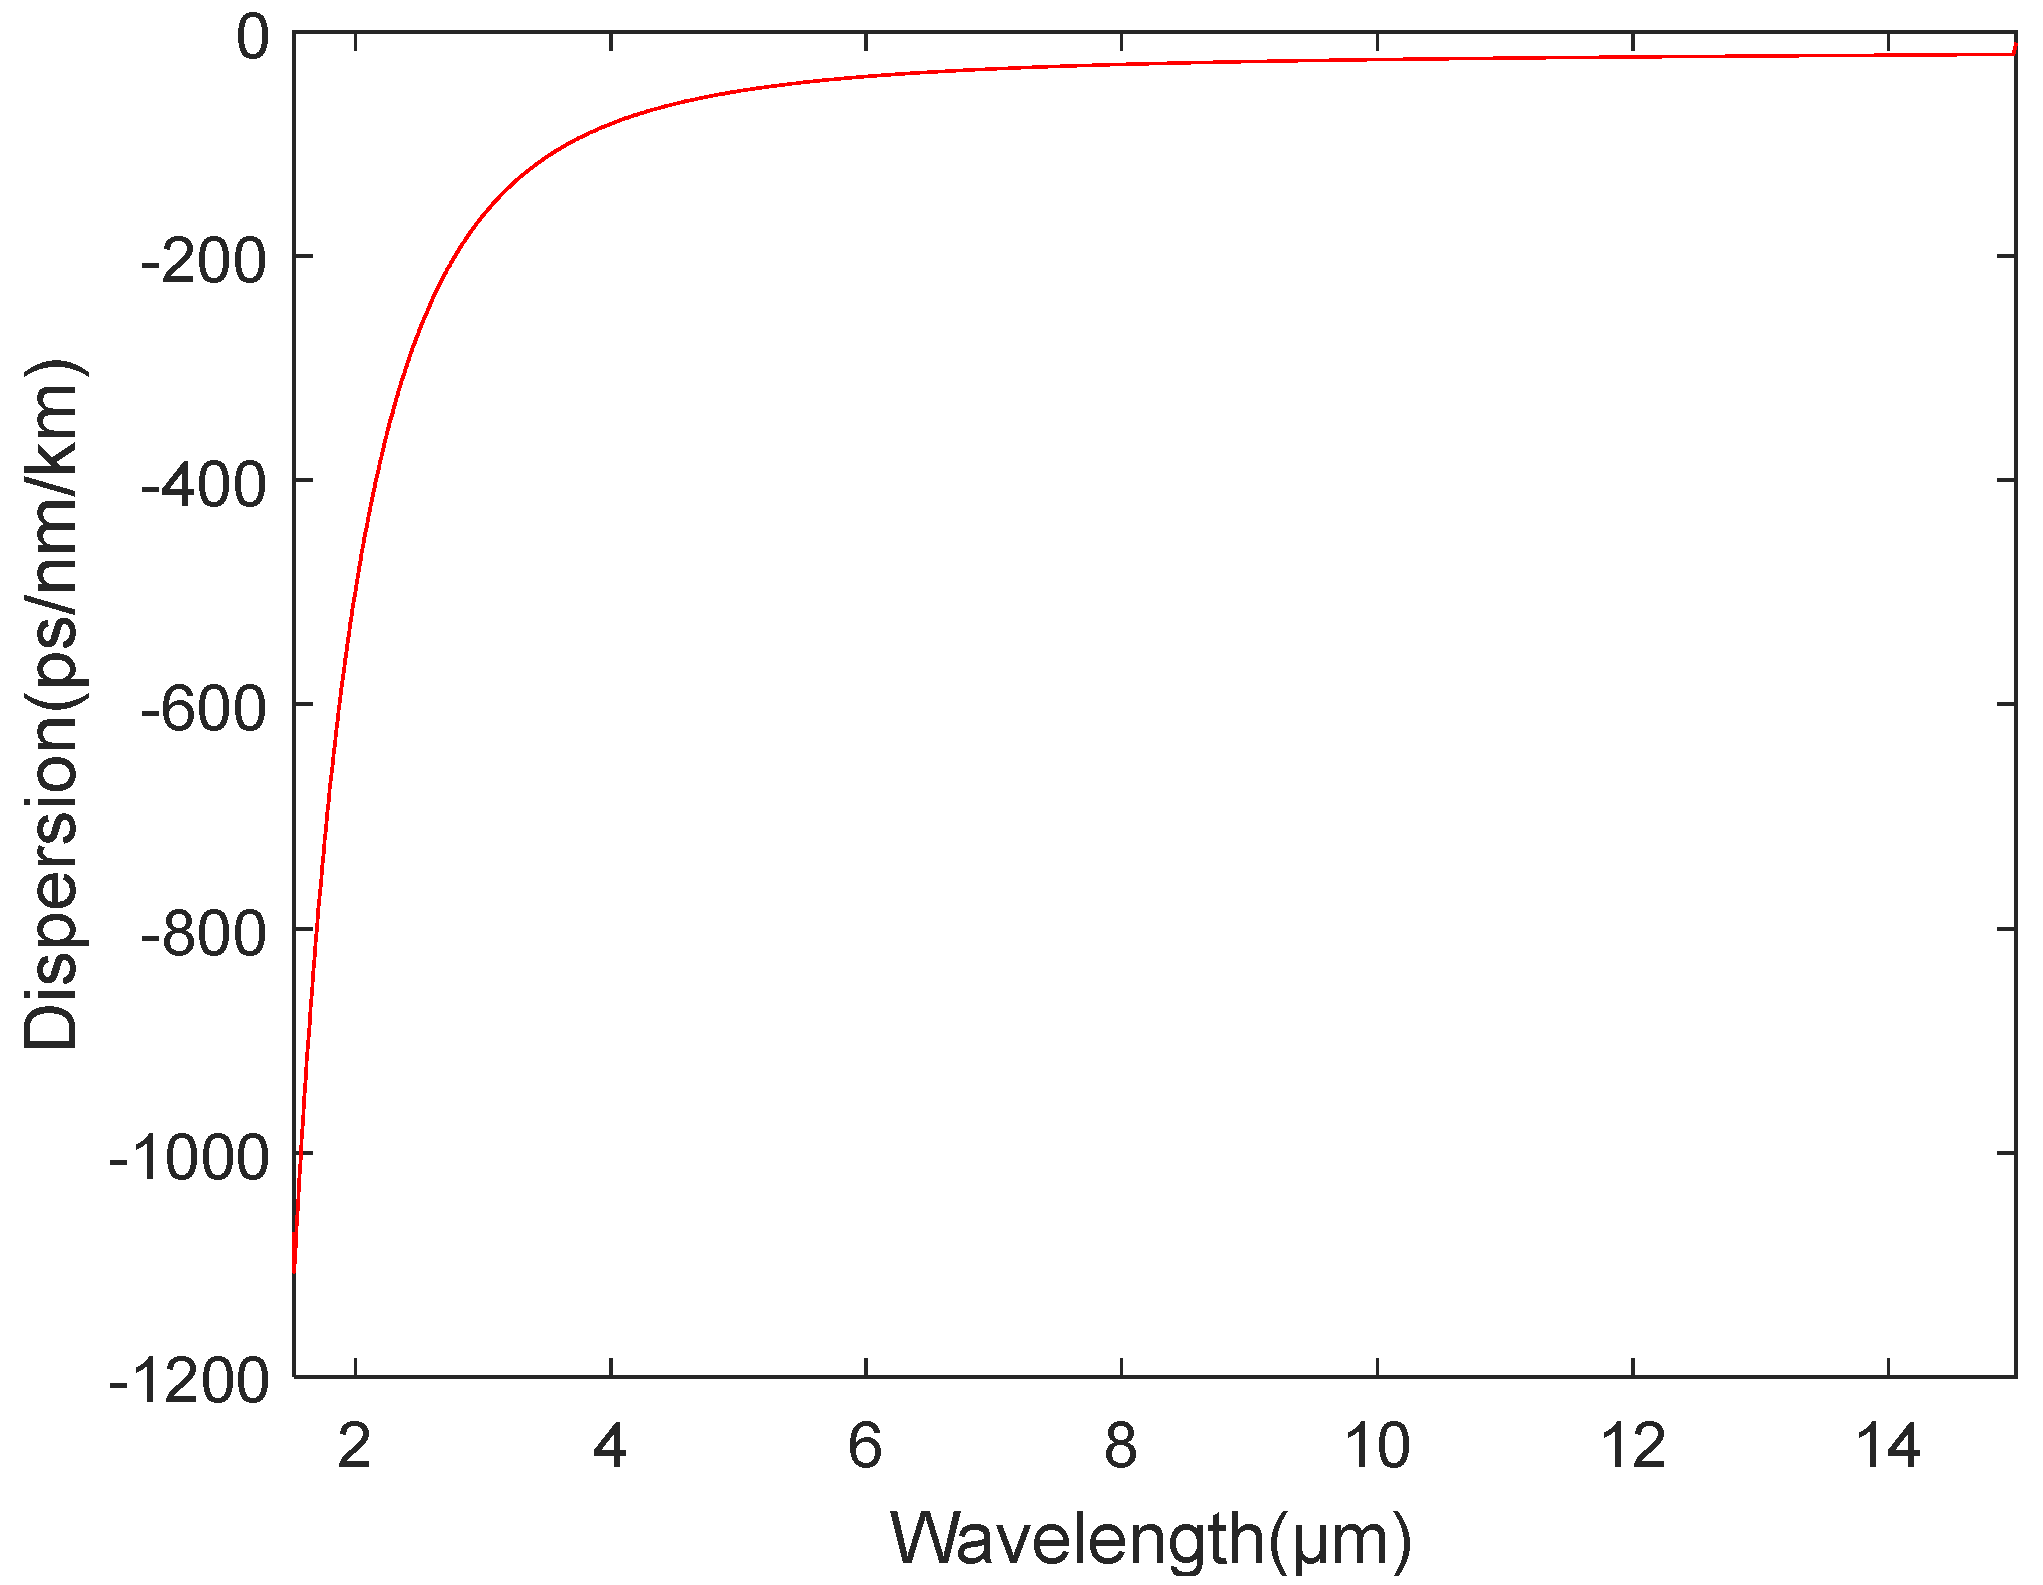
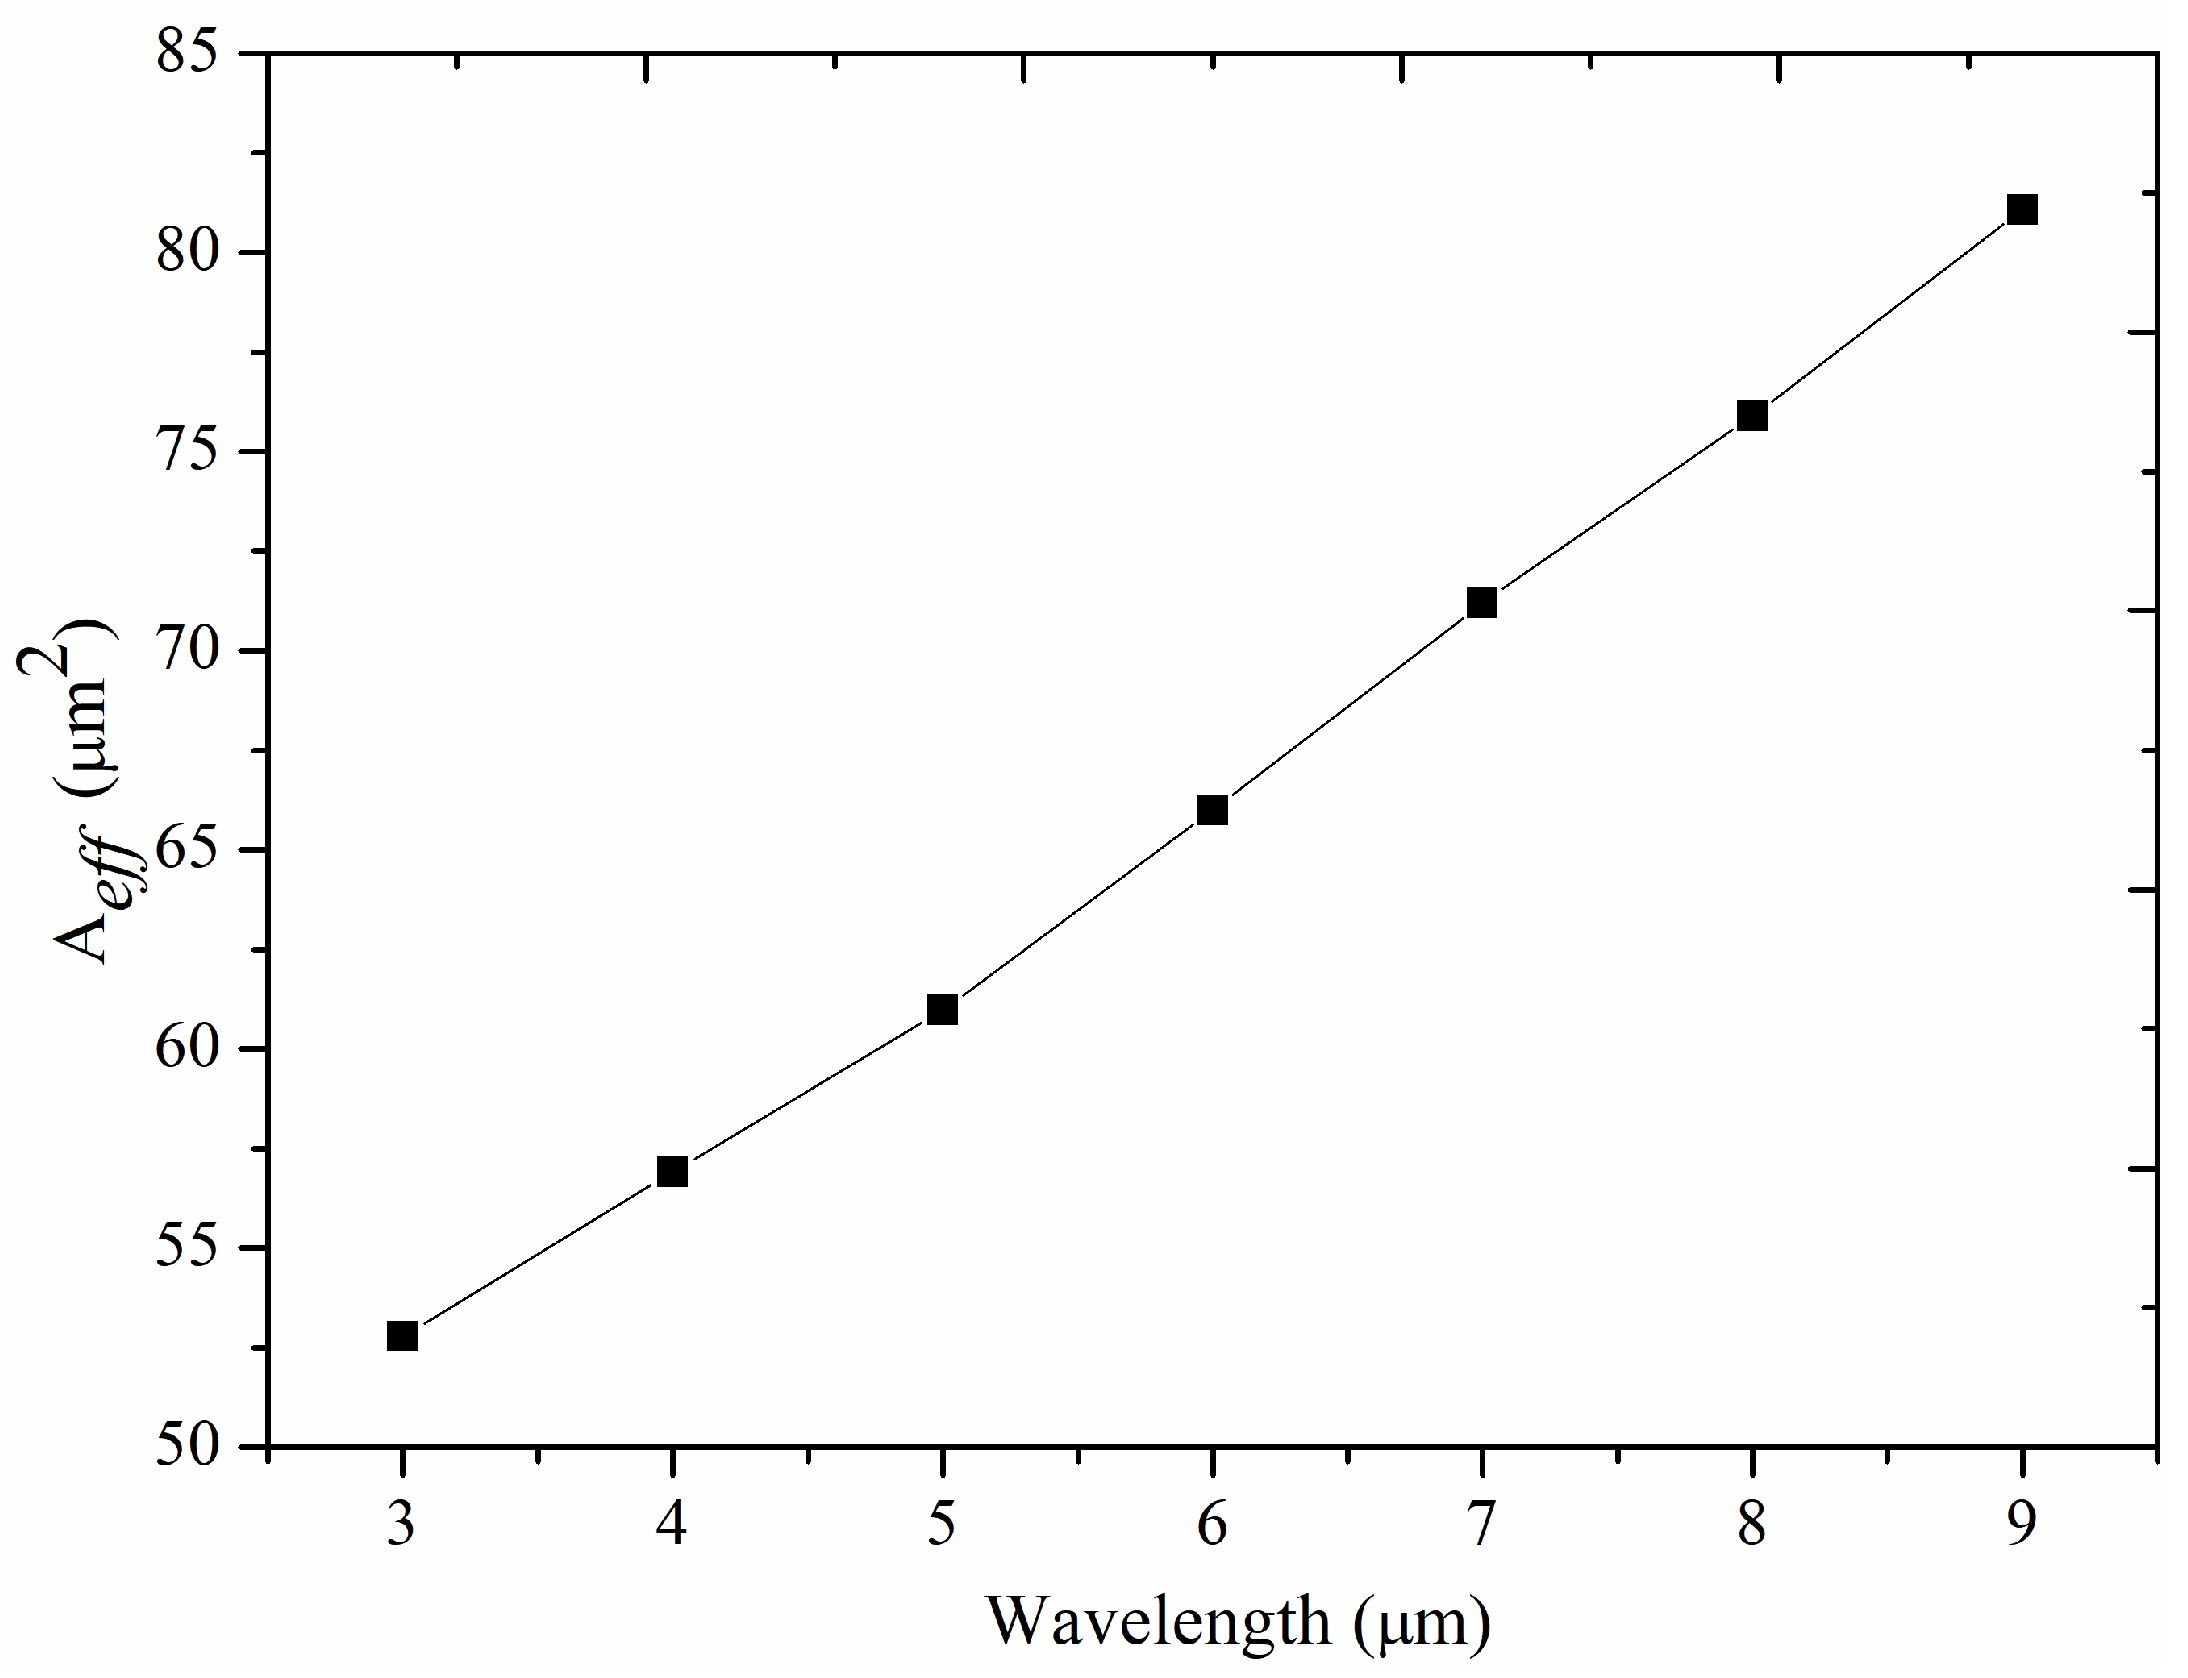
4.2. Other Parameters Needed in SC Simulation
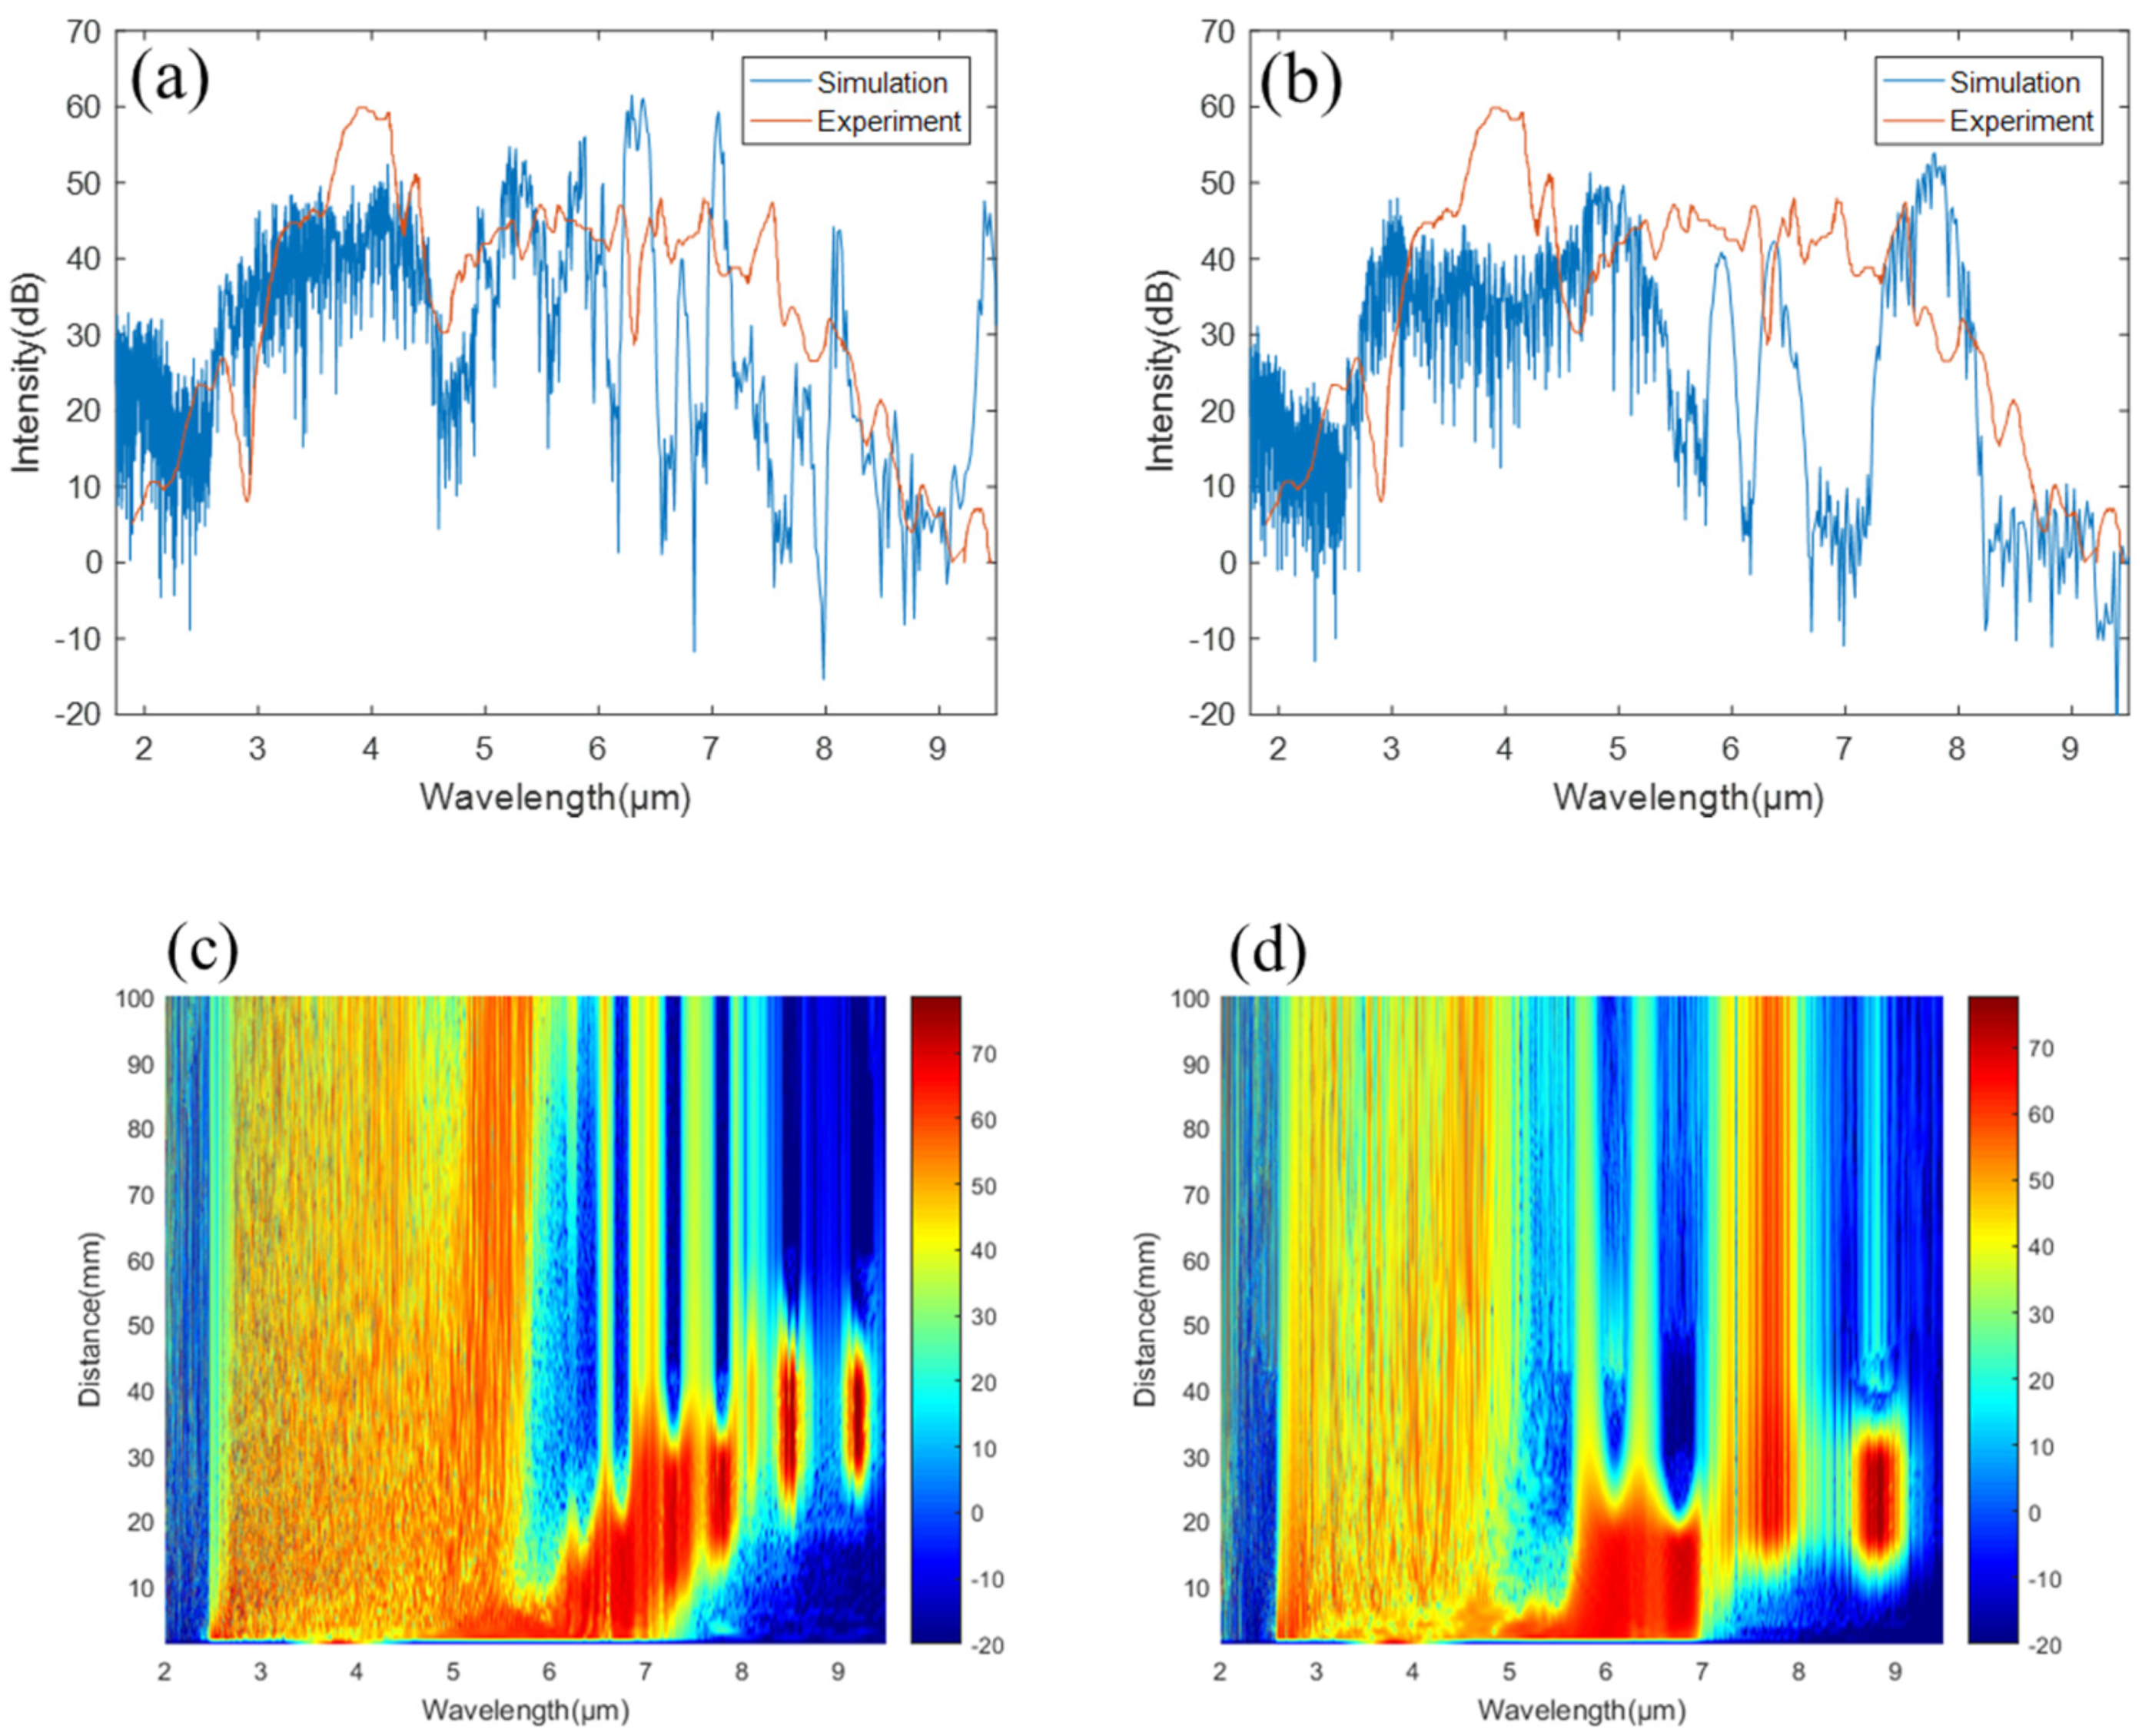
4.3. Comparison of SC Calculated Using Different Methods with Experimental Results
5. Conclusions
Author Contributions
Funding
Institutional Review Board Statement
Informed Consent Statement
Data Availability Statement
Conflicts of Interest
References
- Nguyen, D.M.; Le, S.D.; Lengle, K.; Méchin, D.; Thual, M.; Chartier, T.; Coulombier, Q.; Troles, J.; Bramerie, L.; Brilland, L.; et al. Demonstration of nonlinear effects in an ultra-highly nonlinear AsSe suspended-core chalcogenide fiber. IEEE Photonics Technol. Lett. 2010, 22, 1844–1846. [Google Scholar] [CrossRef]
- Diouf, M.; Wague, A.; Zghal, M. Numerical investigation of an ultra-broadband coherent mid-infrared supercontinuum in a chalcogenide AsSe 2-As 2 S 5 multimaterial photonic crystal fiber. JOSA B 2019, 36, A8–A14. [Google Scholar] [CrossRef]
- Poudel, C.; Kaminski, C.F. Supercontinuum radiation in fluorescence microscopy and biomedical imaging applications. JOSA B 2019, 36, A139–A153. [Google Scholar] [CrossRef]
- Nader, N.; Maser, D.L.; Cruz, F.C.; Kowligy, A.; Timmers, H.; Chiles, J.; Fredrick, C.; Westly, D.A.; Nam, S.D.; Mirin, R.P.; et al. Versatile silicon-waveguide supercontinuum for coherent mid-infrared spectroscopy. APL Photonics 2018, 3, 036102. [Google Scholar] [CrossRef]
- Wang, Y.; Dai, S. Mid-infrared supercontinuum generation in chalcogenide glass fibers: A brief review. PhotoniX 2021, 2, 9. [Google Scholar] [CrossRef]
- Feng, Z.; Wang, J.; Wu, G.; Wang, J.J.; Liang, X.L.; Xu, T.S.; Zhong, M.H.; Xiao, J.; Shen, J.F.; Zhao, Z.M.; et al. Arsenic-free low-loss sulfide glass fiber for mid-infrared supercontinuum generation. Infrared Phys. Technol. 2021, 113, 103618. [Google Scholar] [CrossRef]
- Eslami, Z.; Ryczkowski, P.; Amiot, C.; Salmela, L.; Genty, G. High-power short-wavelength infrared supercontinuum generation in multimode fluoride fiber. JOSA B 2019, 36, A72–A78. [Google Scholar] [CrossRef]
- Van Le, H.; Stępniewski, G.; Le Canh, T.; Minh, N.V.T.; Kasztelanic, R.; Klimczak, M.; Pniewski, J.; Dinh, K.X.; Heidt, A.M.; Buczyński, R.; et al. Low pump power coherent supercontinuum generation in heavy metal oxide solid-core photonic crystal fibers infiltrated with carbon tetrachloride covering 930–2500 nm. Opt. Express 2021, 29, 39586–39600. [Google Scholar] [CrossRef]
- Ghosh, A.N.; Meneghetti, M.; Petersen, C.R.; Bang, O.; Brilland, L.; Venck, S.; Troles, J.; Dudley, J.M.; Sylvestre, T. Chalcogenide-glass polarization-maintaining photonic crystal fiber for mid-infrared supercontinuum generation. J. Phys. Photonics 2019, 1, 044003. [Google Scholar] [CrossRef]
- Adamu, A.I.; Habib, M.S.; Petersen, C.R.; Lopez, J.E.A.; Zhou, B.; Schülzgen, A.; Bache, M.; Amezcua-Correa, R.; Bang, O.; Markos, C. Deep-UV to mid-IR supercontinuum generation driven by mid-IR ultrashort pulses in a gas-filled hollow-core fiber. Sci. Rep. 2019, 9, 4446. [Google Scholar] [CrossRef]
- Van, L.C.; Xuan, K.D.; Le Canh, T.; Doan, T.T.; Thi, T.N.; Van Le, H. Supercontinuum generation in chalcogenide photonic crystal fiber infiltrated with liquid. Opt. Mater. 2023, 137, 113547. [Google Scholar] [CrossRef]
- Le Canh, T.; Le Van, H.; Pysz, D.; Dinh, T.B.; Nguyen, D.T.; Dinh, Q.H.; Klimczak, M.; Kasztelanic, R.; Pniewski, J.; Buczynski, R.; et al. Supercontinuum generation in all-normal dispersion suspended core fiber infiltrated with water. Opt. Mater. Express 2020, 10, 1733–1748. [Google Scholar] [CrossRef]
- Kasztelanic, R.; Stępniewski, G.; Xuan, K.D.; Trippenbach, M.; Klimczak, M.; Buczyński, R.; Pniewski, J. Femtosecond supercontinuum generation around 1560 nm in hollow-core photonic crystal fibers filled with carbon tetrachloride. Appl. Opt. 2020, 59, 3720–3725. [Google Scholar]
- Kasztelanic, R.; Anuszkiewicz, A.; Stepniewski, G.; Filipkowski, A.; Ertman, S.; Pysz, D.; Wolinski, T.; Xuan, K.D.; Klimczak, M.; Buczynski, R.; et al. All-normal dispersion supercontinuum generation in photonic crystal fibers with large hollow cores infiltrated with toluene. Opt. Mater. Express 2018, 8, 3568–3582. [Google Scholar]
- Dai, S.; Wang, Y.Y.; Peng, X.F.; Zhang, P.Q.; Wang, X.S.; Xu, Y.S. A review of mid-infrared supercontinuum generation in chalcogenide glass fibers. Appl. Sci. 2018, 8, 707. [Google Scholar] [CrossRef]
- Cheng, T.; Nagasaka, K.; Tuan, T.H.; Xue, X.J.; Matsumoto, M.; Tezuka, H.; Suzuki, T.; Ohishi, Y. Mid-infrared supercontinuum generation spanning 2.0 to 15.1 μm in a chalcogenide step-index fiber. Opt. Lett. 2016, 41, 2117–2120. [Google Scholar] [CrossRef] [PubMed]
- Islam, A.S.M.T.U.; Ahmad, R.; Hossen, I.; Kabir, M.R.; Bishwas, M.S.; Faruqe, O. Wideband mid-infrared supercontinuum generation in chloroform filled suspended core fiber. In Proceedings of the 2020 2nd International Conference on Sustainable Technologies for Industry 4.0 (STI), Dhaka, Bangladesh, 19–20 December 2020; IEEE: Piscataway, NJ, USA, 2020; pp. 1–4. [Google Scholar]
- Li, G.; Peng, X.F.; Dai, S.X.; Wang, Y.Y.; Xie, M.; Yang, L.; Yang, C.F.; Wei, W.Y.; Zhang, P.Q. Highly coherent 1.5–8.3 μm broadband supercontinuum generation in tapered As–S chalcogenide fibers. J. Light. Technol. 2019, 37, 1847–1852. [Google Scholar] [CrossRef]
- Priyadarshini, P.; Sahoo, D.; Naik, R. A review on the optical properties of some germanium based chalcogenide thin films and their applications. Opt. Quantum Electron. 2022, 54, 166. [Google Scholar] [CrossRef]
- Ou, H.Y.; Dai, S.X.; Zhang, P.Q.; Liu, Z.J.; Wang, X.S.; Chen, F.F.; Xu, H.; Luo, B.; Huang, Y.C.; Wang, R.P. Ultrabroad supercontinuum generated from a highly nonlinear Ge–Sb–Se fiber. Opt. Lett. 2016, 41, 3201–3204. [Google Scholar] [CrossRef]
- Medjouri, A.; Abed, D. Modelling of all-chalcogenide all-normal dispersion photonic crystal fiber for ultraflat mid-infrared supercontinuum generation. Opt. Quantum Electron. 2021, 53, 399. [Google Scholar] [CrossRef]
- Li, L.X.; Yuan, J.H.; Sang, X.Z.; Yan, B.B.; Wang, K.R.; Yu, C.X. Ultraviolet to visible continuum generation in a silica photonic crystal fiber. Opt. Eng. 2018, 57, 026113. [Google Scholar] [CrossRef]
- Coen, S.; Chau, A.H.L.; Leonhardt, R.; Harvey, J.D.; Knight, J.C.; Wadsworth, W.J.; Russell, P.S.J. Supercontinuum generation by stimulated Raman scattering and parametric four-wave mixing in photonic crystal fibers. JOSA B 2002, 19, 753–764. [Google Scholar] [CrossRef]
- Wang, Q.Z.; Ho, P.P.; Alfano, R.R. Supercontinuum generation in condensed matter. In The Supercontinuum Laser Source: The Ultimate White Light; Springer International Publishing: Cham, Switzerland, 2023; pp. 33–125. [Google Scholar]
- Thi, T.N.; Trong, D.H.; Van, L.C. Supercontinuum generation in ultra-flattened near-zero dispersion PCF with C7H8 infiltration. Opt. Quantum Electron. 2023, 55, 93. [Google Scholar] [CrossRef]
- Dudley, J.M.; Genty, G.; Coen, S. Supercontinuum generation in photonic crystal fiber. Rev. Mod. Phys. 2006, 78, 1135. [Google Scholar] [CrossRef]
- Ferhat, M.L.; Cherbi, L.; Haddouche, I. Supercontinuum generation in silica photonic crystal fiber at 1.3 μm and 1.65 μm wavelengths for optical coherence tomography. Optik 2018, 152, 106–115. [Google Scholar] [CrossRef]
- Hu, J.; Menyuk, C.R.; Shaw, L.B.; Sanghera, J.S.; Aggarwal, I.D. Generating mid-IR source using As2S3-based chalcogenide photonic crystal fibers. In Proceedings of the Conference on Lasers and Electro-Optics, Baltimore, MD, USA, 31 May–5 June 2009; Optica Publishing Group: Washington, DC, USA, 2009. Paper CThN6. [Google Scholar]
- Vyas, S.; Tanabe, T.; Tiwari, M.; Singh, G. Chalcogenide photonic crystal fiber for ultraflat mid-infrared supercontinuum generation. Chin. Opt. Lett. 2016, 14, 123201. [Google Scholar] [CrossRef]
- Medjouri, A.; Abed, D.; Becer, Z. Numerical investigation of a broadband coherent supercontinuum generation in Ga8Sb32S60 chalcogenide photonic crystal fiber with all-normal dispersion. Opto-Electron. Rev. 2019, 27, 1–9. [Google Scholar] [CrossRef]
- Hollenbeck, D.; Cantrell, C.D. Multiple-vibrational-mode model for fiber-optic Raman gain spectrum and response function. JOSA B 2002, 19, 2886–2892. [Google Scholar] [CrossRef]
- Chen, Y.; Shen, X.; Wang, R.P.; Wang, G.X.; Dai, S.X.; Xu, T.F.; Nie, Q.H. Optical and structural properties of Ge–Sb–Se thin films fabricated by sputtering and thermal evaporation. J. Alloys Compd. 2013, 548, 155–160. [Google Scholar] [CrossRef]
- Wei, W.Y.; Peng, X.F.; Dai, S.X.; Wang, Y.Y.; Xie, M.; Yang, C.C.; Li, G.T.; Yang, P.L. Visible to mid-infrared supercontinuum generated in novel GeS2–Ga2S3–CsI step-index fibre. J. Mod. Opt. 2019, 66, 1190–1196. [Google Scholar] [CrossRef]
- Blow, K.J.; Wood, D. Theoretical description of transient stimulated Raman scattering in optical fibers. IEEE J. Quantum Electron. 1989, 25, 2665–2673. [Google Scholar] [CrossRef]
- Liu, L.; Qin, G.S.; Tian, Q.J.; Qin, W.P. Mid-infrared supercontinuum generation in single mode fluoride fiber. In Proceedings of the Photonics and Optoelectronics Meetings (POEM) 2011: Laser and Terahertz Science and Technology, Wuhan, China, 2–5 November 2011; SPIE: Bellingham, WA, USA, 2012; Volume 8330, pp. 291–300. [Google Scholar]
- Saini, T.S.; Hoa, N.P.T.; Tuan, T.H.; Xing, L.; Takenobu, S.; Yasutake, O. Tapered tellurite step-index optical fiber for coherent near-to-mid-IR supercontinuum generation: Experiment and modeling. Appl. Opt. 2019, 58, 415–421. [Google Scholar] [CrossRef] [PubMed]
- Cheshmberah, A.; Seifouri, M.; Olyaee, S. Design of all-normal dispersion with Ge11.5As24Se64.5/Ge20Sb15Se65 chalcogenide PCF pumped at 1300 nm for supercontinuum generation. Opt. Quantum Electron. 2021, 53, 461. [Google Scholar] [CrossRef]
- Lin, Q.; Agrawal, G.P. Raman response function for silica fibers. Opt. Lett. 2006, 31, 3086–3088. [Google Scholar] [CrossRef] [PubMed]
- Stolen, R.H.; Gordon, J.P.; Tomlinson, W.J.; Haus, H.A. Raman response function of silica-core fibers. JOSA B 1989, 6, 1159–1166. [Google Scholar] [CrossRef]
- Peng, X.F.; Dai, S.X.; Xu, D.; Xu, H.; Li, X.; Lin, C.G.; Zhang, P.Q.; Xu, T.F. Structures of Ge15SbxSe85−x chalcogenide glasses affect their Raman gain performance. Appl. Phys. B 2017, 123, 261. [Google Scholar] [CrossRef]
- Agrawal, G.P. Nonlinear fiber optics. In Nonlinear Science at the Dawn of the 21st Century; Springer: Berlin/Heidelberg, Germany, 2000; pp. 195–211. [Google Scholar]
- Yan, X.; Kito, C.; Miyoshi, S.; Liao, M.S.; Suzuki, T.; Ohishi, Y. Raman transient response and enhanced soliton self-frequency shift in ZBLAN fiber. JOSA B 2012, 29, 238–243. [Google Scholar] [CrossRef]
- Ma, P.; Choi, D.Y.; Yu, Y.; Gai, X.; Yang, Z.Y.; Debbarma, S.; Madden, S.; Luther-Davies, B. Low-loss chalcogenide waveguides for chemical sensing in the mid-infrared. Opt. Express 2013, 21, 29927–29937. [Google Scholar] [CrossRef]
- Dantanarayana, H.G.; Abdel-Moneim, N.; Tang, Z.Q.; Sojka, L.; Sujecki, S.; Furniss, D.; Seddon, A.B.; Kubat, I.; Bang, O.; Benson, T.M. Refractive index dispersion of chalcogenide glasses for ultra-high numerical-aperture fiber for mid-infrared supercontinuum generation. Opt. Mater. Express 2014, 4, 1444–1455. [Google Scholar] [CrossRef]
- Xia, D.; Huang, Y.F.; Zhang, B.; Yang, Z.L.; Zeng, P.Y.; Shang, H.Y.; Cheng, H.J.; Liu, L.H.; Zhang, M.J.; Zhu, Y.; et al. On-chip broadband mid-infrared supercontinuum generation based on highly nonlinear chalcogenide glass waveguides. Front. Phys. 2021, 9, 598091. [Google Scholar] [CrossRef]
- Kubat, I.; Agger, C.S.; Moselund, P.M.; Bang, O. Mid-infrared supercontinuum generation to 4.5 μm in uniform and tapered ZBLAN step-index fibers by direct pumping at 1064 or 1550 nm. JOSA B 2013, 30, 2743–2757. [Google Scholar] [CrossRef]
- Yuan, Y.; Yang, P.L.; Peng, X.F.; Cao, Z.F.; Ding, S.J.; Zhang, N.; Liu, Z.J.; Zhang, P.Q.; Wang, X.S.; Dai, S.X. Ultrabroadband and coherent mid-infrared supercontinuum generation in all-normal dispersion Te-based chalcogenide all-solid microstructured fiber. JOSA B 2020, 37, 227–232. [Google Scholar] [CrossRef]


| Mode Number i | Component Position (cm−1) | Peak Intensity Ai = Ai’/wv,i (10−12 m/w/THz) | Gaussian FWHM (cm−1) | Lorentzian FWHM (cm−1) |
|---|---|---|---|---|
| 1 | 49.63 | 4.14 | 10.07 | 3.36 |
| 2 | 59.55 | 7.20 | 16.35 | 5.54 |
| 3 | 75.90 | 10.86 | 27.30 | 9.10 |
| 4 | 103.96 | 17.61 | 43.48 | 14.49 |
| 5 | 198.10 | 26.79 | 27.99 | 9.33 |
| 6 | 212.44 | 22.58 | 84.78 | 28.26 |
| 7 | 257.42 | 4.87 | 16.74 | 5.58 |
| Ge12.5Sb15Se72.5 | Ge15Sb10Se75 | ||
|---|---|---|---|
| 45.2485 | 36,530.3824 | 5.6454 | 0.0530 |
| 6.1319 | 0.0276 | 1.5523 | 2287.1588 |
Disclaimer/Publisher’s Note: The statements, opinions and data contained in all publications are solely those of the individual author(s) and contributor(s) and not of MDPI and/or the editor(s). MDPI and/or the editor(s) disclaim responsibility for any injury to people or property resulting from any ideas, methods, instructions or products referred to in the content. |
© 2023 by the authors. Licensee MDPI, Basel, Switzerland. This article is an open access article distributed under the terms and conditions of the Creative Commons Attribution (CC BY) license (https://creativecommons.org/licenses/by/4.0/).
Share and Cite
Wu, Z.; Ding, Y.; Peng, X. Exact Solution of the Raman Response Function of Chalcogenide Fiber and Its Influence on the Mid-Infrared Supercontinuum. Appl. Sci. 2023, 13, 12923. https://doi.org/10.3390/app132312923
Wu Z, Ding Y, Peng X. Exact Solution of the Raman Response Function of Chalcogenide Fiber and Its Influence on the Mid-Infrared Supercontinuum. Applied Sciences. 2023; 13(23):12923. https://doi.org/10.3390/app132312923
Chicago/Turabian StyleWu, Zhijian, Yang Ding, and Xuefeng Peng. 2023. "Exact Solution of the Raman Response Function of Chalcogenide Fiber and Its Influence on the Mid-Infrared Supercontinuum" Applied Sciences 13, no. 23: 12923. https://doi.org/10.3390/app132312923
APA StyleWu, Z., Ding, Y., & Peng, X. (2023). Exact Solution of the Raman Response Function of Chalcogenide Fiber and Its Influence on the Mid-Infrared Supercontinuum. Applied Sciences, 13(23), 12923. https://doi.org/10.3390/app132312923