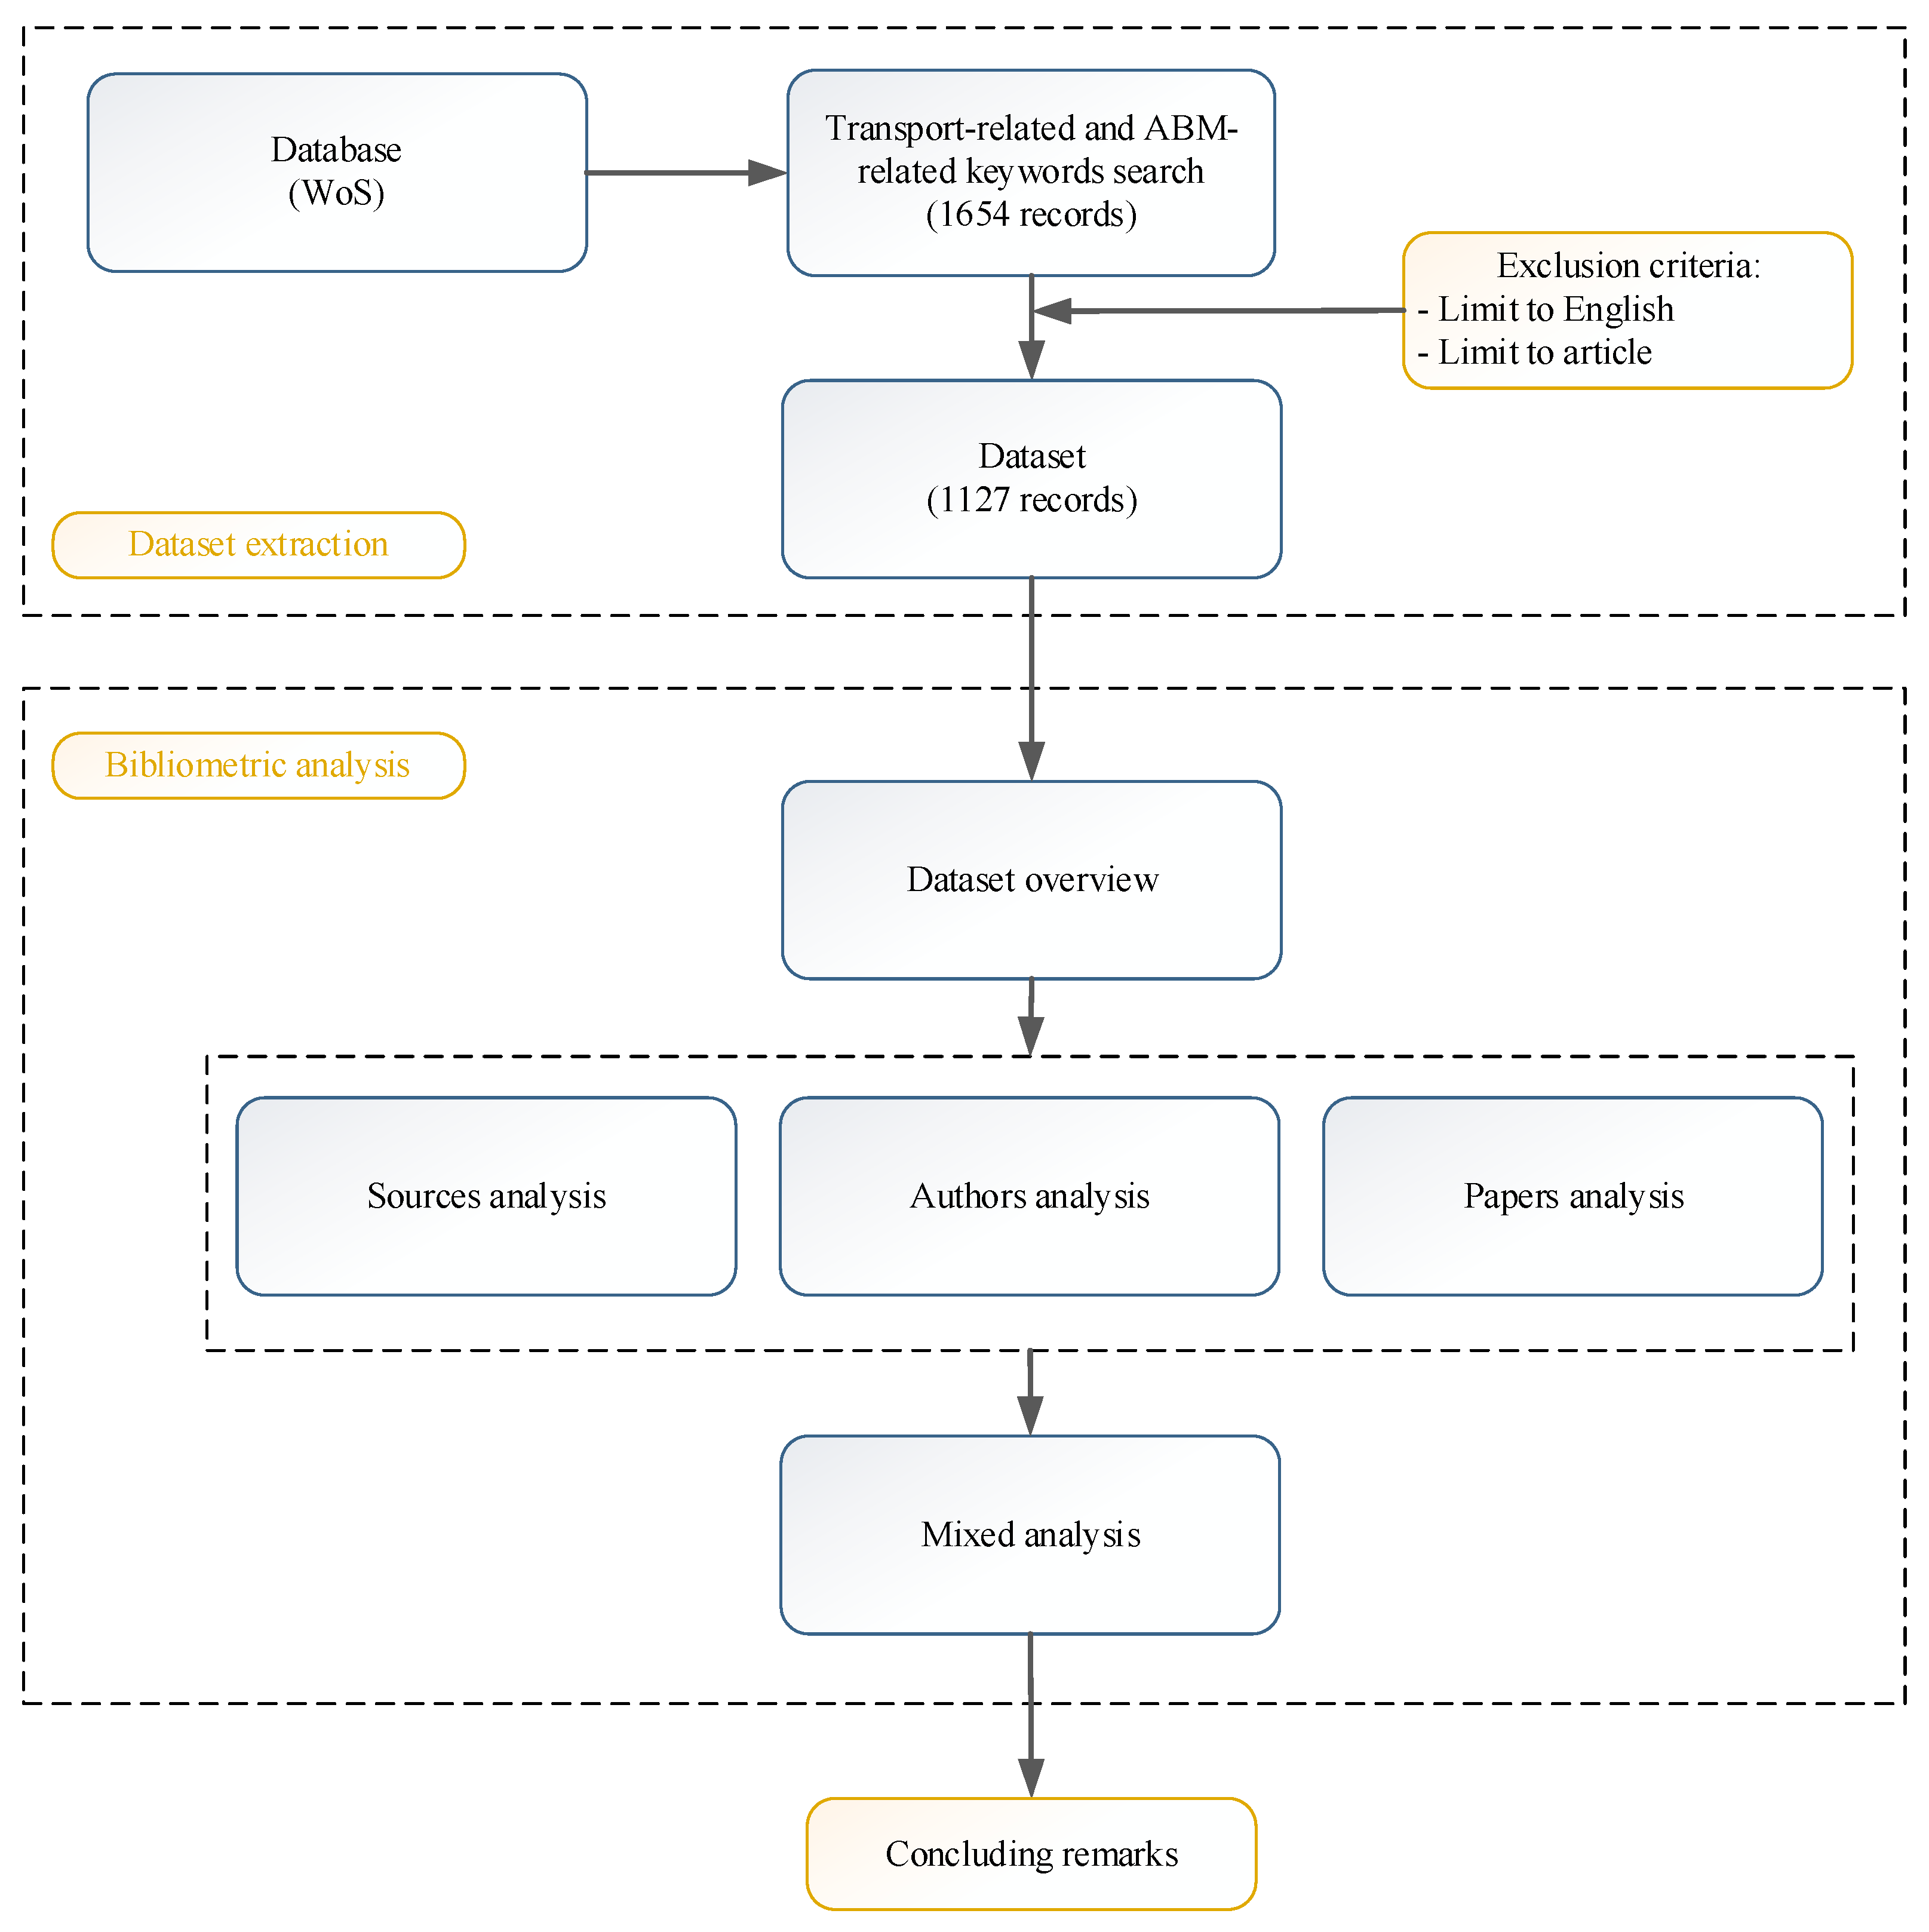
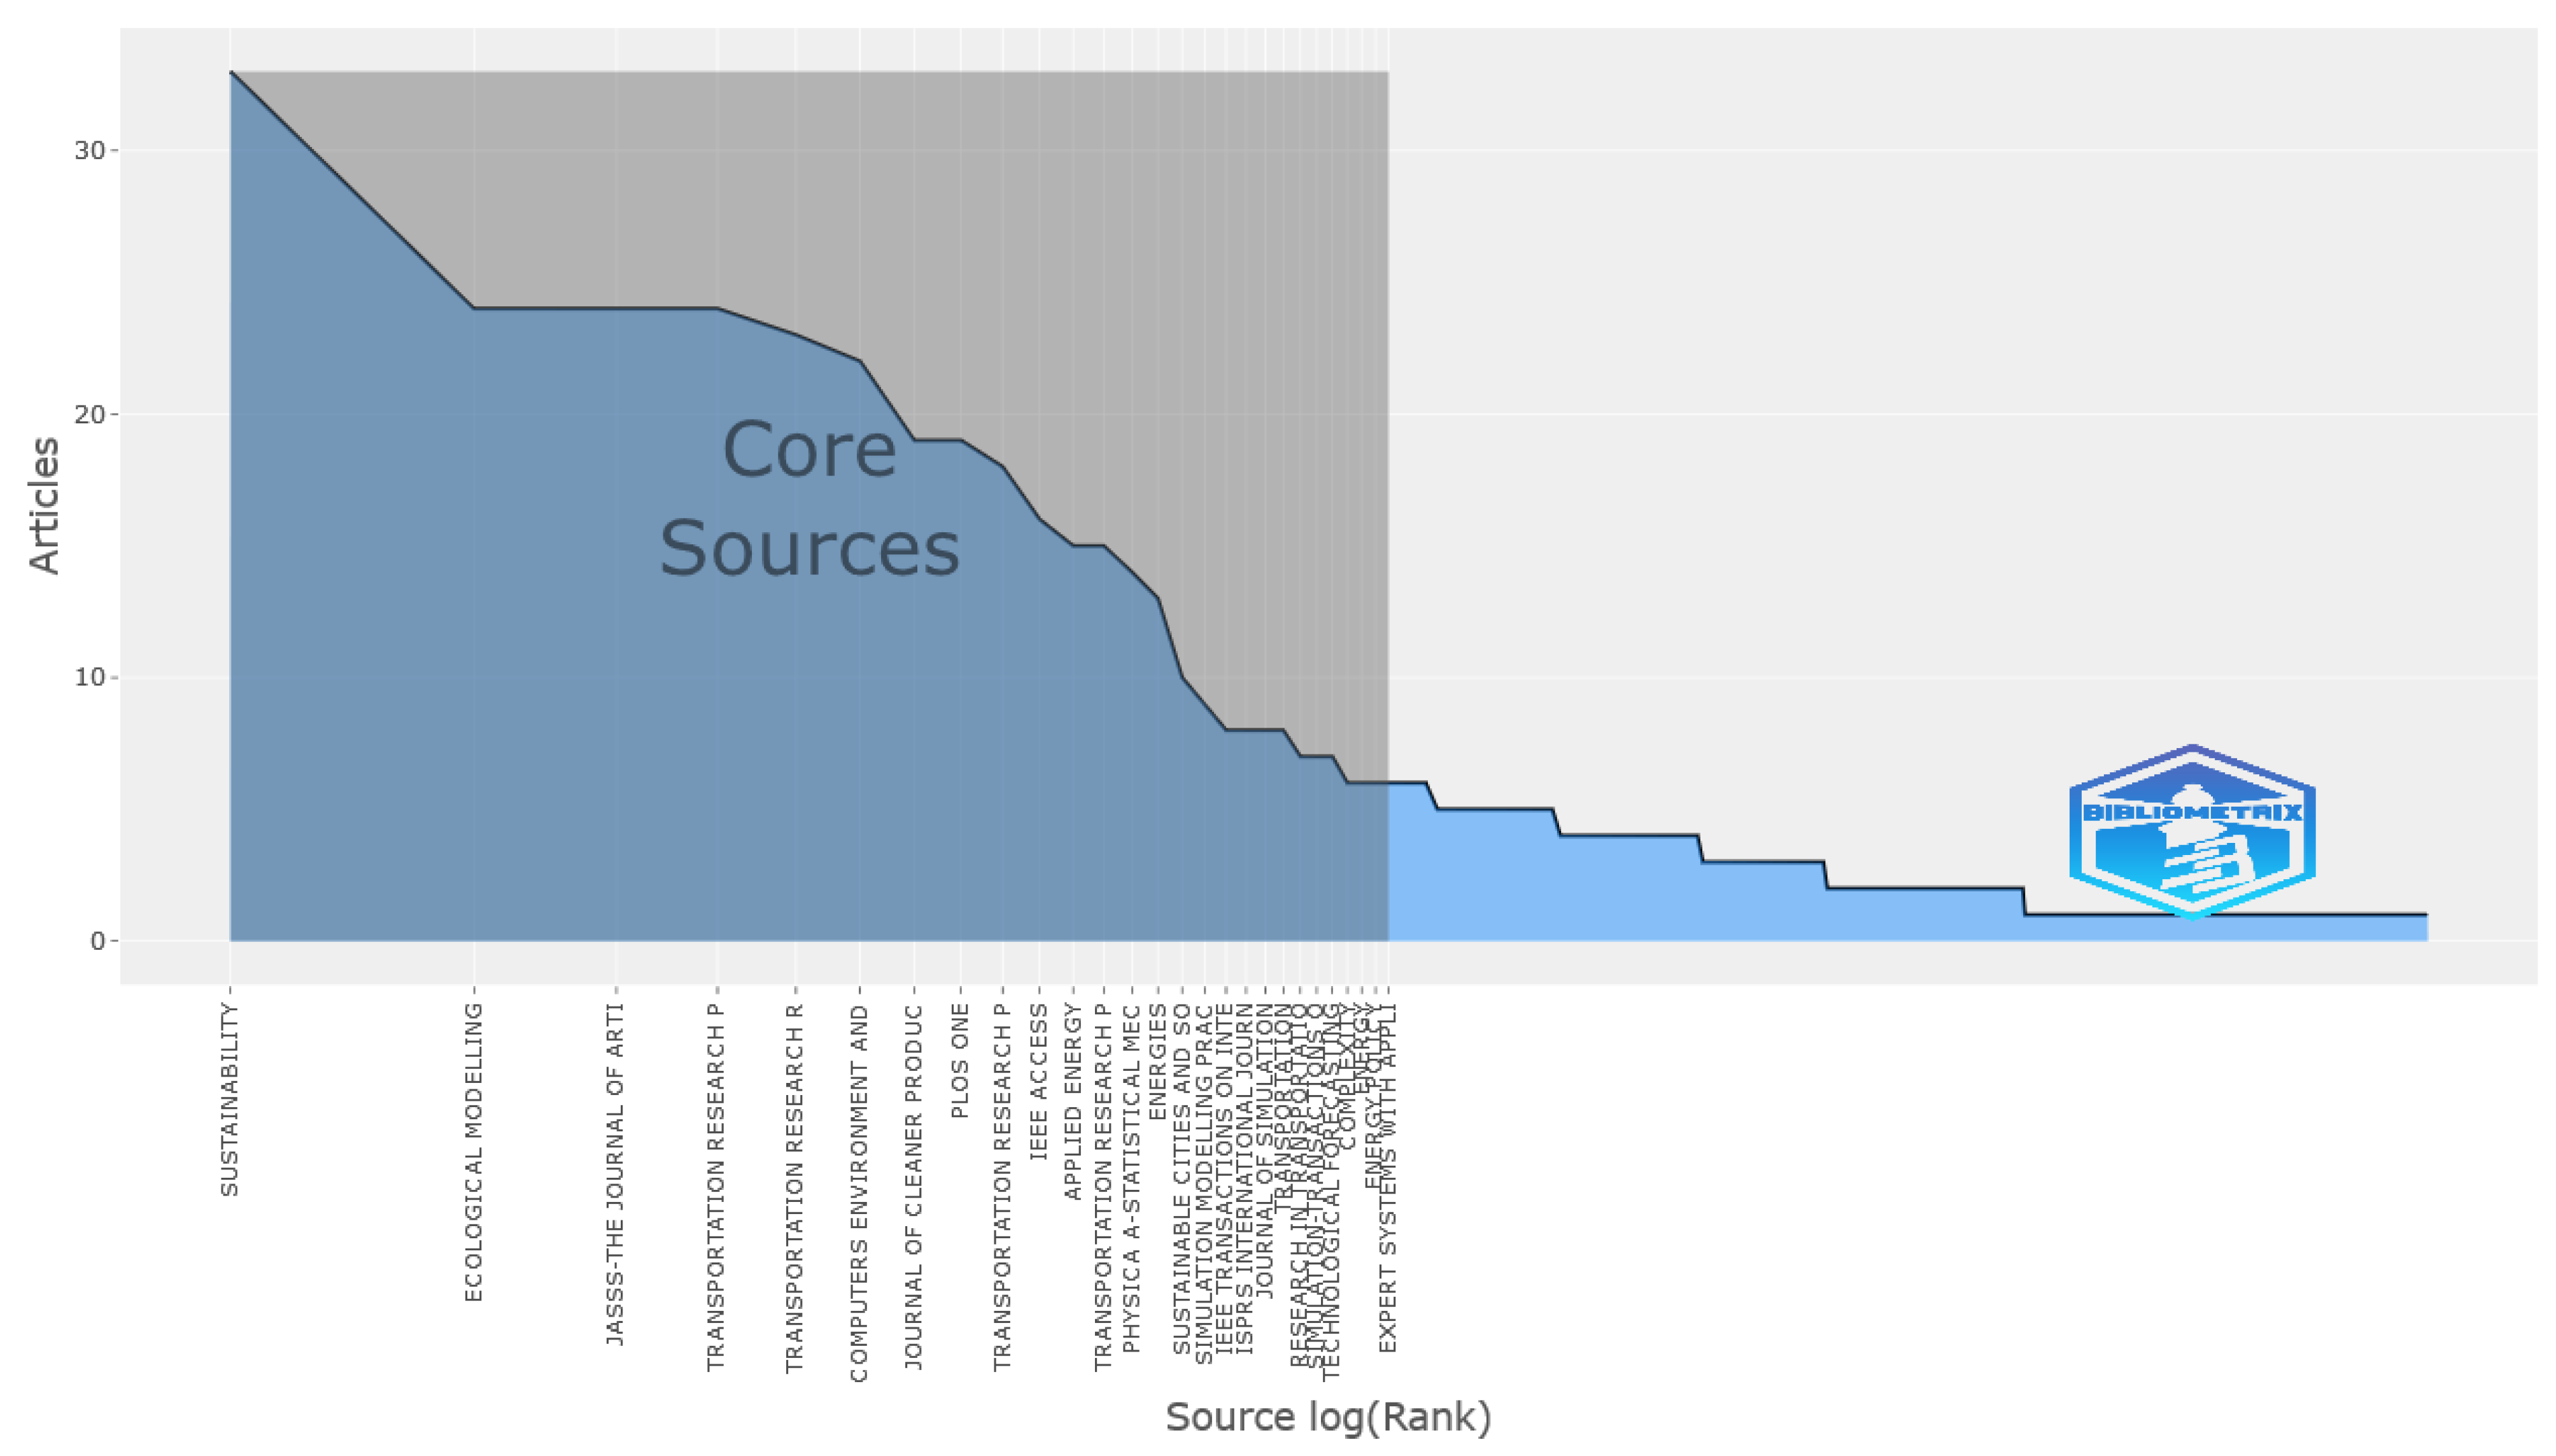
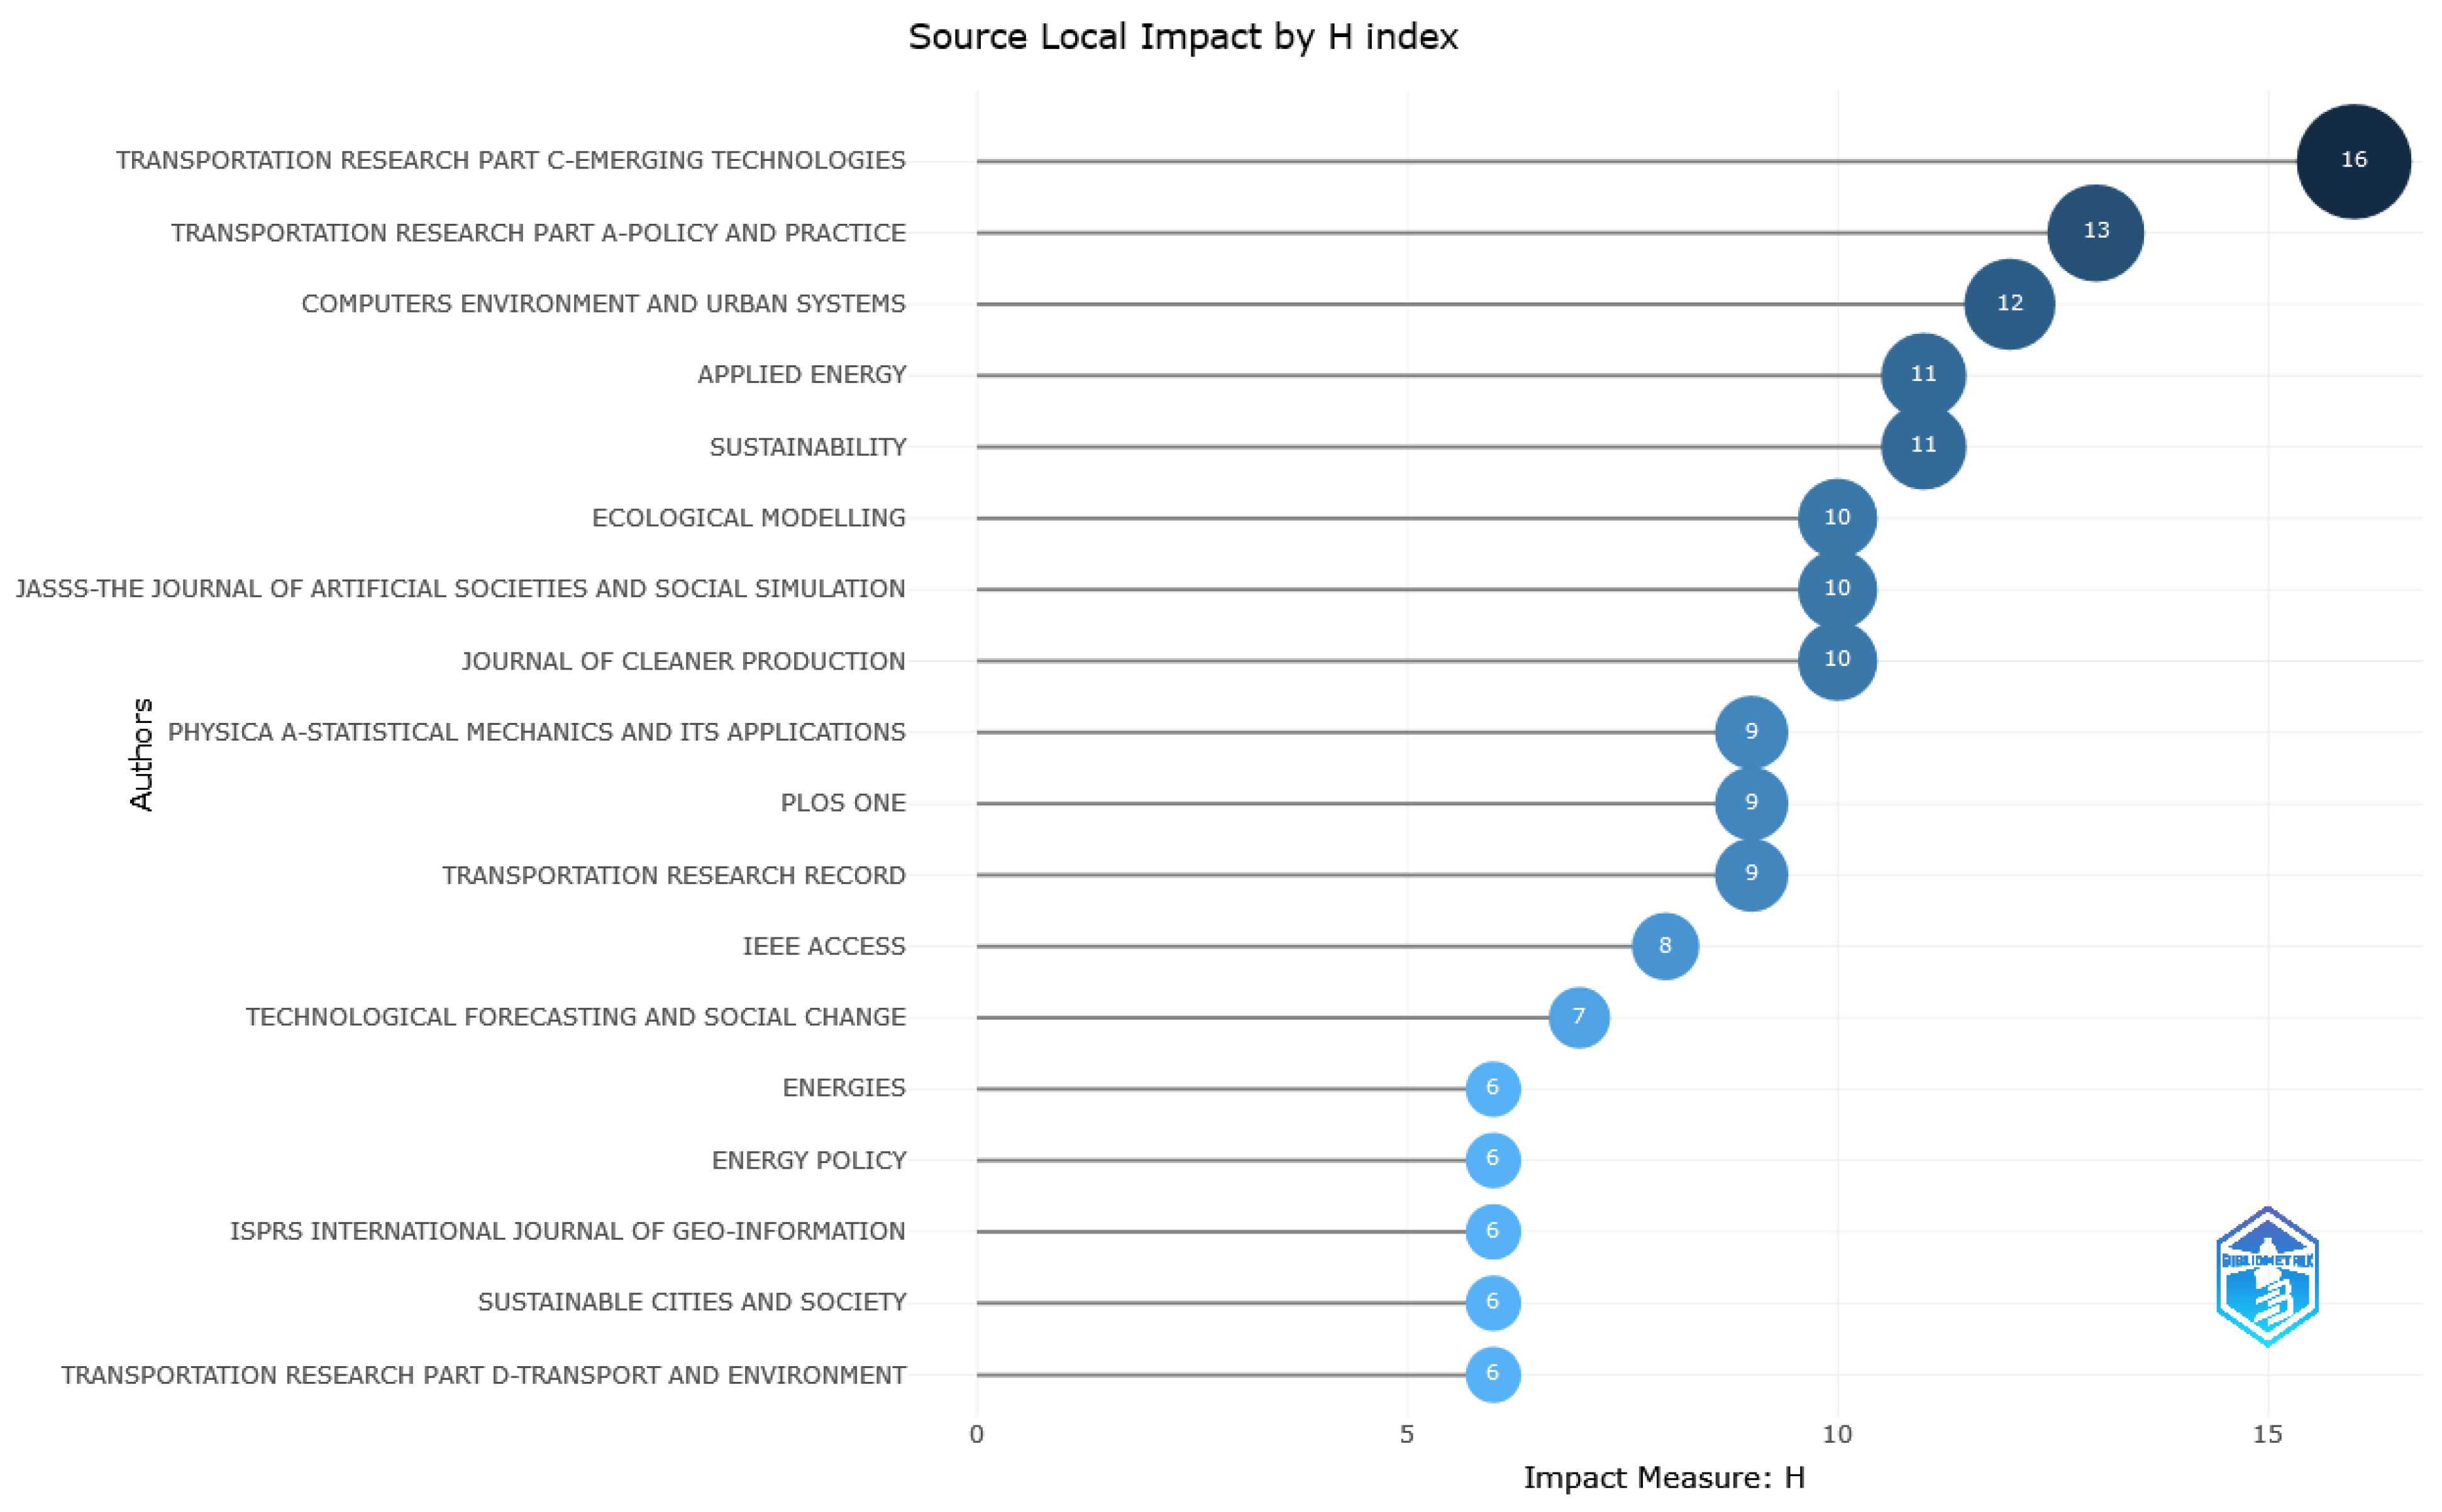
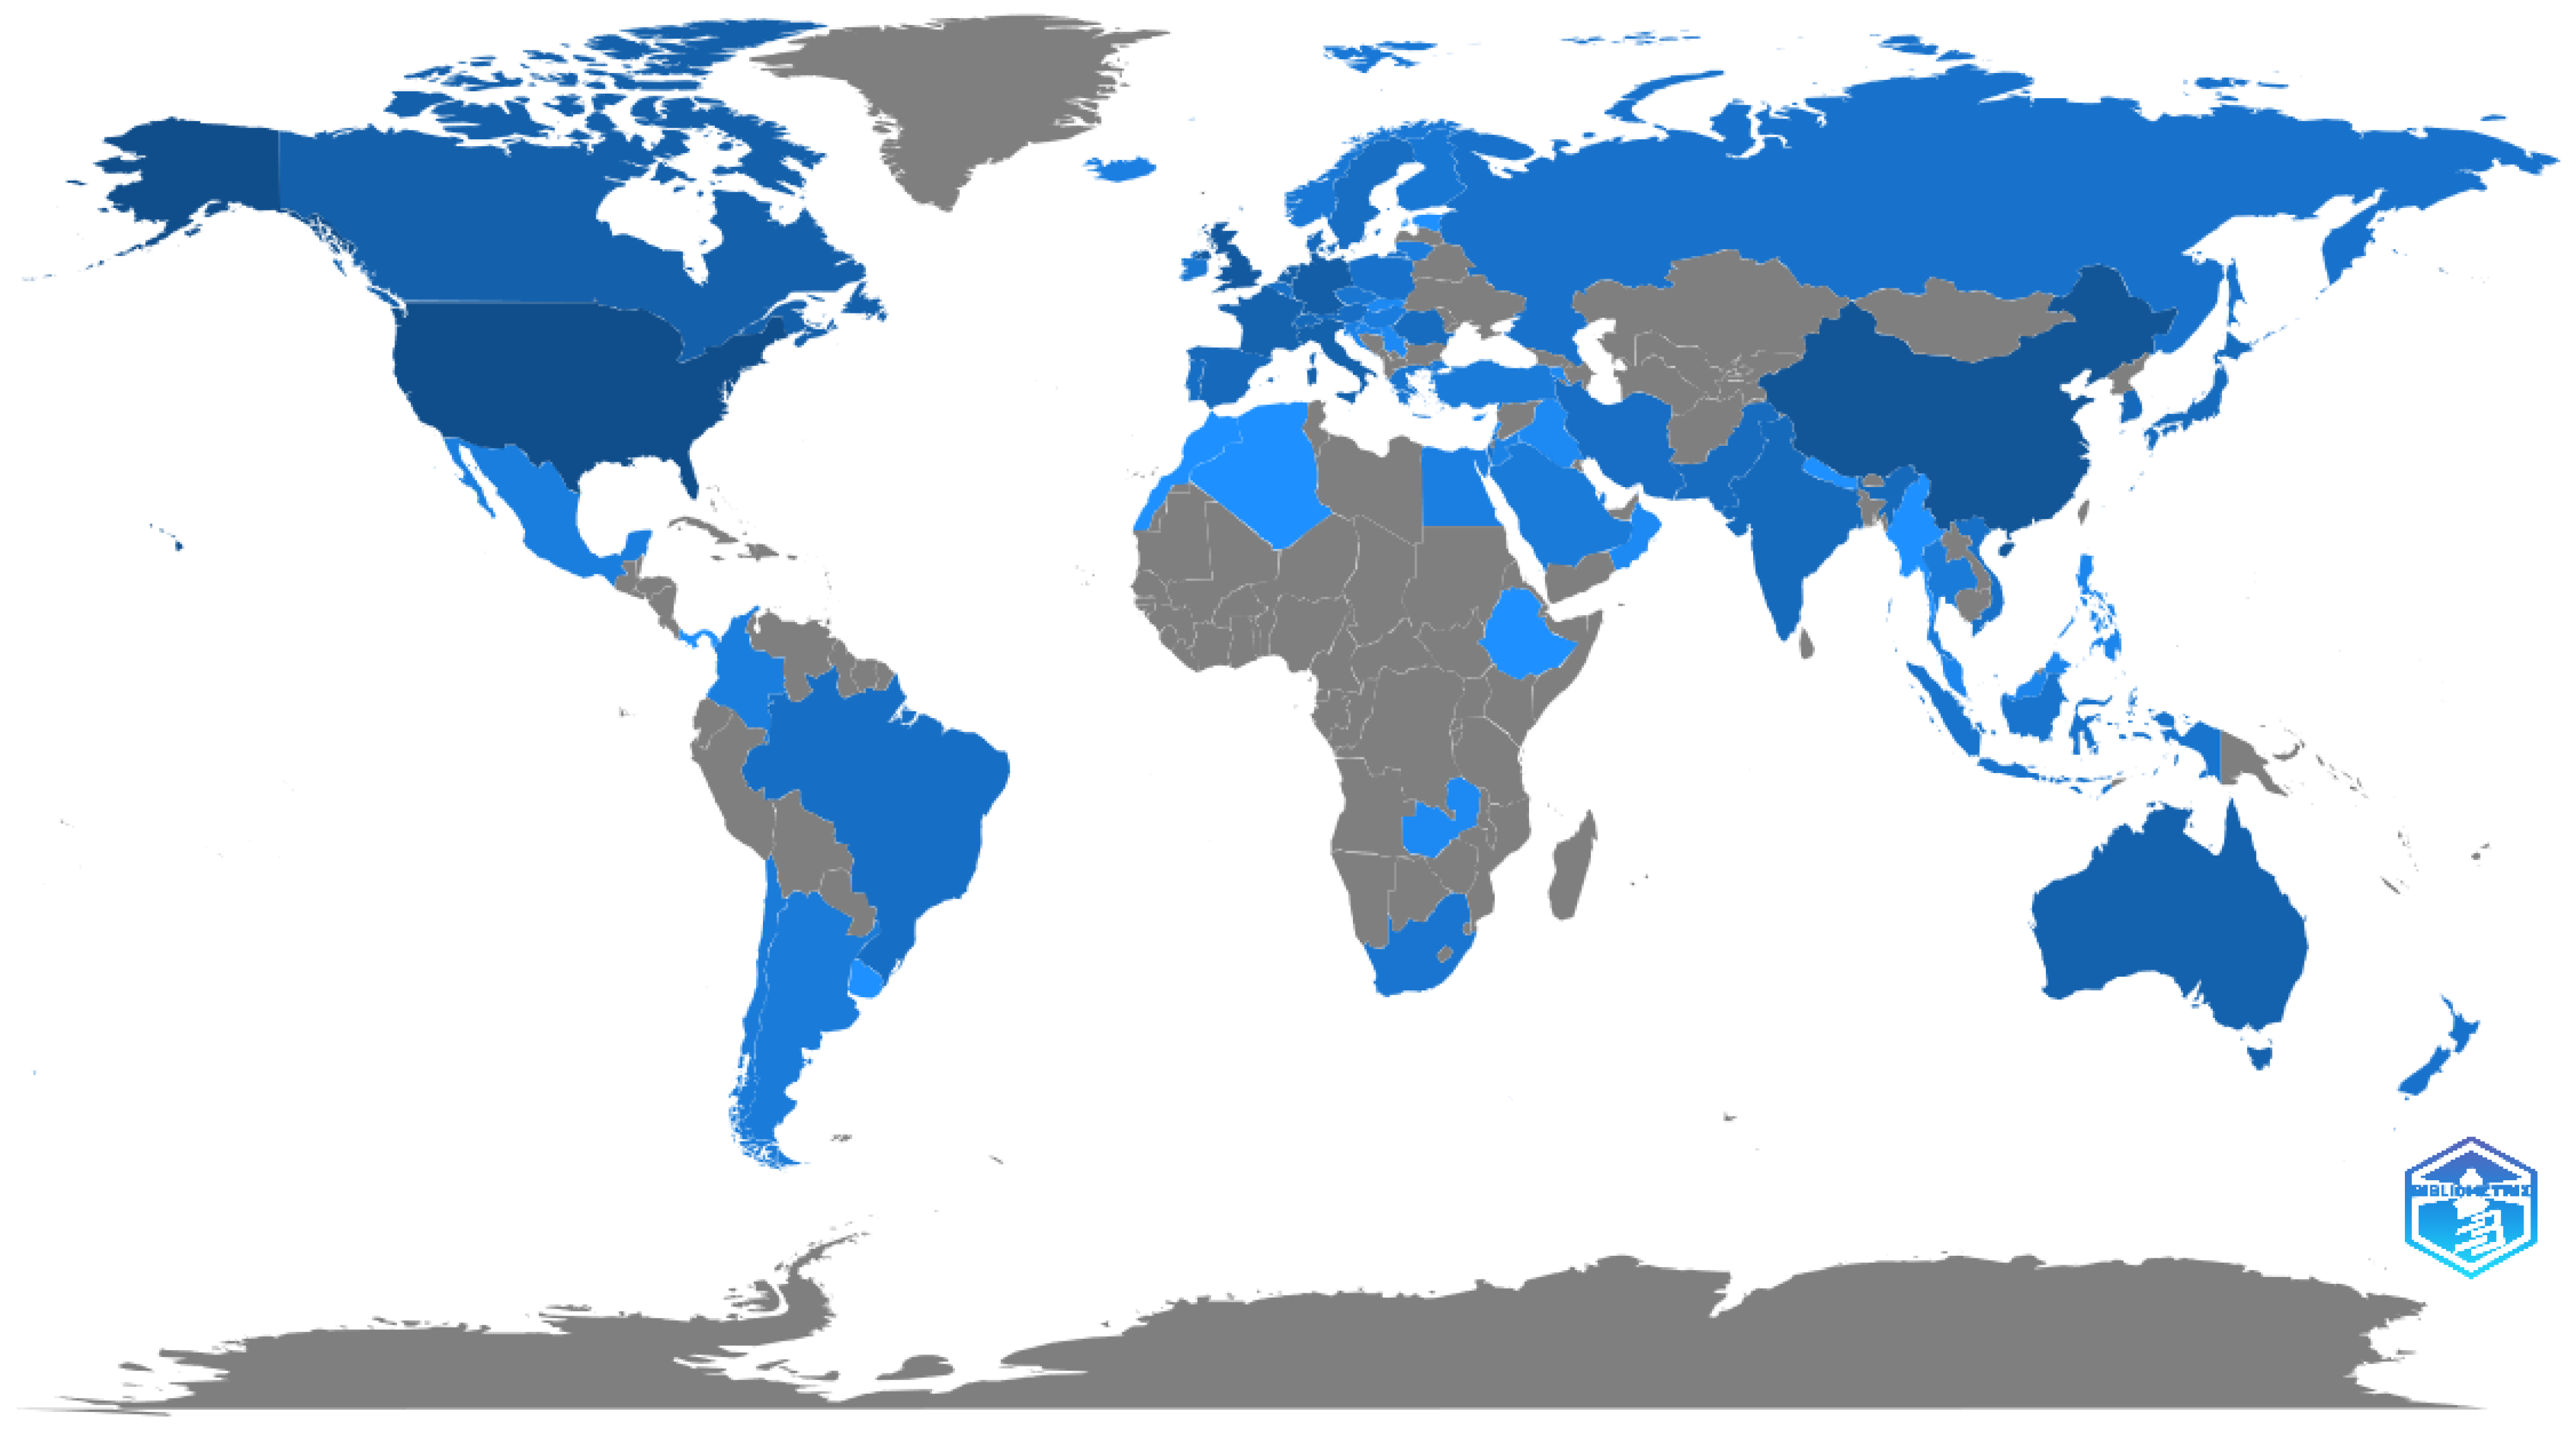
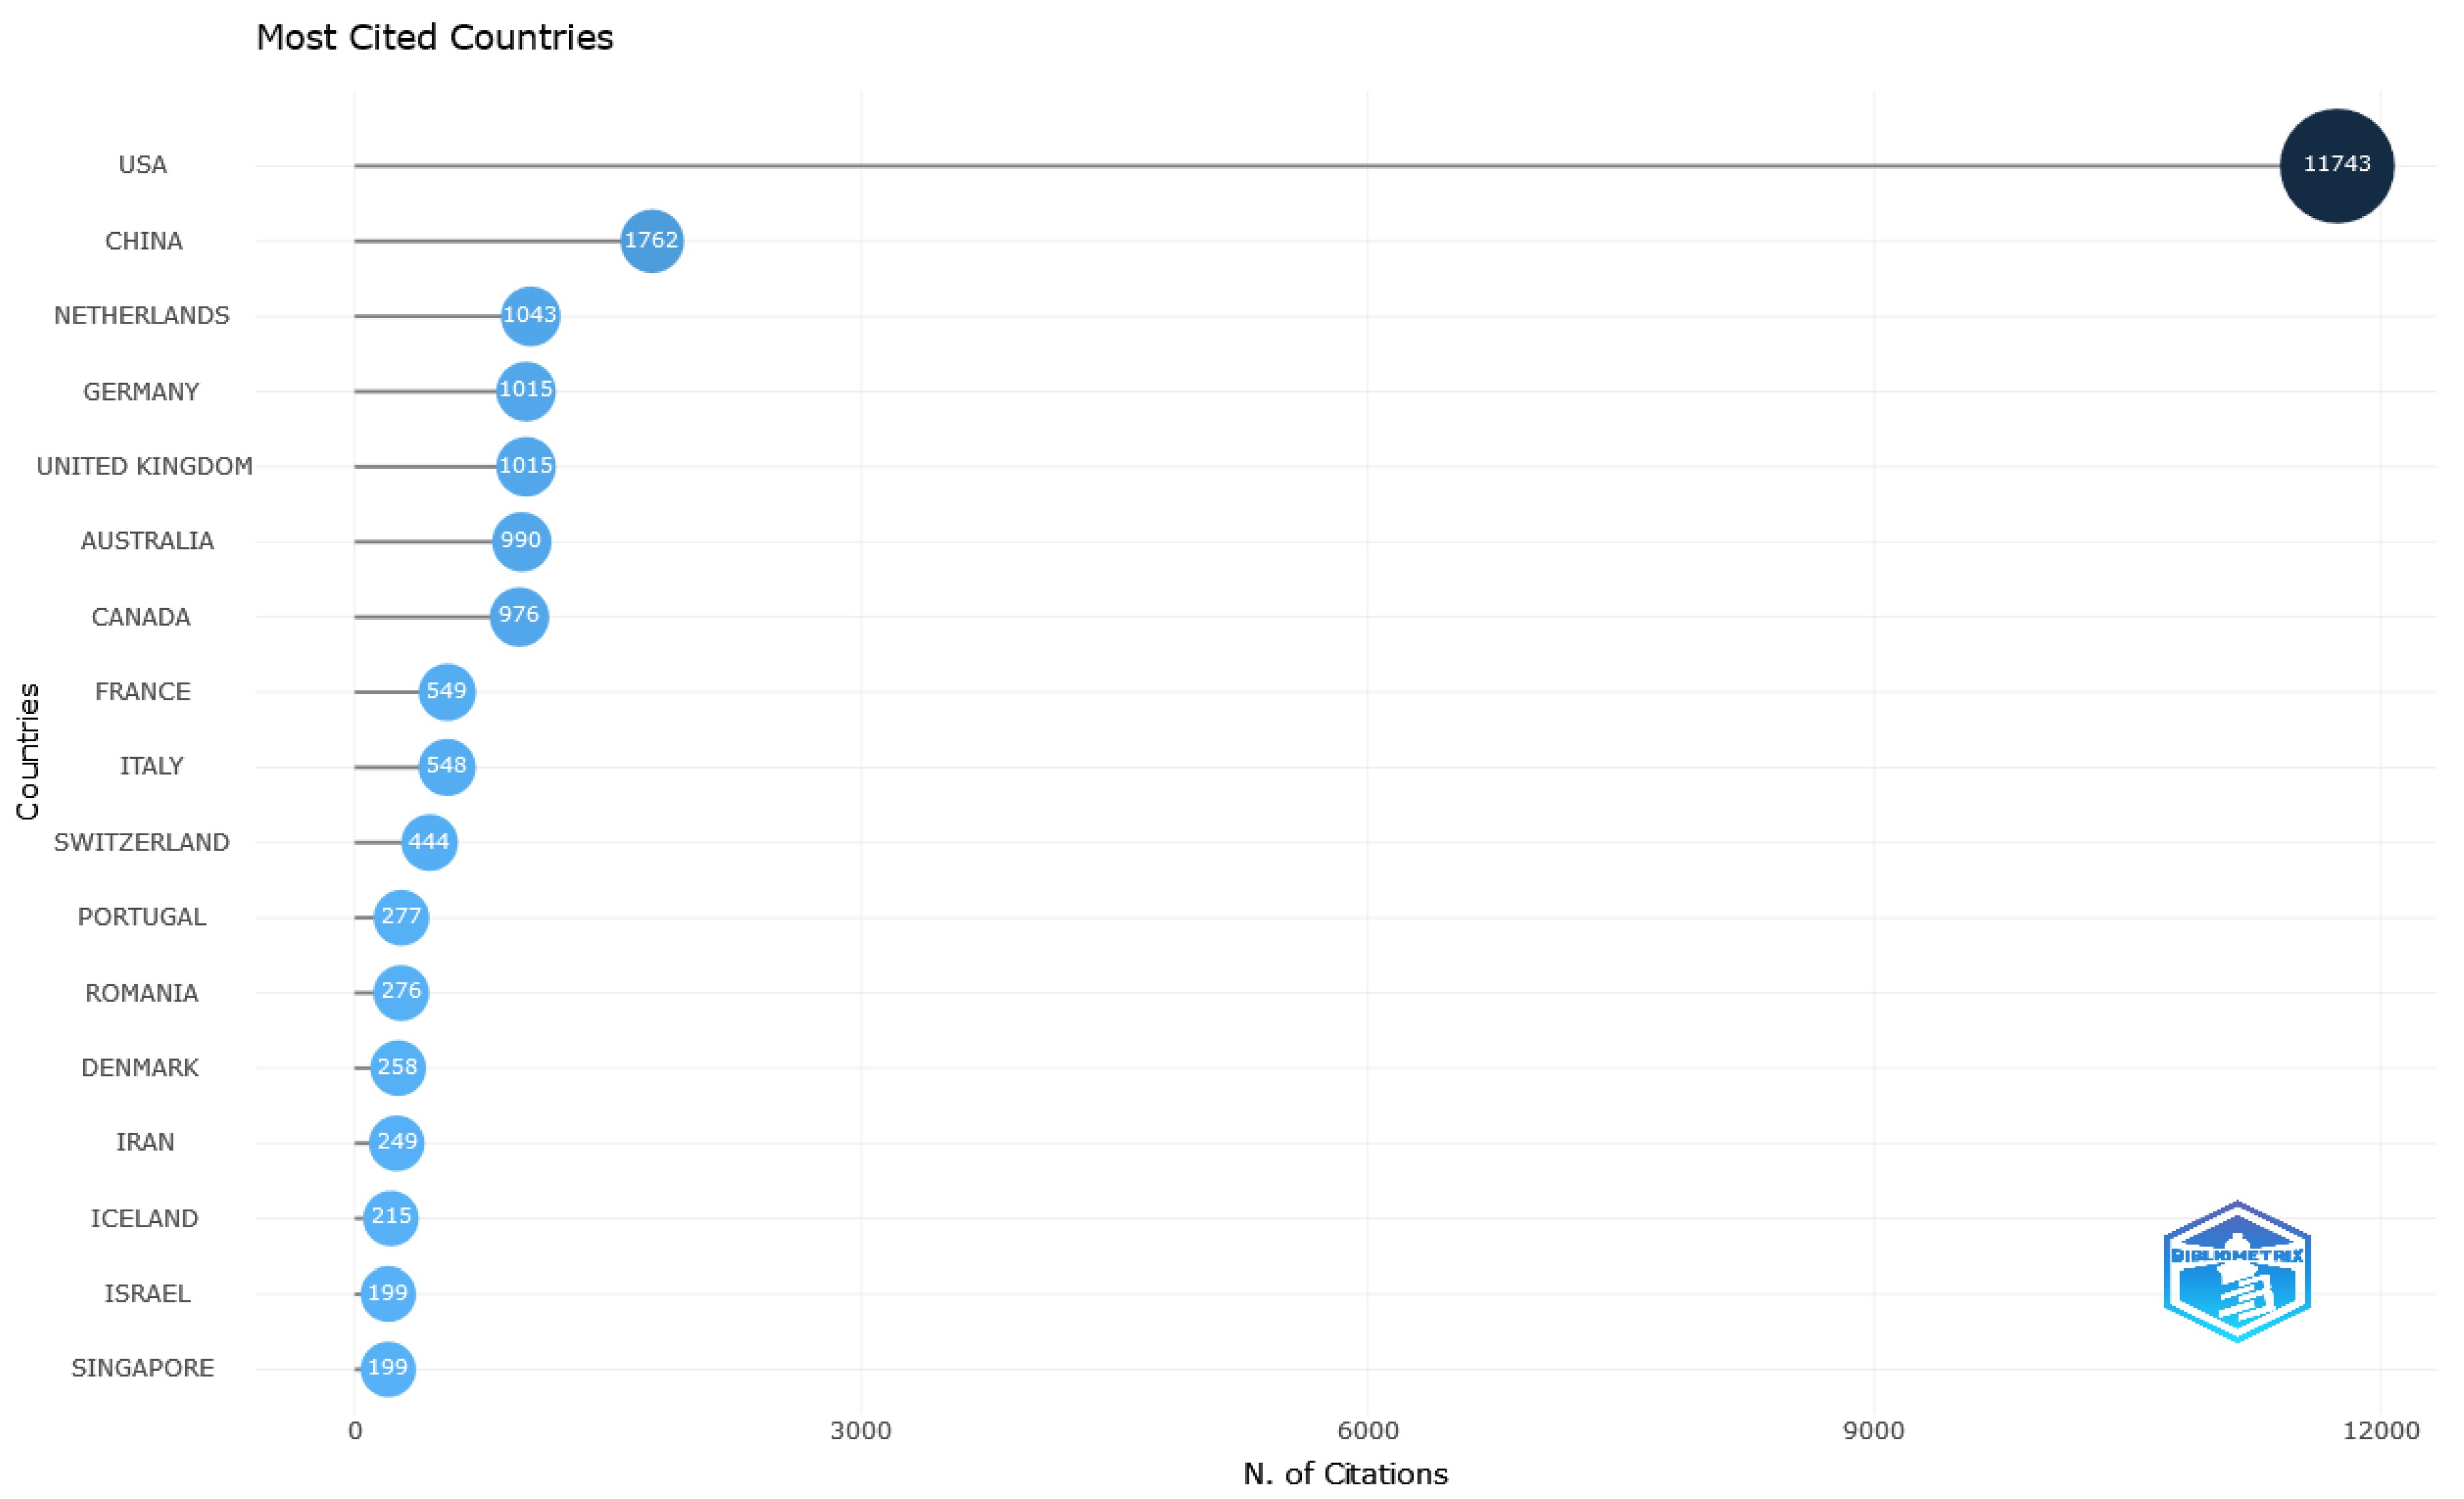
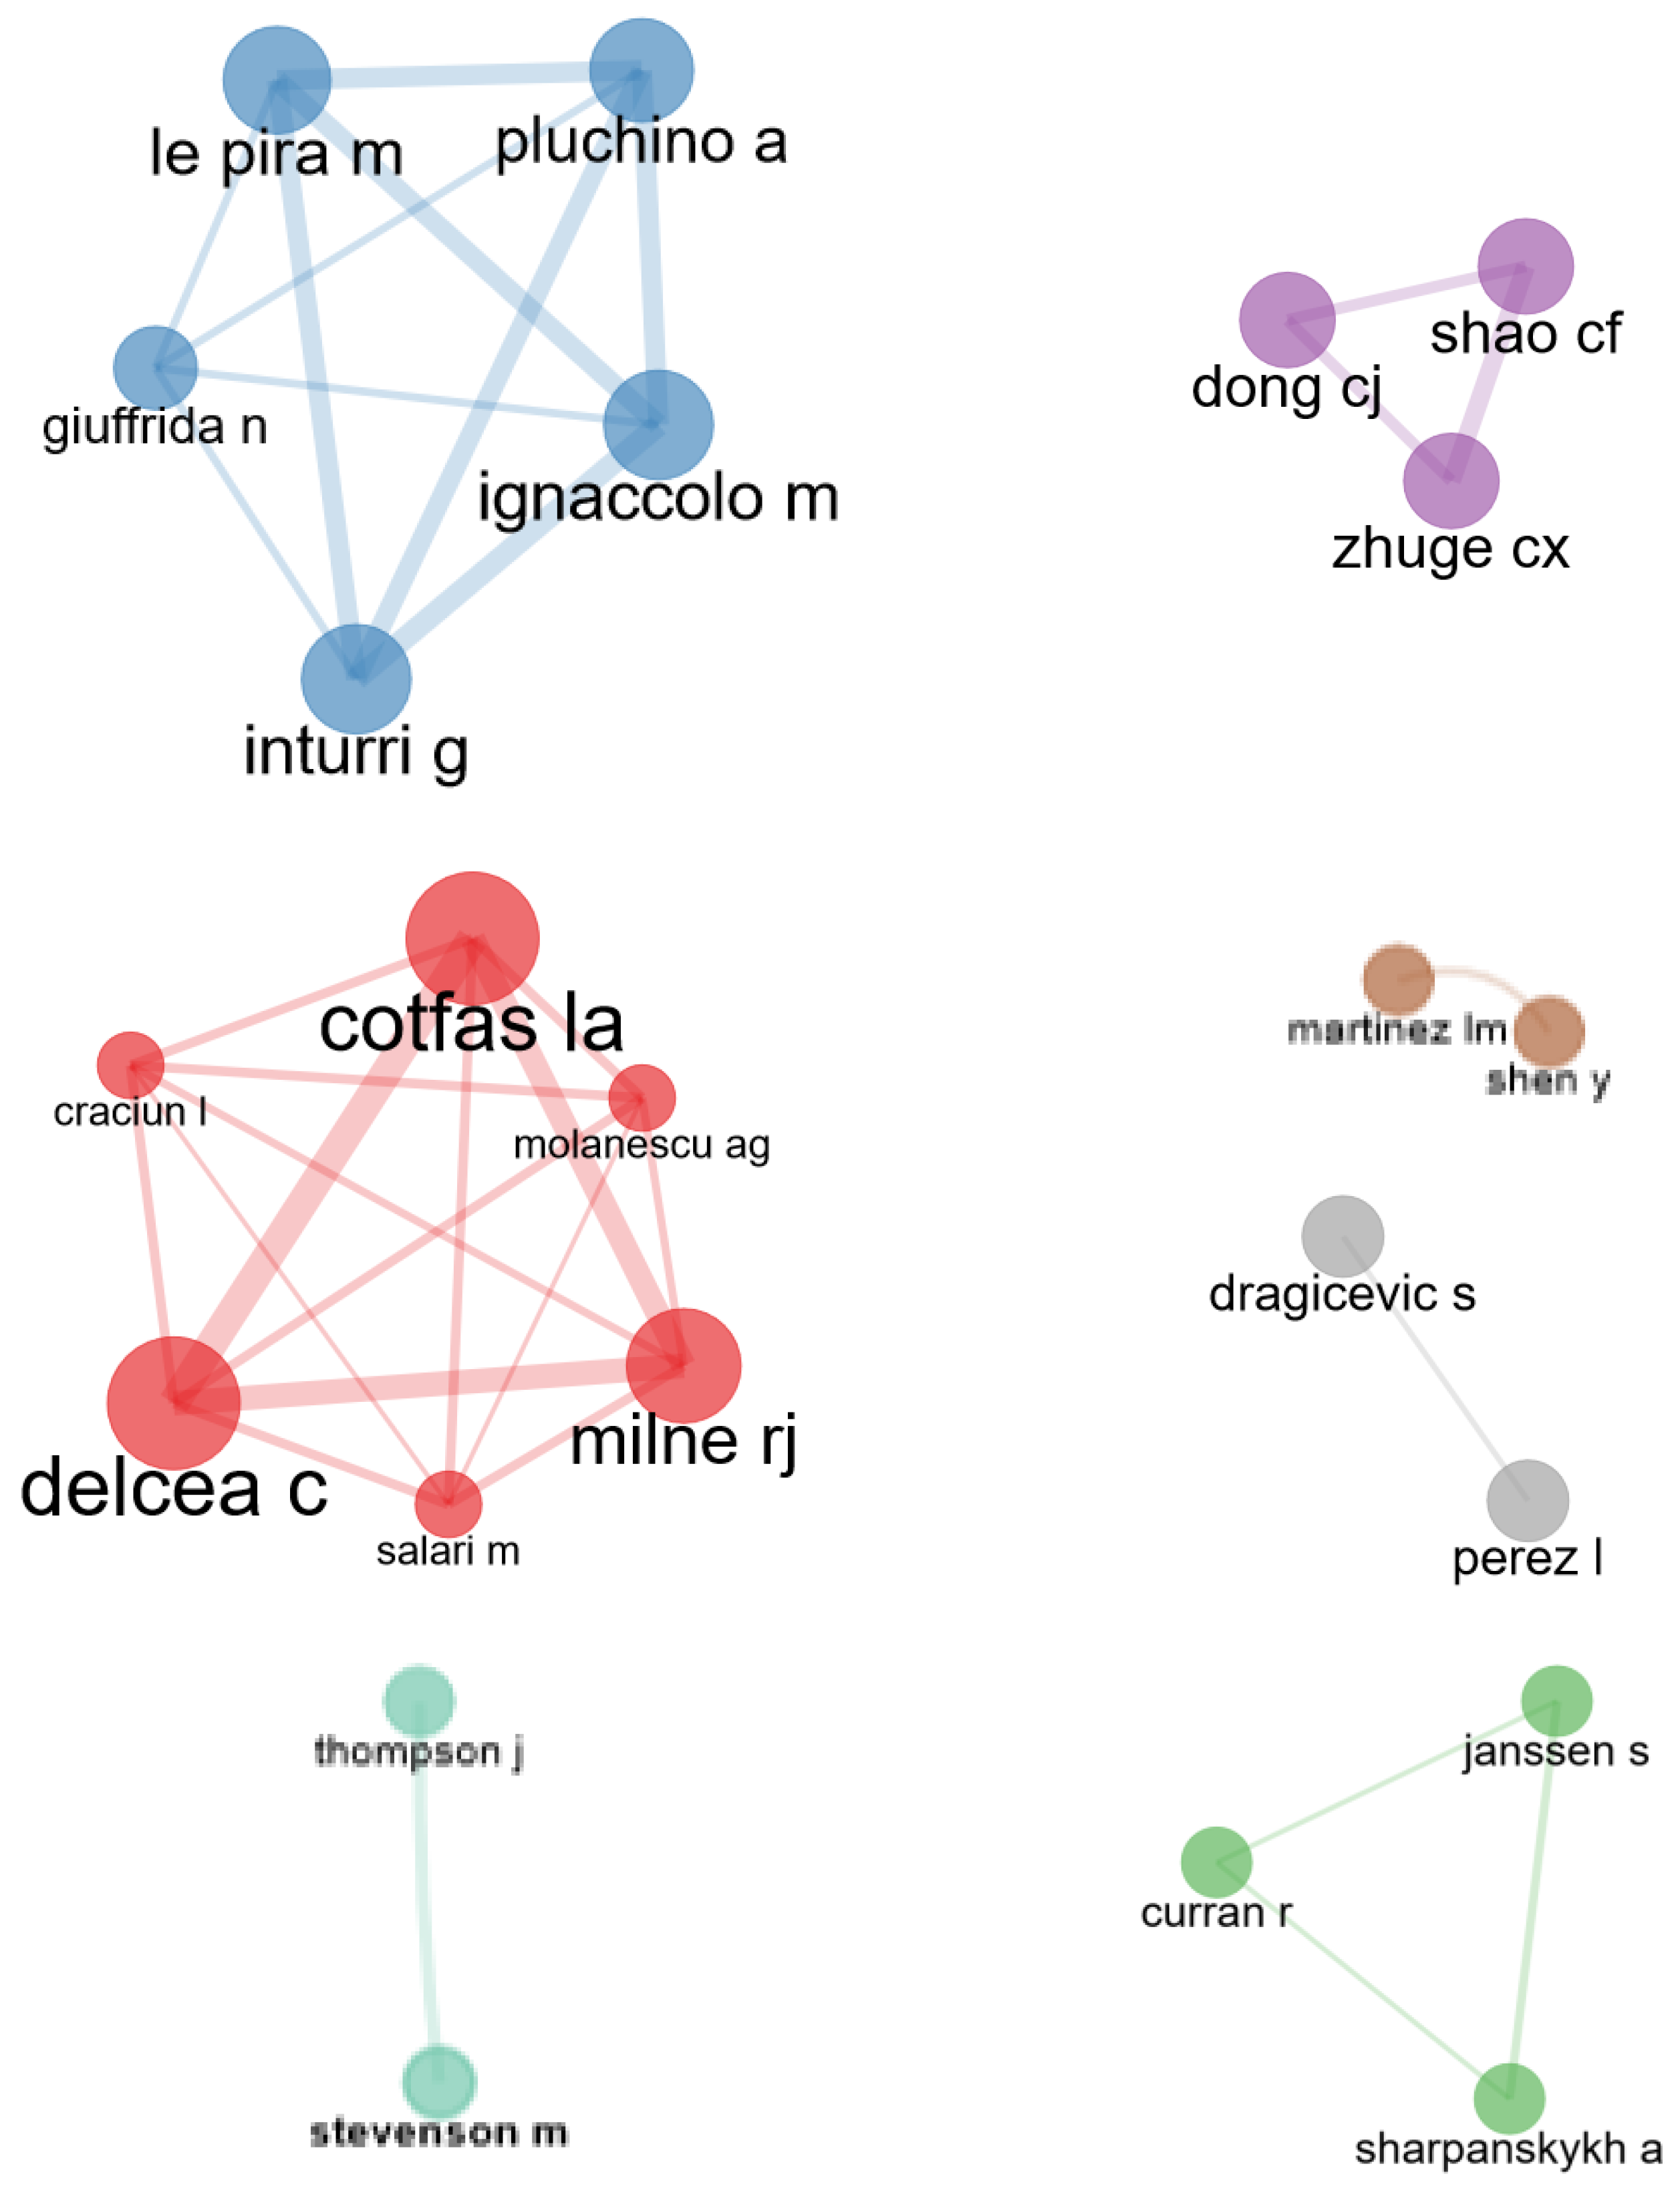
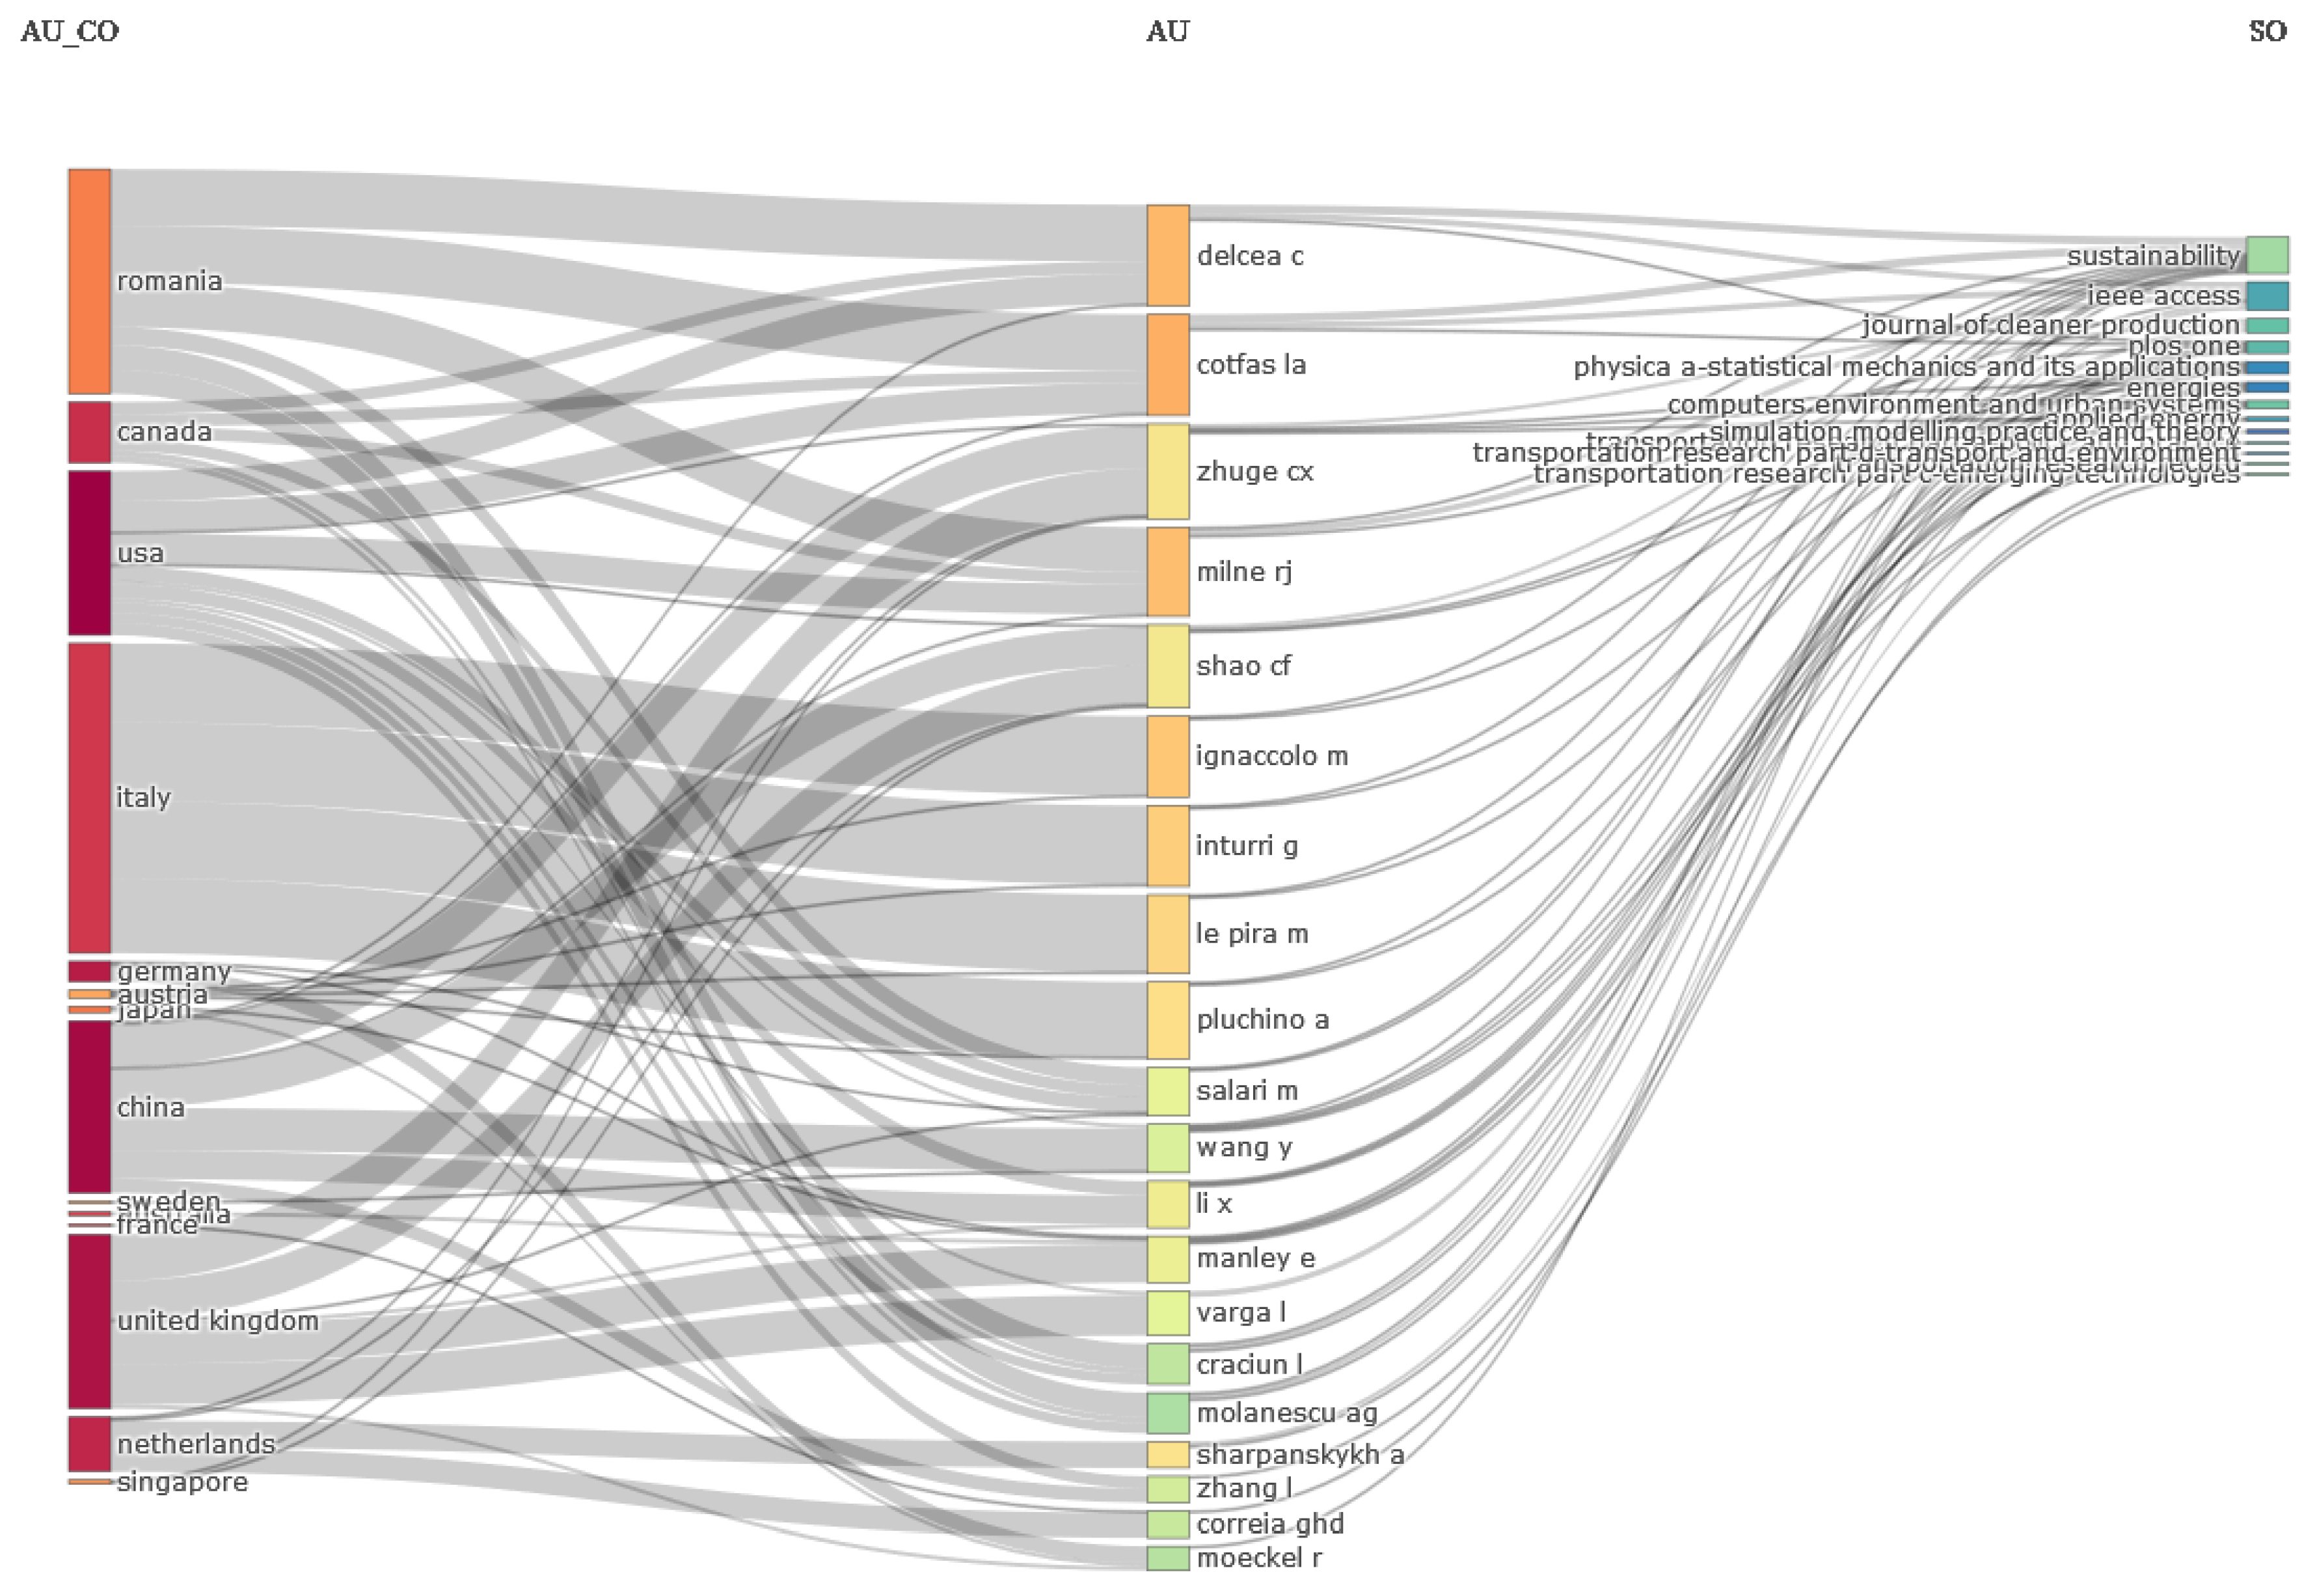
In this section, we have selected the top three most cited papers and we have analyzed them both from the point of view of the information accompanying the papers and from the point of view of their content.
3.4.2. Top Three Most Cited Papers—Review
Below, a concise overview of the papers featured in the top three most cited papers is presented, accompanied by summaries of their respective contributions.
Gonzalez et al. [
61] conducted an analysis of human mobility patterns using a dataset comprising 100,000 individuals’ tracked mobile phones over a 6-month period. The primary objective of the study was to gain a comprehensive understanding of human mobility patterns, irrespective of the modes of transportation employed by the studied population. Drawing from the analyzed data, the authors noted that, despite the diverse travel histories of the individuals in the study, discernible yet replicable travel patterns emerged. The authors elucidated the significance of diffusion models, which estimate human trajectories based on specified constraints and priorities, yielding robust insights into mobility patterns. Unexpectedly, employing Levi flights and random walk models resulted in human trajectories appearing to be random and challenging to predict. However, the analysis using diffusion models revealed spatial and temporal regularities. Various simulations were conducted across diverse locations and timelines. The investigation incorporated the analysis of mobile phone towers, recorded tracks, and service area limitations, providing insights into human trajectories primarily characterized by short distances, with infrequent occurrences of longer distances (exceeding hundreds of kilometers). The frequency of returning to a location was found to be contingent on travel distances and the temporal availability of each individual. In conclusion, the study highlights the consistent and reproducible nature of human behavior, even under the impact of epidemics or emergencies. These findings bear significant relevance in the domains of traffic forecasting, the determination of variables for agent-based models, emergency response planning, a human mobility analysis, and urban planning considerations [
61]. Further considering the citations for the paper authored by Gonzalez et al. [
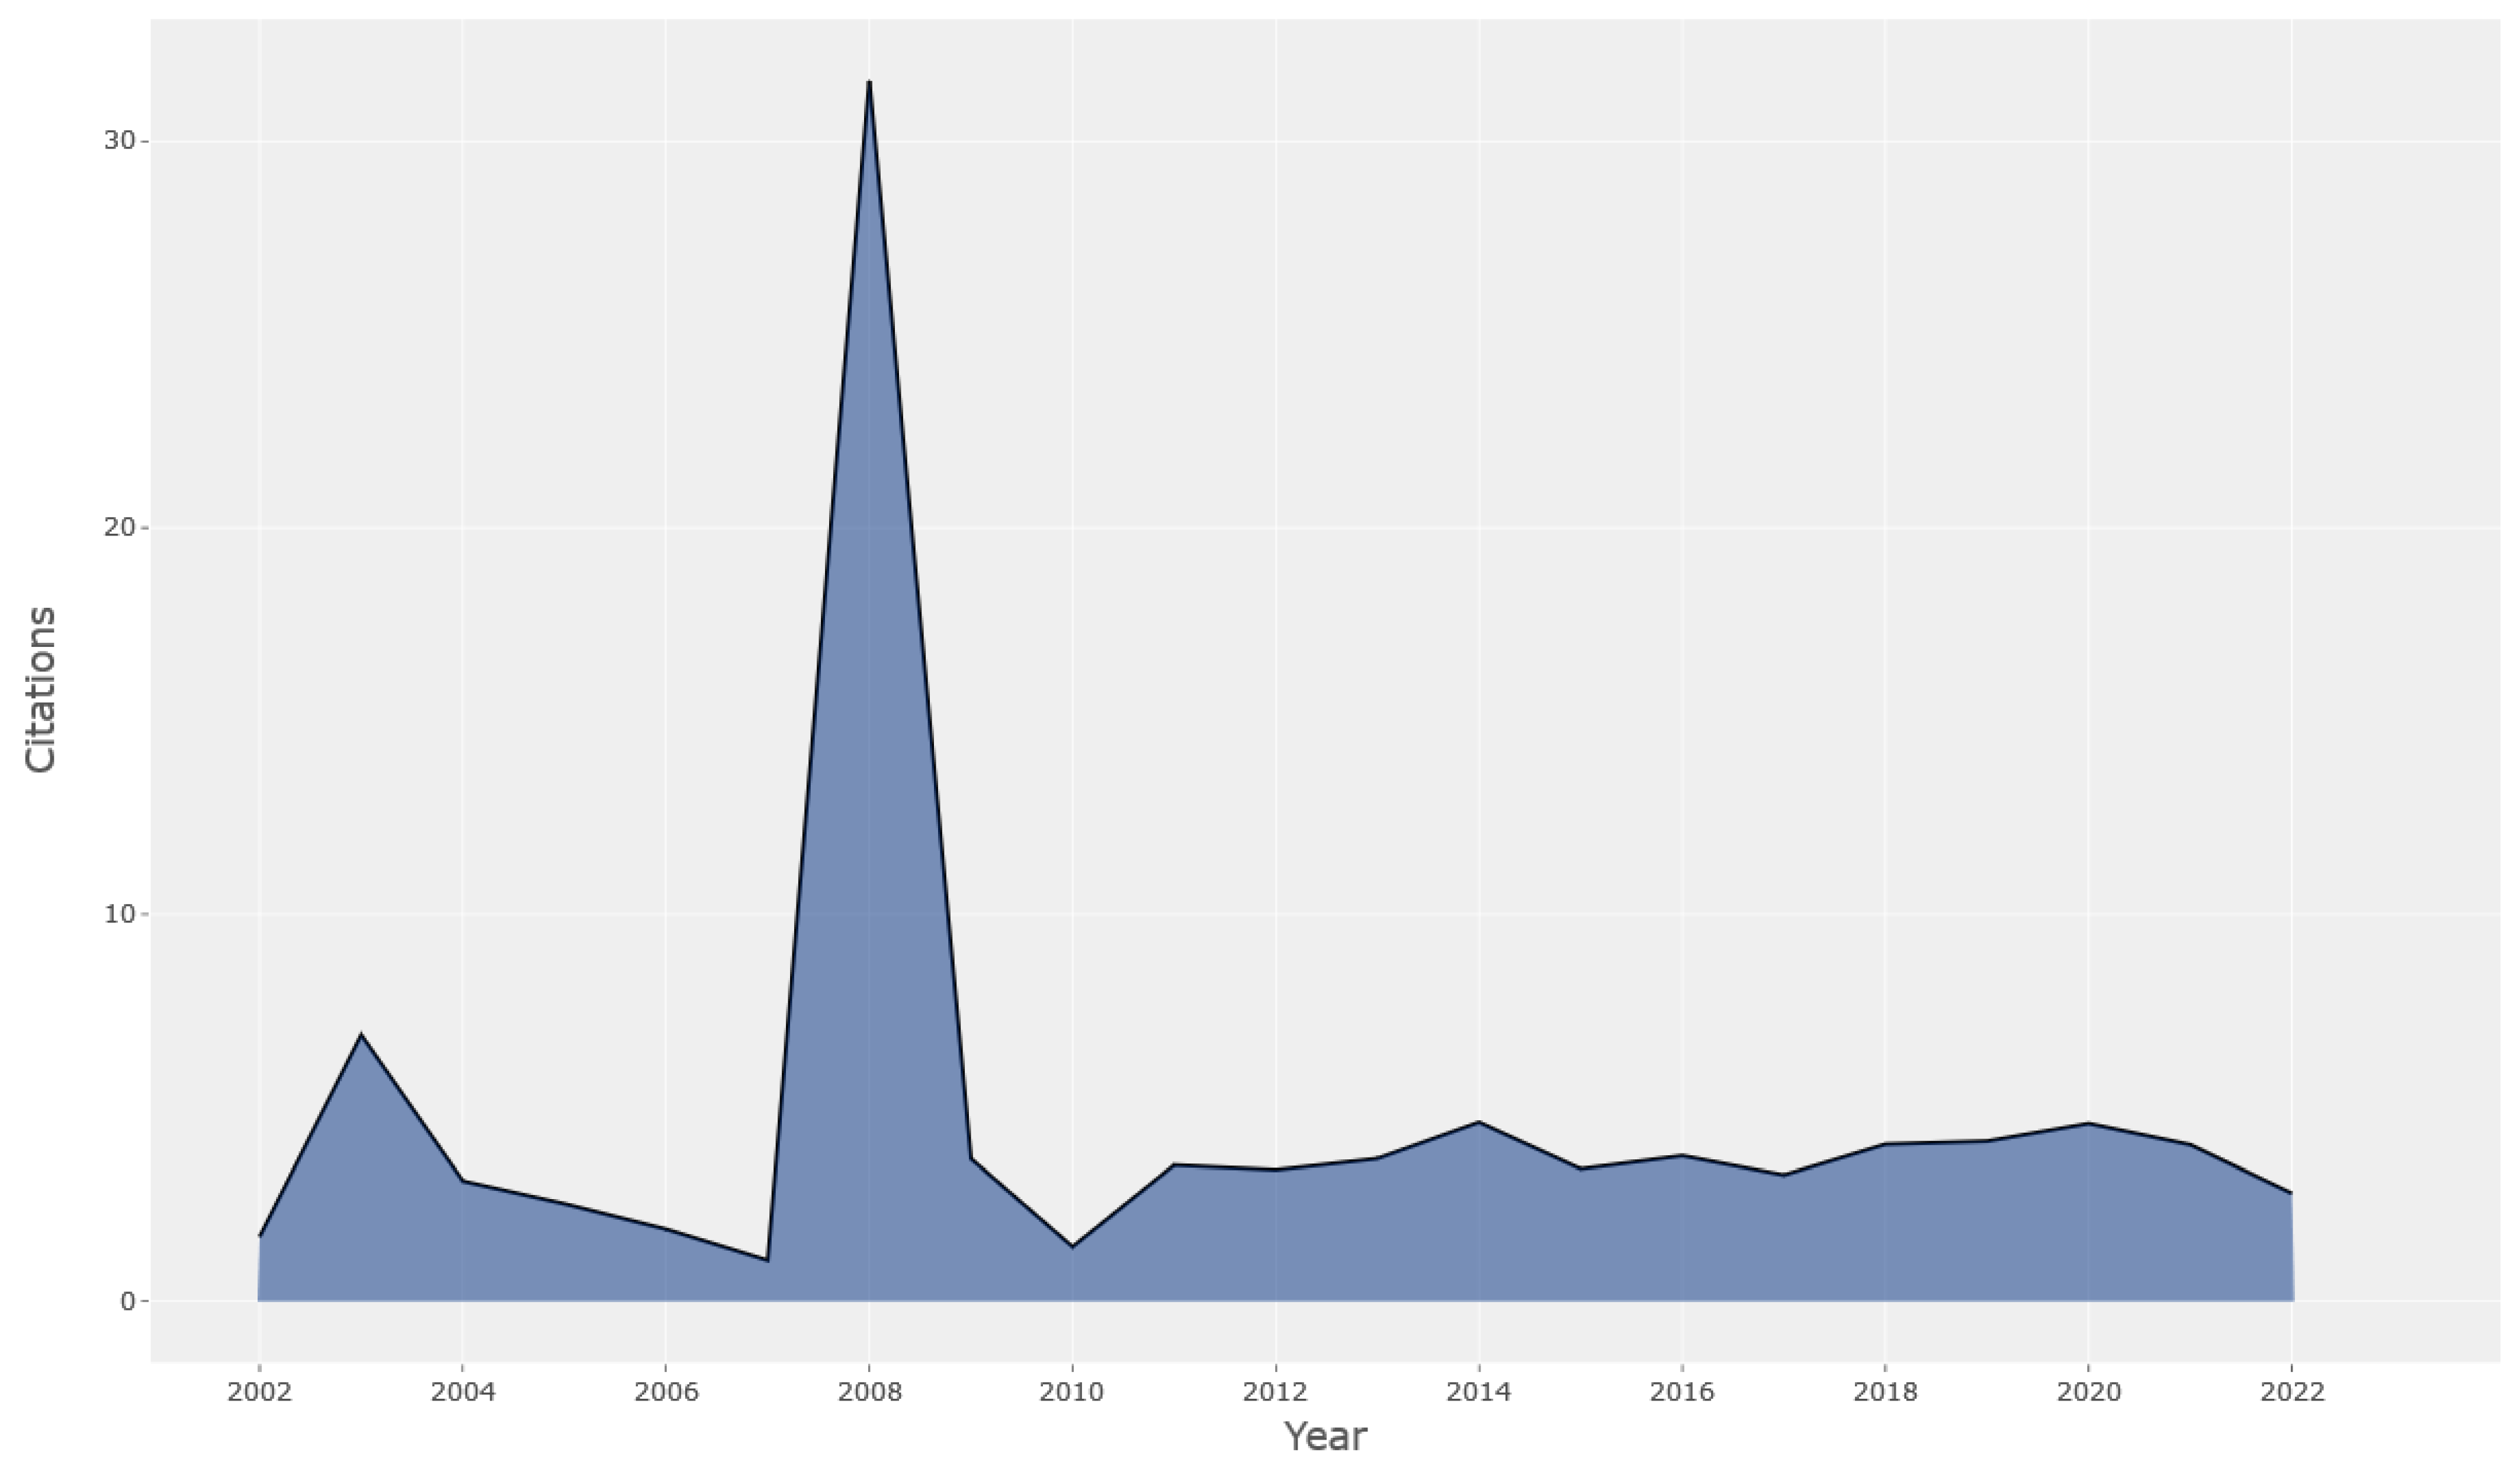
61], it can be observed that 23.79% of the citing papers have been published in journals indexed in the computers science information systems category of WoS (counting for 900 papers). The remainder of the citing references have been indexed in either computer science (computer science theory methods, computer science artificial intelligence, computer science interdisciplinary applications, computer science hardware architecture, computer science software engineering) or transportation-specific categories (transportation science technology, transportation, or urban and environmental sciences), counting for 53.89% of the citing papers. As for the evolution of the citations, it has been observed that the trend has been ascending in the 2008–2015 period. Between 2015 and 2021, the trend has been constant, a number of citations per year between 327 and 351 being recorded. In 2022, the number of citations was slightly smaller, reaching 275 citations.
Fagnant and Kockelman [
85] introduced an agent-based model designed for the optimization of shared autonomous vehicle (SAV) operations. The central concept underlying this model involves the generation of trips within a grid-based urban environment, accounting for predefined origins, destinations, and departure times. Additionally, the model incorporates elements to replicate realistic travel patterns. To validate the effectiveness of the model, a case study is presented, focusing on a mid-sized city. According to the authors, preliminary findings suggest that each SAV has the potential to replace approximately eleven conventional vehicles while introducing a modest increase of approximately 10% in travel distance compared to non-shared autonomous vehicle journeys of a similar nature [
85]. This, in turn, results in overall positive emission impacts when accounting for fleet-efficiency improvements and emission profiles both during production and in-use phases [
85]. Furthermore, one of the authors of the study (Kockelman K.M.) has collaborated with two other researchers (Chen D.T. and Hanna J.P.) on another work regarding the implications of vehicle and charging infrastructure, which holds fourth place based on the number of citations, gathering 220 citations, with a TCY of 22.00 and an NTC of 5.13. In this paper, Chen et al. [
1] commence their study by building upon a finding that underscores the sensitivity of fleet size to factors such as battery recharge time and vehicle range. The authors proceed to explore the implications of decisions related to both vehicles and charging infrastructure. The researchers specifically analyze travel patterns within the context of Austin, Texas, and employ an agent-based modeling approach to simulate the operations of a shared autonomous vehicle fleet. The results of their investigation reveal a significant dependence of fleet size on the adequacy of charging infrastructure and vehicle range [
1]. Notably, from a financial perspective, the analysis suggests that despite necessitating the largest fleet and the most charging stations, the base 80-mile-range shared autonomous electric vehicle (SAEV) fleet equipped with Level II charging stations emerges as the most cost-effective option on a per-mile basis among all the electric vehicle (EV) scenarios considered [
1]. In terms of citations, it has been observed that 582 of the 683 citing papers (representing 85.21%) have been published in areas related to transportation science technology and transportation in the WoS platform, highlighting once more the contribution of the paper authored by Fagnant and Kockelman [
85] to the transportation field.
Bagstad et al. [
86] place particular emphasis on the significance of spatial connectivity between ecosystems and their beneficiaries within their research. In light of this focus, the authors introduced a class of agent-based models called Service Path Attribution Networks (SPANs) tailored to address a spectrum of ecosystem services, which correlates the source, sink, and locations. SPANs use different classes of agents: sink agents, who reduce the available quantity by carrier agents; carrier agents, which move between locations following specific routes; and user agents, which use the products from carrier agents, and if they are satisfied, can access more products from the carrier, or it has the possibility to buy from competitors. Furthermore, the SPAN Algorithm takes into account the individual traveler’s historical experiences and preferences, alongside considerations of distance, travel infrastructure, and available transportation modes [
86]. The iterative process is repeated multiple times until the optimum is determined through simulations, utilizing various ecosystem services and activities such as carbon storage, subsistence fisheries, riverine food regulation, and recreation. Once the optimum is identified, the SPAN model aspires to integrate into the Artificial Intelligence for Ecosystem Service (ARIES) modeling platform. ARIES supports diverse ecosystems across different regions, each characterized by unique particularities. Several approaches can be employed to identify the best model: modifying the existing SPAN model and ARIES to suit the problem, utilizing an already established SPAN model and adapting its code, or employing a system capable of calculating ecosystem system flows, such as InVEST Hydrology, even though it lacks a comprehensive overview of flow results. The authors intend to enhance these proposed models by exploring the integration of choice models and transportation network models into their analytical framework [
86]. Considering the papers citing the work of Bagstad et al. [
86], a steady interest for the work in the 2014–2021 period has been observed, in which the paper has received between 24 and 48 citations per year, with a visible increased interest in 2022, when the paper received a higher number of citations (58 citations).
Table 7 summarizes the main information related to the top three globally most cited papers.
3.4.3. Words Analysis
Words hold significant importance in a bibliometric analysis, as they provide insights into the practical applications of papers and the focal points of research. Within our dataset represented by keywords plus, the term ‘simulation’ emerged as the most frequently occurring word, with 148 instances. It was closely followed by “model” with 129 occurrences, “behavior” with 94 occurrences, “systems” with 61 appearances, “dynamics” with 60 occurrences, “impact” with 59 appearances, “optimization” with 55 occurrences, “framework” with 45 occurrences, “management” with 43 appearances, and “time” with 43 appearances.
Notably, the top 10 most frequent words identified in
Table 8 are indicative of their integral role within the transportation and ABM domains, underscoring their prevalence and relevance in the field.
Table 9 provides a comprehensive overview of the ten most frequently occurring keywords authored by researchers. These keywords reflect the specific focus of their studies within the transportation domain and ABM.
Notably, the top three keywords—“agent-based model” (214 occurrences), “agent-based modeling” (208 occurrences), and “agent-based modelling” (119 occurrences)—underscore the prominence of ABMs in the research. Additionally, the term “simulation” (59 occurrences) plays a significant role in these studies.
Furthermore, “electric vehicles” (46 occurrences), “agent-based simulation” (41 occurrences), “agent-based models” (28 occurrences), “multi-agent systems” (18 occurrences), “COVID-19” (17 occurrences), and “airplane boarding” (15 occurrences) round out the list, each indicative of their relevance and alignment with the transportation domain and ABM. These keywords offer valuable insights into the key areas of interest and expertise within scholarly discourse.
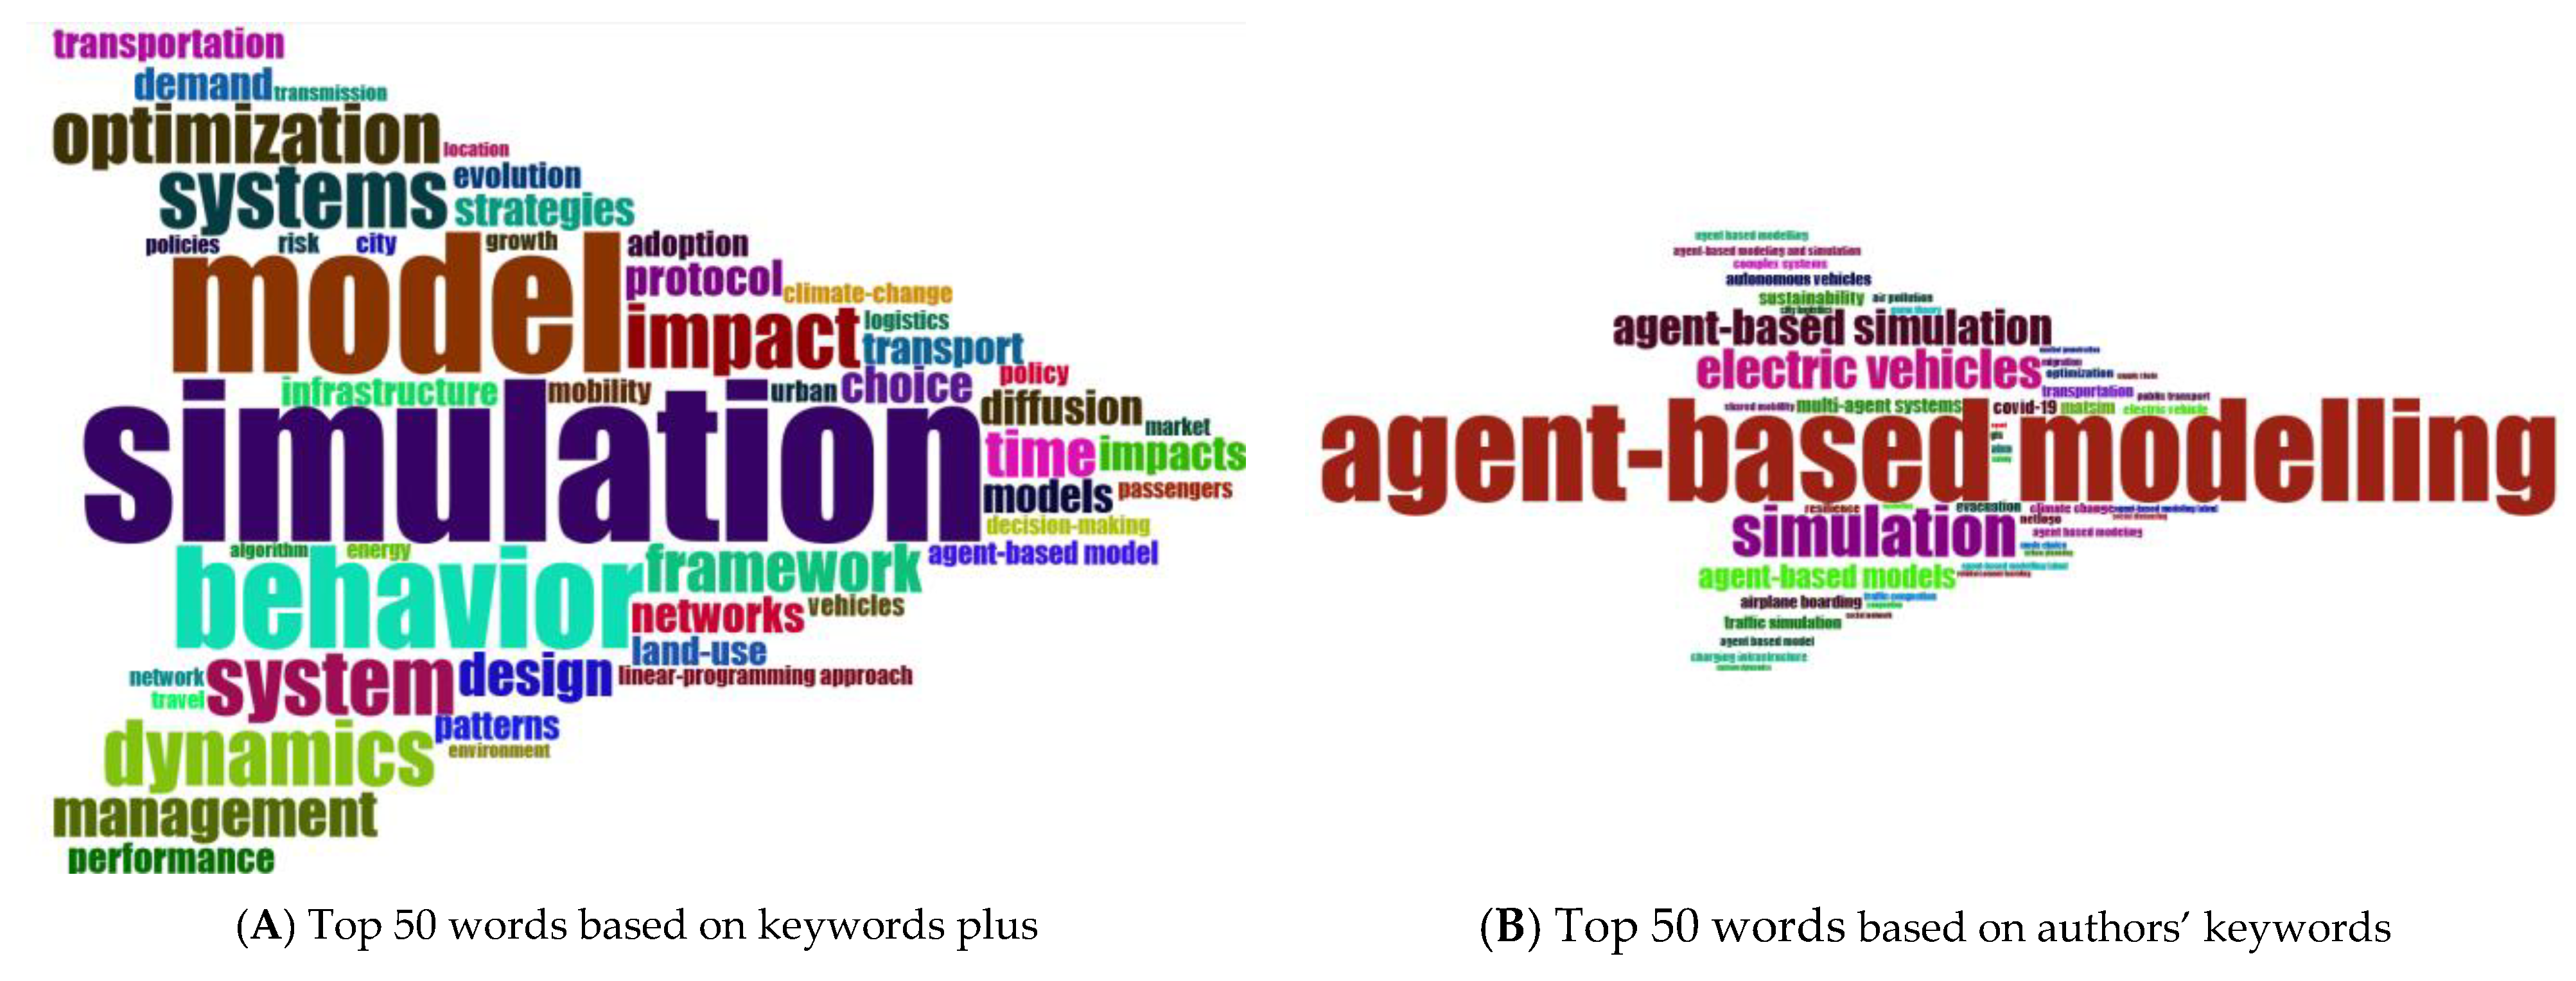
Figure 16 provides a comprehensive visualization of the top 50 most frequently used words derived from both keywords plus and authors’ keywords. The visualization is segmented into two clusters: Cluster A, which emphasizes keywords plus, and Cluster B, which centers on authors’ keywords.
In Cluster A, focusing on keywords plus, we observe a Word Cloud wherein the most representative words include “simulation”, “model”, “behavior”, “system”, “dynamics”, “impact”, “optimization”, “framework”, and “management”. These terms encapsulate the predominant themes and concepts associated with the research in this domain.
Cluster B, on the other hand, concentrates on authors’ keywords. This Word Cloud features the most frequently occurring terms within this category, such as “agent-based modelling”, “simulation”, “electric vehicles”, “COVID-19”, “agent-based models”, “airplane boarding”, “optimization”, “traffic simulation”, “agent-based simulation”, “climate change”, and “agent-based modeling”.
Considering the two Word Clouds presented in
Figure 16, it can be observed that the authors’ keywords are focusing more on the modeling and analysis techniques used in their papers (e.g., “agent-based modelling”, “agent-based models”, “agent-based modeling”, “agent-based simulation”) and the field of the transportation area in which they have been used (e.g., “electric vehicles”, “airplane boarding”, “traffic simulation”), while with the keywords plus, which are automatically generated by the WoS platform, the focus is more on generic words related to the analysis conducted in the paper, rather than on the various fields in the transportation field. Regarding the length of the keywords, it can be observed that the authors’ keywords are composed from several words (in general bigrams), while the keywords plus are composed of a single word (unigrams).
Table 10 presents a valuable analysis of the ten most frequently occurring word pairs, or bigrams, within the abstracts and titles of the analyzed papers. This analysis sheds light on the predominant word combinations that are commonly used in the corpus of research.
In the abstracts, the most prevalent bigram is “agent-based model” with a substantial 565 occurrences. It is followed by “agent-based modeling” with 224 appearances, “electric vehicles” with 137 instances, “agent-based models” with 136 mentions, “agent based modeling” with 121 instances, “simulation results” with 90 occurrences, “agent based” with 87 appearances, and “simulation model” with 79 mentions, while “model abm” and “agent_based simulation” complete the list with 78 and 74 occurrences, respectively.
Similarly, in the titles of the papers, notable bigrams include “agent-based model” with 153 occurrences, “agent based modeling” with 105 mentions, “agent-based modelling” with 67 appearances, and “agent-based simulation” with 30 occurrences. Other significant bigrams include “electric vehicle” and “electric vehicles” (43 and 31 occurrences each, respectively), “agent based” (28 occurrences), “agent-based approach” (24 occurrences), and “modeling approach” and “agent-based models” (23 and 22 occurrences each, respectively).
Table 11 presents top 10 most frequent trigrams found in abstracts and titles. Similar with bigrams, most of the trigrams are related to the agent-based modelling domain or transportation domain. In abstracts, the top 10 trigrams are “agentbased model abm”, which has 65 occurrences, “agent based model” with 39 appearances, “agent_based modelling abm” with 32 appearances, “agent_based modeling abm”, which has 31 occurrences, “agent_based simulation model” with 31 occurrences, “electric vehicles evs”, which has 24 occurrences, “agent_based models abms” with 21 appearances, “agent based modeling” with 18 occurrences, and “agent_based modeling approach” and “agent_based modeling framework” with 16 appearances for each one.
In titles, the top 10 most popular trigrams are “agent_based modeling approach”, which has 19 appearances, “electric vehicle charging” with 15 occurrences, “agent_based modelling approach”, which has 11 occurrences, “agent based model” and “agent_based modelling framework” with 8 occurrences for each one, “agent_based simulation approach” with 7 appearances, and “agent based modelling”, “agent_based simulation model”, “electric vehicle adoption”, and “vehicle charging infrastructure” with 6 appearances for each one.
Furthermore, as most of the identified n-grams are related to the ABM field, we have further proceeded to eliminating some of the ABM-specific bigrams from abstracts, as well as eliminating bigrams related to the model or some other methods used in the paper. Some examples of the removed bigrams are “agent_based model”, “agent_based modelling”, “agent_based models”, “agent_based modelling”, “simulation results”, “model abm”, “agent based”, “simulation model”, “agent_based simulation”, “proposed model”, “based model”, “modeling framework”, “mode choice”, “modeling abm”, “modelling abm”, “empirical data”, “simulation models”, “modeling approach”, “system dynamics”, “experimental results”, “model results”, “modelling approach”, and “models abms”. As a consequence of this curation, the bigrams related to the transportation field have been identified as presented in
Table 12.
From
Table 12, it can be observed that a series of bigrams are related to road transport (e.g., “electric vehicles”, “road network”, “traffic congestion”, “traffic flow”, “electric vehicle”, “charging stations”), while others refer to air transport (e.g., “boarding methods”). Nevertheless, a series of bigrams are related to public transport in general, such as “public transport”, “travel demand”, “transportation system”, “travel time”, and “transportation systems”. Few bigrams discuss the effects of transportation over climate (e.g., “climate change”, “air pollution”) or on public health (e.g., “social distancing”).
Given the evolution of the annual scientific production provided in
Figure 2, three distinct temporal periods emerge: 2002–2012, 2013–2017, and 2018–2023.
These distinct periods are characterized by significant deviations in annual publication trends. To attain a more comprehensive insight into the longitudinal thematic evolution within the domains of economics and education, a rigorous analysis was undertaken spanning these delineated time frames. The distribution of the themes has been divided into four main categories: Basic Themes, Motor Themes, Niche Themes, and Emerging or Declining Themes – which will be discussed in the following for each of the three considered situations (please consider
Figure 17,
Figure 18 and
Figure 19).
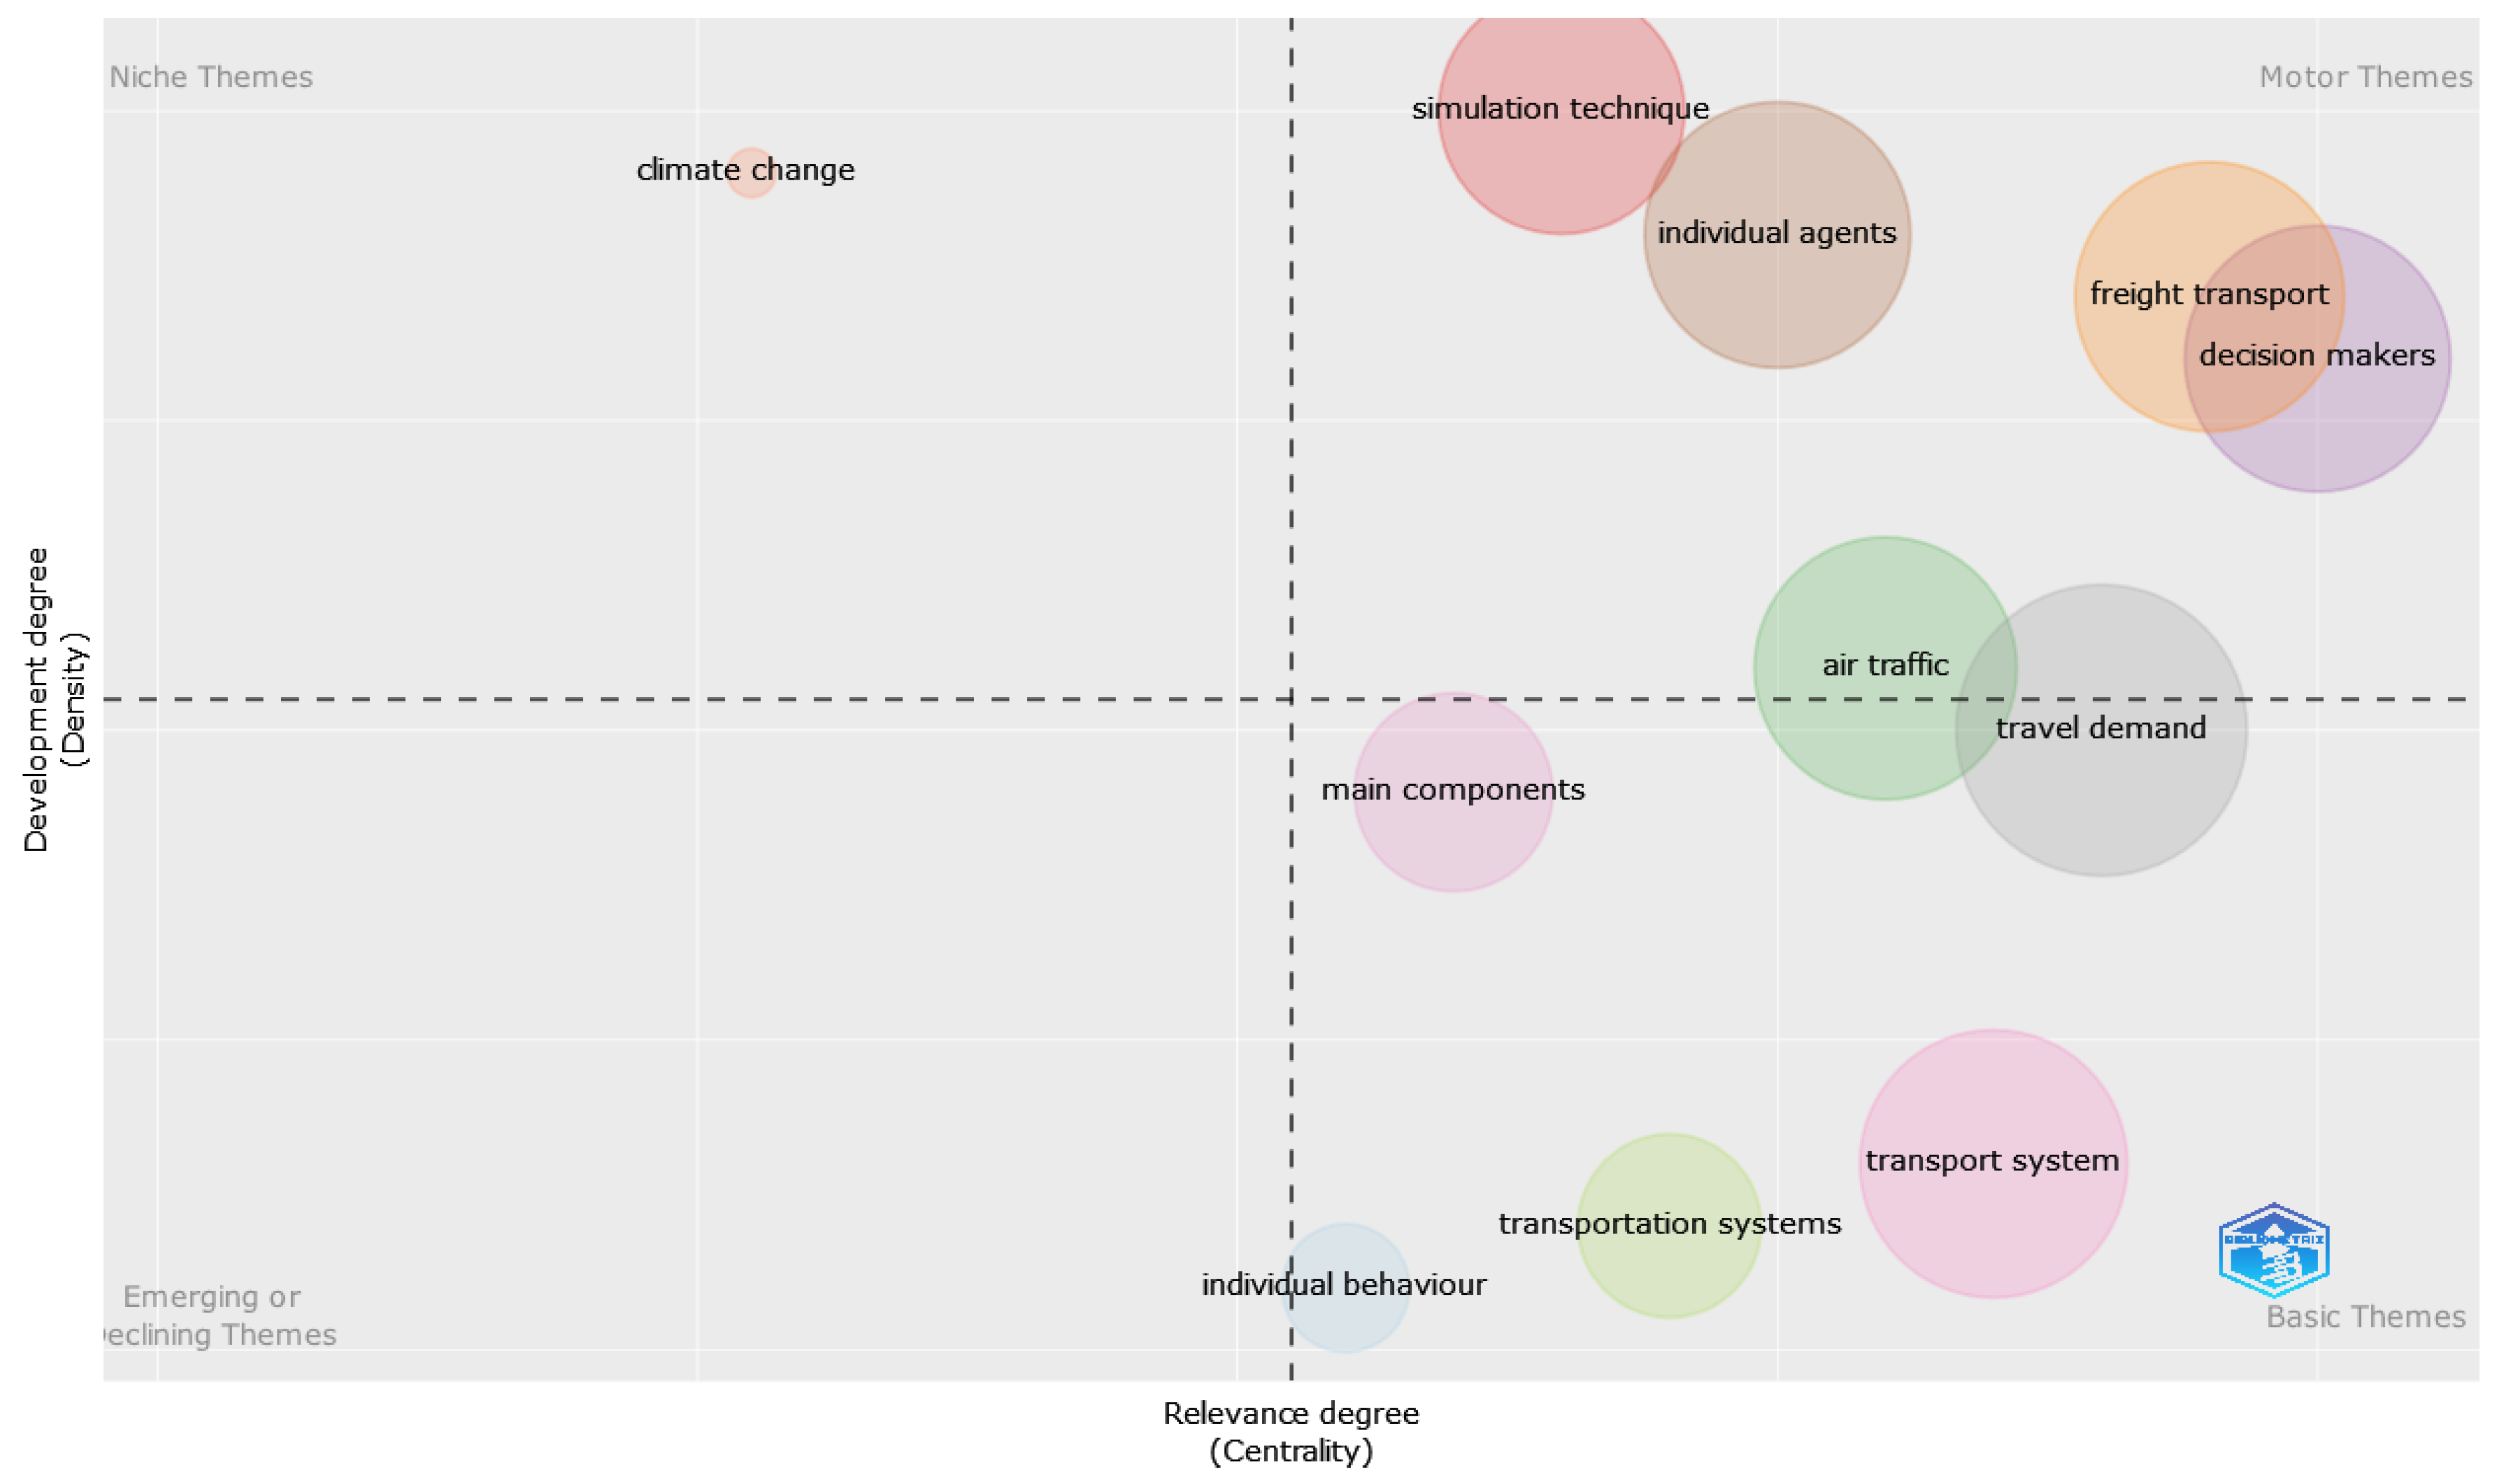
Figure 17 unveils a discernible pattern during the initial period (2002–2012). Within this timeframe, the predominant thematic emphasis in abstract discussions centered on the exploration of ABM as a means to address issues in freight transportation. Additionally, in the realm of themes identified for this period as basic themes, a noteworthy portion of research endeavors were directed toward the fields of “transportation system/systems” and “travel demand” (
Figure 17). As for the motor themes category, one can identify the “freight transportation” theme. Also, as a niche theme, it can be observed that for this period of time, “climate change” emerges, even though the importance given to this aspect seems to be limited as depicted in
Figure 17 where the bubble associated with this item is relatively small, accounting for only two contributions.
As for the pattern observed for the 2013–2017 period, from the bigram analysis in abstracts, it can be observed that the focus shifted to “electric vehicles”, identified as a motor theme (
Figure 18). Also, the shift of the “climate change” theme from the niche themes section to the motor themes section can be observed. Meanwhile, it can be noticed that for the mentioned period, the bigrams related to “road network”, “travel time”, and “transportation system” are listed as basic themes for the ABM in transportation, while “supply chain” gained more and more interest from the research community, accounting this time for 40 elements. In terms of “freight transport”, a decline in this theme can be observed, being placed at the borderline between the nice and emerging/declining themes, suggesting a decline in the interest for this theme in the selected research papers. Also, regarding the issues discussed in the scientific papers in connection with the freight transportation theme, a shift has been observed from the 2002–2012 period, in which the focus was on policy measures, a policy analysis, and a modal shift in freight transportation, to the 2013–2017 period, in which the focus was on urban freight transportation, transport planning, and the potential benefits of using urban freight. Furthermore, in the niche themes, we can observe the bigrams related to “transportation systems” and looking at the included papers, it can be observed that these refer to the air transportation and commercial aviation, so one can highlight the increasement in the interest in the area of air transport.
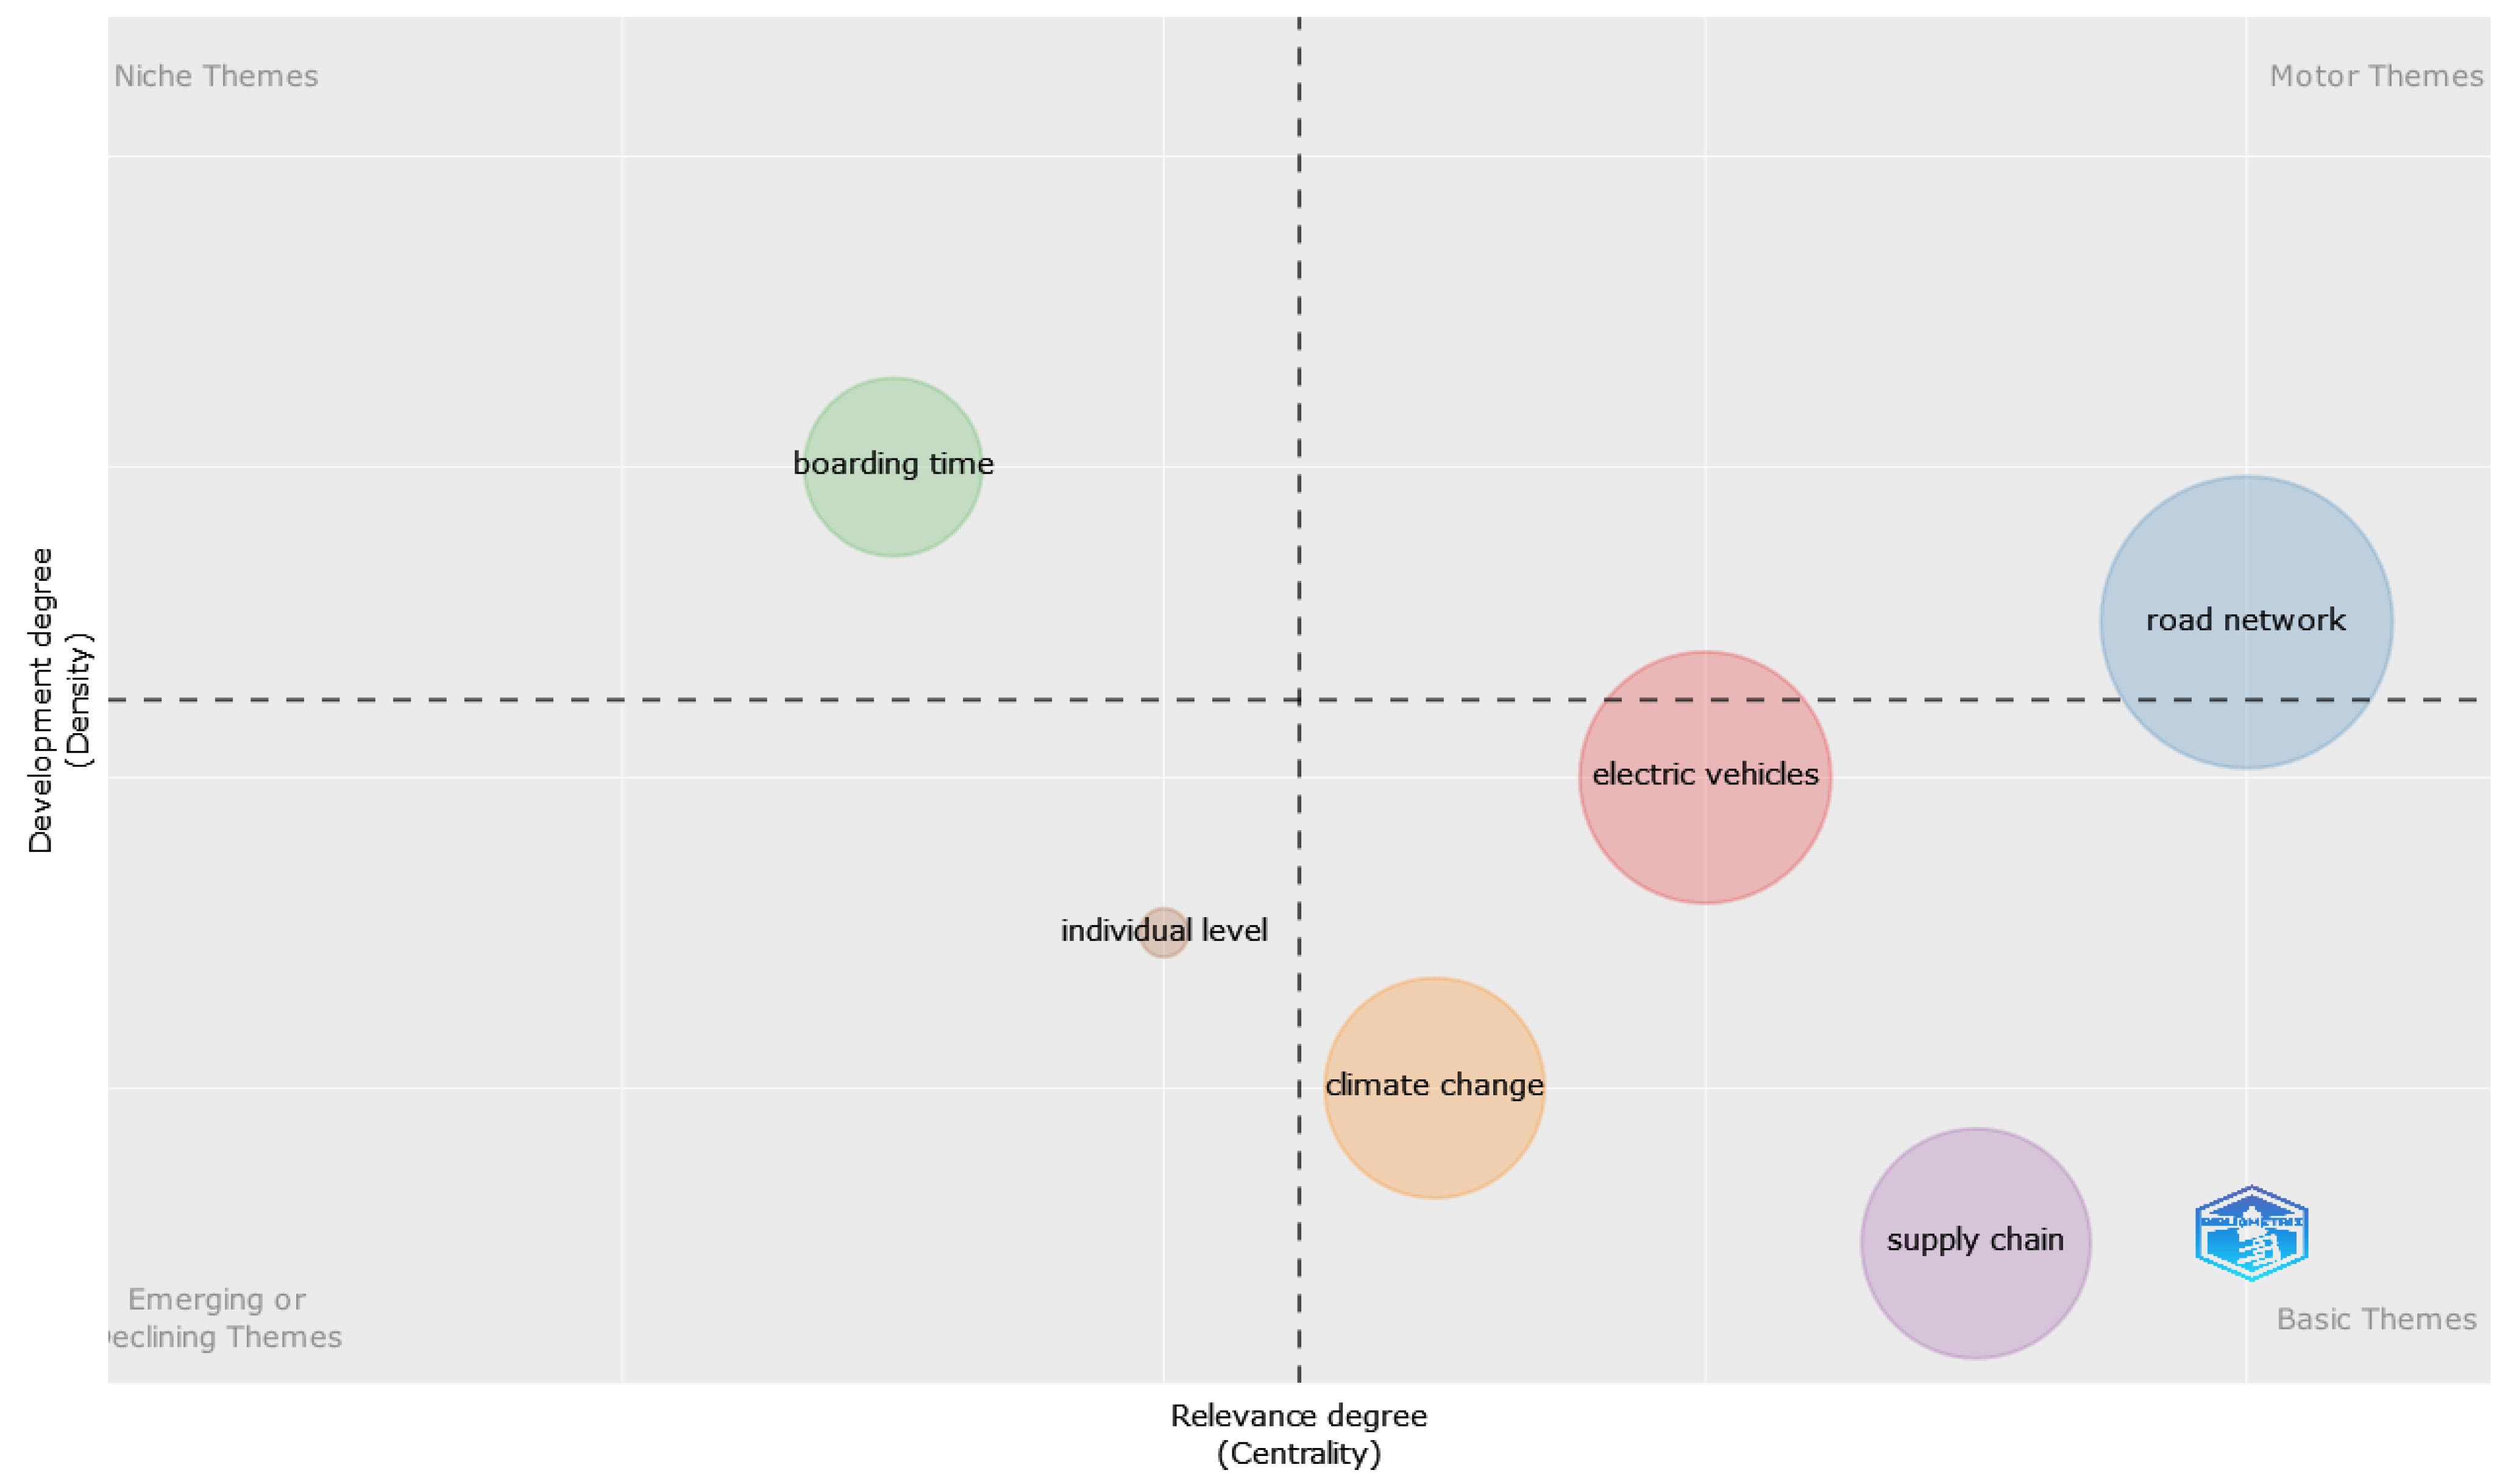
Moreover, during the period spanning 2018–2023, an observable transition is noted in the thematic content of papers associated with the “electric vehicles” bigram. These papers have shifted towards fundamental themes (marked as “basic themes” in
Figure 19), while those linked to the “road network” bigram faced an increase in interest from the research community moving toward the “motor themes” section in the context of ABM in transportation. Moreover, “climate change” has emerged as a “basic theme”. Considering the entire 2002–2023 period, it can be observed how the “climate change” theme has emerged from a niche theme to a motor theme, and later on as a basic theme within the transportation research area when ABM is used. The inclusion of “climate change” as a fundamental theme is not unexpected when considering other scholarly works employing a bibliometric analysis within the transportation domain. For instance, in the examination of equity in transportation by Ruiz-Perez et al. [
42], the theme of “air pollution” (which in our case is included in “climate change”) is notably identified for the period spanning 2014 to 2020. The authors attribute the prevalence of this theme to a heightened concern regarding the environmental and public health impacts of transportation systems [
42]. Notably, papers associated with the “supply chain” bigram are the sole exceptions, as they have continued to be classified among the basic themes for this period. As for the “road network”, an increasement in the interest of the research community in this area can be observed, which made the theme shift from the basic themes in the 2013–2017 period toward the motor themes in the 2018–2023 period. Among the elements studied within the road network papers in the 2018–2023 period, one can identify public transport, autonomous vehicles, traffic congestion, travel demand, and travel time (
Figure 19).
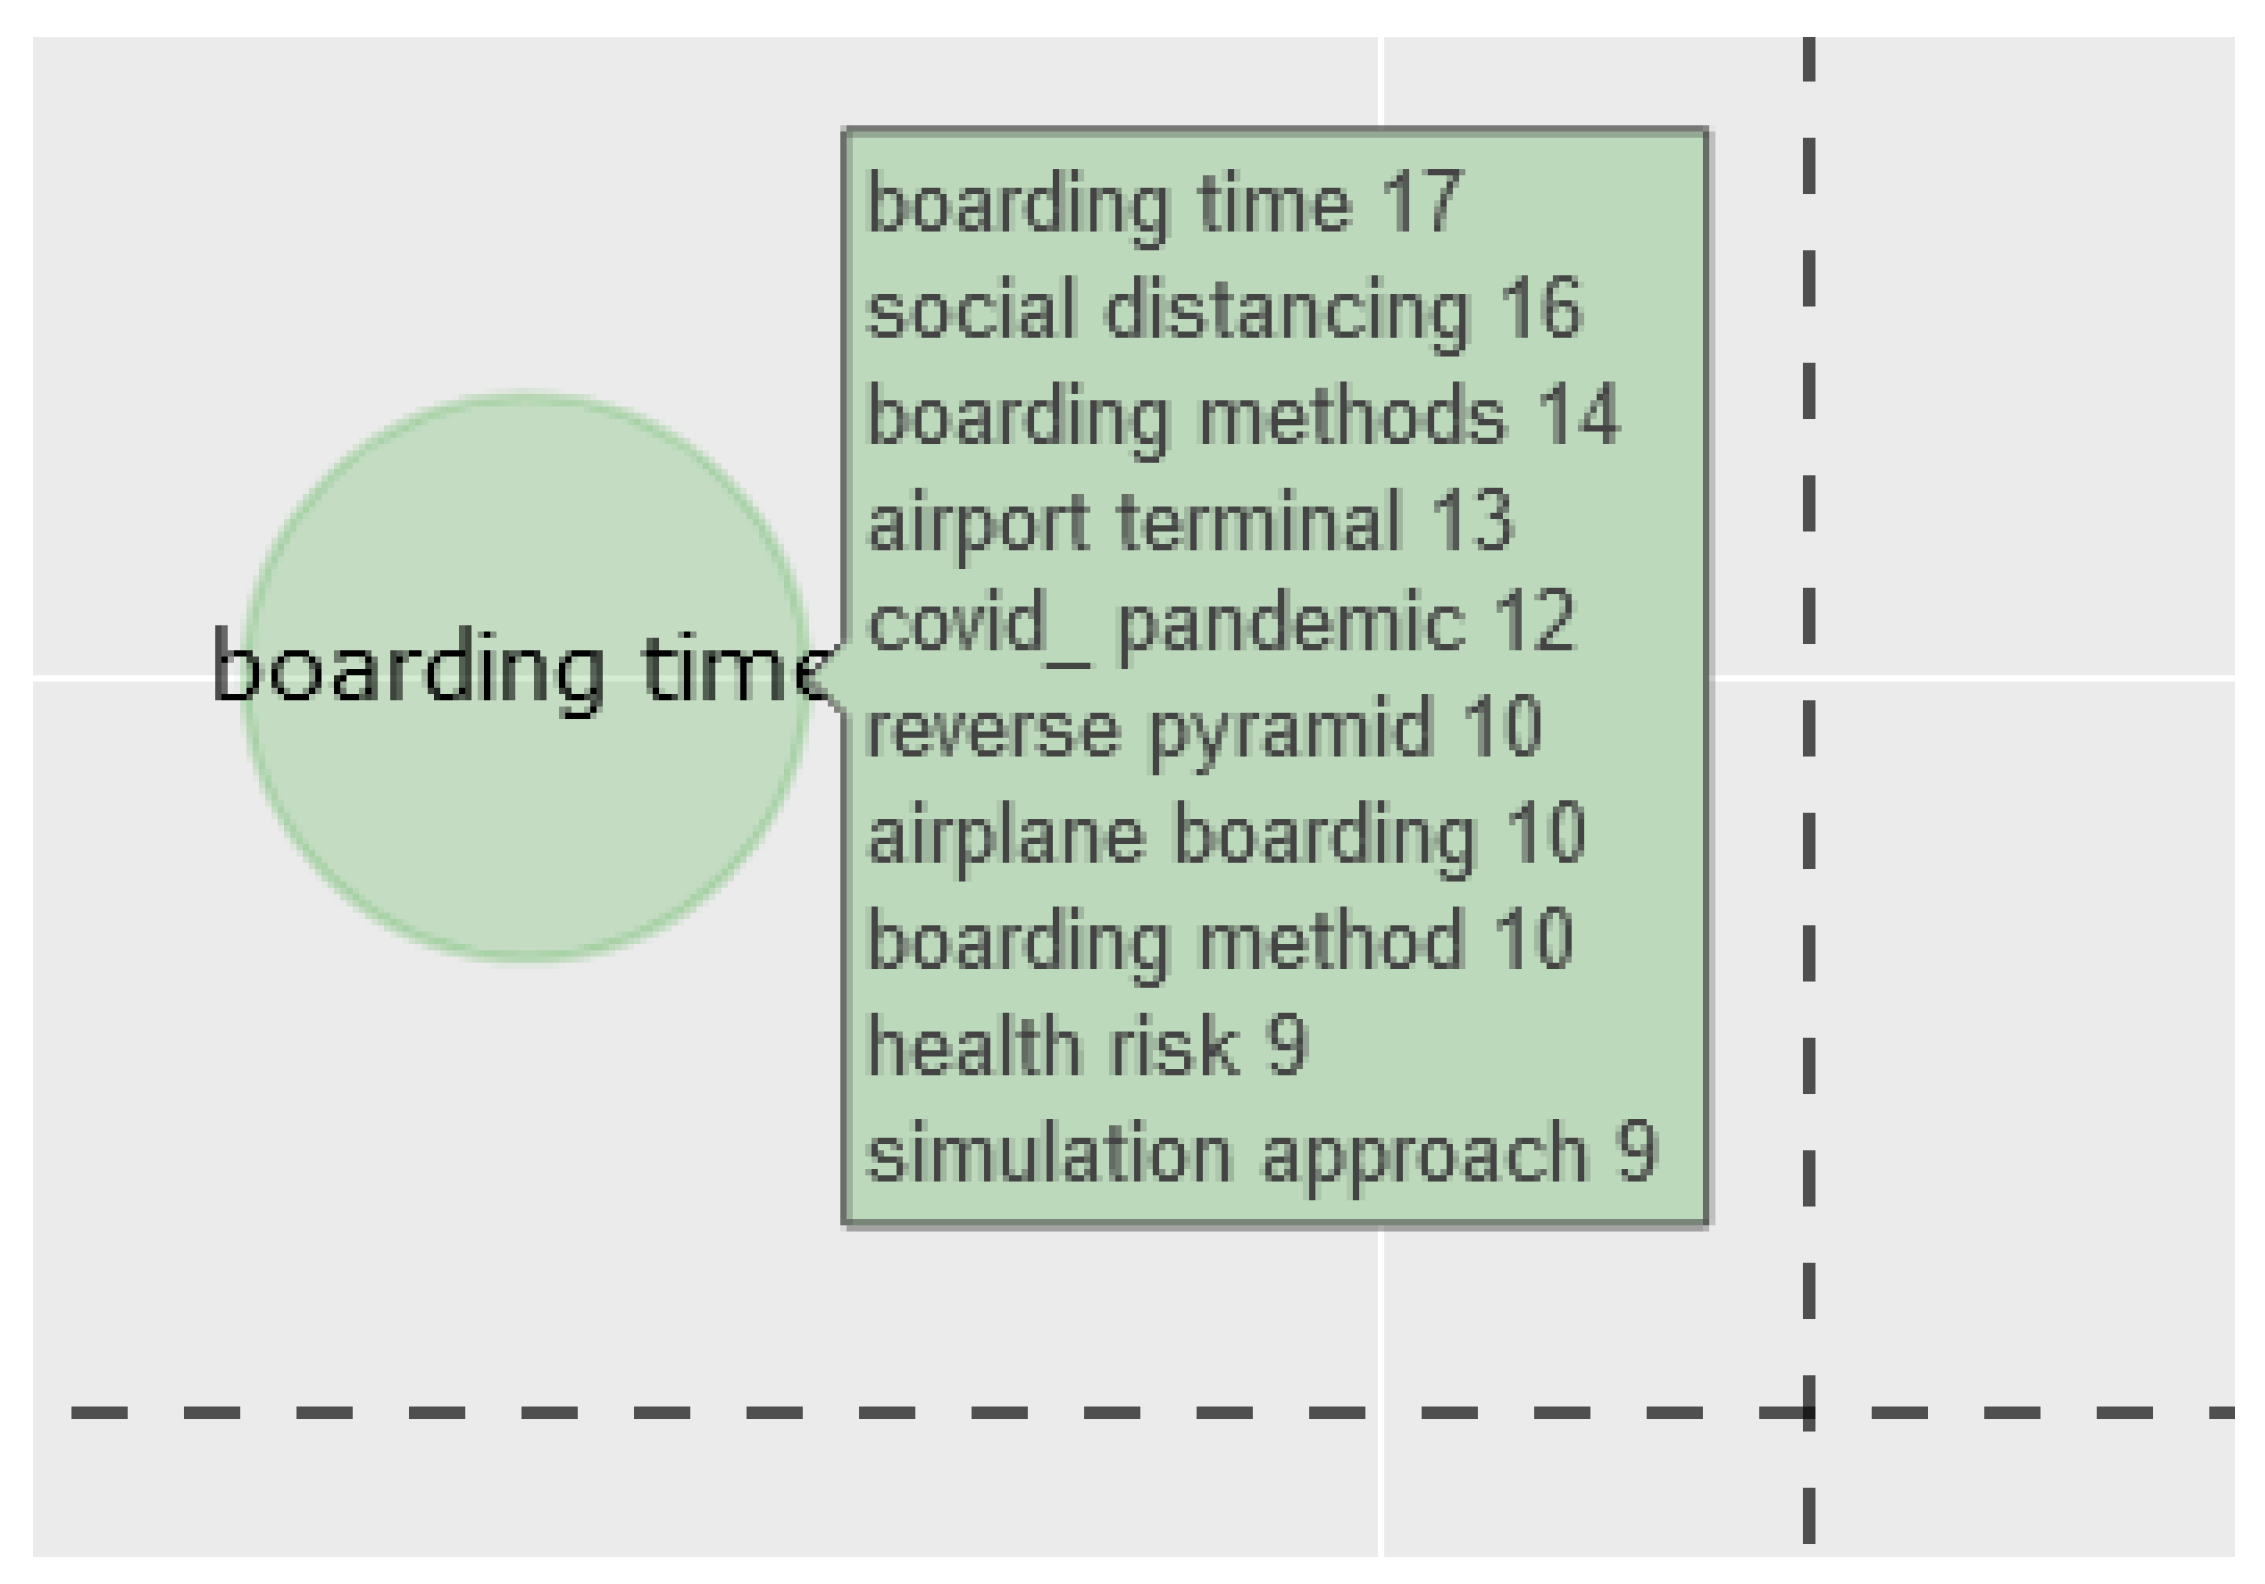
Also, “boarding time” occurs as a niche theme in 2018–2023. By further investigating the issues related to the “boarding time” bubble in
Figure 20, it has been observed that the following bigrams are associated with it: “boarding time”, “social distancing”, “boarding methods”, “airport terminal”, “COVID_ pandemic”, “reverse pyramid”, “airplane boarding”, “health risk”, “boarding method”, “health risks”, and “simulation approach”. Referring to the papers in which these bigrams can be identified, it has been observed that they refer to the methods used to reduce the health risks and boarding time during the occurrence of the COVID-19 pandemic by either investigating the classical airplane boarding methods or with proposed alternative methods for passengers’ boarding for reducing the infection rate.
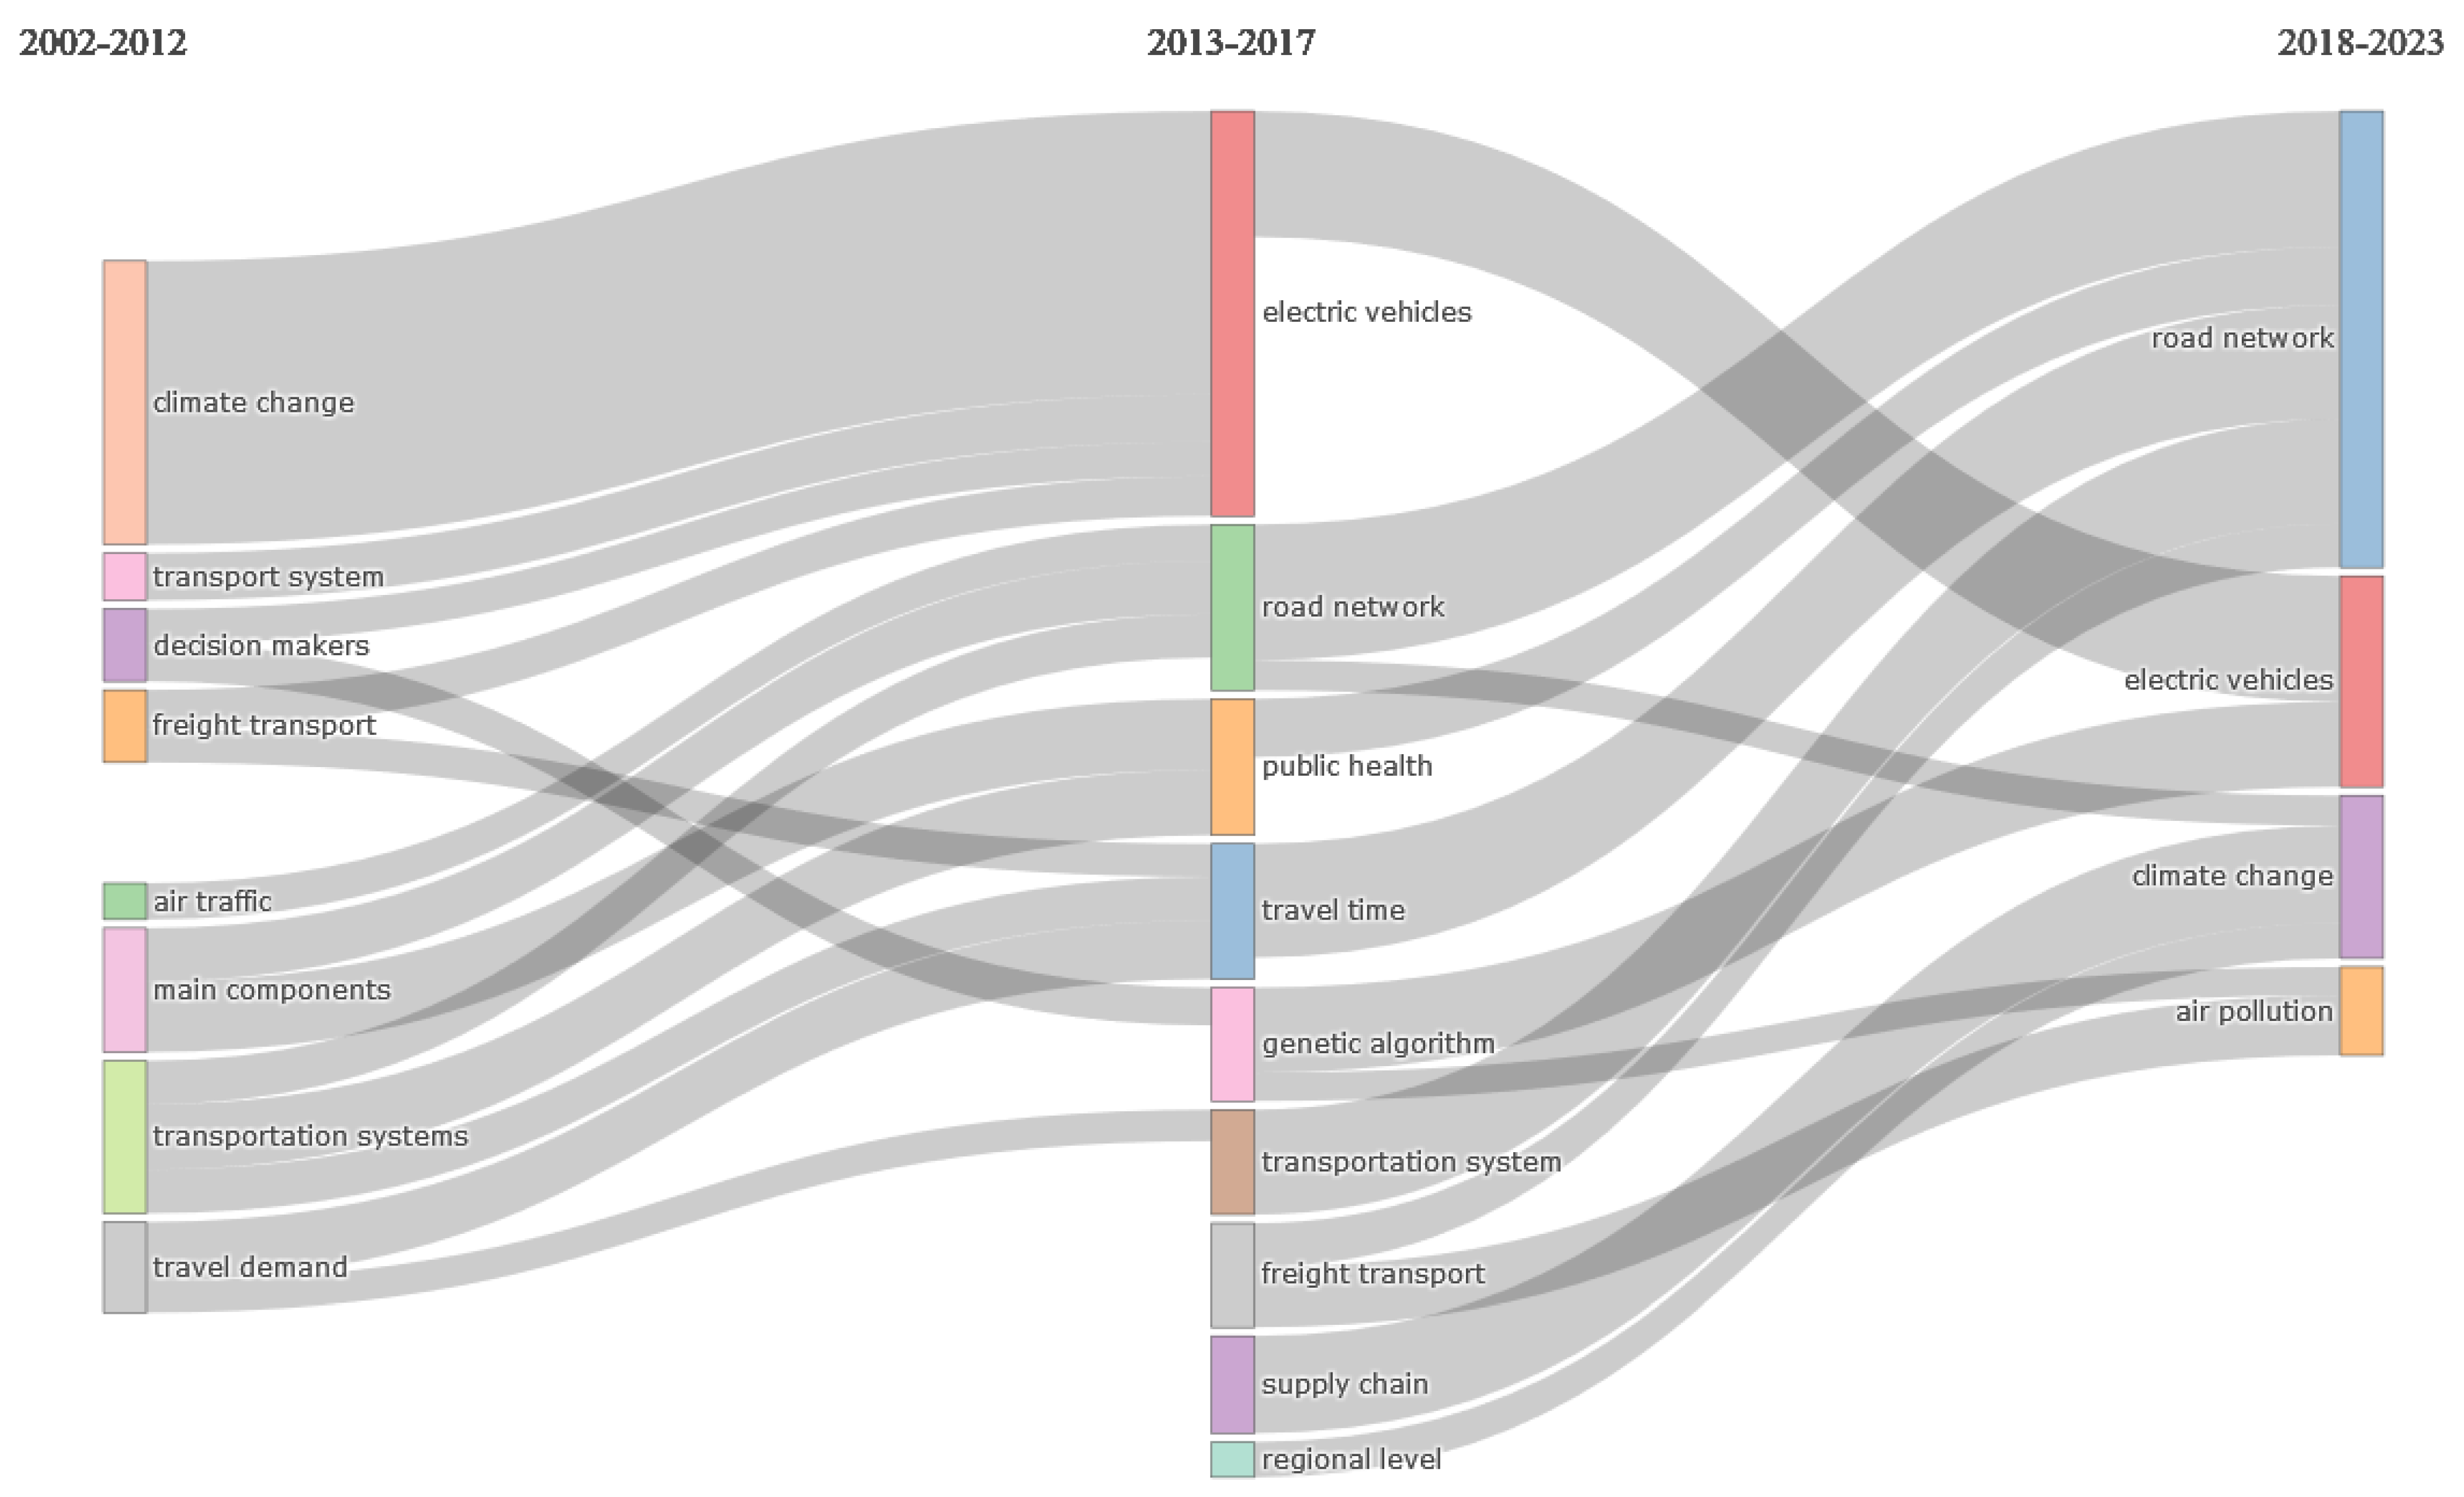
Figure 21 presents the evolutionary framework of the three identified periods. By observing the flows in
Figure 21, it can be observed that discernible patterns emerge, characterized by the convergence and divergence of topics into discrete thematic domains. It is noteworthy that in the initial period, the topic associated with the “climate change” bigram exhibited merging with the “transport system” topic bigram, and some of the topics associated with decision makers and freight transportation merged into the “electric vehicles” topic bigram identified for the second period. Furthermore, the “electric vehicles” topic bigram identified in the second period merged into the “electric vehicles” topic bigram identified in the third period.
Moreover, a substantial portion of topics within the 2013–2017 timeframe underwent a process of amalgamation into a wide range of thematic domains in the subsequent 2018–2023 period as depicted in
Figure 21, highlighting the dynamicity of the ABM in the transportation field. Overall, it can be observed that most of the bigrams provided for the 2018–2023 period feature elements related to road transportation and climate change.
A comprehensive methodology was employed, adopting a factorial approach that leveraged multidimensional scaling (MDS). This approach was predicated on the utilization of bigrams extracted from the abstracts of all papers, following the exclusion of the most prevalent bigrams associated with ABM. The objective was to effectively streamline the intricate dimensions of research, resulting in the formation of discernible clusters, as visually depicted in
Figure 22.
The cluster delineated in red within
Figure 22 encompasses prominent bigrams related to three dimensions: the public transportation system in general (“public transportation”, “transportation system”, “transportation systems”), climate change issues (“climate change”, “air pollution”, “traffic congestion”, “travel times”, “travel demand”, “energy consumption”), and road transportation (“electric vehicle”, “ev adoption”, “charging stations”, “charging infrastructure”).
Conversely, the blue-colored cluster comprises bigrams associated with air transport (“boarding methods”, “boarding time”, “social distancing”), and it refers to the papers written in the COVID-19 pandemic period, which featured the development of better boarding strategies for airplane boarding in order to consider the social distance and to minimize the infection rate.
Based on the factorial map in
Figure 22, the use of the ABM in modeling and solving transportation-related issues can be further highlighted in various areas of the transportation area, such as the motor theme of the road network, the niche theme of boarding time in air transport, or the basic themes of supply chain, electric vehicles, and climate change.
