Abstract
Water infrastructure integrity, quality, and distribution are fundamental for public health, environmental sustainability, economic development, and climate change resilience. Ensuring the robustness and quality of water infrastructure is pivotal for sectors like agriculture, industry, and energy production. Machine learning (ML) offers potential for bolstering water infrastructure integrity and quality by analyzing extensive data from sensors and other sources, optimizing treatment protocols, minimizing water losses, and improving distribution methods. This study delves into ML applications in water infrastructure integrity and quality by analyzing English-language articles from 2015 onward, compiling a total of 1087 articles. Initially, a natural language processing approach centered on topic modeling was adopted to classify salient topics. From each identified topic, key terms were extracted and utilized in a semi-automatic selection process, pinpointing the most relevant articles for further scrutiny, while unsupervised ML algorithms can assist in extracting themes from the documents, generating meaningful topics often requires intricate hyperparameter adjustments. Leveraging the Bidirectional Encoder Representations from Transformers (BERTopic) enhanced the study’s contextual comprehension in topic modeling. This semi-automatic methodology for bibliographic exploration begins with a broad topic categorization, advancing to an exhaustive analysis of each topic. The insights drawn underscore ML’s instrumental role in enhancing water infrastructure’s integrity and quality, suggesting promising future research directions. Specifically, the study has identified four key areas where ML has been applied to water management: (1) advancements in the detection of water contaminants and soil erosion; (2) forecasting of water levels; (3) advanced techniques for leak detection in water networks; and (4) evaluation of water quality and potability. These findings underscore the transformative impact of ML on water infrastructure and suggest promising paths for continued investigation.
1. Introduction
Water infrastructure integrity, quality, and distribution are pivotal for public health, environmental sustainability, economic development, climate change resilience, and social equity [1,2,3,4]. Deterioration in water quality can propagate waterborne diseases, and ensuring access to uncontaminated and safe drinking water is imperative [5]. Safeguarding water infrastructure integrity and maintaining quality are vital for the efficient and responsible use of water resources for future generations [6]. Water plays a crucial role in agriculture [7], industry, and energy production [8], and meticulous oversight of water infrastructure can guarantee that these sectors receive the resources they need. The onset of climate change introduces alterations in both water availability and its quality [9], and steadfast practices in water infrastructure maintenance and quality assurance can assist communities in navigating these challenges [10]. Furthermore, water scarcities and degraded quality often bear a skewed impact on marginalized communities and economically challenged households [11]. Vigilant attention to water infrastructure integrity and quality ensures equitable access to pristine and consistent water resources for all.
Machine learning (ML) can be used to improve water distribution and water quality by analyzing large amounts of data from sensors and other sources [12]. These algorithms can detect patterns and anomalies in water quality and distribution [13], allowing for the optimization of water treatment processes, reduction in water losses, and more efficient and effective water distribution. For example, machine learning can predict water demand based on weather patterns and other factors [14], helping utilities to adjust distribution accordingly. These algorithms can also detect leaks and other issues in the water distribution network [15], enabling utilities to identify and address problems before they become significant issues.
In this study, an overview of ML applications in the realm of water infrastructure integrity and quality was conducted. Scopus was chosen as the primary database, and a search was initiated using the terms “water management” and “machine learning”. The focus was placed on English-language articles published from 2015 onward, resulting in a total of 1087 articles. Following the initial phase, a decision was made to employ a natural language processing technique centered on topic modeling, as detailed in Section 2. By using this approach, the primary identification of the most pertinent topics was facilitated. It is crucial to highlight that in the second iteration of topic identification, the article selection was meticulously guided by the keywords that were extracted, the topic that was identified, and a review that was conducted by experts. Through this methodology, a detailed analysis of each topic was enabled.
The goal of topic modeling is to cluster documents and words with similar meanings. This technique is commonly employed across various domains, such as natural language processing (NLP) and information retrieval (IR). Unsupervised ML algorithms are used to extract topics from collections of documents. Several topic modeling methods exist, including Probabilistic Latent Semantic Analysis (PLSA) [16], Latent Dirichlet Allocation (LDA) [17], and non-negative matrix factorization (NMF)—an unsupervised technique for dimensionality reduction in non-negative matrices [18]. NMF has been widely applied to discern underlying connections between texts and to discover latent themes [19], while these approaches do not necessitate labels for operation, they do require specifying the number of categories for clustering. Although numerous topic modeling systems are based on LDA and NMF, generating meaningful topics often entails significant effort in hyperparameter tuning.
Generally, traditional methods exhibit certain drawbacks, such as their inability to capture semantic relationships between words when using bag-of-words representations. These representations neglect the context of words within a sentence, potentially hindering the accurate representation of documents. To address these limitations, this article employs a semi-automatic approach for conducting bibliographic analysis, leveraging BERTopic [20]. This method offers a better contextual understanding compared to its predecessors, making it well-suited for modeling topics.
In this semi-automatic approach, an initial search is performed using the Scopus database, yielding a collection of abstracts relevant to the inquiry. These abstracts undergo topic modeling utilizing Bidirectional Encoder Representations from Transformers (BERTopic) [21]. Subsequently, an expert validates the primary topics for consistency and selects those deemed pertinent. With the relevant terms from each topic, new Scopus queries are generated, leading to a traditional bibliographic analysis based on the query results, complemented by a clustering analysis grounded in bigrams.
Four primary topics within the sphere of water infrastructure integrity and quality are illuminated by the findings: Advancements in Machine Learning for Water Contaminants and Soil Erosion, Forecasting Water Levels, Advanced Leak Detection in Water Infrastructure, and Assessing Infrastructure Integrity alongside Water Quality and Potability. A diverse array of challenges and research opportunities become apparent upon a meticulous exploration of each topic. The outcomes of this review advocate for the potential of machine learning techniques combined with cutting-edge monitoring systems in multiple aspects of water infrastructure and quality. Noteworthy enhancements are emphasized in predicting groundwater contamination, forecasting water levels, detecting and pinpointing infrastructure vulnerabilities and leaks, and gauging and forecasting water quality. These progressions, resulting from the melding of technology and research, facilitate the preservation and sustainable utilization of this paramount resource. Building on these critical developments, we delineate the primary contributions of this article, which not only underscore the significant strides made but also chart a course for future explorations in this domain.
The main contributions of the article are:
- The article conducts a bibliographic analysis of English-language articles from 2015 onward, resulting in a total of 1087 articles, to explore the applications of machine learning (ML) techniques in water infrastructure integrity and quality.
- The study utilizes a semi-automatic approach, leveraging BERTopic, for conducting the bibliographic analysis, which enhances the contextual comprehension in topic modeling.
- The article also emphasizes the potential of combining ML techniques with cutting-edge monitoring systems in multiple aspects of water infrastructure and quality.
- The insights drawn from the analysis highlight the instrumental role of ML in enhancing water infrastructure’s integrity and quality, suggesting promising future research directions.
The following sections are structured as follows: In Section 2, the process for conducting the bibliographic analysis is described. Section 3 and Section 4 provide a detailed bibliographic analysis of the chosen articles. Initially, BERT topics are selected and a general scientometric analysis is conducted in Section 3. Subsequently, Section 4 presents a bigram analysis for each selected topic, along with the traditional bibliographic analysis. Future research directions are discussed in Section 5, and finally, Section 6 outlines the conclusions and next steps.
2. Methodology
This section introduces the proposed methodology, first providing an overview and then delving into the details of each stage. The process begins with a Scopus search using the terms “Machine Learning” and “Water Management”, targeting English-language articles published from 2015 onward. The results are analyzed using the methodology outlined in Section 2.1. Figure 1 visually depicts the methodology employed in this review. For each topic obtained, experts in the field validate the results, assessing the coherence between the main terms. Upon meeting expert criteria, a new search is conducted based on the attributes found within the topic. Article selection is then once again carried out according to expert criteria. A bigram analysis is performed for this selected subset, as described in Section 2.2, in conjunction with a traditional review. This traditional in-depth review entails reading the articles and extracting their key features.
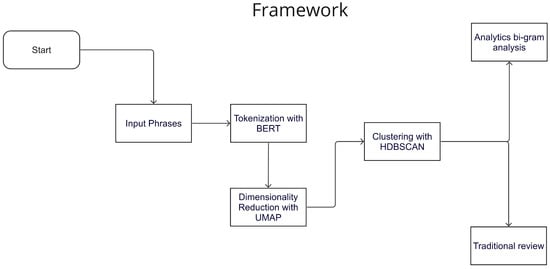
Figure 1.
Illustration of the semi-automated literature review methodology, demonstrating the process and key steps involved.
2.1. Topic Analysis
The topic selection is carried out by analyzing the abstracts of all retrieved documents, involving a three-stage process. In the first stage, a numerical and contextual representation is generated for each term. This representation is achieved using a pre-trained neural network model called Bidirectional Encoder Representations from Transformers (BERT) [22]. BERT is designed to improve the understanding of context and semantics in language, enabling more accurate performance across a wide range of NLP tasks such as sentiment analysis, named entity recognition, question-answering, and machine translation. The key innovation in BERT is its bidirectional training approach, which allows the model to process text simultaneously from both the left and the right context. This is in contrast to traditional NLP models that typically process text in a unidirectional manner, either left-to-right or right-to-left. By considering the context from both directions, BERT can capture a more accurate understanding of the relationships between words and their meanings within a sentence or text. BERT embeddings are highly effective in language comprehension, as they capture the semantic relationships between words.
After embedding the words as vectors, a dimensionality reduction process is necessary to analyze and group the concepts meaningfully, while various techniques can be employed for this purpose, the Uniform Manifold Approximation and Projection for Dimension Reduction (UMAP) technique [23] is used in this case, as it effectively preserves both global and local components of the data space. The UMAP algorithm leverages the concepts of simplices from algebraic topology and manifold theory to perform dimensionality reduction. It functions by approximating the high-dimensional data manifold in a lower-dimensional space while preserving the relationships between data points. After completing the dimensionality reduction, the next step is to perform clustering to identify similarities that enable topic extraction. Building upon the work presented in [20], the Hierarchical Density-Based Spatial Clustering of Applications with Noise (HDBSCAN) algorithm [24] is employed at this stage to generate the topics. HDBSCAN works by first constructing a density-based minimum spanning tree for the dataset. It then uses a hierarchical clustering approach to identify clusters, allowing for the extraction of clusters with varying densities. This method also allows for noise points to be identified, which are not assigned to any specific cluster.
2.2. Bigram Analysis
A bigram is a sequence of two adjacent elements in a chain of tokens, which, in our case, refers to words. The goal of the bigram analysis is to conduct a statistical analysis of the frequency distribution of these bigrams across the various analyzed abstracts. To examine the documents considered in each topic identified by BERT obtained in the analysis, the R-bibliometrix package [25] is employed. Four specific visualizations are employed in the analysis. The first one is a Treemap, which is designed to identify the frequency of the main bigrams within each topic.
Following this, a thematic map is used. This visualization integrates the concept of density (internal associations) and centrality (external associations) to examine the connections between bigrams [26,27]. Density is a measure that indicates how connected a graph is concerning the maximum possible number of connections between its nodes. Density is calculated by dividing the number of existing edges in the graph by the maximum possible number of edges. Density ranges from 0 to 1, where a value close to 0 indicates that the graph is sparsely connected and a value close to 1 indicates that the graph is highly connected. Centrality is a measure that allows evaluating the importance of a node within a graph. This visualization is divided into four quadrants, each representing a distinct combination of density and centrality. Quadrant 1 features high density and high centrality, signifying the main topics covered in the articles. Quadrant 2 contains high centrality but low density, representing basic and cross-cutting topics. Quadrant 3, characterized by high density and low centrality, relates to niche or specialized topics. Lastly, Quadrant 4 encompasses emerging or underdeveloped topics with both low density and low centrality.
Lastly, the final two visualizations consist of conceptual maps and dendrograms. The conceptual structure visualization generates a map for each topic identified by BERT, showcasing the underlying structure. Specifically, multidimensional scaling (MDS) is applied to terms extracted from the document abstracts. In addition to examining the relationships between terms hierarchically, the conceptual structure is also displayed using a dendrogram. MDS is a statistical technique used to visualize the similarity or dissimilarity between objects or data points in a multi-dimensional space. The primary goal of MDS is to represent high-dimensional data in a lower-dimensional space while preserving the distances between data points as accurately as possible. On the other hand, a dendrogram is a tree-like diagram that visually represents the hierarchical clustering of objects or data points based on their similarities or dissimilarities. In a dendrogram, each leaf node represents an individual data point, while the branches represent the relationships between these data points. The branches’ height indicates the similarity level between the connected data points or clusters.
3. BERT Topics and General Bibliometrics
In this section, a general bibliometric analysis of scientific production will be carried out using all the articles obtained in the Scopus query. In the following sections, article selection will be performed using topic analysis and expert selection.
The bibliometric analysis commences with the identification of the most significant sources based on the number of articles published in various scientific journals during a specific time period. Figure 2a presents the results of this analysis. Upon analyzing a total of 1087 documents, it was discovered that there are 362 publication sources, which consist of journals or conference proceedings. The top 10 sources were found to account for 272 documents, equivalent to 25% of the total production. The top three sources identified were Science of the Total Environment (4.7%), Journal of Hydrology (4.5%), and Water Research (3.3%). On the other hand, when we analyze the h-index in Figure 2b, we observe that the three journals remain the most cited. However, there is a change in the ranking order, with Journal of Hydrology obtaining an h-index of 19, Science of the Total Environment of 17, and Water Research of 12.
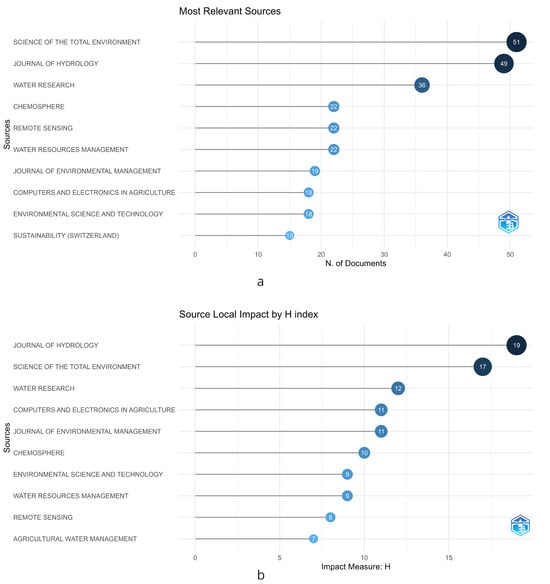
Figure 2.
Key journals highlighting the intersection of water management and machine learning, showcasing the most relevant studies in the field. (a) Impact measured through the number of documents. (b) Impact measured through the H-index.
In Figure 3, Bradford’s Law is illustrated [28], depicting the publication dynamics for different years. The law segments the distribution of research field literature into three zones: the core zone contains the most important journals, the second zone consists of less cited journals, and the third includes many infrequently cited journals. Bradford’s Law aims to identify the ‘core’ sources by conducting a citation analysis. Journals are sorted by the number of articles contributed, and a ‘core’ is established at the point where the contribution frequency significantly decreases. This point marks the transition from the core to the next zone and is determined by identifying where the number of articles starts to decline sharply, thereby setting the core’s limits. From the graph, we observe that the main sources analyzed in Figure 2 remain consistent. Another important aspect is understanding the evolution of scientific production over time, which is shown in the lower graph of Figure 3. Upon analyzing the graph, we observe that the slope changes significantly, increasing from the year 2019 onward. This change is consistent across the top six journals analyzed.
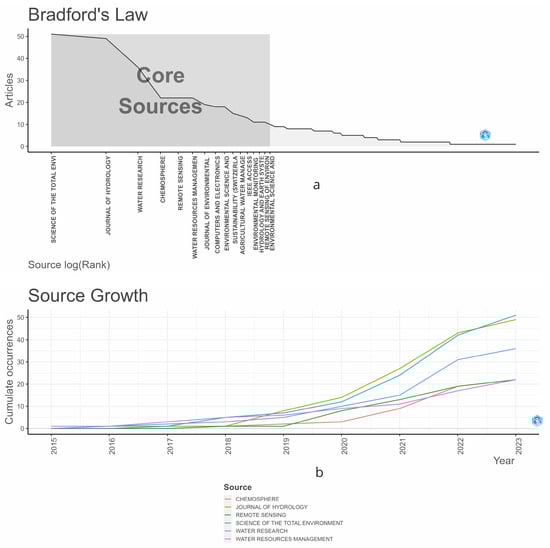
Figure 3.
Prominent Journals at the Intersection of Water Management and Machine Learning: (a) Showcasing the Application of Bradford’s Law, and (b) Highlighting Trends in Source Growth and Development within the Field.
In Figure 4, statistics for prominent authors contributing to the field of water management are showcased. A threshold of at least 8 articles published between 2015 and 2023 was established. In Figure 4a, the 20 authors who fulfilled this criterion are highlighted, with a total of 18 articles published by Yicheng Wang [29] who leads the pack. Liangpei Zhang [30] follows closely with 15 articles, and 13 articles by Li Xue [31] ranks third. In Figure 4b, the authors are visually represented based on the number of articles (indicated by the size of the circles) and the number of citations received (denoted by the color of the circles), plotted over time. From 2019 onward, articles began to be published by eleven authors, while three started from 2018, three from 2017, four from 2016, and two from 2015. Additionally, it is worth noting that an active publication record throughout the years is consistently maintained by almost all authors.
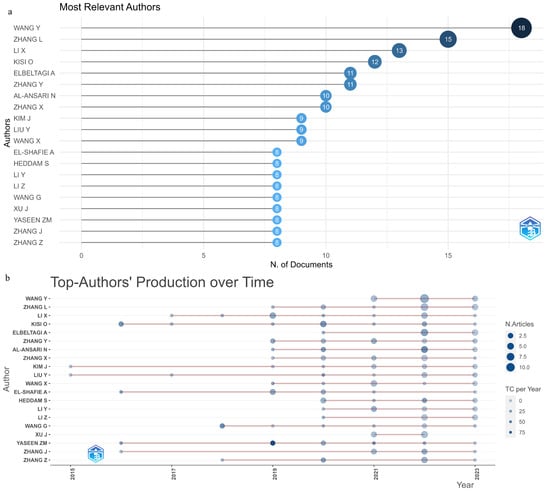
Figure 4.
Key statistics highlighting the prolific authors in the field of water management research.
In Figure 5a, a collaboration network graph has been generated, showing the relationships between the top authors in the dataset based on their co-authorship of publications. In the graph, there are four main groups. The green group is led by Wang, and the red group is led by Li. Interestingly, there is also interaction and collaboration between the different groups identified. On the other hand, Figure 5b displays the countries that stand out in the field. To construct the graph, all authors of each article are considered, and their country of origin is associated. In this regard, the most prominent country is China, with 1131 affiliated authors, followed by the USA with 749, India with 594, Iran with 230, and South Korea with 185.
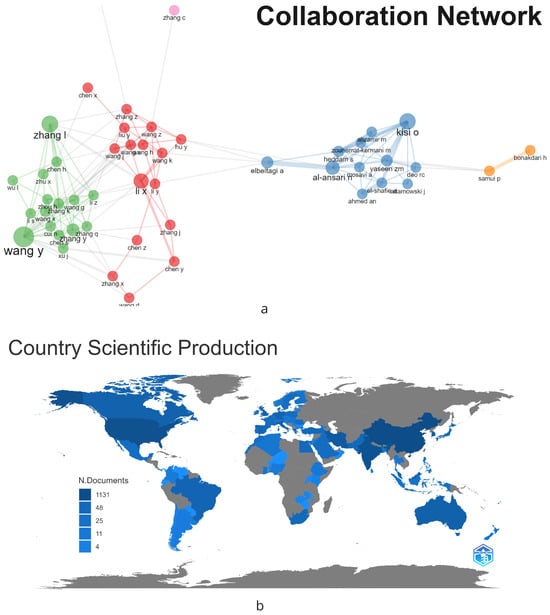
Figure 5.
Overview of main authors and their contributions to the field of water management research: (a) The Network of Authors, (b) Scientific Output by Country.
In Figure 6, the results obtained from the BERT analysis and expert selection are presented. In topic 1, when the related concepts are examined, it is reasonable to associate the concepts of water contaminants, soil erosion, and how these have been addressed by advances in machine learning. Researchers carry out the assessment and prediction of water quality and soil conditions using machine learning models. Real-time monitoring and spatial analysis of groundwater contamination and erosion susceptibility are made possible through geographic information systems (GIS) and remote sensing techniques, including satellite imagery and airborne hyperspectral remote sensing. Nitrate and heavy metal pollution in groundwater and soil are combated through environmental protection efforts, such as soil and water conservation, sustainable development, and land-use management. Therefore, the topic is related to advances in machine learning for the detection and management of water contaminants and soil erosion.
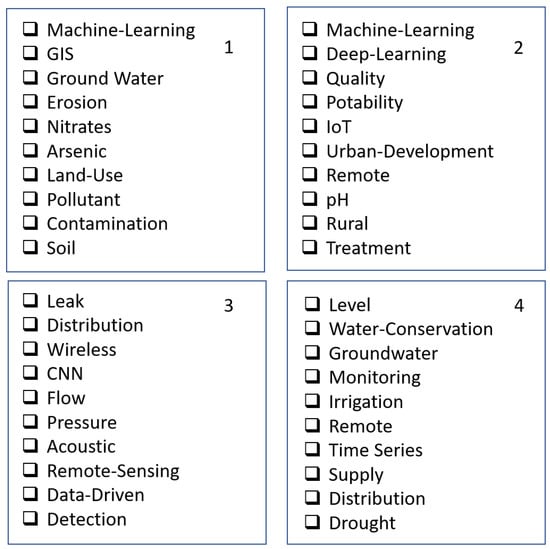
Figure 6.
Results of topic analysis using BERT and expert criteria selection: Four Topics Selected and Numbered from 1 to 4.
In the case of topic 2, the main concepts observed are related to water potability and quality. Analysis of these concepts reveals the central importance of water quality and potability. Assessment and prediction of water quality can be effectively conducted using machine learning and deep learning techniques. IoT sensors and remote sensing provide real-time monitoring of water quality in various environments. Factors such as urban development, pollution, and marine litter influence water quality, while rural areas face unique access and monitoring challenges. Ensuring potability and protecting public health requires groundwater quality and water treatment.
Regarding topic 3, leak detection is crucial for water distribution systems, pipelines, and water loss management. Machine learning techniques, including artificial neural networks, are vital for detecting and locating leaks. Data-driven approaches, convolutional neural networks (CNNs), and ensemble learning are used to improve performance. Acoustic features, flow, and pressure measurements are essential parameters for leak detection. IoT and wireless sensor networks enable real-time monitoring and increased efficiency in water management, while remote sensing, accelerometers, and feature selection techniques are critical components.
Finally, topic 4 is related to predicting or detecting water levels. Forecasting water levels is essential for effective water management, flood control, and drought management. Machine learning and remote sensing techniques enable accurate water level monitoring in rivers, lakes, reservoirs, and groundwater sources. Time series forecasting and hydrological modeling facilitate predictions and analysis, supporting water conservation and distribution efforts. These advancements contribute to the optimization of water supply systems and irrigation systems that rely on precise water level monitoring and control.
In the following sections, an in-depth analysis of bigrams and a traditional review will be carried out for each of the identified topics. The primary aim of this comprehensive examination is to gain a deeper understanding of the main research directions and potential future avenues of investigation. This holistic approach will provide valuable insights into the evolution of each topic, allowing for a more informed perspective on the most pressing issues and developments.
4. Bigram and Traditional Results
This section aims to address the study of each identified topic through a two-stage approach. Initially, a bigram analysis will be conducted for each topic, followed by a traditional analysis of some relevant articles.
Bigram analysis is a natural language processing (NLP) technique that allows examining the structure and relationships within a text by studying pairs of adjacent words in a text string [32,33]. This approach involves identifying and counting the frequency of such word pairs in a text data set, which can reveal patterns, themes, and trends in the analyzed content.
The use of bigram analysis is common in tasks such as text classification, summary generation, topic modeling, and text mining. This technique allows for identifying semantic relationships between words, which is especially useful for recognizing common phrases and expressions, as well as detecting potential areas of interest or research in a text data set. Subsequently, a traditional analysis of some selected articles will be carried out to complement the understanding of the topics and explore the main research lines and future directions in each area.
4.1. Advancements in Machine Learning for Water Contaminants and Soil Erosion
To predict concentrations of substances in water, follow these steps: identify substances of interest, collect and analyze water samples, develop mathematical models (regression, transport, or machine learning) to predict concentrations, validate and refine the model, and apply the model to inform water management decisions, guide monitoring, and evaluate pollution control measures. This process involves various analytical and modeling techniques and is essential for understanding water quality, contamination, and treatment effectiveness.
4.1.1. Bigram Document Analysis
In Figure 7, a thematic map displays the main concepts alongside a tree map, which illustrates the hierarchical visualization of the most frequent bigrams found in the article abstracts. Upon examining the tree map, we observe that arsenic, nitrates, iron, and manganese emerge as the primary components to be monitored. Moreover, the analysis context emphasizes groundwater, water quality, and water supply. Decision Tree and Random Forest algorithms stand out in this regard.
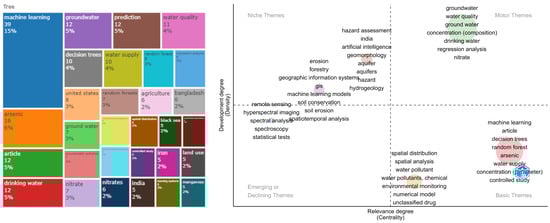
Figure 7.
Tree and thematic map for a water contaminants and soil erosion topic.
Additionally, the thematic analysis reveals six groups. In the top-right quadrant, there is a group related to groundwater and nitrate contamination. In the bottom-right quadrant, two groups are present: the first one, colored in red, is associated with water supply, arsenic contamination, and ML techniques for predicting concentrations; the second one, in yellow, is connected to spatial analysis methods for monitoring water pollutants. Of the remaining three groups, two are in the top-left quadrant. The first group focuses on risk assessment in aquifers, considering geomorphological conditions and ML algorithms, while the second group in the same quadrant addresses soil erosion and spatio-temporal analysis techniques. Lastly, the final group in the bottom-left quadrant primarily concerns techniques used for monitoring or measuring pollutant concentrations, with remote sensing, hyperspectral imaging, and spectroscopy being the most prominent methods.
In Figure 8, a conceptual map and a related dendrogram are presented, focusing on the topic of contaminants and soil erosion. In the conceptual map, two groups are identified. The first group, in light blue, is related to groundwater and nitrate contamination, which also has a strong connection to agricultural issues. The second group, in red, mainly concentrates on water quality and supply. In this context, Decision Trees and Random Forests reappear as the primary techniques used, and arsenic, nitrates, iron, and manganese are the minerals whose concentrations are sought to be measured. Upon examining the proximity of concepts in the dendrogram, it is evident that measuring contamination in groundwater is strongly related to agriculture, and nitrates are closely associated with the concept of prediction. On the other hand, soil and its erosion are connected to water supply and potable water topics. Arsenic is primarily linked to drinking water concerns.
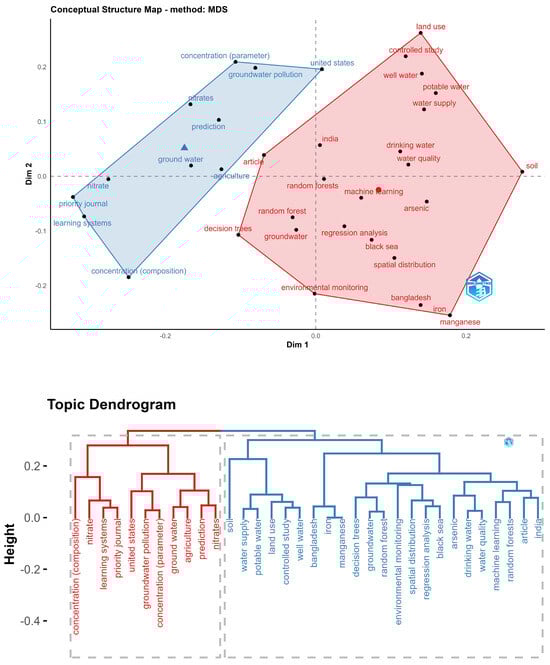
Figure 8.
Conceptual structure and dendrogram for a water contaminants and soil erosion topic.
4.1.2. Traditional Analysis
As shown in Table 1, several machine learning models—including Random Forest, XGBoost, and customized CNN—have been employed across a range of environmental applications, such as groundwater quality, gully erosion susceptibility, heavy metal prediction, soil erosion, and water pollution. Utilizing metrics like MAE, RMSE, R2, AUC, and Accuracy, these models were assessed on their ability to predict nitrate and arsenic concentrations in groundwater, identify factors contributing to soil erosion, and estimate pollution loads in rivers, among other objectives. The strong performance of these machine learning models demonstrates their potential in addressing environmental concerns and highlights the value of using advanced data-driven techniques for environmental monitoring, assessment, and decision-making. In the following, a brief summary of some of the studies included in the table is provided.

Table 1.
Summary of applications and techniques in Water Contaminants and Soil Erosion. Random Forest (RF), multi-layer perception (MLP), Classification and Regression tree (CART), multi-layer perceptron (MLP), convolutional neural network (CNN), and MLR (multiple linear regression).
A GIS-based statistical approach to estimate groundwater nitrate concentration was developed in [34], addressing the limitations of complex hydro-biogeochemical models. Multiple linear regression, Classification and Regression Trees, Random Forest, and Boosted Regression Trees are compared for predictive performance. The Random Forest model performs best, identifying hydrogeological units, arable land percentage, and nitrogen balance as key predictors. This method advances regional-scale groundwater nitrate prediction using only spatially available data. In [35], the authors compare four machine learning models for creating gully erosion susceptibility maps in western Iran, taking into account variables like distance from rivers, calcium carbonate equivalent, and topographic position index. Random Forest outperforms other models with the highest predictive performance (92.4% mean AUC). All models show stable performance through 10-fold cross-validation. The generated maps can help identify erosion risk areas, informing soil conservation and sustainable management plans by considering crucial contributing factors.
In [36], the researchers employ HyMap-C airborne hyperspectral imagery and a machine learning ensemble technique based on a stacking strategy to estimate soil heavy metal concentrations in Yitong County, China. Using competitive adaptive reweighted sampling (CARS) to select spectral features, the CARS-Stacking method outperforms other methods in predicting arsenic, chromium, lead, and zinc concentrations, with determination coefficients ranging from 0.60 to 0.73. The estimated results closely align with the distribution trends of actual ground measurements. Machine learning models for soil erosion susceptibility mapping were proposed in [37]. The techniques employed include weighted subspace Random Forest, Gaussian process with radial basis function kernel, and naive Bayes. Critical factors were identified using simulated annealing feature selection, and the models’ performances were evaluated based on accuracy, kappa coefficient, and probability of detection. The weighted subspace Random Forest method demonstrated superior performance, providing valuable tools for sustainable management, watershed conservation, and reduction in soil and water loss.
In [38], uses high-spatial resolution arsenic (As) field observations from 3 million groundwater sources across India to identify regions with elevated groundwater As levels and their influencing factors. Statistical and machine learning methods model As concentrations and predict high As-hazard zones. Factors like geology-tectonics, groundwater-fed irrigated areas, and elevation influence As occurrence. The model’s accuracy is 82–84% and AUC is 0.89–0.88. Around 90 million people are exposed to high groundwater As, but considering the modeled hazard, it could be over 250 million. In the Ganges River delta, the study [39] utilizes statistical methods and AI techniques, including Random Forest, Boosted Regression Trees, and Logistic Regression, to model the probability of groundwater arsenic concentrations surpassing WHO guidelines. A “hybrid multi-modeling approach” is employed, incorporating hydrostratigraphic parameters. The Random Forest model demonstrates superior performance, with 30.3 million people at risk from elevated groundwater As levels. These models offer valuable insights for identifying regional As-hazard zones and potential exogenous factors contributing to this significant natural pollution problem.
Machine learning techniques like Random Forest and quantile Random Forest (QRF) are used to estimate redox conditions and nitrate concentrations in groundwater across Germany at a 1 km × 1 km resolution [40]. Using the European Water Framework Directive monitoring network and spatial environmental information, the Random Forest model achieves a strong predictive performance with an R2 of 0.52. Dominant predictors include redox conditions, hydrogeological units, and arable land percentage. Uncertainty assessment with QRF reveals considerable uncertainties, but the study represents the first nationwide data-driven assessment of groundwater nitrate concentrations in Germany. The authors employ Random Forests Regression (RFR) to estimate stream nitrogen and phosphorus concentrations from sensor data in [41], addressing the limitations of linear regression models. RFR shows promise for most nutrient variations, with soil moisture and fluorescent dissolved organic matter as important predictors. This approach offers the potential to supplement traditional nutrient datasets.
In [43], the researchers utilized 22,000 private well nitrate measurements from North Carolina to generate exposure estimates for unmonitored areas. They assessed multiple machine learning models and found that the final Random Forest model achieved a 0.75 accuracy. This model’s predictions will be incorporated into the Agricultural Health Study cohort to estimate nitrate levels in private wells throughout unmonitored regions of North Carolina. Researchers developed an extreme gradient boosting (XGB) machine learning model to predict nitrate distribution in groundwater across the conterminous United States (CONUS) in [44]. The model used 12,082 well measurements and various predictor variables. With accurate national and regional estimates (R2 of 0.83 for training and 0.49 for hold-out data), the model showed that only 1% of the area had nitrate concentrations above 10 mg/L, affecting around 1.4 million people. High nitrate concentrations were most prevalent in central CONUS, with manure, farm fertilizer, and agricultural land use as influential factors. This study marks the first application of XGB to a three-dimensional national-scale groundwater quality model.
4.2. Assessing Water Quality and Potability
Evaluating water quality and potability is crucial for providing safe drinking water to the public. A comprehensive approach, encompassing the identification of potential contaminants, setting guidelines, gathering and analyzing samples, interpreting findings, implementing treatment measures, and continuously monitoring water quality, can effectively safeguard public health and preserve a dependable source of potable water.
4.2.1. Bigram Document Analysis
The main concepts have been examined in the bigram analysis as displayed in Figure 9. It reveals that water quality is predominantly applied to water pollution, groundwater, and water supply. Among the highlighted algorithms, Decision Trees and artificial neural networks have been identified. Additionally, the sensorization aspect is a crucial point under development.
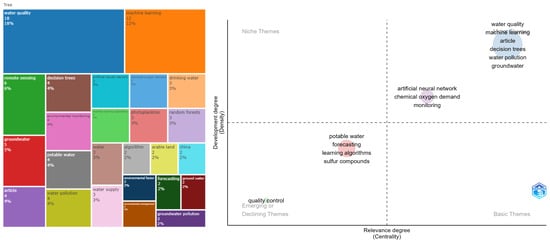
Figure 9.
Tree and thematic map for a water quality and potability topic.
Four main groups have been observed in the thematic map analysis. The first group, in light blue, is related to machine learning methods employed for water pollution detection. In close proximity to this group, another group focuses on research related to artificial neural networks applied to water quality monitoring. In the emerging themes quadrant, two groups are observed. The first group is associated with predicting components like sulfides and others related to potability, while the final group is associated with water quality control.
Lastly, when analyzing the conceptual structure map and the dendrogram in Figure 10, two major groups are observed. The blue group is related to water quality monitoring, linking parameters such as turbidity and consumption times. In contrast, the larger group corresponds to machine learning techniques used to predict or classify water quality or related parameters. Neural networks, support vector machines, and Random Forests are among the highlighted techniques.
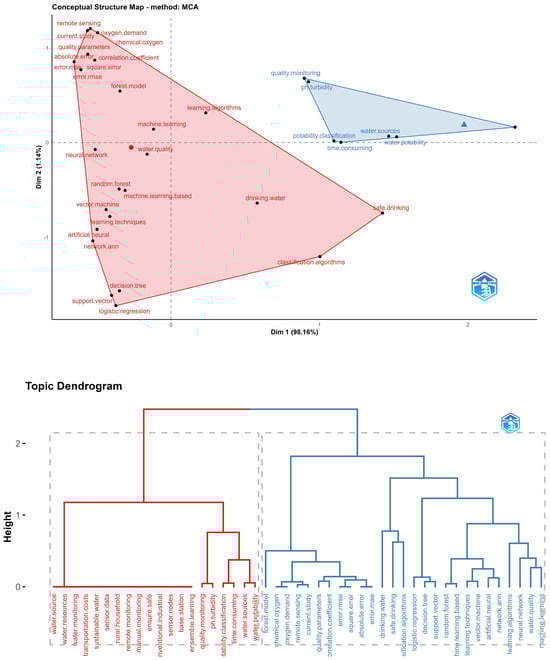
Figure 10.
Conceptual structure and dendrogram for a water quality and potability topic.
4.2.2. Traditional Analysis
Table 2 presents a summary of various machine learning techniques and their metrics, data sources, and applications in water quality studies. Techniques include GBM, ANN, XGBoost, Naive Bayes, KNN, CART, and others. Metrics range from accuracy to RMSE, R2, and F1-score. Data sources vary, with some coming from Kaggle or collected from sensors, while applications include water quality modeling, potability classification, and monitoring of key parameters such as total nitrogen, total phosphorus, and chemical oxygen demand.
Table 2.
Summary of applications and techniques in water quality. Random Forest (RF), artificial neural network (ANN), Decision Tree (DT), multi-layer perceptron (MLP), Long Short-Term Memory (LSTM).
A data-driven water classification model for rural household areas using sensor nodes and a machine learning algorithm was developed in [55] to classify water potability using a hard-voting method in ensemble learning. The results show that the voting classifier model achieves an accuracy of 97% compared with other stand-alone classification algorithms. In [64], another interesting approach used an edge-cloud ubiquitous sensor network for low-cost water quality measurement to supplement existing IoT-based infrastructure. Machine learning algorithms are applied to a dataset containing eight fields related to water potability. Then, 16 machine learning algorithms for potability prediction were compiled, including 11 shallow learning algorithms and 5 deep learning algorithms. CNN-Batch Normalization, the most accurate of these algorithms, achieved a maximum testing accuracy of 85.03%. In [51], the authors investigate the application of FEYN and Q-Lattice machine learning methods for data classification in water potability. By integrating these techniques with various datasets, the researchers attained a 68% accuracy level in classifying water potability, showcasing the efficacy of this approach.
Neural networks with memory, Long Short-Term Memory (LSTM), were used in [65] to create a deep learning water potability classification model for rural water sources in the Philippines. The model achieved a high accuracy of 99.80% using MLP, while LSTM performed better in accuracy and recall compared to GRU, GRU had better precision than LSTM. The quality of the river Ganges was determined in the study referenced in [66]. Several parameters were used to classify the water using various classification algorithms, including Random Forest, a supervised machine learning algorithm. This model achieved an accuracy of around 99%, significantly higher than other methods for predicting water quality. In [50], an Internet of Things framework was developed for water quality monitoring and potability classification using portable sensor nodes. The system achieved an accuracy of 93.33% compared to conventional industrial water laboratory tests, and it is capable of communicating the water potability status to households with minimal delay.
A consumption model was developed in [67]. The model, developed in Python, utilizes a dataset from Kaggle and the MinMax scaling method from the Sklearn library. The Keras library aids in implementing the seven dense layers in the neural network. The resulting model achieves around 70% accuracy. In [68], the authors employ Artificial Intelligence, specifically a convolutional neural network (CNN), to predict water quality more efficiently than traditional methods. The CNN outperforms five other machine learning algorithms, achieving 97% accuracy in predicting water potability based on eight water property parameters. Additionally, the CNN reduces classification processing time, demonstrating its effectiveness in maintaining water quality balance and protecting human health and the ecosystem.
A machine learning method to detect potable-reclaimed water pipe cross-connection events using multiple water quality parameters is explored in [62]. A Pearson correlation coefficient (PCC)-SVM-based method was developed, providing high detection performance and reliability, even during abnormal readings. Detection accuracy exceeded 88%, with a false positive rate below 12%, demonstrating the method’s practical applicability for early warning systems. In [54], a CNN along with a processing pipeline is utilized to tackle the challenge of detecting toxin-producing phytoplankton in water, surpassing the constraints of conventional techniques. The authors put forward a cutting-edge, fully automated approach that employs digital microscopy and machine learning for the analysis of multi-specimen images. This system adeptly detects, segments, and classifies phytoplankton, providing a reliable and consistent instrument for specialists to assess water quality and potability.
In [59], the authors use Random Forest and multiple spatial environment factors to model groundwater nitrate pollution in Yinchuan Region. Remote sensing and GIS methods were employed to create training and test sets. Model performance was assessed using MAE, RMSE, and , with positive results. Key factors influencing nitrate levels included proximity to the Yellow River, meteorological elements, water level elevation, urban land, and arable land. The study offers an integrated approach to groundwater quality analysis and sustainable management in the Yinchuan Region. The development of more accurate machine learning models for predicting irrigation parameters and water quality is studied in [60]. LSTM, MLR, and ANN models are used. These models predict six irrigation water quality parameters and are validated using MSE, correlation coefficients, RMSE, and MAE. The results can improve irrigation water quality and assist farmers in crop planning and irrigation management.
Finally, in [61], a method for accurate water quality monitoring in inland waters was proposed. This study introduces proximal remote sensing using a high-resolution hyperspectral imager for long-term monitoring. Machine learning algorithms were developed and validated with in situ data from three sites featuring varying water quality. The back-propagation neural network model achieved over 80% accuracy for TN and over 90% for TP and COD, demonstrating the potential of combining proximal remote sensing and machine learning for inland water quality monitoring.
4.3. Forecasting Water Levels
Forecasting water levels is crucial for efficient water resource management. Various methods, including hydrological models, hydraulic models, remote sensing, statistical models, machine learning, and ensemble forecasting, can be used to predict water levels. These forecasts have numerous applications, such as flood risk management, drought management, irrigation planning, hydropower generation, navigation, and ecosystem management.
4.3.1. Bigram Document Analysis
The main concepts have been examined in the bigram analysis, as shown in Figure 11. For the topic of forecasting water levels, it is evident that the primary applications are related to water management, water supply, water levels, groundwater, and irrigation. Regarding techniques, regressions and artificial neural networks appear among the first. Moreover, the development of remote sensing is a critical point.
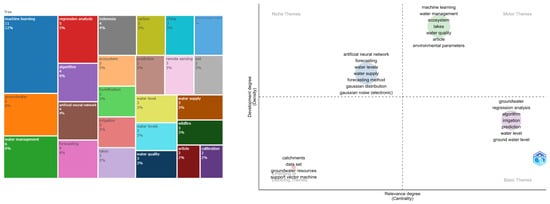
Figure 11.
Tree and thematic map for a forecasting water levels topic.
In the thematic map analysis, four main groups have been observed. The first group, in light green, is related to water management, lakes, water quality, and machine learning applied to these types of issues. A cluster in the lower right quadrant concerns ground water level, irrigation, and prediction models using regression techniques. The light blue cluster associates water level with water supply, performing forecasting through artificial neural networks. Finally, the last cluster in the lower left quadrant is related to groundwater resources.
Upon analyzing the conceptual structure map and the dendrogram in Figure 12, two large groups are observed. The blue group is related to water conservation, environmental issues, water quality, and lakes. In red, a cluster involves water reservoirs, groundwater, and predicting levels through various techniques, with SVM, ANN, Cluster analysis, and Gaussian process regression standing out.

Figure 12.
Conceptual structure and dendrogram for a a forecasting water levels topic.
4.3.2. Traditional Analysis
In Table 3, a summary of the main articles found is presented. The studies include the use of CNN and SVR models for groundwater potential mapping, MPMR, RVM, GPR, and ELM for forecasting lake level fluctuations, ANN and ANFIS for reservoir water level prediction, and GTB for estimating water levels in irrigation systems. Additionally, extreme gradient boosting, XGB, and Gaussian process regression models have been employed for groundwater depth estimation and irrigation water demand prediction, while HCA and ANN have been used for annual groundwater level forecasting in the Ogallala Aquifer. Lastly, Landsat 8 OLI-based models were developed for deriving humification indexes in Chinese lakes. The following is a brief summary of some of the articles considered in the table.
Table 3.
Summary of applications and techniques in Forecasting Water Levels. Random Forest (RF), Xtreme gradient boosting (XGB), Multilinear Regression (MLR), Decision Tree (DT), support vector machine (SVM), Ordinary Krigging (OK), and Coordinative ordinary Kriging (COK).
The study comparing the performance of support vector regression (SVR) and convolutional neural networks (CNN) in groundwater potential mapping in Damyang, South Korea, showed that both models effectively predicted groundwater potential, with CNN exhibiting slightly higher accuracy [69]. This suggests that deep learning algorithms, such as CNN, can enhance spatial predictions for sustainable groundwater management and aid in developing effective groundwater exploitation strategies. In a separate study, a Gradient Tree Boosting (GTB)-based method for predicting water levels in irrigation and drainage systems was developed, addressing the limitations of traditional hydrological models that demand extensive data and computing time [72]. The GTB model, developed using data from Vietnam’s Bac-Hung-Hai system with 3348 samples collected between 2000 and 2020, was compared to eight common machine learning algorithms for performance evaluation. The GTB-based method provides an efficient solution for sustainable water management and regulation in the face of accelerated urbanization and climate change.
In [73], the authors aim to evaluate and contrast the efficacy of three statistical algorithms (Random Forest, XGBoost, and Multilinear Regression) for spatiotemporal modeling of groundwater level dynamics in a vast tropical peatland located in Central Kalimantan, Indonesia. The employed dataset consists of comprehensive field data collected between 2010 and 2012, incorporating variables such as distance from canal, elevation, precipitation, and evapotranspiration. The study’s goal is to shed light on the importance of crucial physical system parameters and climatic influences in predicting GWL. The results offer the potential to improve understanding and address peatland vulnerability to fire and associated carbon losses, benefiting the scientific community and informing peatland restoration strategies. A study on the development of neurocomputing intelligence models to forecast lake water level (LWL) fluctuations in five large lakes located in the northern US was conducted in [77]. The study uses three machine learning models, including LSSVR, MARS, and M5-Tree, and various input combinations based on correlated lags and time series periodicity. The performance of the models is evaluated using statistical metrics and graphical visualization, and the results indicate that the P-LSSVR model is the most powerful for modeling all lake levels and a better alternative to the other three neurocomputing intelligence models.
Groundwater level mapping is crucial for resource management in arid regions with intricate terrain. In [29], researchers constructed a geospatial database and applied various machine learning techniques to learn groundwater depth using well data from the Mu Us Sandy Land, China. The Bayesian optimization algorithm was employed to fine-tune hyper-parameters, and GL maps were generated based on the predicted groundwater depth and elevation data. Machine learning approaches, such as Random Forest and extreme gradient boosting algorithms, demonstrated effectiveness in tackling regression problems related to groundwater research.
Dissolved organic matter (DOM) is a crucial component in inland waters, impacting ecosystems, food webs, and the global carbon cycle. Although lake ecosystems make up a small portion of the Earth’s water resources, they are especially susceptible to environmental and climate changes. Dissolved chromophoric organic matter plays a pivotal role in aquatic light regimes, trophic status, and drinking water safety. Urbanization and economic growth influence the composition of terrestrial organic matter and microbial degradation processes, leading to uncertainties in regional aquatic ecosystems. Fluorescence emission–excitation matrix spectroscopy is a sensitive technique for evaluating DOM sources and compositions. Remote sensing techniques are indispensable for monitoring water quality and DOM fluctuations, with machine learning methods offering the potential to characterize DOM components and sources. In [76], the authors aim to develop an algorithm for DOM fluorescence parameters in Chinese lakes and showcase its environmental connection with human activities and water quality management.
4.4. Advanced Leak Detection in Water Networks
Water leak detection is crucial for effective water management, waste reduction, and preventing damage to infrastructure and property. Various methods are used to detect leaks, such as acoustic leak detection, visual inspection, tracer gas leak detection, pressure testing, data loggers and flow meters, smart water networks, and pipe inspection robots and cameras. Each method has its benefits and limitations, and choosing the most suitable method depends on factors like pipe material, leak size, and pipeline location. Often, a combination of methods is used to ensure accurate and efficient leak detection.
4.4.1. Bigram Document Analysis
The treemap with the main concepts has been examined in the bigram analysis as shown in Figure 13, revealing that leak detection is mainly applied to water distribution networks and leak detection. Among the highlighted algorithms, support vector machine, artificial neural networks, and Decision Trees have been identified. Furthermore, four main groups have been observed in the thematic map analysis. The first group, in light blue, is related to machine learning methods that have been used for leak detection. However, close to this group, another group has been identified, which considers research related to sensors associated with leak detection. In the emerging themes quadrant, two groups are also observed. The first group is associated with Bayesian techniques used for tackling leak identification and localization, while the second group connects leaks with operational matters. The latter point is considered crucial, given that such models should ultimately be employed for decision-making. The operational aspect is deemed the most suitable area for conducting these tasks. Lastly, when analyzing the conceptual structure map and the dendrogram, as shown in Figure 14, two major groups are observed. The blue group encompasses everything related to operational conditions, leak detection, and risk assessment, all of which are linked to decision-making support. However, the primary focus of the main group is the utilization of machine learning techniques for constructing leak detection models.
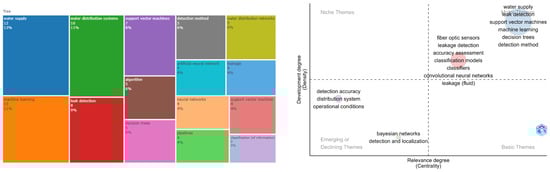
Figure 13.
Tree and thematic map for a leak detection topic.
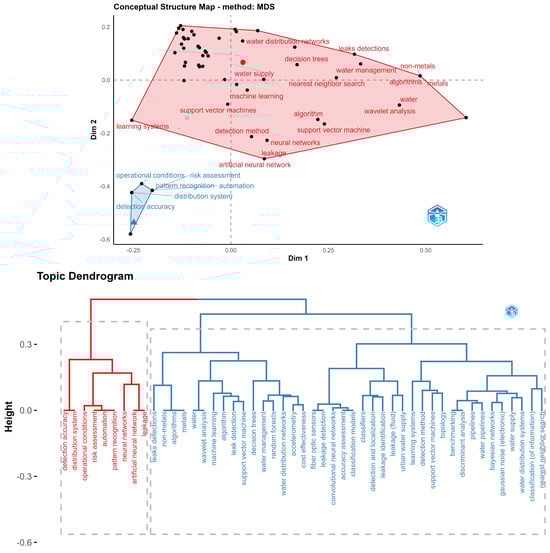
Figure 14.
Conceptual structure and dendrogram for a leak detection topic.
4.4.2. Traditional Analysis
In Table 4, a summary of the articles mainly identified with the topic of leak detection is displayed. It is observed that classification models are primarily constructed, with accuracy being the main metric used for evaluating the models. Among the principal techniques found are RF, ANN, SVM, and KNN. Additionally, convolutional networks were used for constructing the models in the studies that utilized images or multivariate time signals. The primary issue to address was leak detection; however, some works also considered leak localization. A brief summary of some of the referenced works in the table follows.
Table 4.
Summary of applications and techniques in water leak detection. Random Forest (RF), artificial neural network (ANN), convolutional neural network (CNN), Decision Tree (DT), and support vector machine (SVM).
In [98], a state-of-the-art review is conducted, focusing on the escalating demand for water due to socio-economic changes and the notable losses from leakages in water distribution systems. Current leak detection methods, which are labor-intensive and time-consuming, are scrutinized along with the historical evolution of leak management technologies. The burgeoning role of sensor-based smart water technology is underscored. This study’s objective is to impart insights and guide future research toward effective strategies for leak monitoring, detection, and assessment.
A methodology that employs artificial neural networks (ANN) and fluid transient waves for the non-invasive assessment of water pipe condition is introduced in [79]. The technique allows for predicting elements in a pipeline, such as the location and properties of a junction and the identification of leaks. The results reveal that the developed ANN can predict a junction with an error of 2.32 m or less in 95% of the cases. In [78], a leakage detection model for water supply networks called DBSCAN-MFCN is presented, which combines DBSCAN and multiscale fully convolutional networks (MFCN). By dividing the network into zones and using them as learning labels, the model improves efficiency and accuracy in leak detection, reducing water loss compared to other methods. The model detects leakage areas and is more accurate than support vector machine (SVM), Naive Bayes Classifier (NBC), and k-Nearest Neighbor (KNN), with improvements of 78%, 72%, and 28%, respectively.
Another relevant point, besides the use of ML, is the system’s sensorization. In [80], a water pipeline leakage detection method is proposed based on machine learning and wireless sensor networks. The system reduces energy consumption and improves leak detection accuracy using signal analysis and a support vector machine. The results show that the method effectively identifies leaks and consumes less energy than conventional methods. Another methodology used in these problems corresponds to the Bayesian temporal reasoning approach, which has been effective in enhancing leak localization accuracy within water networks. In [81], this approach is combined with linear discriminant analysis and neural network techniques. Preliminary results from a case study demonstrate an accuracy rate of over 80%. In [82], a time-frequency convolutional neural network (TFCNN) model is also used to identify leakage signals in water networks, outperforming other classification models and showing an average accuracy of 98% under various noise conditions. The detection accuracy reaches 99% in practice, making the transfer learning-based TFCNN a promising approach, especially when dealing with limited data sets.
In [83], the authors use machine learning to present an acoustic leak detection system for water pipes. The proposed solution employs a joint learning approach called multi-strategy ensemble learning (MEL) with a gradient boosting tree (GBT) classification model, improving performance and significantly reducing false positives compared to other models. A unique methodology for predicting leak shapes in water pipes is presented in [84]. This methodology uses the vibration signal generated by the leak noise. The research employs an innovative signal processing technique that combines machine learning with Random Forest classifiers and various signal features to develop a leak shape prediction algorithm. The results demonstrate a robust method for predicting leak shapes at different flow rates and backfill types, providing a valuable tool for water companies to assess leak repairs based on the leak shape. In [85], a fast hybrid method is proposed, using Random Forest, KNN, Bayesian network algorithms, and hydraulic relations to detect and locate leaks in water distribution networks. The approach relies on cost-effective flow sensors and hydraulic equations for leak detection. The results show that the method outperforms other existing methods. A novel unsupervised RNN model for leakage detection and location was introduced in [99], achieving a detection sensitivity of 97% using pressure data and 100% using flow data, with true leak zone identification for 95% of scenarios.
5. Discussion and Future Research Directions
The mind map in Figure 15 provides an overview of various research lines for addressing the challenges related to water management. Specifically, the map outlines topics: advanced leak detection in water networks, water quality and potability, forecasting water levels, and advancements in machine learning for water contaminants and soil erosion. Each of these topics is further divided into subtopics, such as machine learning algorithms, advanced monitoring systems, and innovative sensors. By exploring these areas, researchers can discover new approaches and techniques to enhance water management strategies and safeguard this crucial resource.
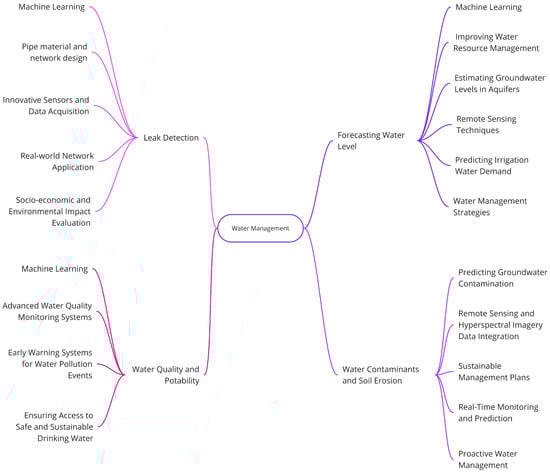
Figure 15.
Mind map grouping the main challenges to address in the different identified topics.
5.1. Advancements in Machine Learning for Water Contaminants and Soil Erosion
The topic of water contaminants and soil erosion presents promising avenues for future research, with machine learning acting as a catalyst for advancements in this field. A focal point of such research endeavors is predicting groundwater contamination using machine learning, calling for the development of a unified framework. This framework should merge multiple models for improved accuracy, leverage cutting-edge feature selection techniques to identify pivotal factors and evaluate the impact of climate change on contamination distribution.
Moreover, another integral aspect is the integration of remote sensing, and hyperspectral imagery data, aimed at enhancing monitoring capabilities. Developing robust uncertainty assessment methods is equally vital, as well as examining the applicability and transferability of models across diverse regions and contaminant types. An area of critical importance is assessing how effectively these predictive models inform policy-making, conservation efforts, and sustainable management plans. An additional line of exploration lies in harnessing sensor data and IoT technologies to enable real-time monitoring and prediction, thus fostering proactive water management.
One innovative approach lies in employing reinforcement learning—a type of machine learning where an agent learns to make decisions by interacting with its environment, earning rewards or penalties. This technique could lead to optimal policies for managing water resources and minimizing soil erosion under a wide array of conditions. The resultant policies could then guide decisions about water use, irrigation practices, land use planning, among other factors influencing soil erosion and water contamination.
Further, understanding and predicting the socio-economic impacts of water contamination and soil erosion using machine learning should also be considered. These impacts inform policy decisions and help prioritize mitigation efforts, which could involve creating models that predict the impact of different contamination and erosion levels on agricultural productivity, public health, and economic activity.
Lastly, the potential of using machine learning algorithms to automate real-time detection of water contaminants, directly from sensor data, is another promising research direction. This entails using machine learning techniques to process and interpret data from sensors that detect contaminants in water, ultimately enabling faster and more accurate responses to contamination events.
5.2. Forecasting Water Levels
The water level forecasting topic presents research opportunities in developing and comparing machine learning algorithms for predicting groundwater levels, water distribution, and potential maps. Studies demonstrate the use of support vector regression, convolution neural networks, extreme gradient boosting, and other machine learning techniques to analyze potential groundwater maps, groundwater depths, and lake levels.
The second intriguing research line relates to utilizing machine learning algorithms to improve water resource management, such as forecasting lake water levels, predicting irrigation water demand, and estimating groundwater levels in aquifers. Various machine learning models, like Minimax Probability Machine Regression, Gaussian Process Regression, Extreme Learning Machine, and artificial neural networks, are applied to forecast lake levels, estimate irrigation water demand, and predict groundwater levels for better water management strategies.
A third line of research is concerned with the noteworthy observation of the existence of numerous data sources which are often not integrated. For the enhancement of forecasting accuracy, it is proposed that these diverse data sources be amalgamated. This would enable the subsequent progression of machine learning models to predict floods and evaluate their severity. This unification would ease the analysis of various factors, encompassing weather patterns, soil moisture levels, river flow rates, and historical flood data, utilizing machine learning algorithms like Decision Trees, Random Forests, or deep learning networks. The paramount objective continues to be the improvement of the precision of flood forecasts, thereby providing communities with the tools necessary to better prepare for, and potentially alleviate, the impacts of such occurrences.
Finally, a four research line involves applying machine learning and remote sensing techniques to monitor and assess water quality, pollution, and eutrophication. This research aims to provide better insights into the sources and composition of dissolved organic matter in water bodies and evaluate the effectiveness of water protection measures or human disturbance effects on water quality and lake ecosystems. Studies develop models to derive parameters, such as the humification index, using machine learning methods like XGBoost, in combination with other remote sensing data.
5.3. Advanced Leak Detection in Water Networks
The leak detection topic presented encompasses various approaches and techniques for detecting and locating leaks in water distribution networks. These methods involve machine learning algorithms, wireless sensor networks, and transient modeling. Machine learning techniques include classifiers such as KNN, Decision Trees, neural networks, support vector machines, and Random Forests. Generally, these methods have demonstrated effectiveness in identifying and locating leaks across diverse scenarios, with varying levels of accuracy depending on the technique and the water distribution network’s characteristics. Employing these approaches can help tackle the issue of leaks in water distribution networks, consequently reducing economic losses and environmental impact.
Future research endeavors should prioritize the development of efficient machine learning methods for accurate and effective leak detection and localization in water networks. This task involves network zoning and the utilization of hybrid approaches, blending various techniques for optimal outcomes. A key part of this process is the innovation of sensor technology and data acquisition methods, leading to enhanced datasets and, consequently, more robust models. Considerations such as the materials used in pipes and the overall design of the network significantly influence these developments. Moreover, translating current research to real-world networks, integrating analytics with intelligent water management systems, and quantifying the socio-economic and environmental impacts of improved leak detection are vital steps forward.
Simultaneously, there is a notable gap in the integration of smart water technologies in leakage management, referring to the limited use of advanced technologies, such as sensors, data analytics, and machine learning for detecting and controlling leakages in water distribution systems. Despite their potential to enhance the efficiency and accuracy of leakage management, the adoption of these technologies is still in its nascent stages. Thus, further research is required to explore these smart water technologies’ potential in leakage management and develop effective strategies for their integration.
In addition, current leakage detection methods exhibit inadequate accuracy and reliability, suggesting limitations in the techniques employed in identifying leakages in water distribution systems. Current methods, such as acoustic, flow, and pressure sensors, suffer from constraints related to accuracy, sensitivity, and reliability. For example, acoustic sensors are susceptible to background noise, and flow sensors may fail to detect minor leaks. Such limitations can trigger false positives or negatives, leading to inefficient leakage management. Therefore, future research must focus on devising more accurate and reliable leakage detection methods, potentially involving the use of machine learning algorithms and data fusion techniques.
5.4. Assessing Water Quality and Potability
The field of water quality assessment and prediction stands to gain substantially from future research, particularly those focusing on leveraging the power of machine learning. As we consider the variety of algorithms and deep learning models, such as deep neural networks, gradient boosting machines, and XGBoost, we are able to significantly enhance our water quality monitoring systems. By integrating sensors, IoT technologies, 5G communication networks, and low-power sensors, we can augment real-time efficiency and accuracy.
Furthermore, a comprehensive assessment of water quality necessitates consideration of multiple factors, such as urbanization, climate change, and industrial activities. By combining machine learning algorithms and data analysis techniques, we can devise more effective strategies for water conservation and treatment.
Machine learning plays a crucial role in identifying and classifying various types of pollutants and waste in aquatic environments. This assessment, combined with an understanding of the impact on water quality and aquatic life, is key to preserving our ecosystems. In addition, the intersection of water quality and human health is an area of importance, where machine learning and data analysis can unveil patterns and trends in water-related diseases across different regions and communities.
Beyond these, the scope for research extends to the utilization of unsupervised machine learning techniques to uncover unknown contaminants or detect new patterns in water quality data. This could potentially expose unforeseen contamination sources or novel correlations between variables.
There is also scope for employing machine learning to enhance water treatment processes. This could encompass using machine learning to model the efficiency of different treatment methods under various conditions, or optimizing resource allocation in water treatment plants.
In addition, the exploration of integrating machine learning with cutting-edge technologies, such as nanotechnology and biotechnology, in the realm of water treatment and quality assessment, could be fruitful. These collaborations could facilitate innovative and more efficient methods of water decontamination.
In conclusion, the development of early warning systems employing machine learning algorithms and real-time sensor data holds promise in predicting and preventing water pollution events. This approach is essential in securing access to safe and sustainable drinking water for all, irrespective of their location in rural or urban areas.
6. Conclusions
In this study, a hybrid methodology has been employed. Firstly, the bidirectional encoder representation from transformers was used to identify topics in article abstracts obtained from Scopus. Subsequently, expert knowledge was relied upon to select relevant topics. This methodology successfully identified four areas of machine learning application in water management: Advancements in Machine Learning for Water Contaminants and Soil Erosion, Forecasting Water Levels, Advanced Leak Detection in Water Networks, and Assessing Water Quality and Potability. Leading journals in this research area have been identified as Science of the Total Environment, Journal of Hydrology, and Water Research.
Through the analysis of bigrams and traditional methods, classification models using key techniques such as RF, ANN, SVM, KNN, and convolutional networks have been found crucial for leak detection in water networks. These models focus on various methodologies, yielding promising results with up to 98–99% accuracy, significantly improving leak detection and management. In the topic of water level forecasting, machine learning techniques like SVR, CNN, GTB, and Random Forest have demonstrated their effectiveness in groundwater potential mapping, level prediction, and water quality management. These approaches enhance spatial predictions, address complex terrains, and monitor dissolved organic matter, contributing to sustainable groundwater management, peatland restoration strategies, and water safety amid urbanization and climate change.
Machine learning techniques such as CNN, LSTM, and Random Forest have proven successful in the topic of water quality and potability. These methods offer high precision and reduced processing time, enabling better water management, early warning systems, and support for decision-making in sustainable resource management. Machine learning techniques, like Random Forest and XGB, have demonstrated success in predicting groundwater nitrate concentrations and soil erosion susceptibility, as well as estimating heavy metal and nutrient levels in various regions. These models help identify at-risk areas and crucial contributing factors, informing sustainable management plans, soil conservation, and watershed protection. Such data-driven approaches offer valuable insights for addressing natural pollution problems and ensuring water quality.
To advance research in Water Infrastructure Integrity and Quality, it is essential to foster interdisciplinary collaboration among experts from various fields, create integrated frameworks that combine diverse machine learning models and techniques, and enhance data sources using remote sensing, hyperspectral imagery, and IoT technologies. Driving innovation through the development of advanced sensors, monitoring systems, and communication technologies will improve strategies for maintaining water infrastructure integrity and quality. Assessing and optimizing model transferability, measuring the impact of predictive models on policy-making and conservation efforts, and raising public awareness and education about challenges related to water infrastructure are crucial. Implementing pilot projects to test and validate new technologies in real-world scenarios and evaluating the socioeconomic and environmental effects of improved strategies will further support research and development. This pursuit of technological advancement in Water Infrastructure Integrity and Quality must also address the challenges and potentials within the field of machine learning itself.
While BERTopic enhances contextual understanding in topic modeling, it is not without limitations, such as potential biases in pre-trained models. Future research could delve into identifying these biases and developing strategies to mitigate them, perhaps through the inclusion of Large Language Models (LLMs) which offer diverse data training and nuanced language understanding. Additionally, conducting a comparative analysis with ML applications in other environmental domains could unveil unique insights and challenges specific to Water Infrastructure Integrity and Quality, enriching the context of our study. Moreover, it’s crucial to consider the broader technological, ethical, and social implications of employing ML in water infrastructure integrity and quality management. This encompasses not just the technological advancements but also their impact on policy, societal norms, and ethical considerations, especially in the face of global challenges like climate change and social equity. Such an exploration would provide a holistic view of the role of ML in this critical field and its potential to drive sustainable and equitable solutions for water infrastructure integrity and quality.
Finally, in our current study, we have exclusively worked with data from the Scopus database, but in future analyses, we are considering an integration with the Web of Science (WoS). This forward step presents notable challenges, particularly in terms of compatibility of the data attributes that can be exported from each database. A significant consideration in our work is that, in the specific area addressed in this article, there is a substantial intersection in journal coverage between Scopus and WoS. However, this level of overlap does not necessarily hold in other areas of study, posing an intriguing challenge in terms of how to effectively integrate these different sources without significantly compromising the bibliographic analyses. Our aim will be to develop methodologies that allow for this integration, maintaining the quality and depth of our analyses, while simultaneously enriching our results with broader and varied perspectives from multiple prestigious academic databases.
Author Contributions
Conceptualization, J.G. and A.L.-A.; methodology, J.G. and H.P.; software, J.G. and E.D.-S.; validation, P.M., V.Y. and H.P.; formal analysis, J.G.; investigation, J.G., A.L.-A. and E.D.-S.; resources, J.G.; writing—original draft preparation, J.G.; writing—review and editing, V.Y. and H.P.; project administration, P.M.; funding acquisition, J.G. All authors have read and agreed to the published version of the manuscript.
Funding
Víctor Yepes is supported by Grant PID2020-117056RB-I00 funded by MCIN/AEI/10.13039/501100011033 and by ERDF A way of making Europe.
Data Availability Statement
The data presented in this study are available in article.
Conflicts of Interest
The authors declare no conflict of interest.
References
- Hanjra, M.A.; Blackwell, J.; Carr, G.; Zhang, F.; Jackson, T.M. Wastewater irrigation and environmental health: Implications for water governance and public policy. Int. J. Hyg. Environ. Health 2012, 215, 255–269. [Google Scholar] [CrossRef]
- Green, T.R.; Taniguchi, M.; Kooi, H.; Gurdak, J.J.; Allen, D.M.; Hiscock, K.M.; Treidel, H.; Aureli, A. Beneath the surface of global change: Impacts of climate change on groundwater. J. Hydrol. 2011, 405, 532–560. [Google Scholar] [CrossRef]
- Koop, S.H.; van Leeuwen, C.J. Assessment of the sustainability of water resources management: A critical review of the city blueprint approach. Water Resour. Manag. 2015, 29, 5649–5670. [Google Scholar] [CrossRef]
- Marques, A.C.; Veras, C.E.; Rodriguez, D.A. Assessment of water policies contributions for sustainable water resources management under climate change scenarios. J. Hydrol. 2022, 608, 127690. [Google Scholar] [CrossRef]
- Ferreira, D.C.; Graziele, I.; Marques, R.C.; Gonçalves, J. Investment in drinking water and sanitation infrastructure and its impact on waterborne diseases dissemination: The Brazilian case. Sci. Total Environ. 2021, 779, 146279. [Google Scholar] [CrossRef] [PubMed]
- Hussain, M.I.; Muscolo, A.; Farooq, M.; Ahmad, W. Sustainable use and management of non-conventional water resources for rehabilitation of marginal lands in arid and semiarid environments. Agric. Water Manag. 2019, 221, 462–476. [Google Scholar] [CrossRef]
- Wu, B.; Tian, F.; Zhang, M.; Piao, S.; Zeng, H.; Zhu, W.; Liu, J.; Elnashar, A.; Lu, Y. Quantifying global agricultural water appropriation with data derived from earth observations. J. Clean. Prod. 2022, 358, 131891. [Google Scholar] [CrossRef]
- Gao, M.; Zhu, L.; Peh, C.K.; Ho, G.W. Solar absorber material and system designs for photothermal water vaporization towards clean water and energy production. Energy Environ. Sci. 2019, 12, 841–864. [Google Scholar] [CrossRef]
- Mishra, R.; Dubey, S. Fresh water availability and it’s global challenge. Br. J. Multidiscip. Adv. Stud. 2023, 4, 1–78. [Google Scholar] [CrossRef]
- Sohail, M.; Mustafa, S.; Ali, M.; Riaz, S. Agricultural communities’ risk assessment and the effects of climate change: A pathway toward green productivity and sustainable development. Front. Environ. Sci. 2023, 10, 948016. [Google Scholar] [CrossRef]
- Khan, H.F.; Arshad, S.A. Beyond water scarcity: Water (in) security and social justice in Karachi. J. Hydrol. Reg. Stud. 2022, 42, 101140. [Google Scholar] [CrossRef]
- Ajith, J.B.; Manimegalai, R.; Ilayaraja, V. An IoT based smart water quality monitoring system using cloud. In Proceedings of the 2020 International Conference on Emerging Trends in Information Technology and Engineering (ic-ETITE), Vellore, India, 24–25 February 2020; pp. 1–7. [Google Scholar]
- Panigrahi, N.; Patro, S.; Kumar, R.; Omar, M.; Ngan, T.T.; Giang, N.L.; Thu, B.T.; Thang, N.T. Groundwater Quality Analysis and Drinkability Prediction using Artificial Intelligence. Earth Sci. Inform. 2023, 16, 1701–1725. [Google Scholar] [CrossRef]
- Xu, Z.; Lv, Z.; Li, J.; Shi, A. A novel approach for predicting water demand with complex patterns based on ensemble learning. Water Resour. Manag. 2022, 36, 4293–4312. [Google Scholar] [CrossRef]
- Ayati, A.H.; Haghighi, A.; Ghafouri, H.R. Machine Learning–Assisted Model for Leak Detection in Water Distribution Networks Using Hydraulic Transient Flows. J. Water Resour. Plan. Manag. 2022, 148, 04021104. [Google Scholar] [CrossRef]
- Hofmann, T. Unsupervised learning by probabilistic latent semantic analysis. Mach. Learn. 2001, 42, 177. [Google Scholar] [CrossRef]
- Blei, D.M.; Ng, A.Y.; Jordan, M.I. Latent dirichlet allocation. J. Mach. Learn. Res. 2003, 3, 993–1022. [Google Scholar]
- Lee, D.D.; Seung, H.S. Learning the parts of objects by non-negative matrix factorization. Nature 1999, 401, 788–791. [Google Scholar] [CrossRef] [PubMed]
- Arora, S.; Ge, R.; Moitra, A. Learning topic models–going beyond SVD. In Proceedings of the 2012 IEEE 53rd Annual Symposium on Foundations of Computer Science, New Brunswick, NJ, USA, 20–23 October 2012; pp. 1–10. [Google Scholar]
- Grootendorst, M. BERTopic: Neural topic modeling with a class-based TF-IDF procedure. arXiv 2022, arXiv:2203.05794. [Google Scholar]
- Garcia, J.; Villavicencio, G.; Altimiras, F.; Crawford, B.; Soto, R.; Minatogawa, V.; Franco, M.; Martínez-Muñoz, D.; Yepes, V. Machine learning techniques applied to construction: A hybrid bibliometric analysis of advances and future directions. Autom. Constr. 2022, 142, 104532. [Google Scholar] [CrossRef]
- Devlin, J.; Chang, M.W.; Lee, K.; Toutanova, K. Bert: Pre-training of deep bidirectional transformers for language understanding. arXiv 2018, arXiv:1810.04805. [Google Scholar]
- McInnes, L.; Healy, J.; Melville, J. Umap: Uniform manifold approximation and projection for dimension reduction. arXiv 2018, arXiv:1802.03426. [Google Scholar]
- Campello, R.J.; Moulavi, D.; Sander, J. Density-based clustering based on hierarchical density estimates. In Proceedings of the Advances in Knowledge Discovery and Data Mining: 17th Pacific-Asia Conference, PAKDD 2013, Gold Coast, Australia, 14–17 April 2013; Proceedings, Part II 17. Springer: Berlin/Heidelberg, Germany, 2013; pp. 160–172. [Google Scholar]
- Aria, M.; Cuccurullo, C. bibliometrix: An R-tool for comprehensive science mapping analysis. J. Inf. 2017, 11, 959–975. [Google Scholar] [CrossRef]
- Grivel, L.; Mutschke, P.; Polanco, X. Thematic mapping on bibliographic databases by cluster analysis: A description of the sdoc environment with solis. Knowl. Organ. 1995, 22, 70–77. [Google Scholar]
- López-Fernández, M.C.; Serrano-Bedia, A.M.; Pérez-Pérez, M. Entrepreneurship and family firm research: A bibliometric analysis of an emerging field. J. Small Bus. Manag. 2016, 54, 622–639. [Google Scholar] [CrossRef]
- Bradford, S.C. Sources of information on specific subjects. Engineering 1934, 137, 85–86. [Google Scholar]
- Rao, P.; Wang, Y.; Liu, Y.; Wang, X.; Hou, Y.; Pan, S.; Wang, F.; Zhu, D. A comparison of multiple methods for mapping groundwater levels in the Mu Us Sandy Land, China. J. Hydrol. Reg. Stud. 2022, 43, 101189. [Google Scholar] [CrossRef]
- Zhu, X.X.; Tuia, D.; Mou, L.; Xia, G.S.; Zhang, L.; Xu, F.; Fraundorfer, F. Deep learning in remote sensing: A comprehensive review and list of resources. IEEE Geosci. Remote Sens. Mag. 2017, 5, 8–36. [Google Scholar] [CrossRef]
- Li, X.; Sha, J.; Wang, Z.L. Comparison of daily streamflow forecasts using extreme learning machines and the Random Forest method. Hydrol. Sci. J. 2019, 64, 1857–1866. [Google Scholar] [CrossRef]
- Schütze, H.; Manning, C.D.; Raghavan, P. Introduction to Information Retrieval; Cambridge University Press: Cambridge, UK, 2008. [Google Scholar]
- Jurafsky, D.; Martin, J.H. Speech and Language Processing, 3rd ed.; Stanford University: Stanford, CA, USA, 2019. [Google Scholar]
- Knoll, L.; Breuer, L.; Bach, M. Large scale prediction of groundwater nitrate concentrations from spatial data using machine learning. Sci. Total Environ. 2019, 668, 1317–1327. [Google Scholar] [CrossRef]
- Garosi, Y.; Sheklabadi, M.; Conoscenti, C.; Pourghasemi, H.R.; Van Oost, K. Assessing the performance of GIS-based machine learning models with different accuracy measures for determining susceptibility to gully erosion. Sci. Total Environ. 2019, 664, 1117–1132. [Google Scholar] [CrossRef]
- Tan, K.; Ma, W.; Chen, L.; Wang, H.; Du, Q.; Du, P.; Yan, B.; Liu, R.; Li, H. Estimating the distribution trend of soil heavy metals in mining area from HyMap airborne hyperspectral imagery based on ensemble learning. J. Hazard. Mater. 2021, 401, 123288. [Google Scholar] [CrossRef]
- Mosavi, A.; Sajedi-Hosseini, F.; Choubin, B.; Taromideh, F.; Rahi, G.; Dineva, A.A. Susceptibility mapping of soil water erosion using machine learning models. Water 2020, 12, 1995. [Google Scholar] [CrossRef]
- Mukherjee, A.; Sarkar, S.; Chakraborty, M.; Duttagupta, S.; Bhattacharya, A.; Saha, D.; Bhattacharya, P.; Mitra, A.; Gupta, S. Occurrence, predictors and hazards of elevated groundwater arsenic across India through field observations and regional-scale AI-based modeling. Sci. Total Environ. 2021, 759, 143511. [Google Scholar] [CrossRef] [PubMed]
- Chakraborty, M.; Sarkar, S.; Mukherjee, A.; Shamsudduha, M.; Ahmed, K.M.; Bhattacharya, A.; Mitra, A. Modeling regional-scale groundwater arsenic hazard in the transboundary Ganges River Delta, India and Bangladesh: Infusing physically-based model with machine learning. Sci. Total Environ. 2020, 748, 141107. [Google Scholar] [CrossRef] [PubMed]
- Knoll, L.; Breuer, L.; Bach, M. Nation-wide estimation of groundwater redox conditions and nitrate concentrations through machine learning. Environ. Res. Lett. 2020, 15, 064004. [Google Scholar] [CrossRef]
- Harrison, J.W.; Lucius, M.A.; Farrell, J.L.; Eichler, L.W.; Relyea, R.A. Prediction of stream nitrogen and phosphorus concentrations from high-frequency sensors using Random Forests Regression. Sci. Total Environ. 2021, 763, 143005. [Google Scholar] [CrossRef]
- Messier, K.P.; Kane, E.; Bolich, R.; Serre, M.L. Nitrate variability in groundwater of North Carolina using monitoring and private well data models. Environ. Sci. Technol. 2014, 48, 10804–10812. [Google Scholar] [CrossRef]
- Messier, K.P.; Wheeler, D.C.; Flory, A.R.; Jones, R.R.; Patel, D.; Nolan, B.T.; Ward, M.H. Modeling groundwater nitrate exposure in private wells of North Carolina for the Agricultural Health Study. Sci. Total Environ. 2019, 655, 512–519. [Google Scholar] [CrossRef]
- Ransom, K.M.; Nolan, B.T.; Stackelberg, P.; Belitz, K.; Fram, M.S. Machine learning predictions of nitrate in groundwater used for drinking supply in the conterminous United States. Sci. Total Environ. 2022, 807, 151065. [Google Scholar] [CrossRef]
- Podgorski, J.; Araya, D.; Berg, M. Geogenic manganese and iron in groundwater of Southeast Asia and Bangladesh–Machine learning spatial prediction modeling and comparison with arsenic. Sci. Total Environ. 2022, 833, 155131. [Google Scholar] [CrossRef]
- Kwon, S.; Seo, I.W.; Noh, H.; Kim, B. Hyperspectral retrievals of suspended sediment using cluster-based machine learning regression in shallow waters. Sci. Total Environ. 2022, 833, 155168. [Google Scholar] [CrossRef] [PubMed]
- Giri, S.; Kang, Y.; MacDonald, K.; Tippett, M.; Qiu, Z.; Lathrop, R.G.; Obropta, C.C. Revealing the sources of arsenic in private well water using Random Forest Classification and Regression. Sci. Total Environ. 2023, 857, 159360. [Google Scholar] [CrossRef] [PubMed]
- Alygizakis, N.; Giannakopoulos, T.; Thomaidis, N.S.; Slobodnik, J. Detecting the sources of chemicals in the Black Sea using non-target screening and deep learning convolutional neural networks. Sci. Total Environ. 2022, 847, 157554. [Google Scholar] [CrossRef] [PubMed]
- Raheja, H.; Goel, A.; Pal, M. Prediction of groundwater quality indices using machine learning algorithms. Water Pract. Technol. 2022, 17, 336–351. [Google Scholar] [CrossRef]
- Alipio, M.I. Data-driven IoT-based water quality monitoring and potability classification system in rural areas. In Proceedings of the 2020 International Conference on Information and Communication Technology Convergence (ICTC), Jeju, Republic of Korea, 21–23 October 2020; pp. 634–639. [Google Scholar]
- Riyantoko, P.A.; Sugiarto; Diyasa, I.G.S.M.; Kraugusteeliana. “FQAM” Feyn-QLattice Automation Modelling: Python Module of Machine Learning for Data Classification in Water Potability. In Proceedings of the 2021 International Conference on Informatics, Multimedia, Cyber and Information System (ICIMCIS), Jakarta, Indonesia, 28–29 October 2021; pp. 135–141. [Google Scholar]
- Yusuf, H.; Alhaddad, S.; Yusuf, S.; Hewahi, N. Classification of Water Potability Using Machine Learning Algorithms. In Proceedings of the 2022 International Conference on Data Analytics for Business and Industry (ICDABI), Sakhir, Bahrain, 25–26 October 2022; pp. 454–458. [Google Scholar]
- Priyadarshini, I.; Alkhayyat, A.; Obaid, A.J.; Sharma, R. Water pollution reduction for sustainable urban development using machine learning techniques. Cities 2022, 130, 103970. [Google Scholar] [CrossRef]
- Rivas-Villar, D.; Rouco, J.; Carballeira, R.; Penedo, M.G.; Novo, J. Fully automatic detection and classification of phytoplankton specimens in digital microscopy images. Comput. Methods Programs Biomed. 2021, 200, 105923. [Google Scholar] [CrossRef]
- Alipio, M.I. Towards developing a classification model for water potability in Philippine rural areas. ASEAN Eng. J. 2020, 10, 24–34. [Google Scholar] [CrossRef]
- Dalal, S.; Onyema, E.M.; Romero, C.A.T.; Ndufeiya-Kumasi, L.C.; Maryann, D.C.; Nnedimkpa, A.J.; Bhatia, T.K. Machine learning-based forecasting of potability of drinking water through adaptive boosting model. Open Chem. 2022, 20, 816–828. [Google Scholar] [CrossRef]
- Alomani, S.M.; Alhawiti, N.I.; Alhakamy, A. Prediction of Quality of Water According to a Random Forest Classifier. Int. J. Adv. Comput. Sci. Appl. 2022, 13, 892–899. [Google Scholar] [CrossRef]
- Haq, M.I.K.; Ramadhan, F.D.; Az-Zahra, F.; Kurniawati, L.; Helen, A. Classification of water potability using machine learning algorithms. In Proceedings of the 2021 International Conference on Artificial Intelligence and Big Data Analytics, Bandung, Indonesia, 27–29 October 2021; pp. 1–5. [Google Scholar]
- He, S.; Wu, J.; Wang, D.; He, X. Predictive modeling of groundwater nitrate pollution and evaluating its main impact factors using Random Forest. Chemosphere 2022, 290, 133388. [Google Scholar] [CrossRef]
- Kouadri, S.; Pande, C.B.; Panneerselvam, B.; Moharir, K.N.; Elbeltagi, A. Prediction of irrigation groundwater quality parameters using ANN, LSTM, and MLR models. Environ. Sci. Pollut. Res. 2021, 29, 21067–21091. [Google Scholar] [CrossRef] [PubMed]
- Sun, X.; Zhang, Y.; Shi, K.; Zhang, Y.; Li, N.; Wang, W.; Huang, X.; Qin, B. Monitoring water quality using proximal remote sensing technology. Sci. Total Environ. 2022, 803, 149805. [Google Scholar] [CrossRef]
- Xu, X.; Liu, Y.; Liu, S.; Li, J.; Guo, G.; Smith, K. Real-time detection of potable-reclaimed water pipe cross-connection events by conventional water quality sensors using machine learning methods. J. Environ. Manag. 2019, 238, 201–209. [Google Scholar] [CrossRef]
- Cao, Q.; Yu, G.; Qiao, Z. Application and recent progress of inland water monitoring using remote sensing techniques. Environ. Monit. Assess. 2023, 195, 1–16. [Google Scholar] [CrossRef] [PubMed]
- Ahmed, S.; Mahzabin, M.; Shahpar, S.; Tonni, S.I.; Rahman, M.S. Assessment of Water Quality in Smart City Environment Leveraging ML-IoT. In Proceedings of the International Conference on Fourth Industrial Revolution and Beyond 2021; Springer: Berlin/Heidelberg, Germany, 2022; pp. 215–227. [Google Scholar]
- Zai, C.; El Mechal, C.; El Amrani El Idrissi, N.; Ghennioui, H. Prediction of Water Quality Using Artificial Intelligence (AI) and Statistical Approach. In Proceedings of the Digital Technologies and Applications: Proceedings of ICDTA’22, Fez, Morocco, 28–30 January 2022; Volume 1, pp. 34–42. [Google Scholar]
- Bajpai, A.; Chaubey, S.; Patro, B.; Verma, A. A Real-Time Approach to Classify the Water Quality of the River Ganga at Mehandi Ghat, Kannuaj. In Proceedings of the 2022 IEEE International Conference on Artificial Intelligence in Engineering and Technology (IICAIET), Kota Kinabalu, Malaysia, 13–15 September 2022; pp. 1–6. [Google Scholar]
- Chafloque, R.; Rodriguez, C.; Pomachagua, Y.; Hilario, M. Predictive Neural Networks Model for Detection of Water Quality for Human Consumption. In Proceedings of the 2021 13th International Conference on Computational Intelligence and Communication Networks (CICN), Lima, Peru, 22–23 September 2021; pp. 172–176. [Google Scholar]
- El-Attar, N.E.; Lotfy, H.R.; Awad, W.A. Performance of Artificial Intelligence Models in Analysis and Prediction of Water Potability. In Proceedings of the 2022 International Telecommunications Conference (ITC-Egypt), Alexandria, Egypt, 26–28 July 2022; pp. 1–6. [Google Scholar]
- Panahi, M.; Sadhasivam, N.; Pourghasemi, H.R.; Rezaie, F.; Lee, S. Spatial prediction of groundwater potential mapping based on convolutional neural network (CNN) and support vector regression (SVR). J. Hydrol. 2020, 588, 125033. [Google Scholar] [CrossRef]
- Bonakdari, H.; Ebtehaj, I.; Samui, P.; Gharabaghi, B. Lake water-level fluctuations forecasting using minimax probability machine regression, relevance vector machine, Gaussian process regression, and extreme learning machine. Water Resour. Manag. 2019, 33, 3965–3984. [Google Scholar] [CrossRef]
- Páliz Larrea, P.; Zapata-Ríos, X.; Campozano Parra, L. Application of neural network models and ANFIS for water level forecasting of the Salve Faccha Dam in the Andean Zone in Northern Ecuador. Water 2021, 13, 2011. [Google Scholar] [CrossRef]
- Truong, V.H.; Ly, Q.V.; Le, V.C.; Vu, T.B.; Le, T.T.T.; Tran, T.T.; Goethals, P. Machine learning-based method for forecasting water levels in irrigation and drainage systems. Environ. Technol. Innov. 2021, 23, 101762. [Google Scholar] [CrossRef]
- Hikouei, I.S.; Eshleman, K.N.; Saharjo, B.H.; Graham, L.L.; Applegate, G.; Cochrane, M.A. Using machine learning algorithms to predict groundwater levels in Indonesian tropical peatlands. Sci. Total Environ. 2023, 857, 159701. [Google Scholar] [CrossRef]
- Emami, M.; Ahmadi, A.; Daccache, A.; Nazif, S.; Mousavi, S.F.; Karami, H. County-level irrigation water demand estimation using machine learning: Case study of California. Water 2022, 14, 1937. [Google Scholar] [CrossRef]
- Oliveira, L.C.d.; Santos, C.A.G.; de Farias, C.A.S.; da Silva, R.M.; Singh, V.P. Predicting Groundwater Levels in Ogallala Aquifer Wells Using Hierarchical Cluster Analysis and artificial neural networks. J. Hydrol. Eng. 2023, 28, 04022042. [Google Scholar] [CrossRef]
- Shang, Y.; Song, K.; Lai, F.; Lyu, L.; Liu, G.; Fang, C.; Hou, J.; Qiang, S.; Yu, X.; Wen, Z. Remote sensing of fluorescent humification levels and its potential environmental linkages in lakes across China. Water Res. 2023, 230, 119540. [Google Scholar] [CrossRef] [PubMed]
- Demir, V.; Yaseen, Z.M. Neurocomputing intelligence models for lakes water level forecasting: A comprehensive review. Neural Comput. Appl. 2023, 35, 303–343. [Google Scholar] [CrossRef]
- Hu, X.; Han, Y.; Yu, B.; Geng, Z.; Fan, J. Novel leakage detection and water loss management of urban water supply network using multiscale neural networks. J. Clean. Prod. 2021, 278, 123611. [Google Scholar] [CrossRef]
- Bohorquez, J.; Alexander, B.; Simpson, A.R.; Lambert, M.F. Leak detection and topology identification in pipelines using fluid transients and artificial neural networks. J. Water Resour. Plan. Manag. 2020, 146, 04020040. [Google Scholar] [CrossRef]
- Liu, Y.; Ma, X.; Li, Y.; Tie, Y.; Zhang, Y.; Gao, J. Water pipeline leakage detection based on machine learning and wireless sensor networks. Sensors 2019, 19, 5086. [Google Scholar] [CrossRef]
- Sun, C.; Parellada, B.; Puig, V.; Cembrano, G. Leak localization in water distribution networks using pressure and data-driven classifier approach. Water 2019, 12, 54. [Google Scholar] [CrossRef]
- Guo, G.; Yu, X.; Liu, S.; Ma, Z.; Wu, Y.; Xu, X.; Wang, X.; Smith, K.; Wu, X. Leakage detection in water distribution systems based on time–frequency convolutional neural network. J. Water Resour. Plan. Manag. 2021, 147, 04020101. [Google Scholar] [CrossRef]
- Ravichandran, T.; Gavahi, K.; Ponnambalam, K.; Burtea, V.; Mousavi, S.J. Ensemble-based machine learning approach for improved leak detection in water mains. J. Hydroinform. 2021, 23, 307–323. [Google Scholar] [CrossRef]
- Butterfield, J.D.; Meyers, G.; Meruane, V.; Collins, R.P.; Beck, S.B. Experimental investigation into techniques to predict leak shapes in water distribution systems using vibration measurements. J. Hydroinform. 2018, 20, 815–828. [Google Scholar] [CrossRef]
- Fereidooni, Z.; Tahayori, H.; Bahadori-Jahromi, A. A hybrid model-based method for leak detection in large scale water distribution networks. J. Ambient Intell. Humaniz. Comput. 2021, 12, 1613–1629. [Google Scholar] [CrossRef]
- Chen, J.; Feng, X.; Xiao, S. An iterative method for leakage zone identification in water distribution networks based on machine learning. Struct. Health Monit. 2021, 20, 1938–1956. [Google Scholar] [CrossRef]
- Levinas, D.; Perelman, G.; Ostfeld, A. Water leak localization using high-resolution pressure sensors. Water 2021, 13, 591. [Google Scholar] [CrossRef]
- Alves Coelho, J.; Glória, A.; Sebastião, P. Precise water leak detection using machine learning and real-time sensor data. IoT 2020, 1, 474–493. [Google Scholar] [CrossRef]
- Tariq, S.; Bakhtawar, B.; Zayed, T. Data-driven application of MEMS-based accelerometers for leak detection in water distribution networks. Sci. Total Environ. 2022, 809, 151110. [Google Scholar] [CrossRef]
- Cantos, W.P.; Juran, I.; Tinelli, S. Machine-learning–based risk assessment method for leak detection and geolocation in a water distribution system. J. Infrastruct. Syst. 2020, 26, 04019039. [Google Scholar] [CrossRef]
- Mysorewala, M.F.; Cheded, L.; Ali, I.M. Leak detection using flow-induced vibrations in pressurized wall-mounted water pipelines. IEEE Access 2020, 8, 188673–188687. [Google Scholar]
- Mashhadi, N.; Shahrour, I.; Attoue, N.; El Khattabi, J.; Aljer, A. Use of machine learning for leak detection and localization in water distribution systems. Smart Cities 2021, 4, 1293–1315. [Google Scholar] [CrossRef]
- Tijani, I.; Abdelmageed, S.; Fares, A.; Fan, K.; Hu, Z.; Zayed, T. Improving the leak detection efficiency in water distribution networks using noise loggers. Sci. Total Environ. 2022, 821, 153530. [Google Scholar] [CrossRef]
- Chen, J.; Tang, P.; Rakstad, T.; Patrick, M.; Zhou, X. Augmenting a deep-learning algorithm with canal inspection knowledge for reliable water leak detection from multispectral satellite images. Adv. Eng. Inform. 2020, 46, 101161. [Google Scholar] [CrossRef]
- Yu, T.; Chen, X.; Yan, W.; Xu, Z.; Ye, M. Leak detection in water distribution systems by classifying vibration signals. Mech. Syst. Signal Process. 2023, 185, 109810. [Google Scholar] [CrossRef]
- Vanijjirattikhan, R.; Khomsay, S.; Kitbutrawat, N.; Khomsay, K.; Supakchukul, U.; Udomsuk, S.; Suwatthikul, J.; Oumtrakul, N.; Anusart, K. AI-based acoustic leak detection in water distribution systems. Results Eng. 2022, 15, 100557. [Google Scholar] [CrossRef]
- Bykerk, L.; Valls Miro, J. Detection of Water Leaks in Suburban Distribution Mains with Lift and Shift Vibro-Acoustic Sensors. Vibration 2022, 5, 370–382. [Google Scholar] [CrossRef]
- Gupta, A.; Kulat, K. A selective literature review on leak management techniques for water distribution system. Water Resour. Manag. 2018, 32, 3247–3269. [Google Scholar] [CrossRef]
- Kammoun, M.; Kammoun, A.; Abid, M. LSTM-AE-WLDL: Unsupervised LSTM Auto-Encoders for Leak Detection and Location in Water Distribution Networks. Water Resour. Manag. 2023, 37, 731–746. [Google Scholar] [CrossRef]
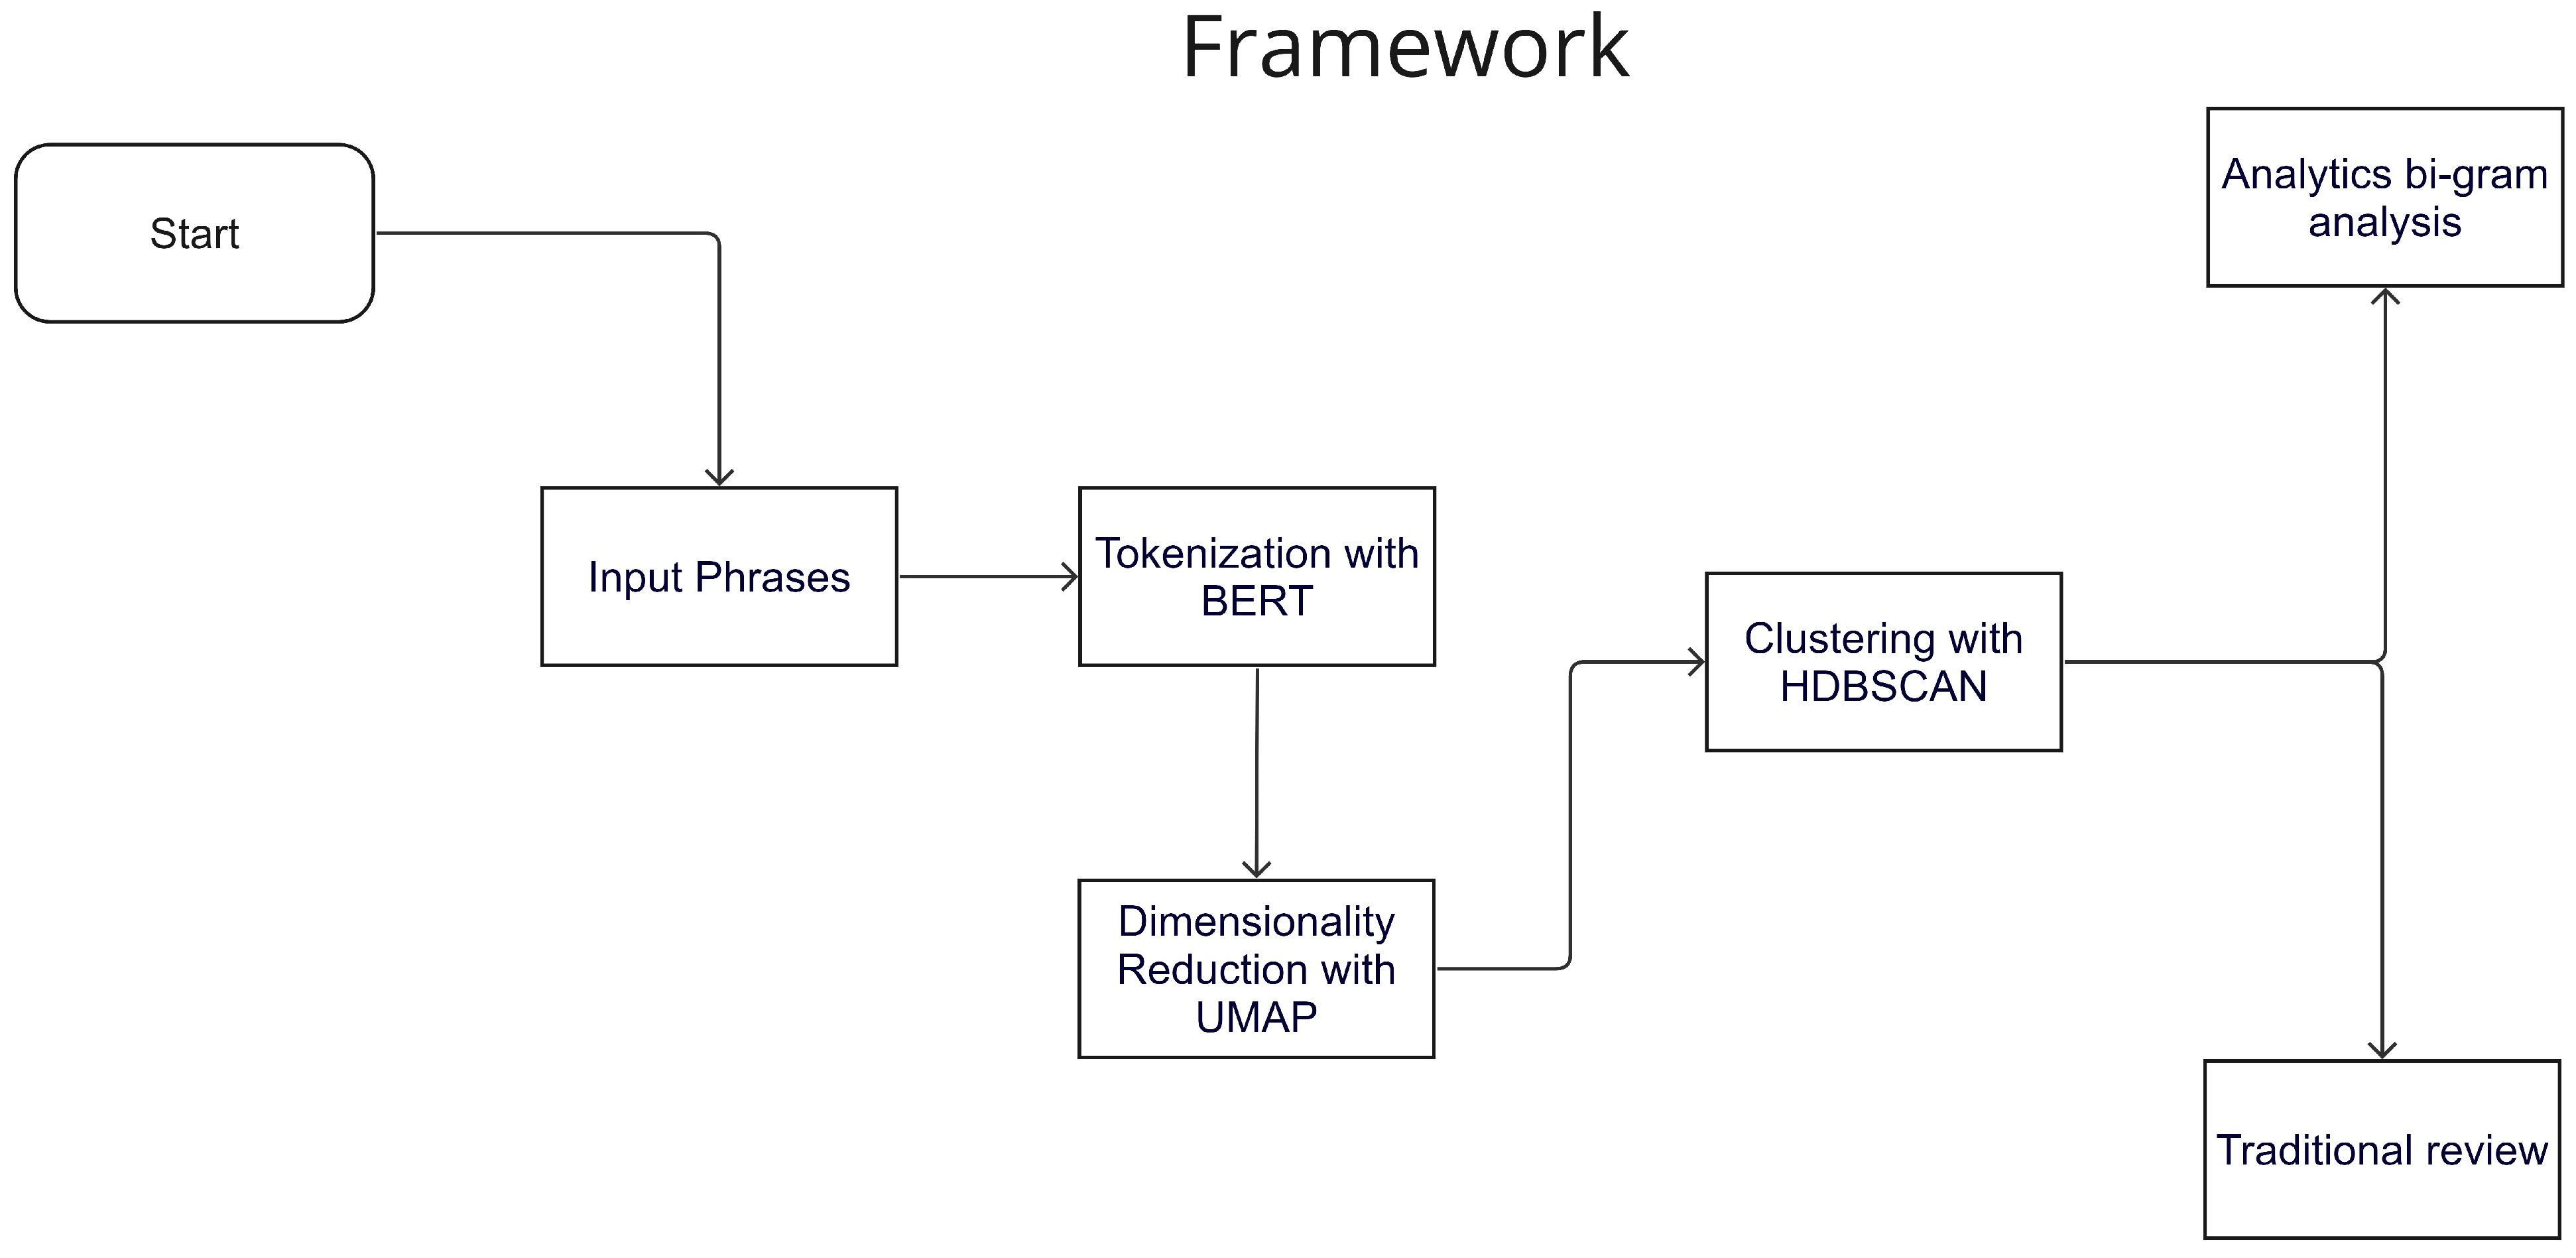
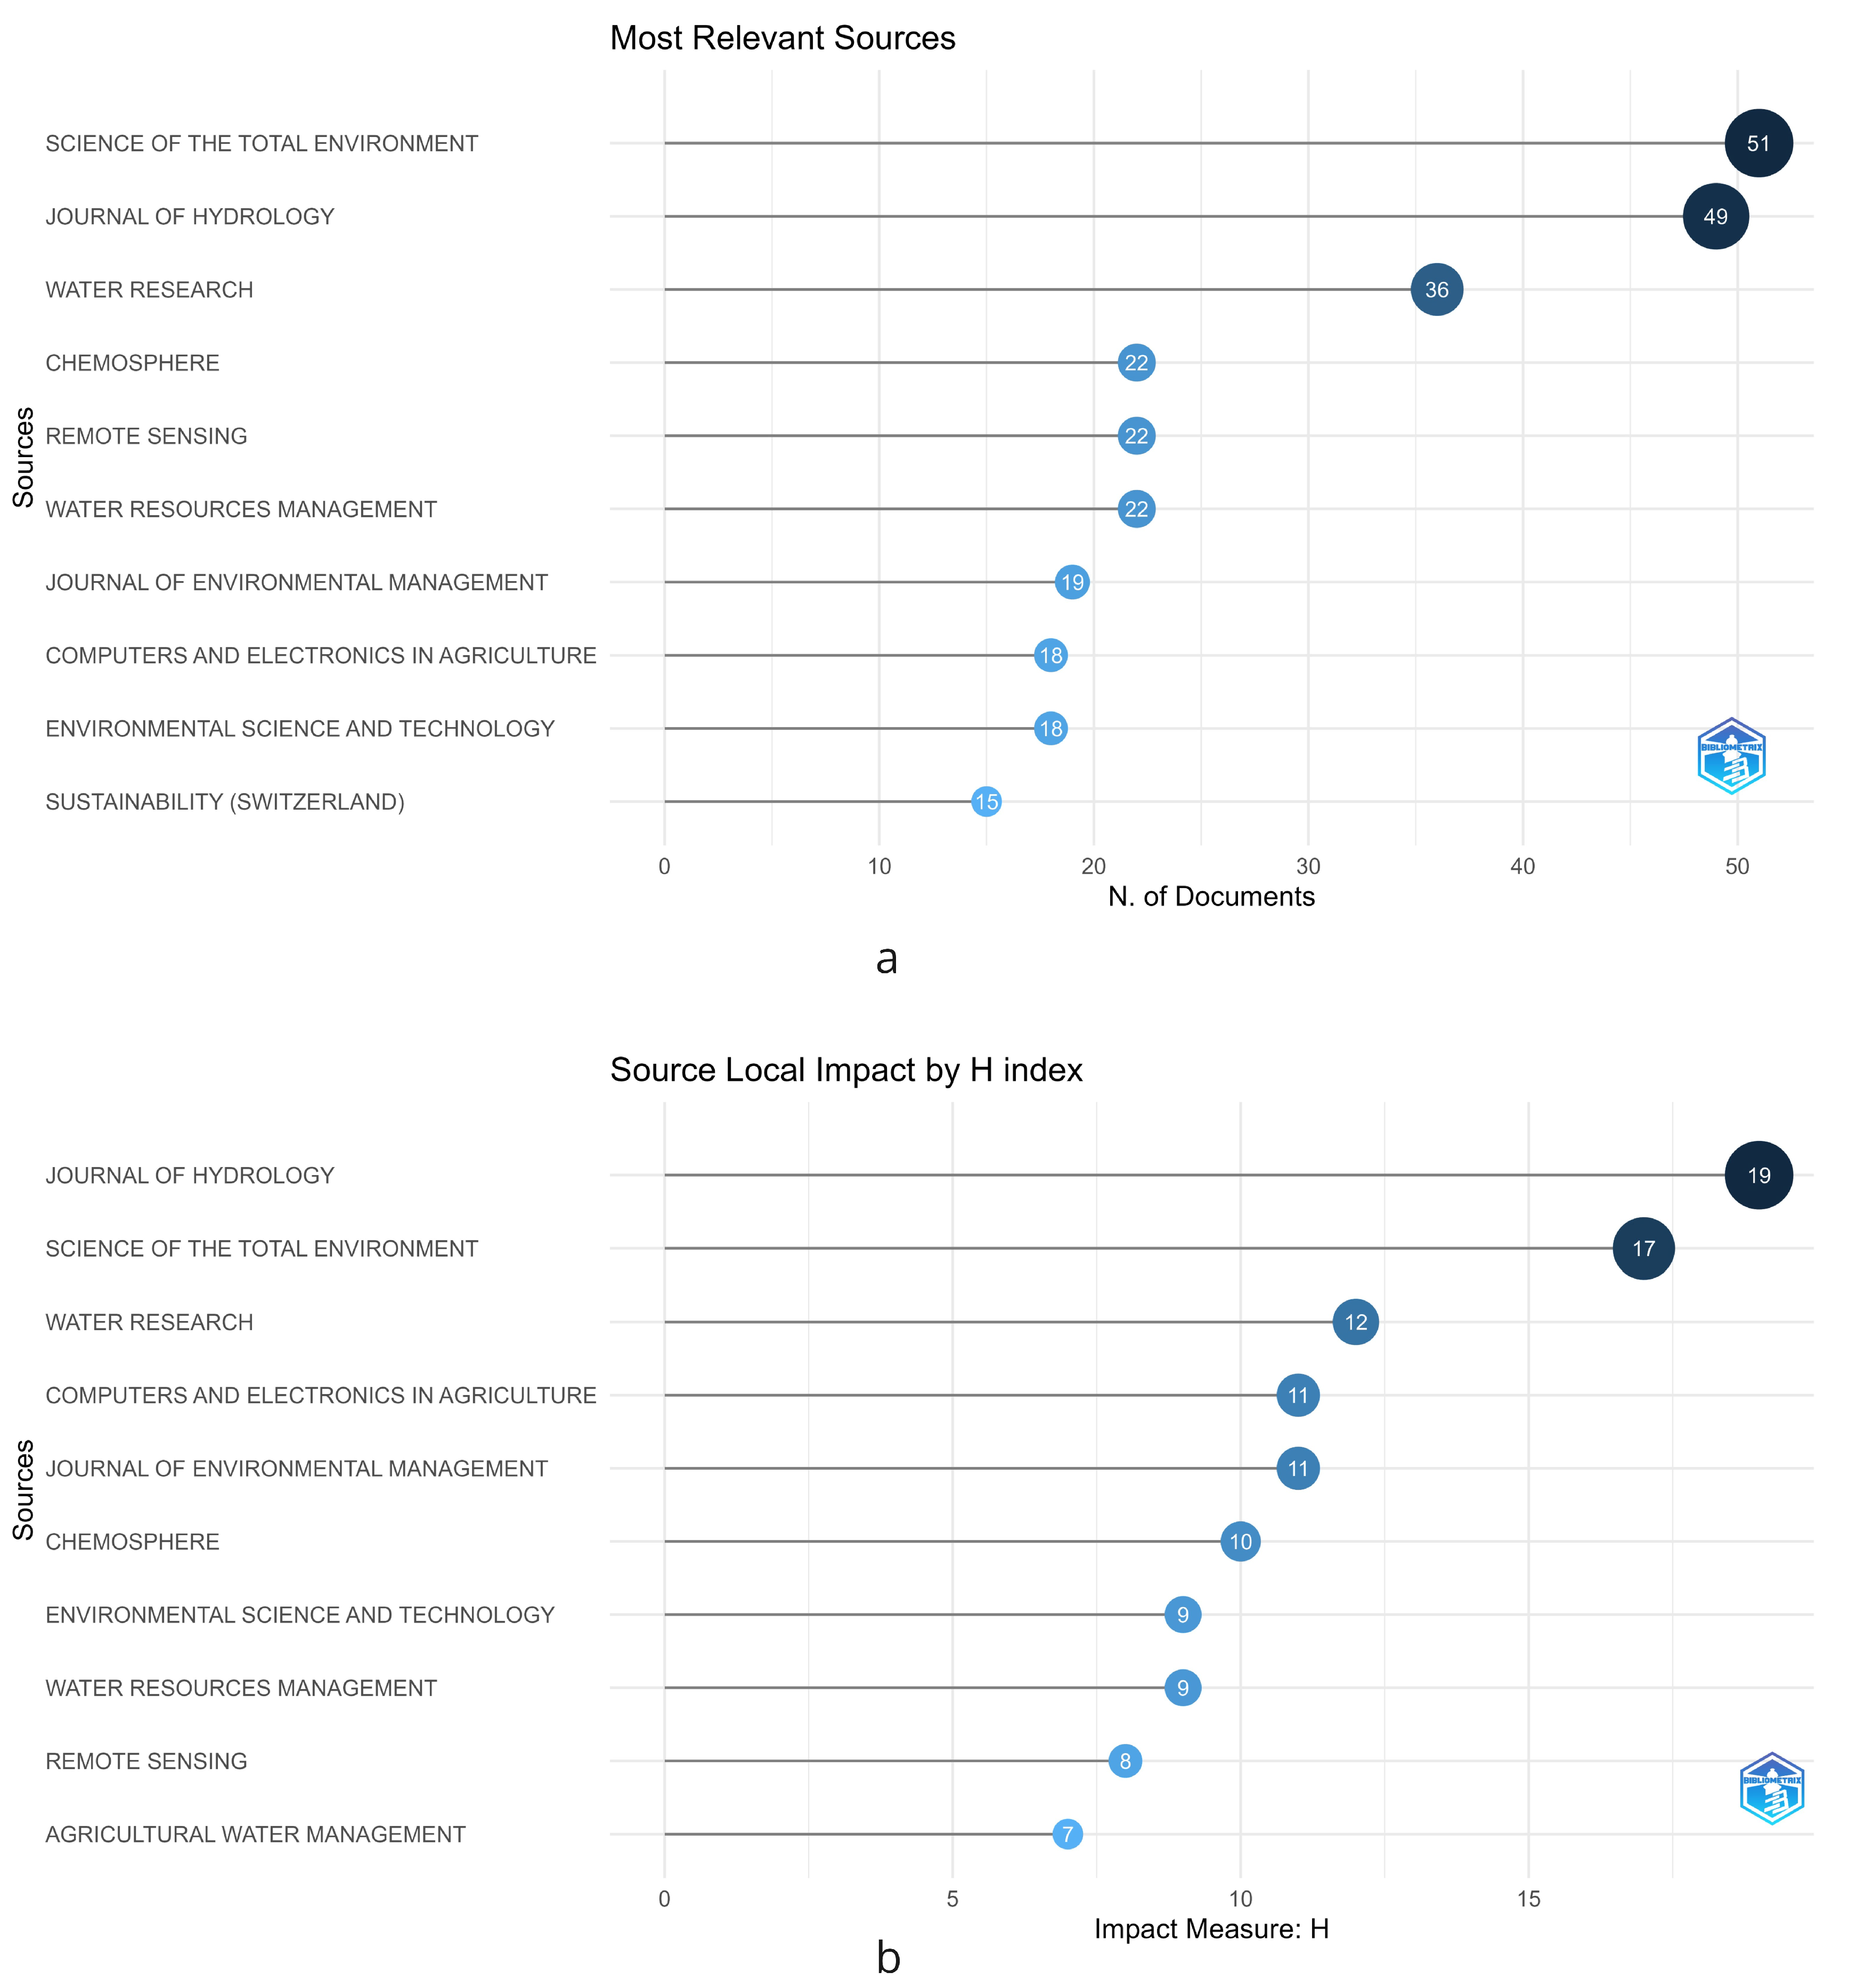
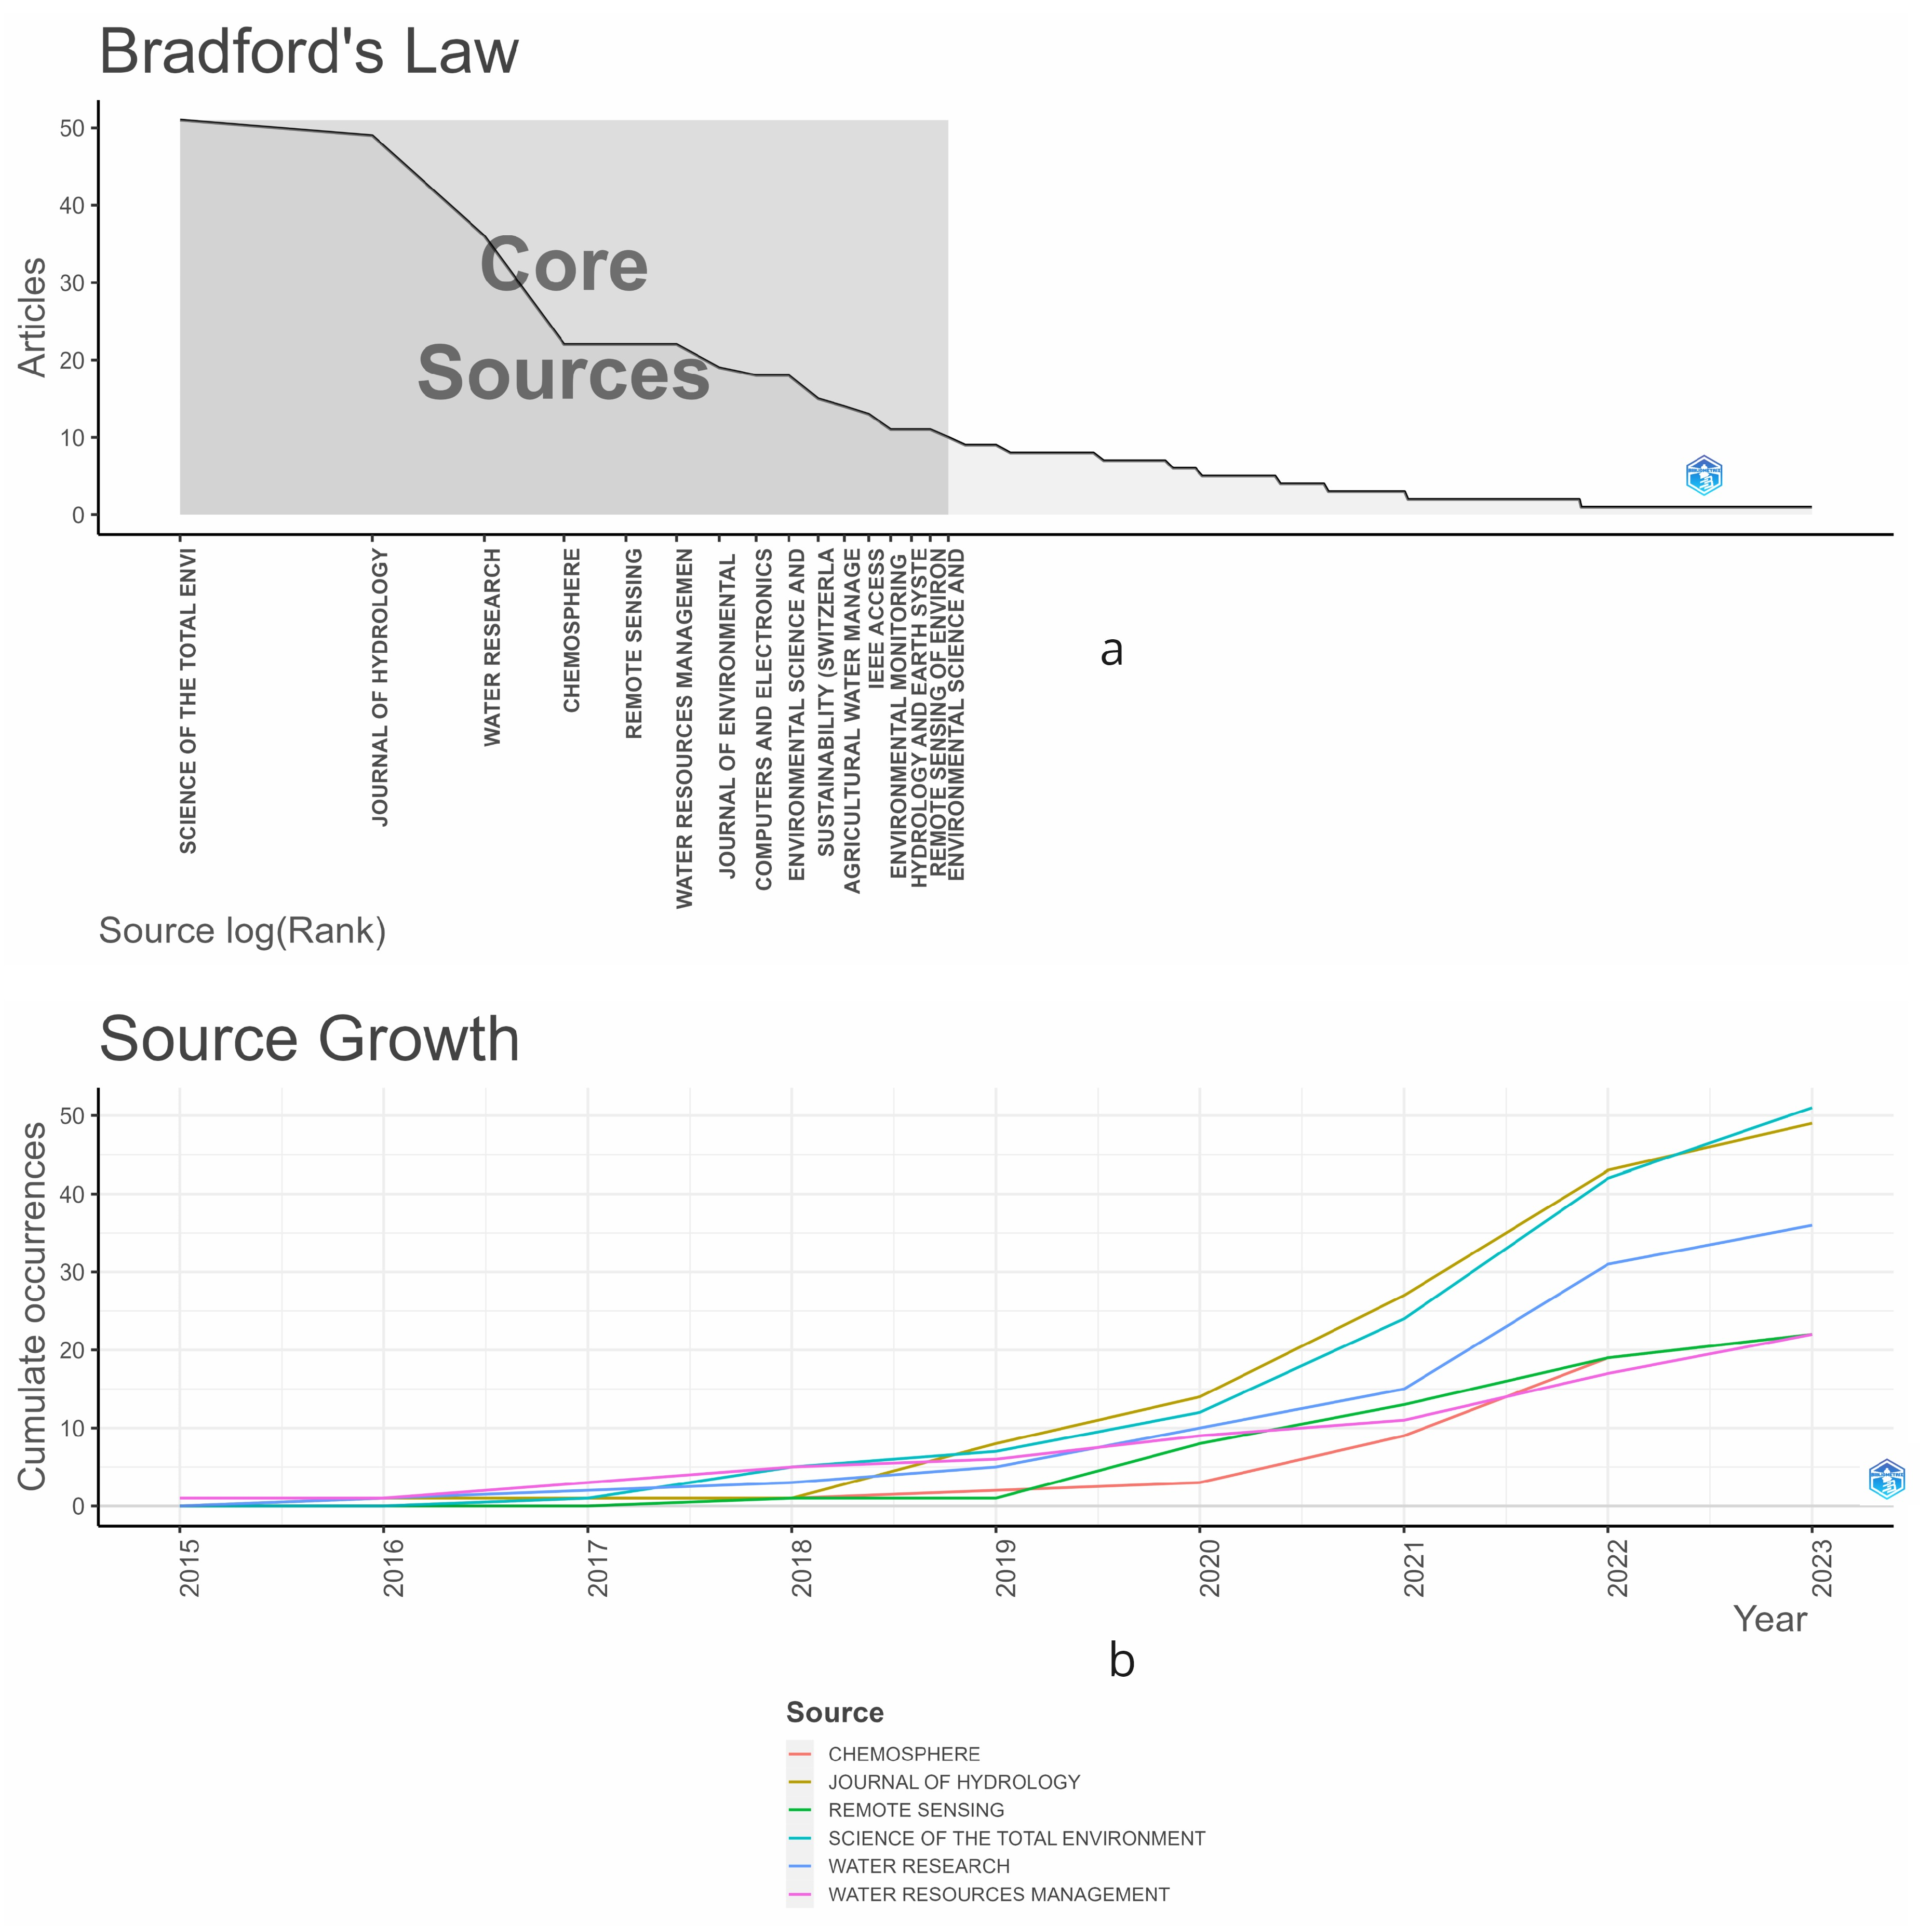
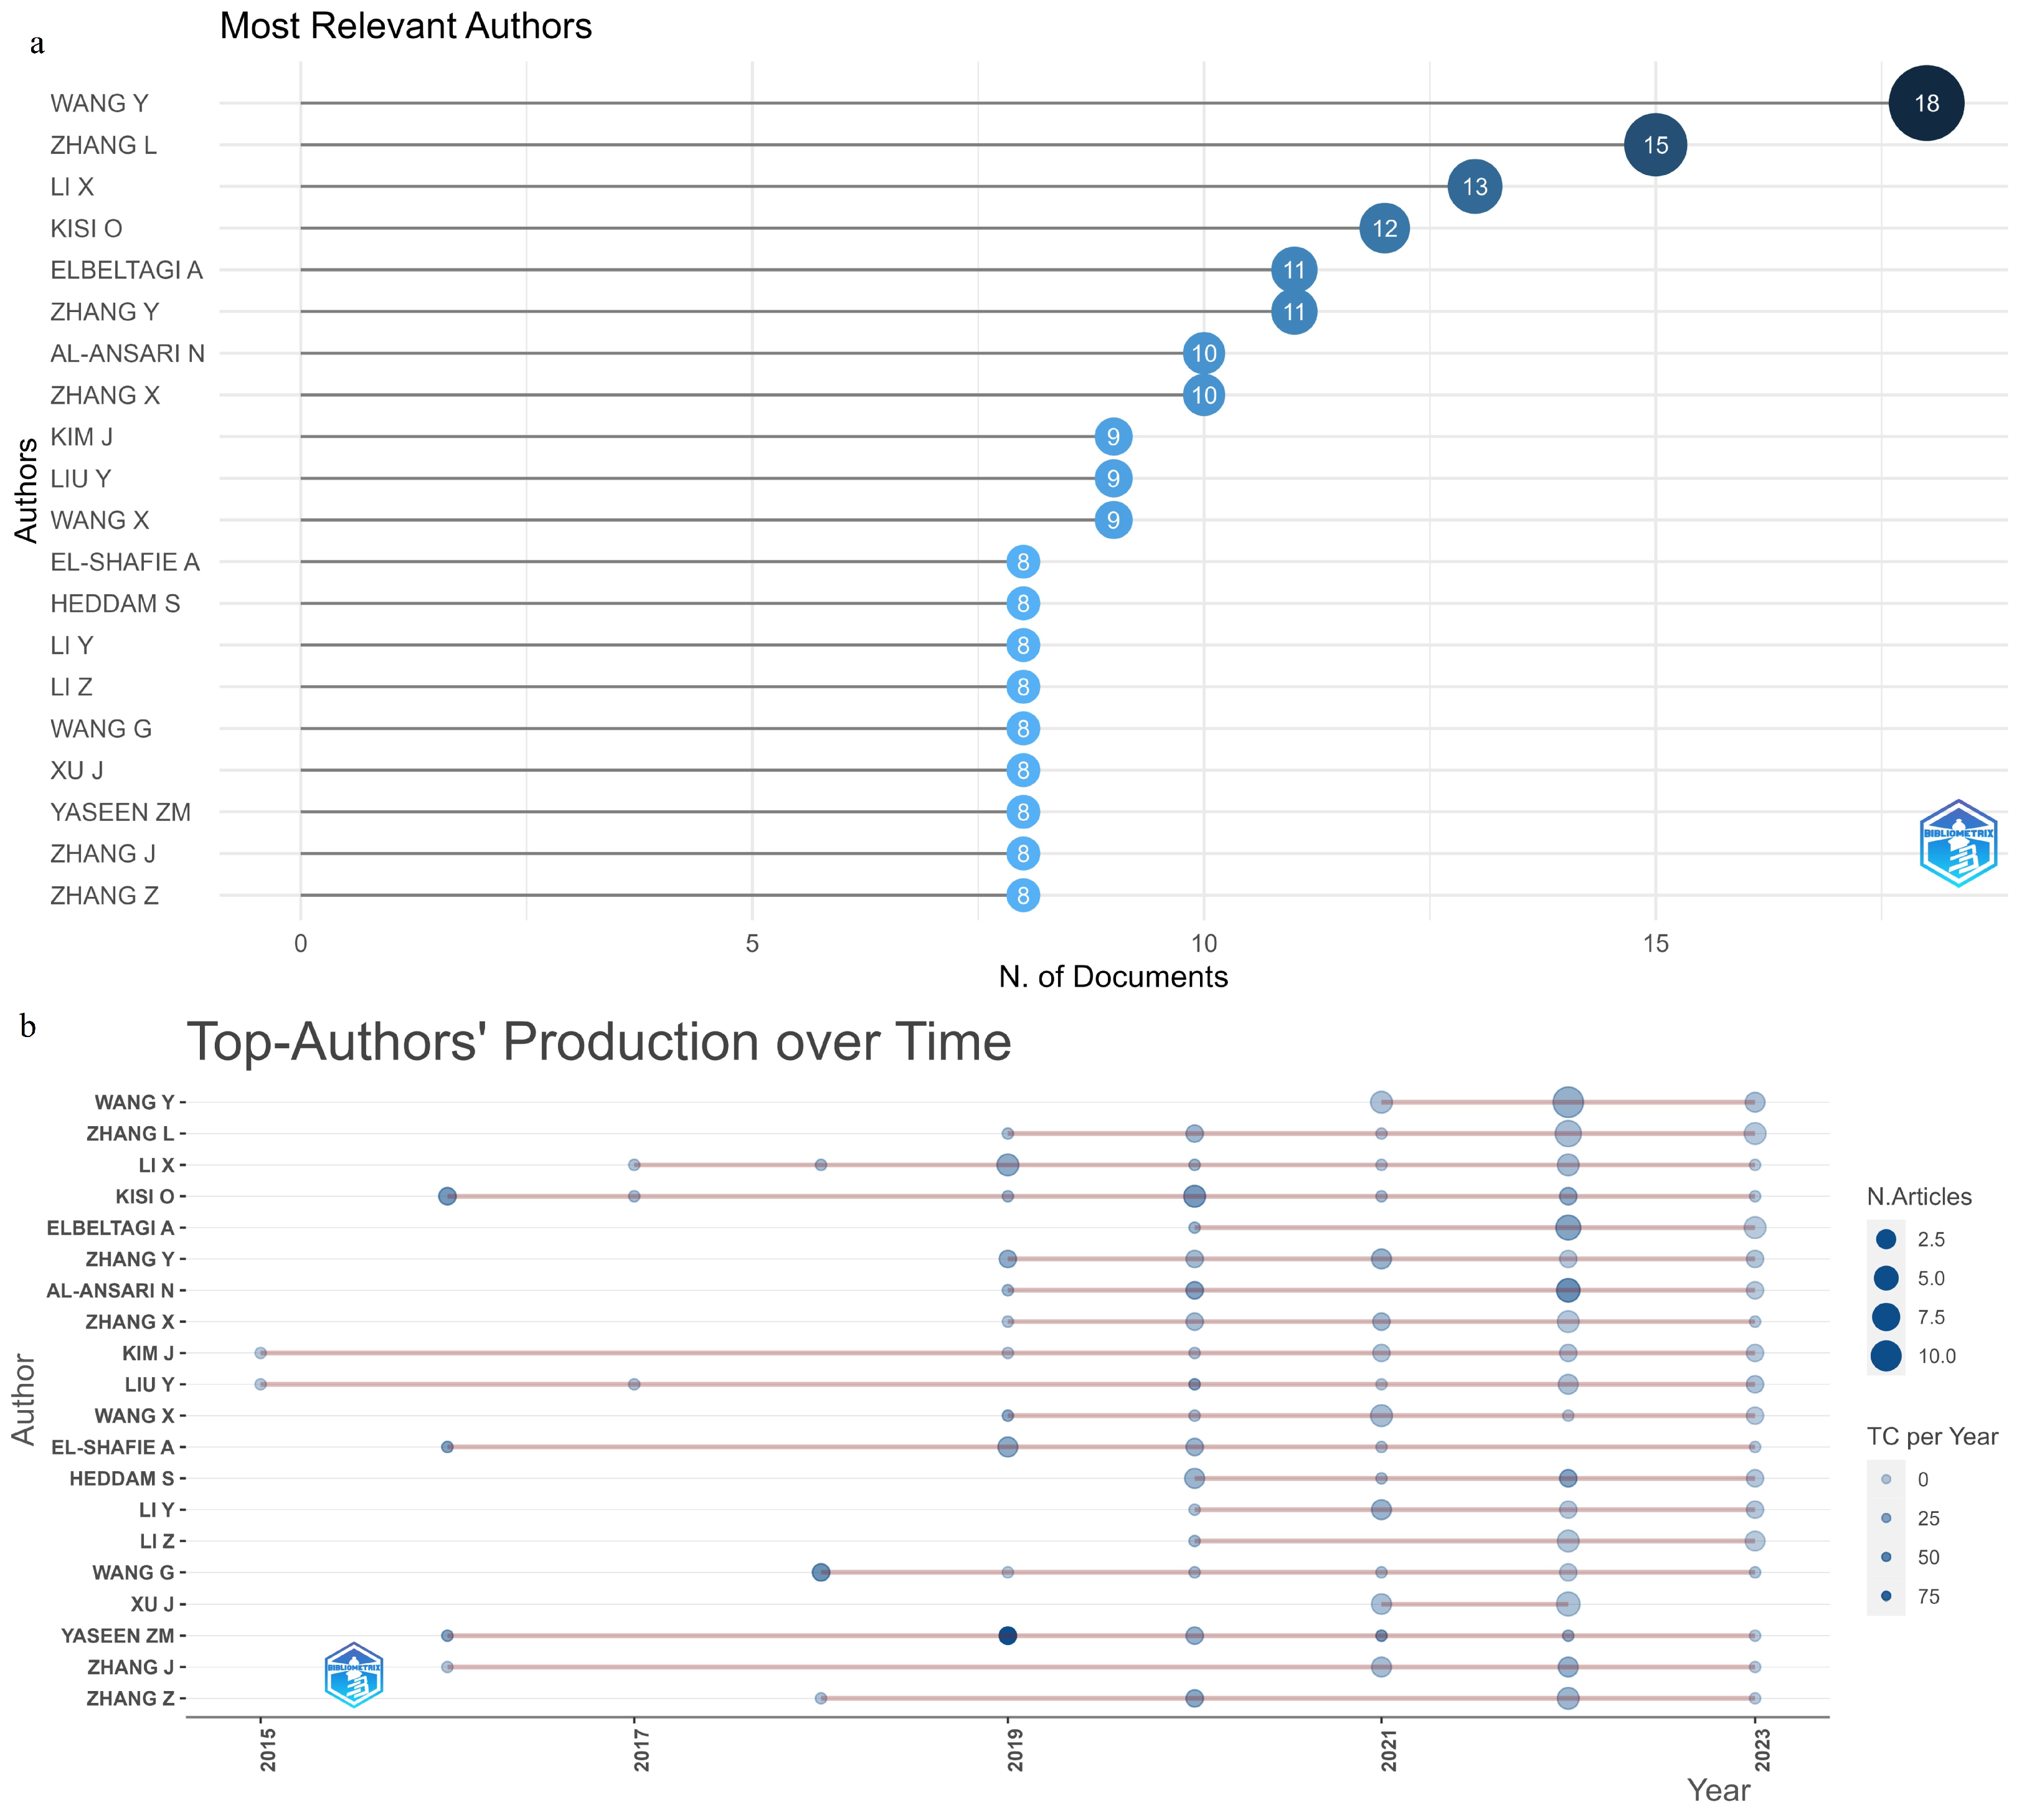
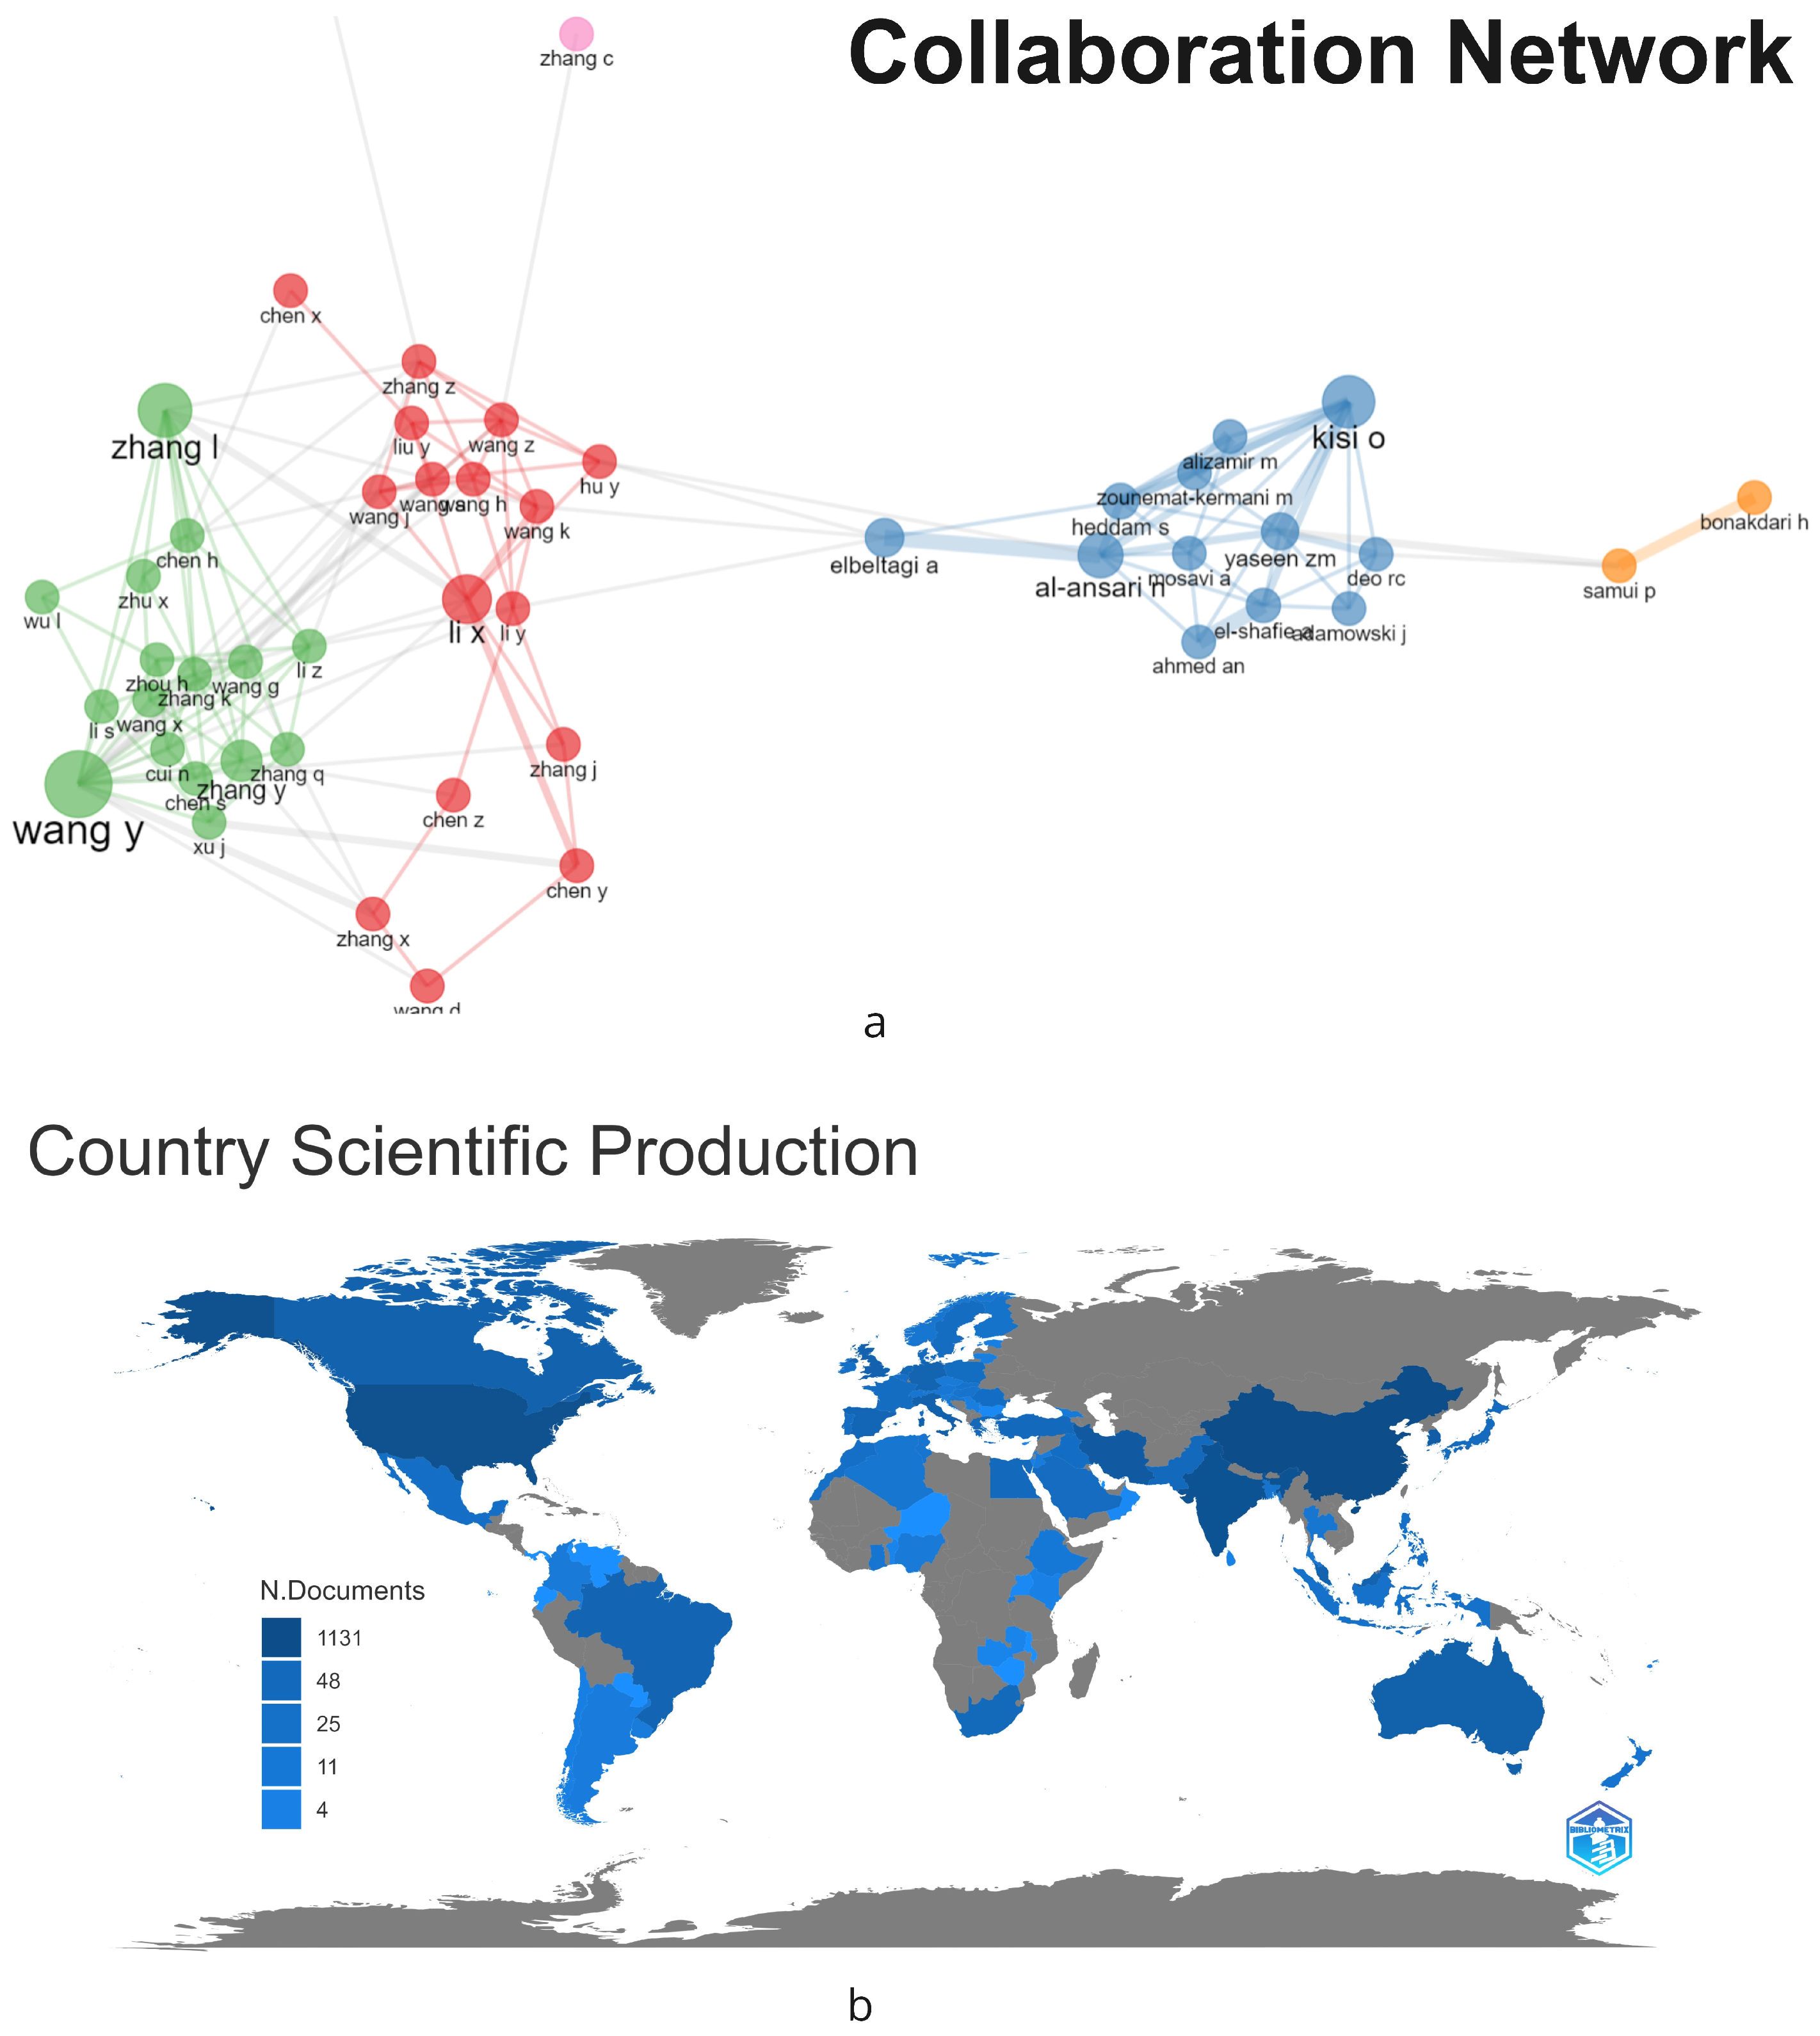
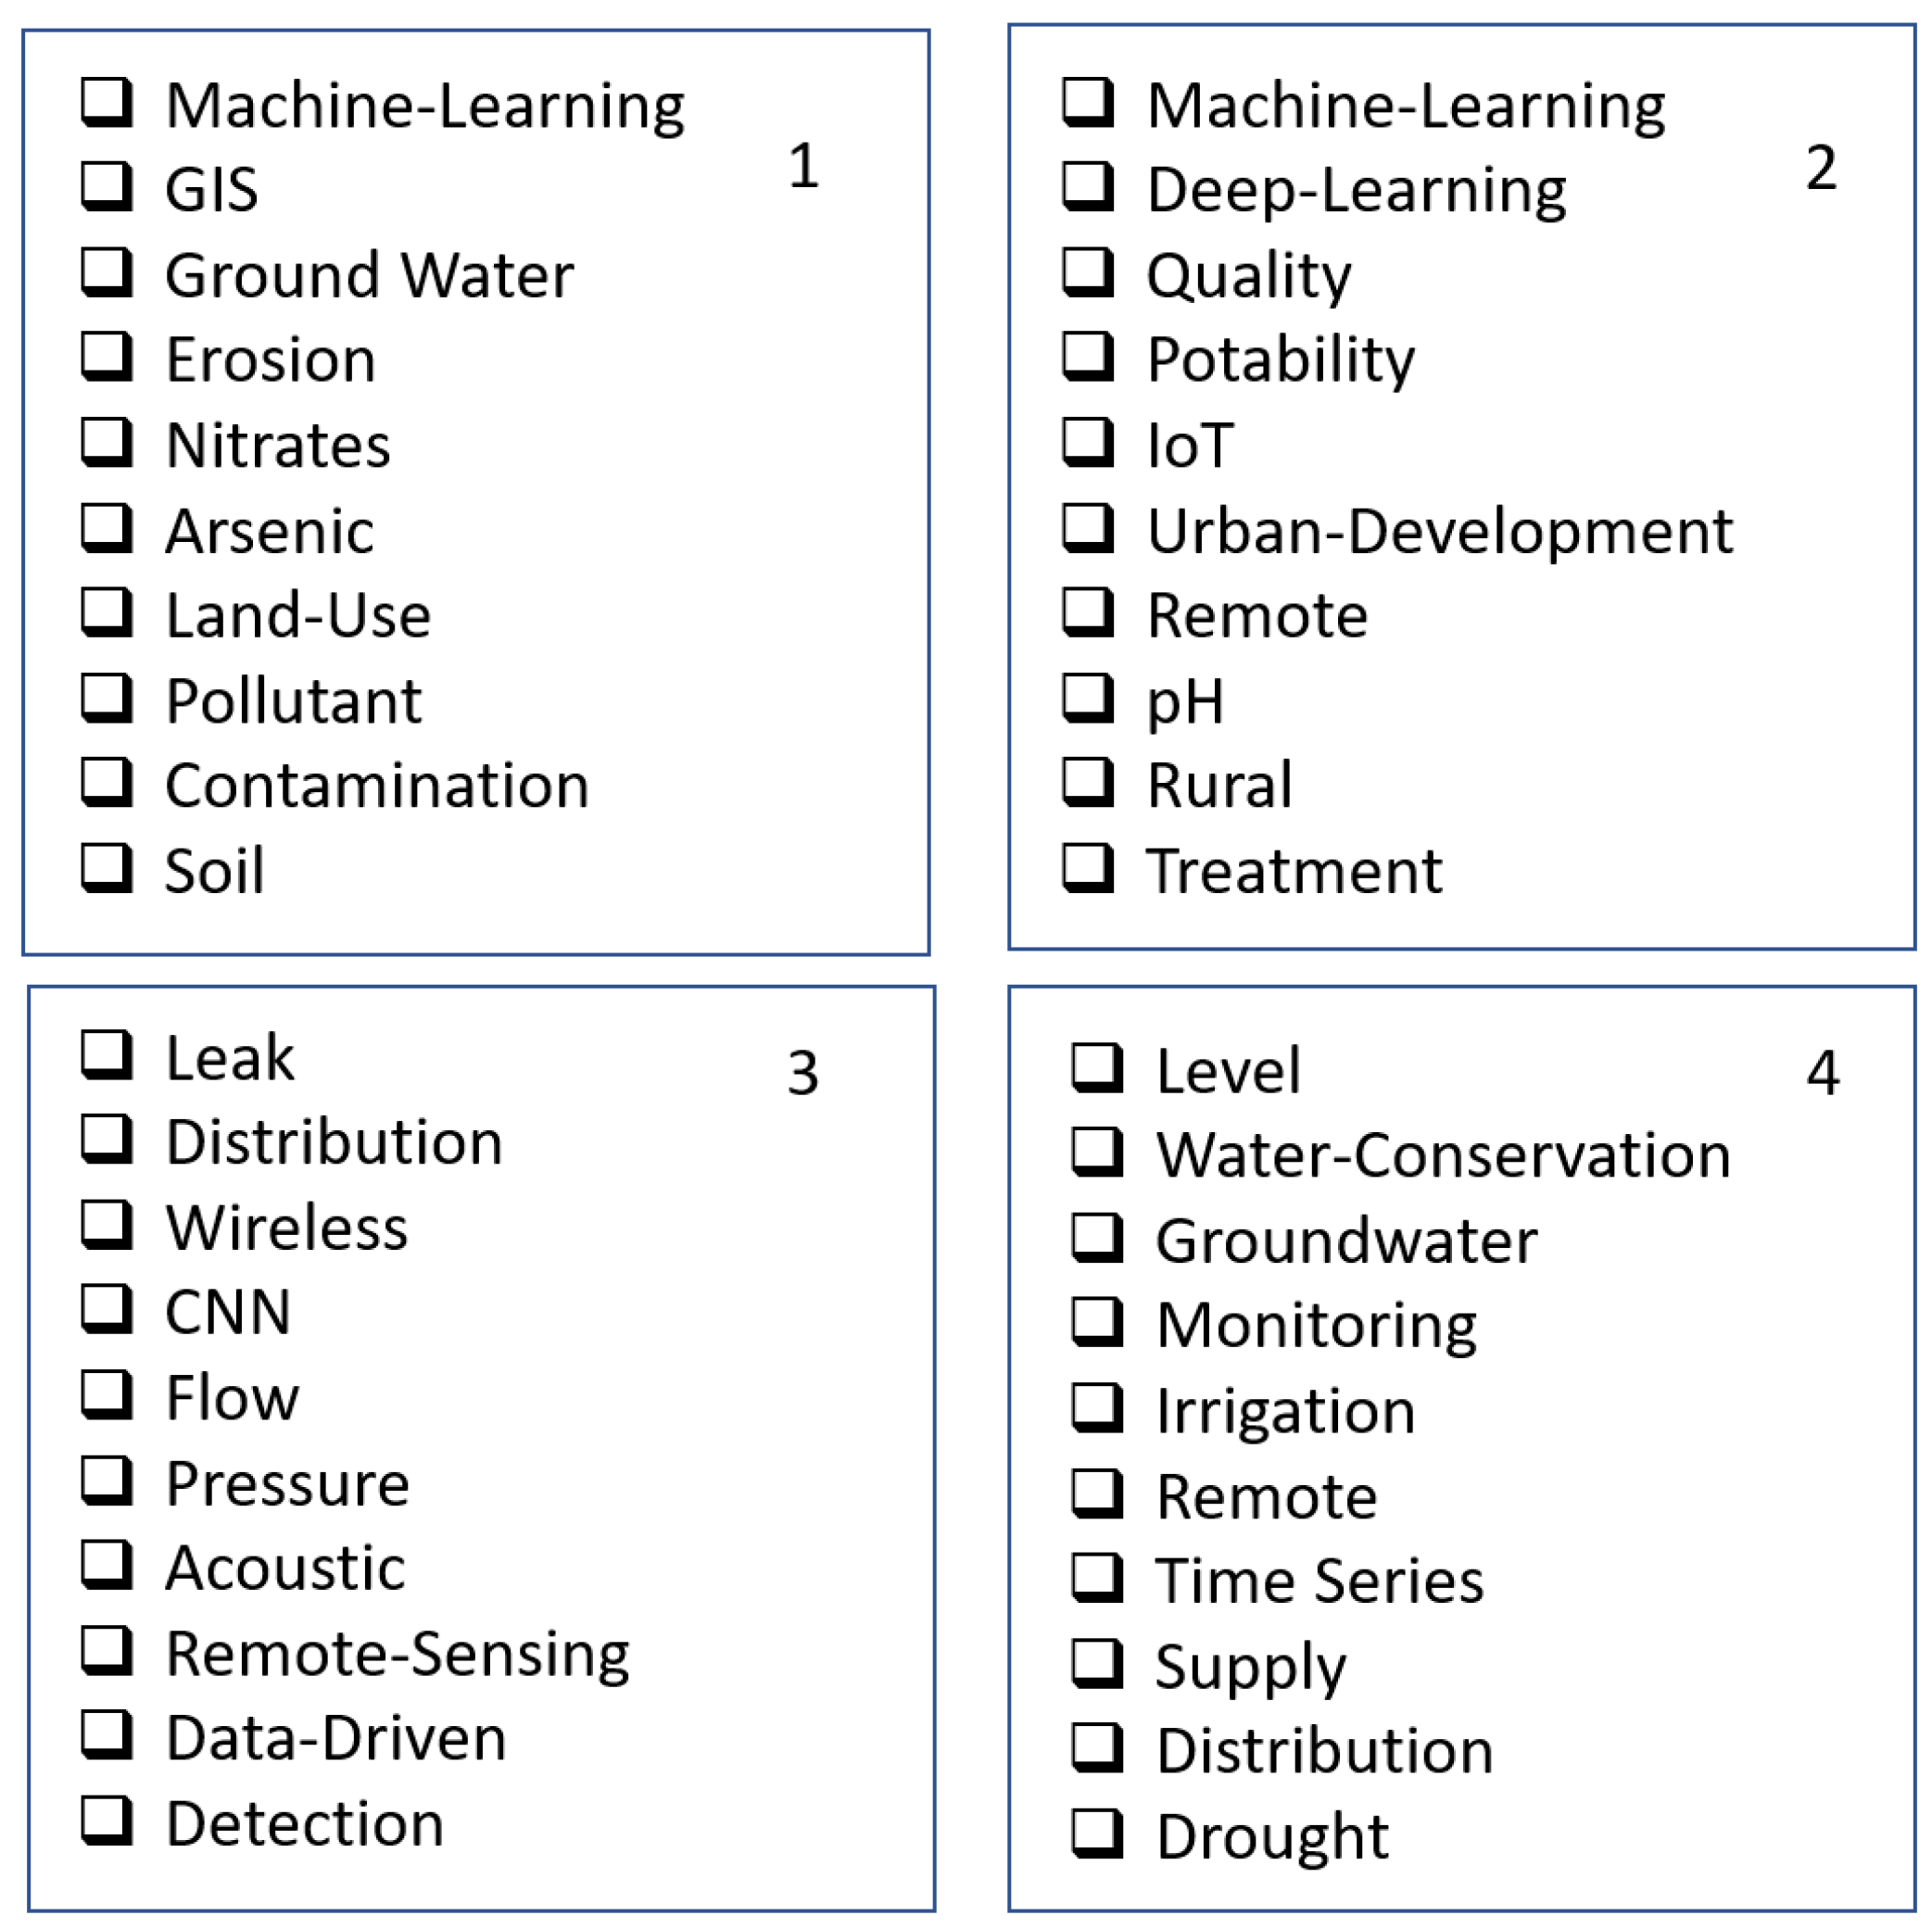
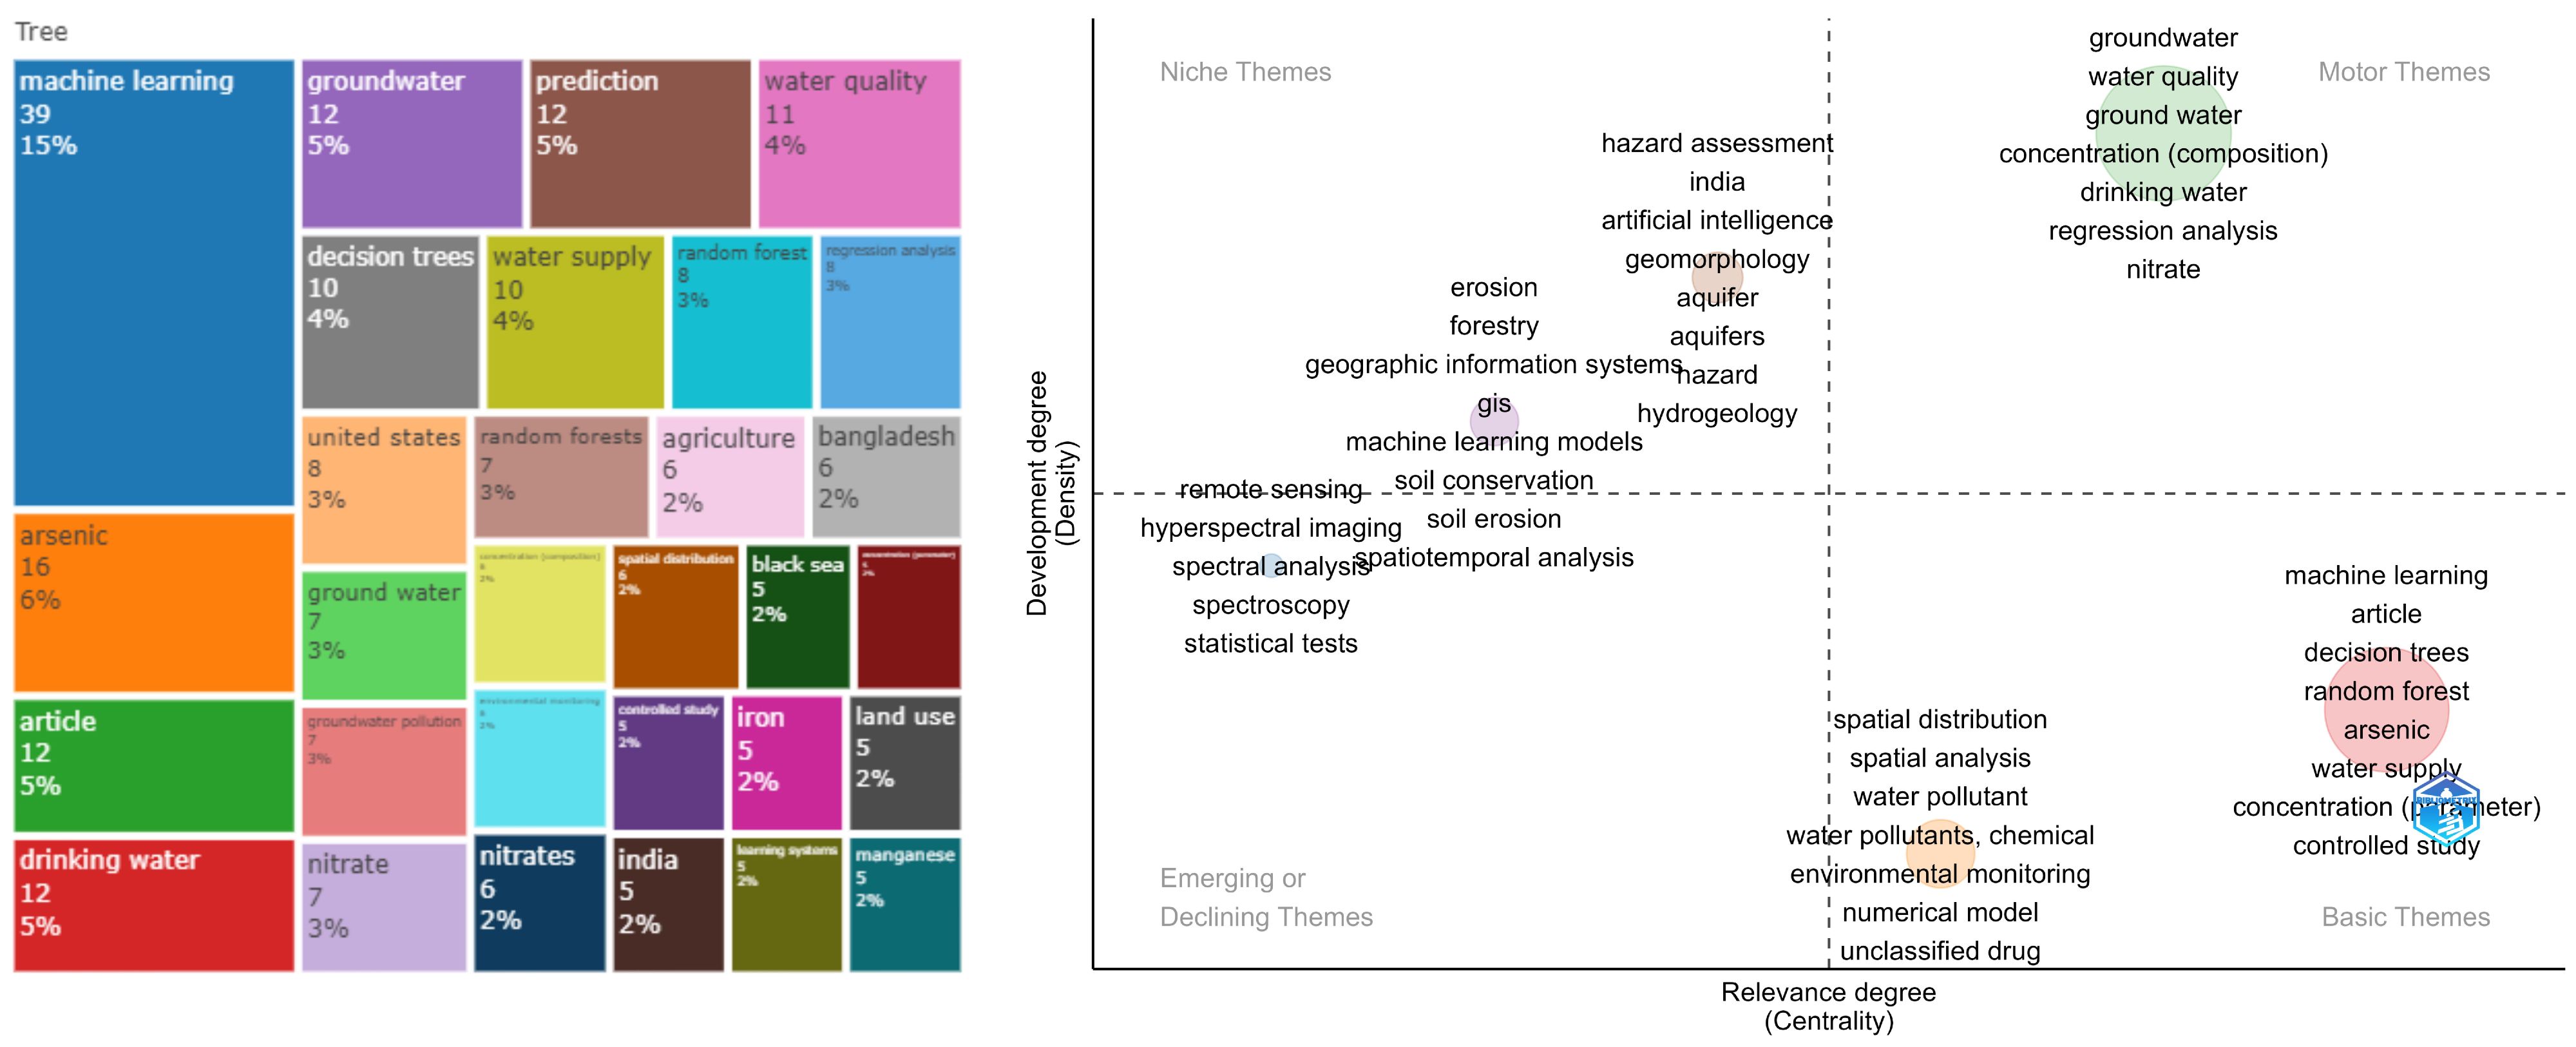
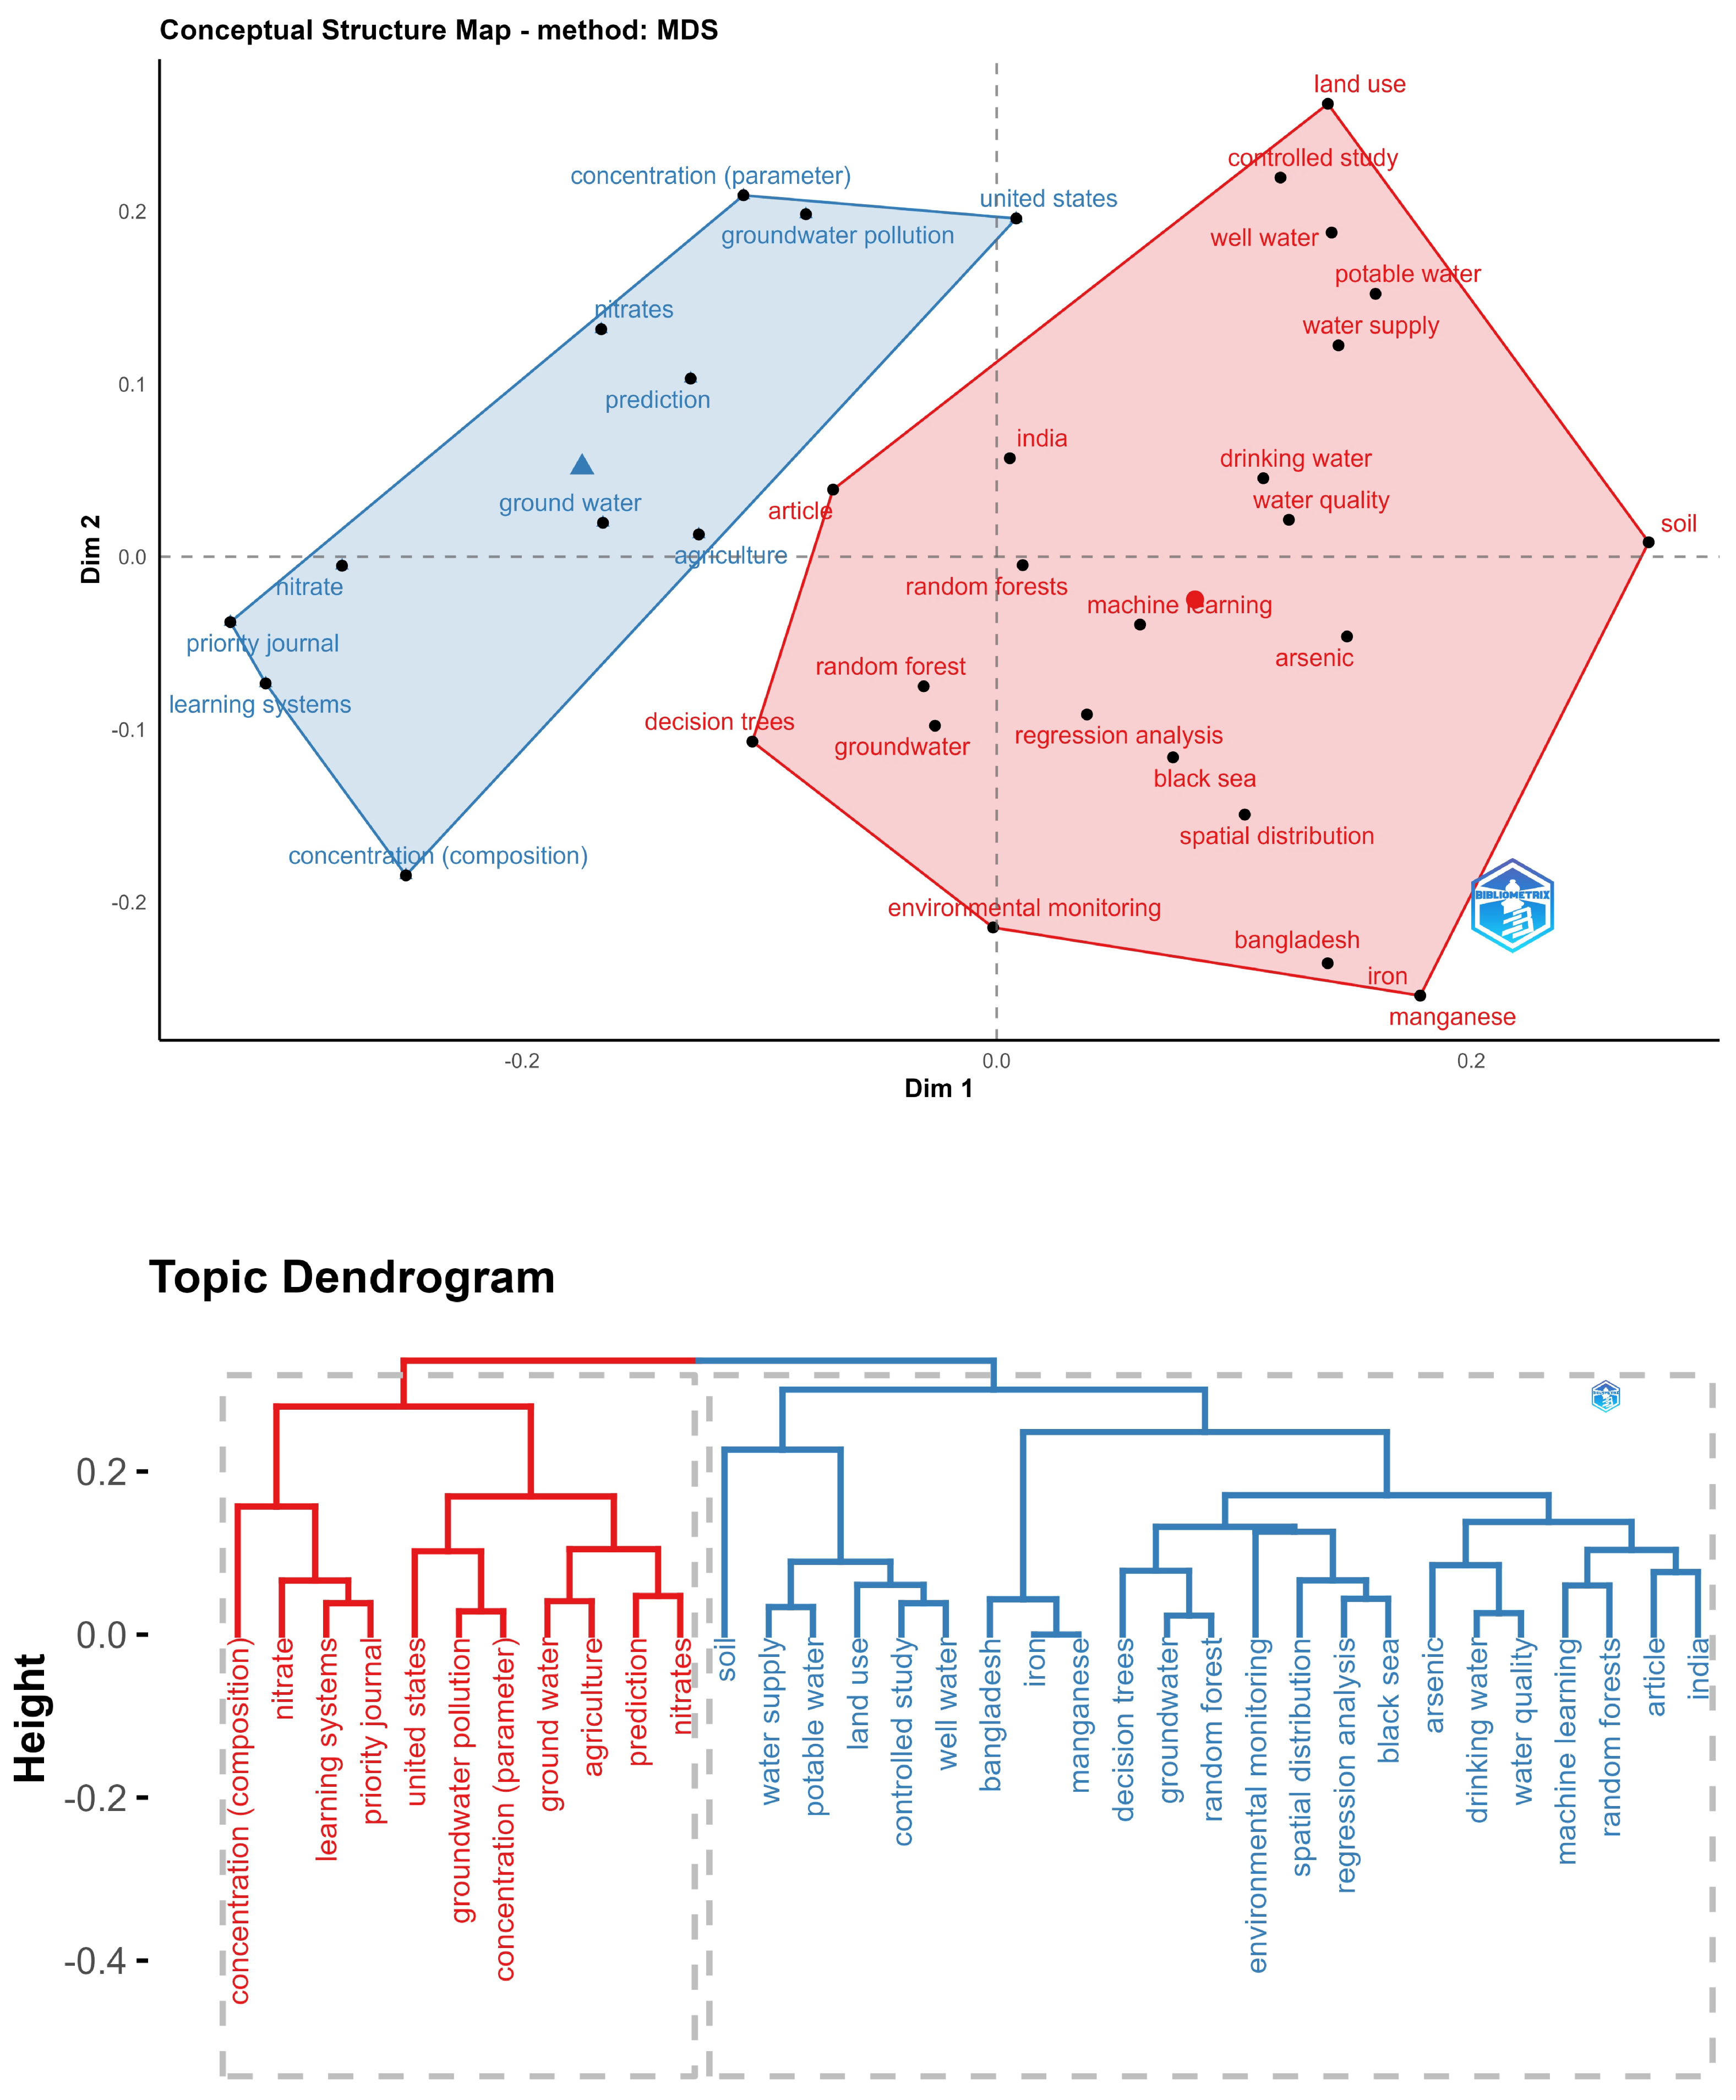

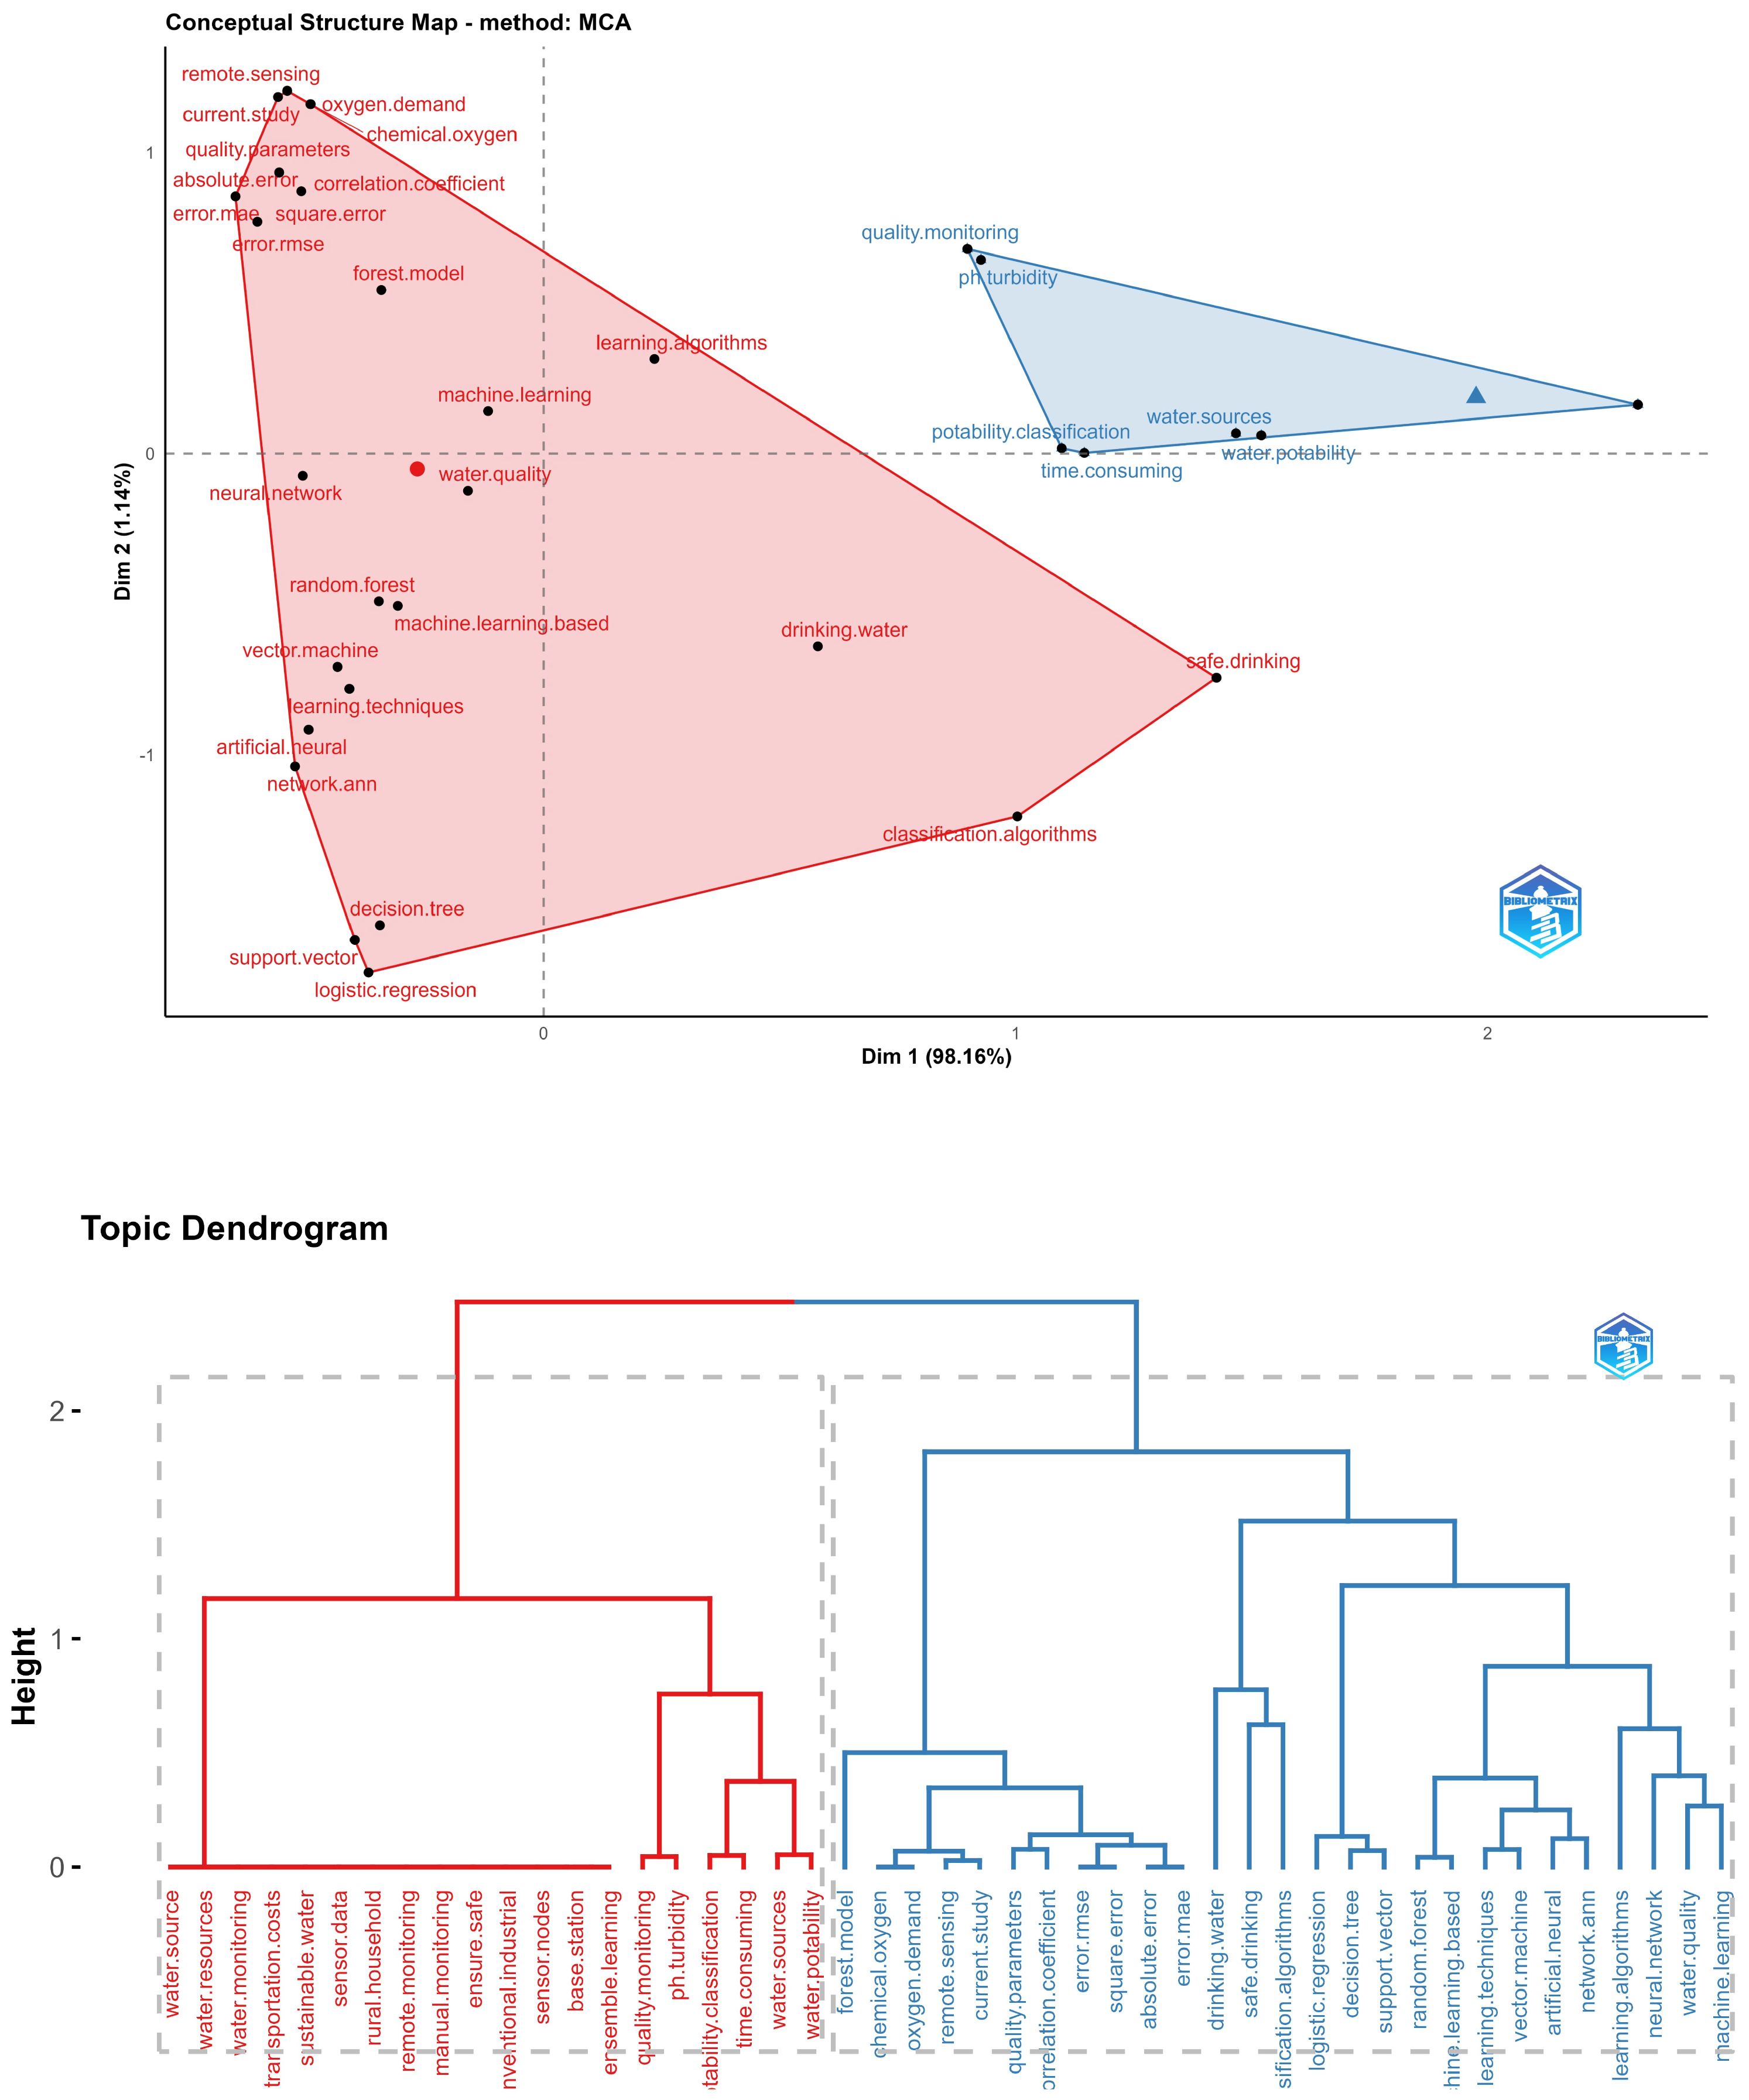

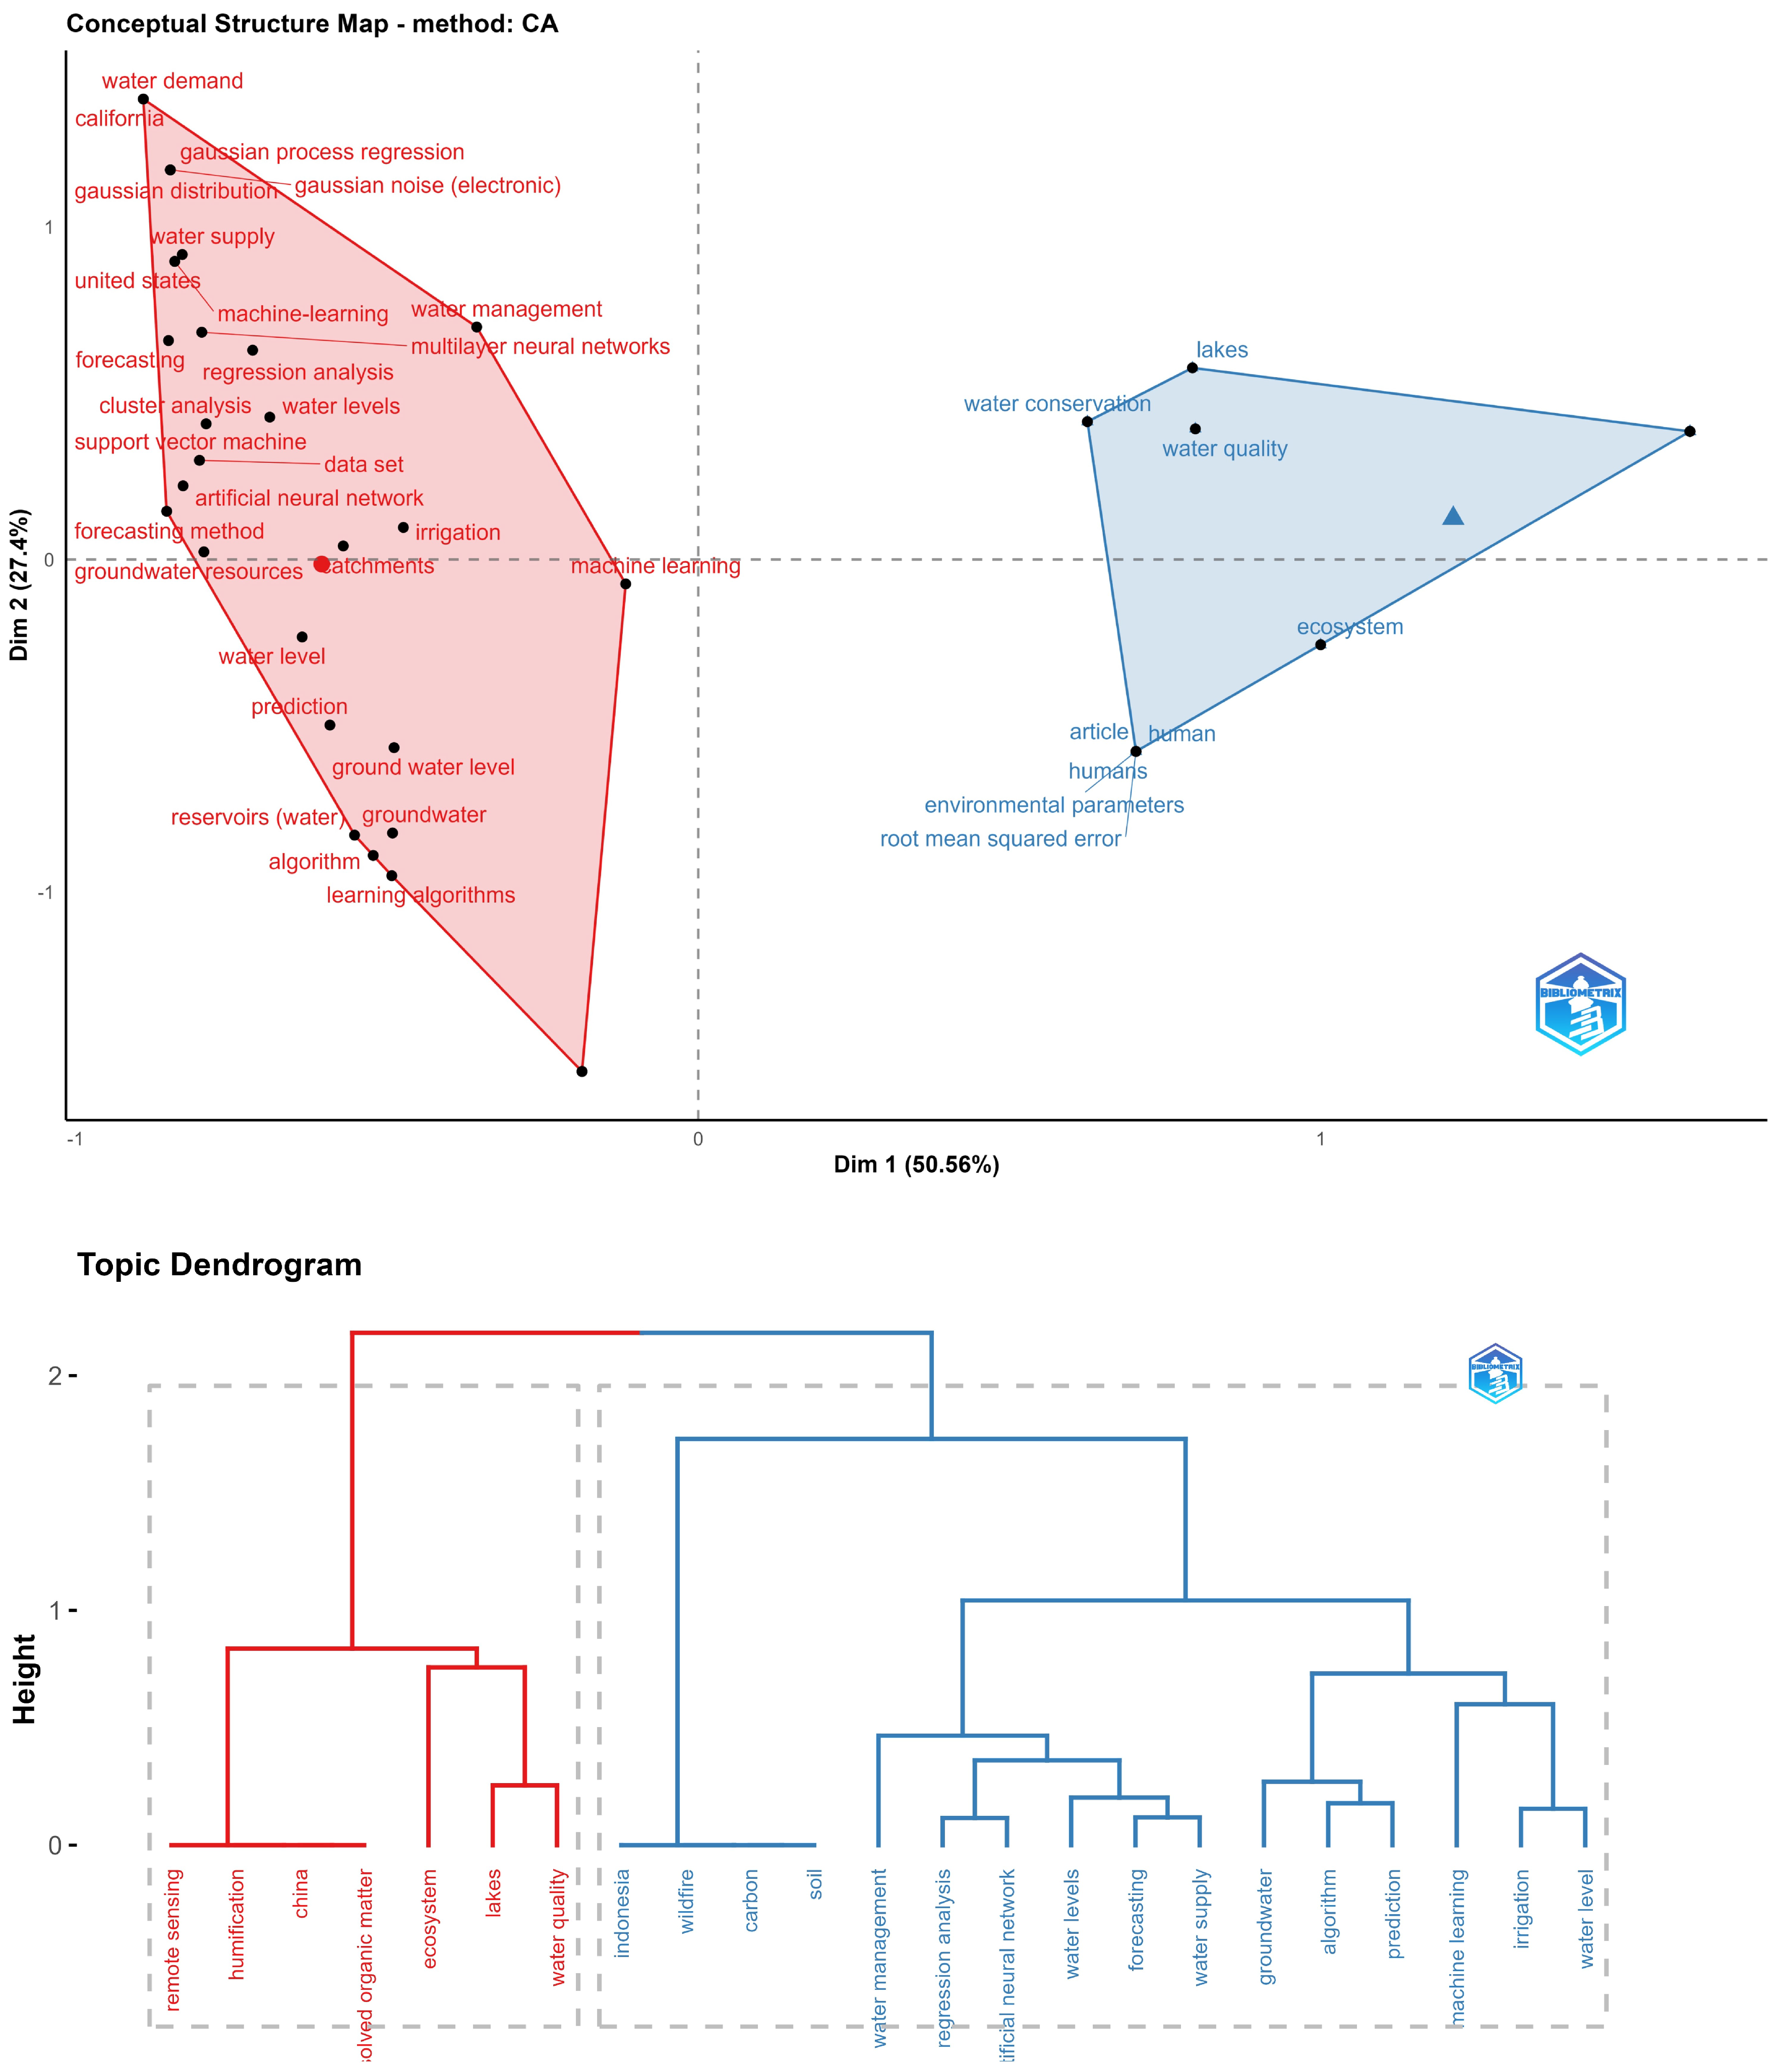
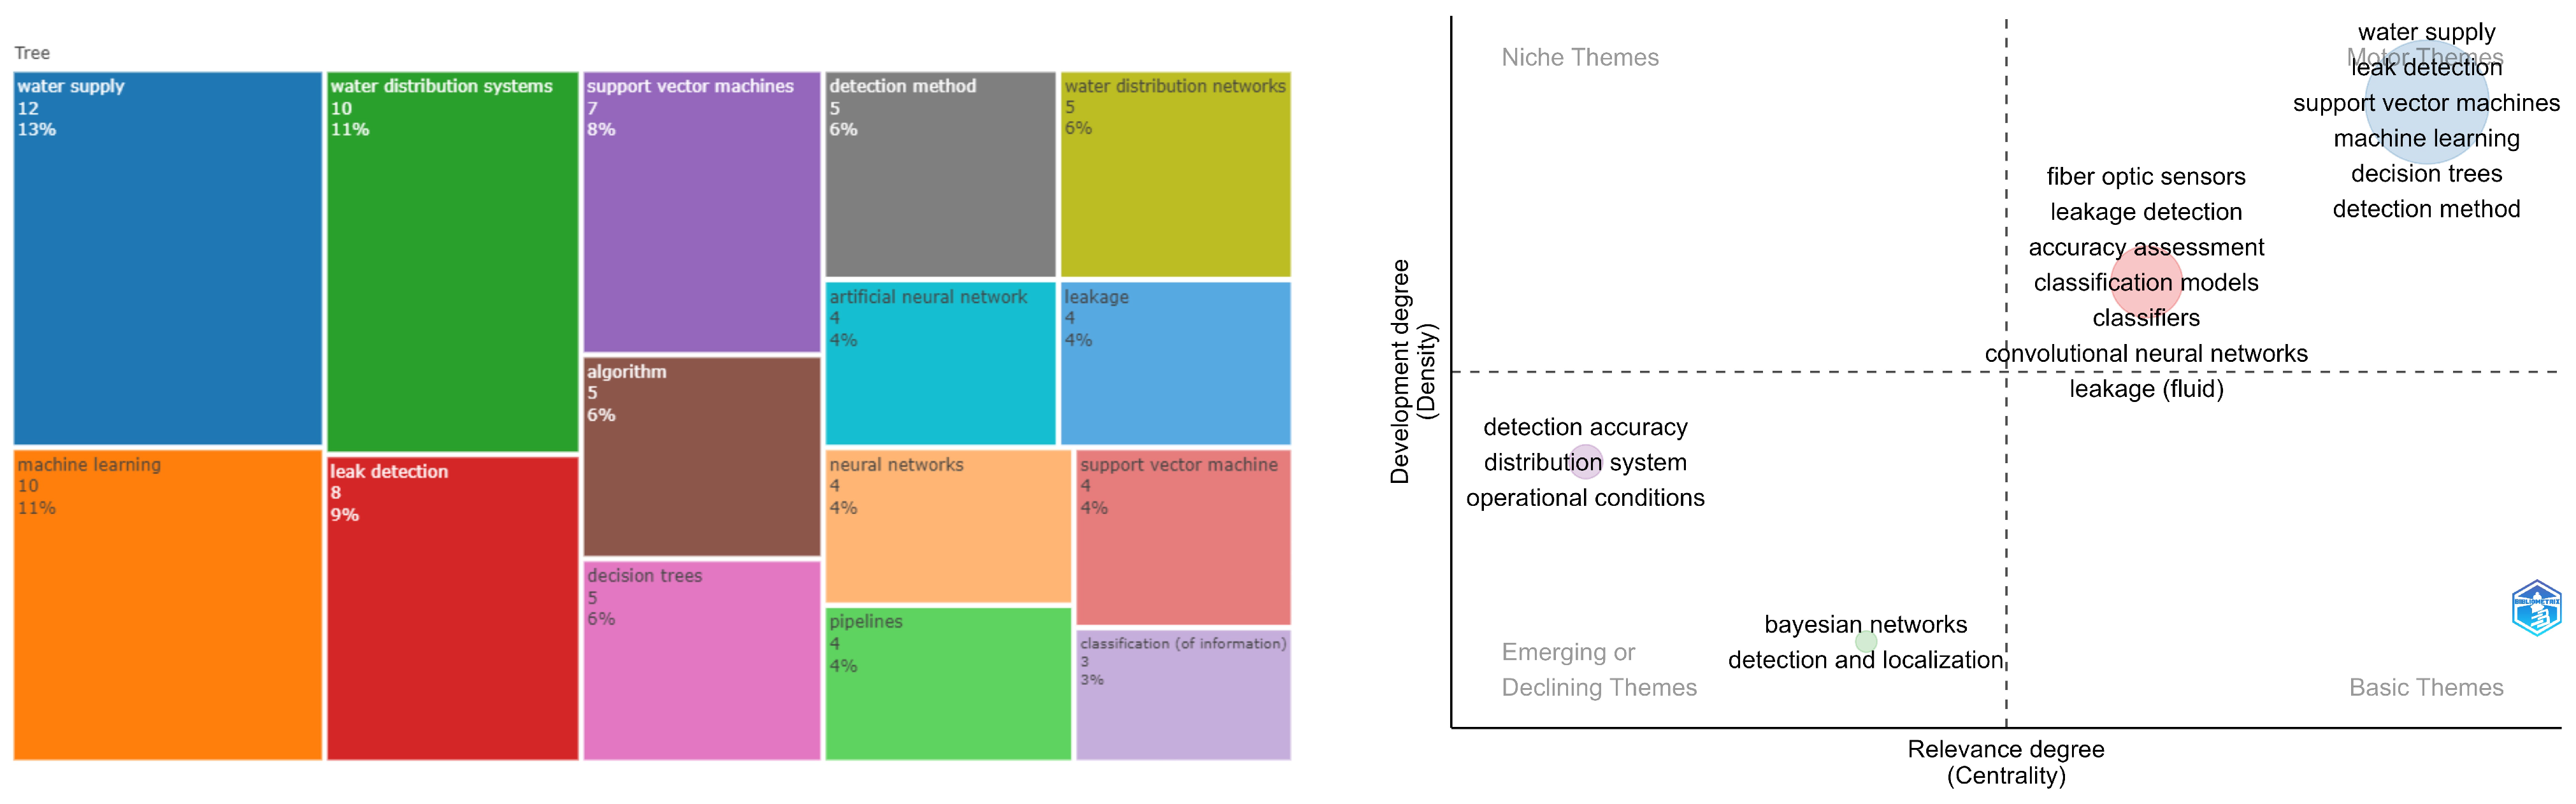
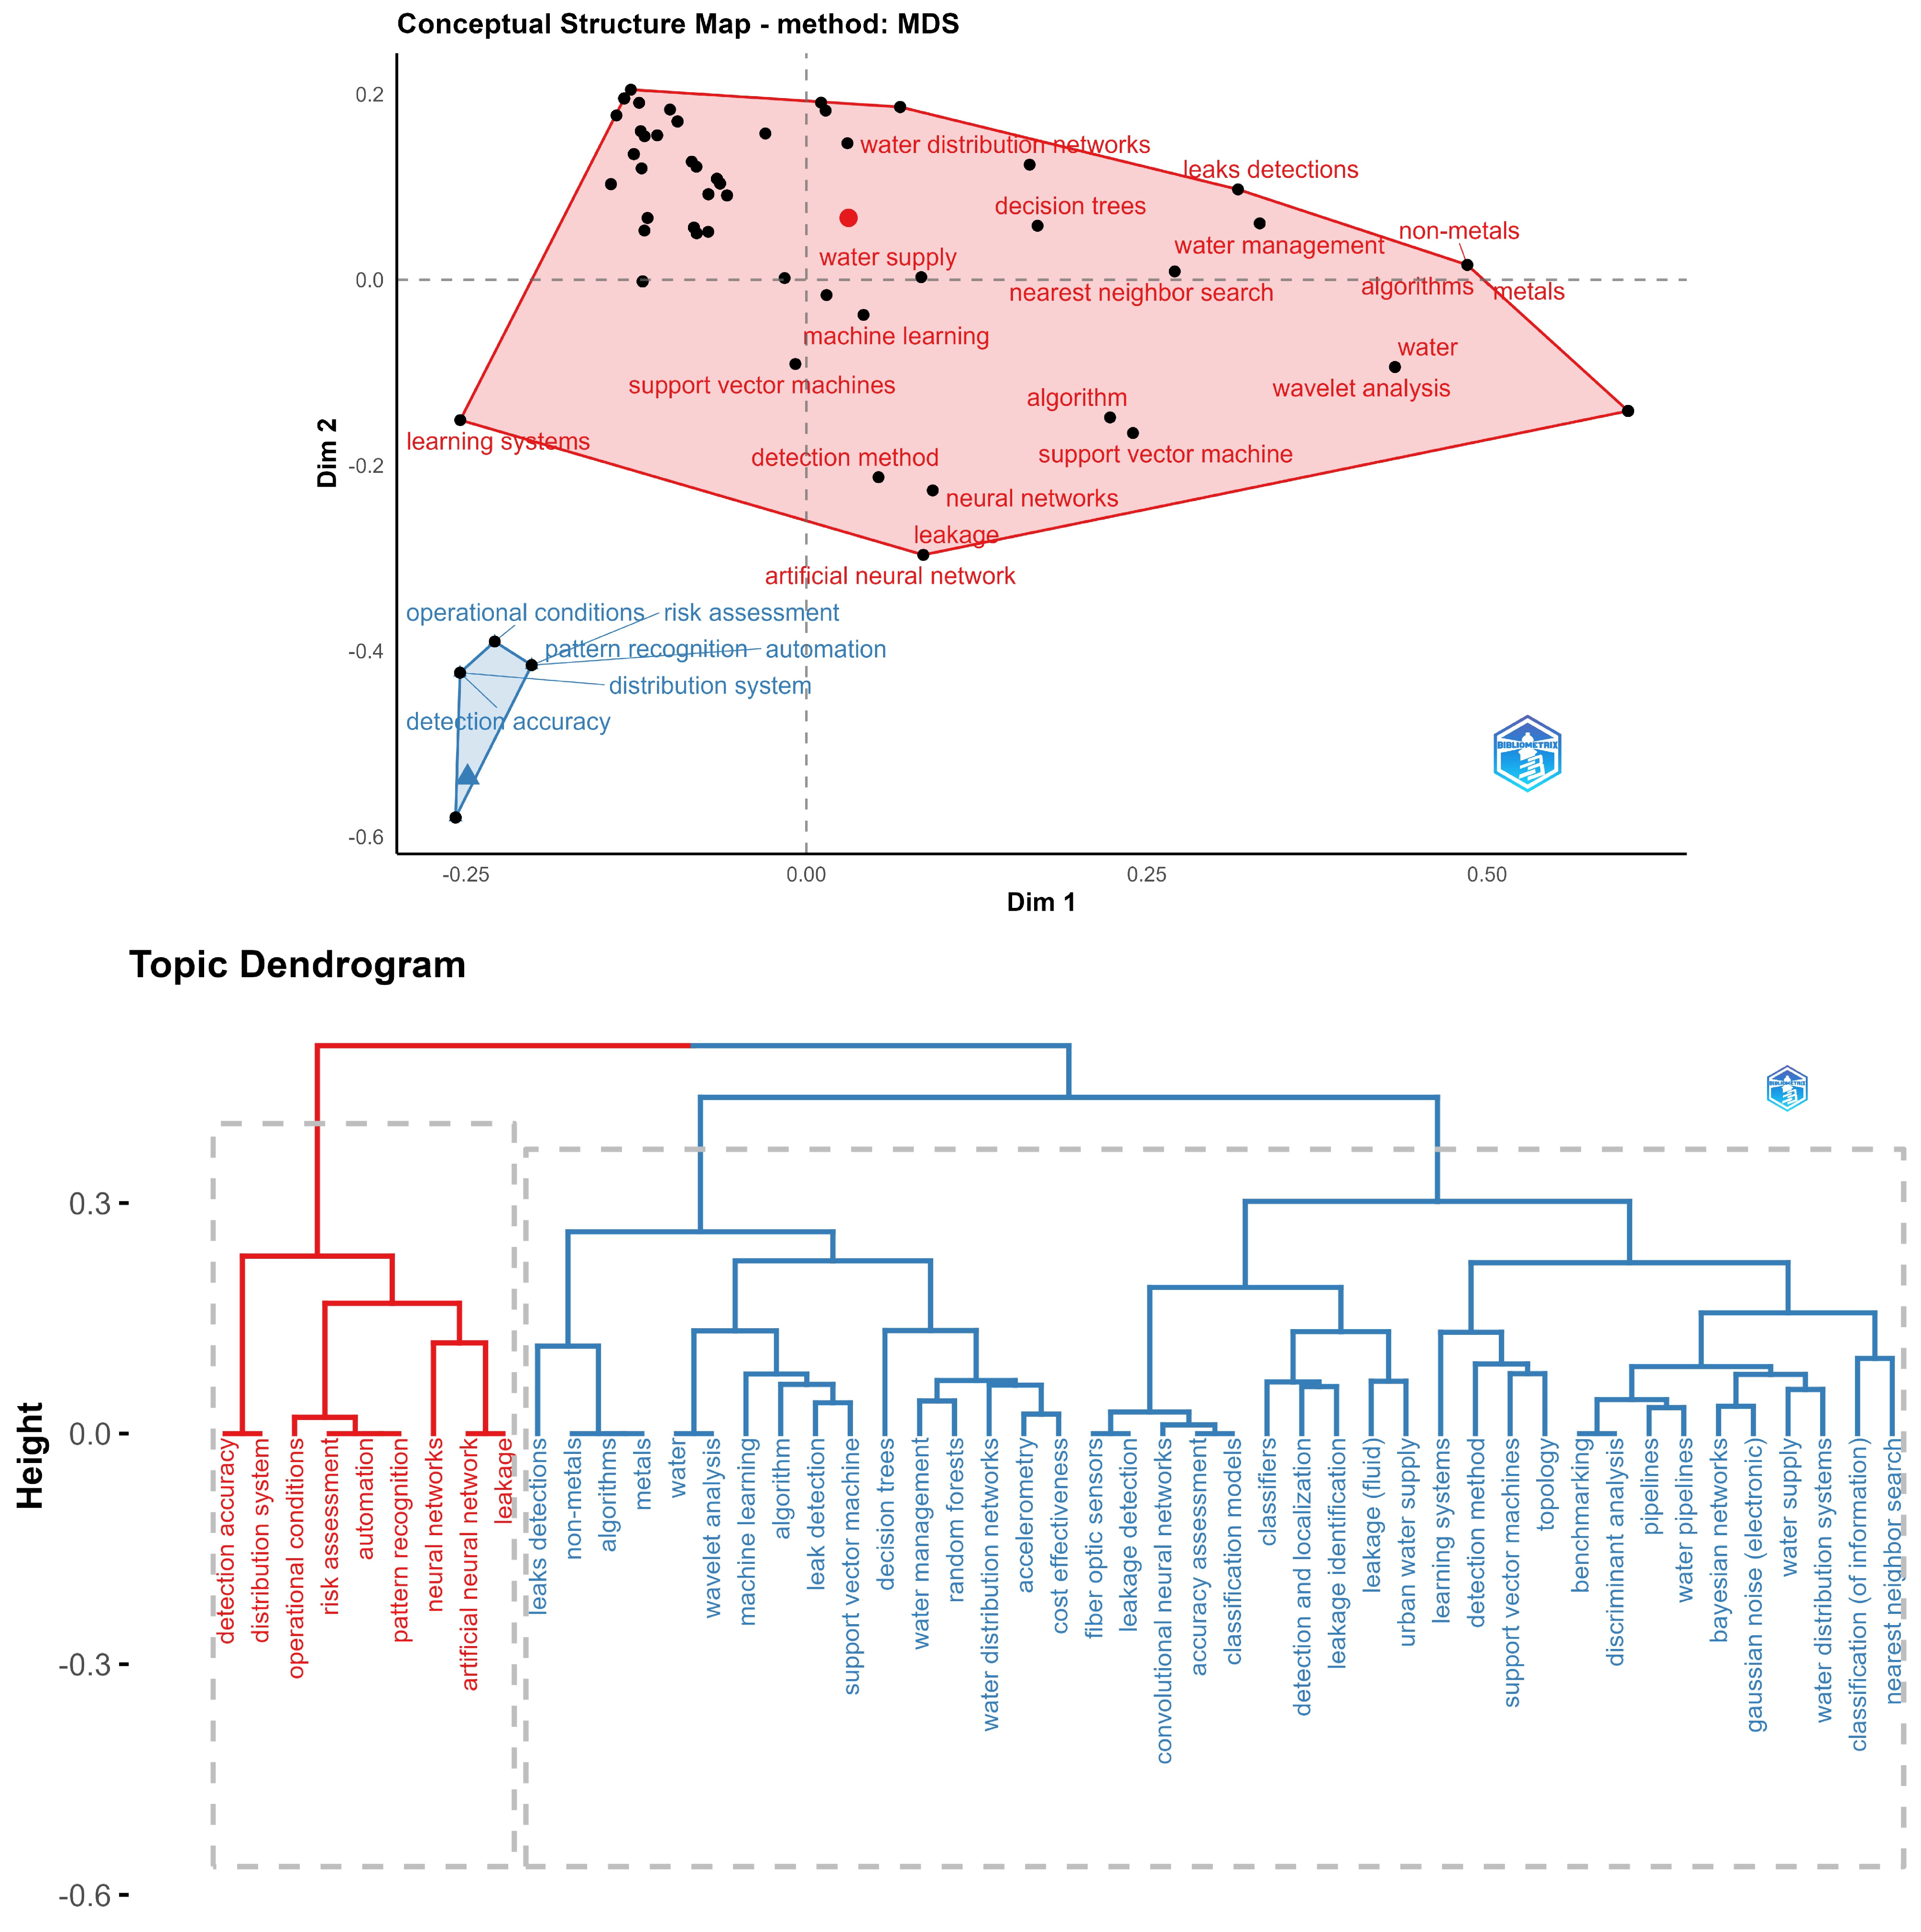
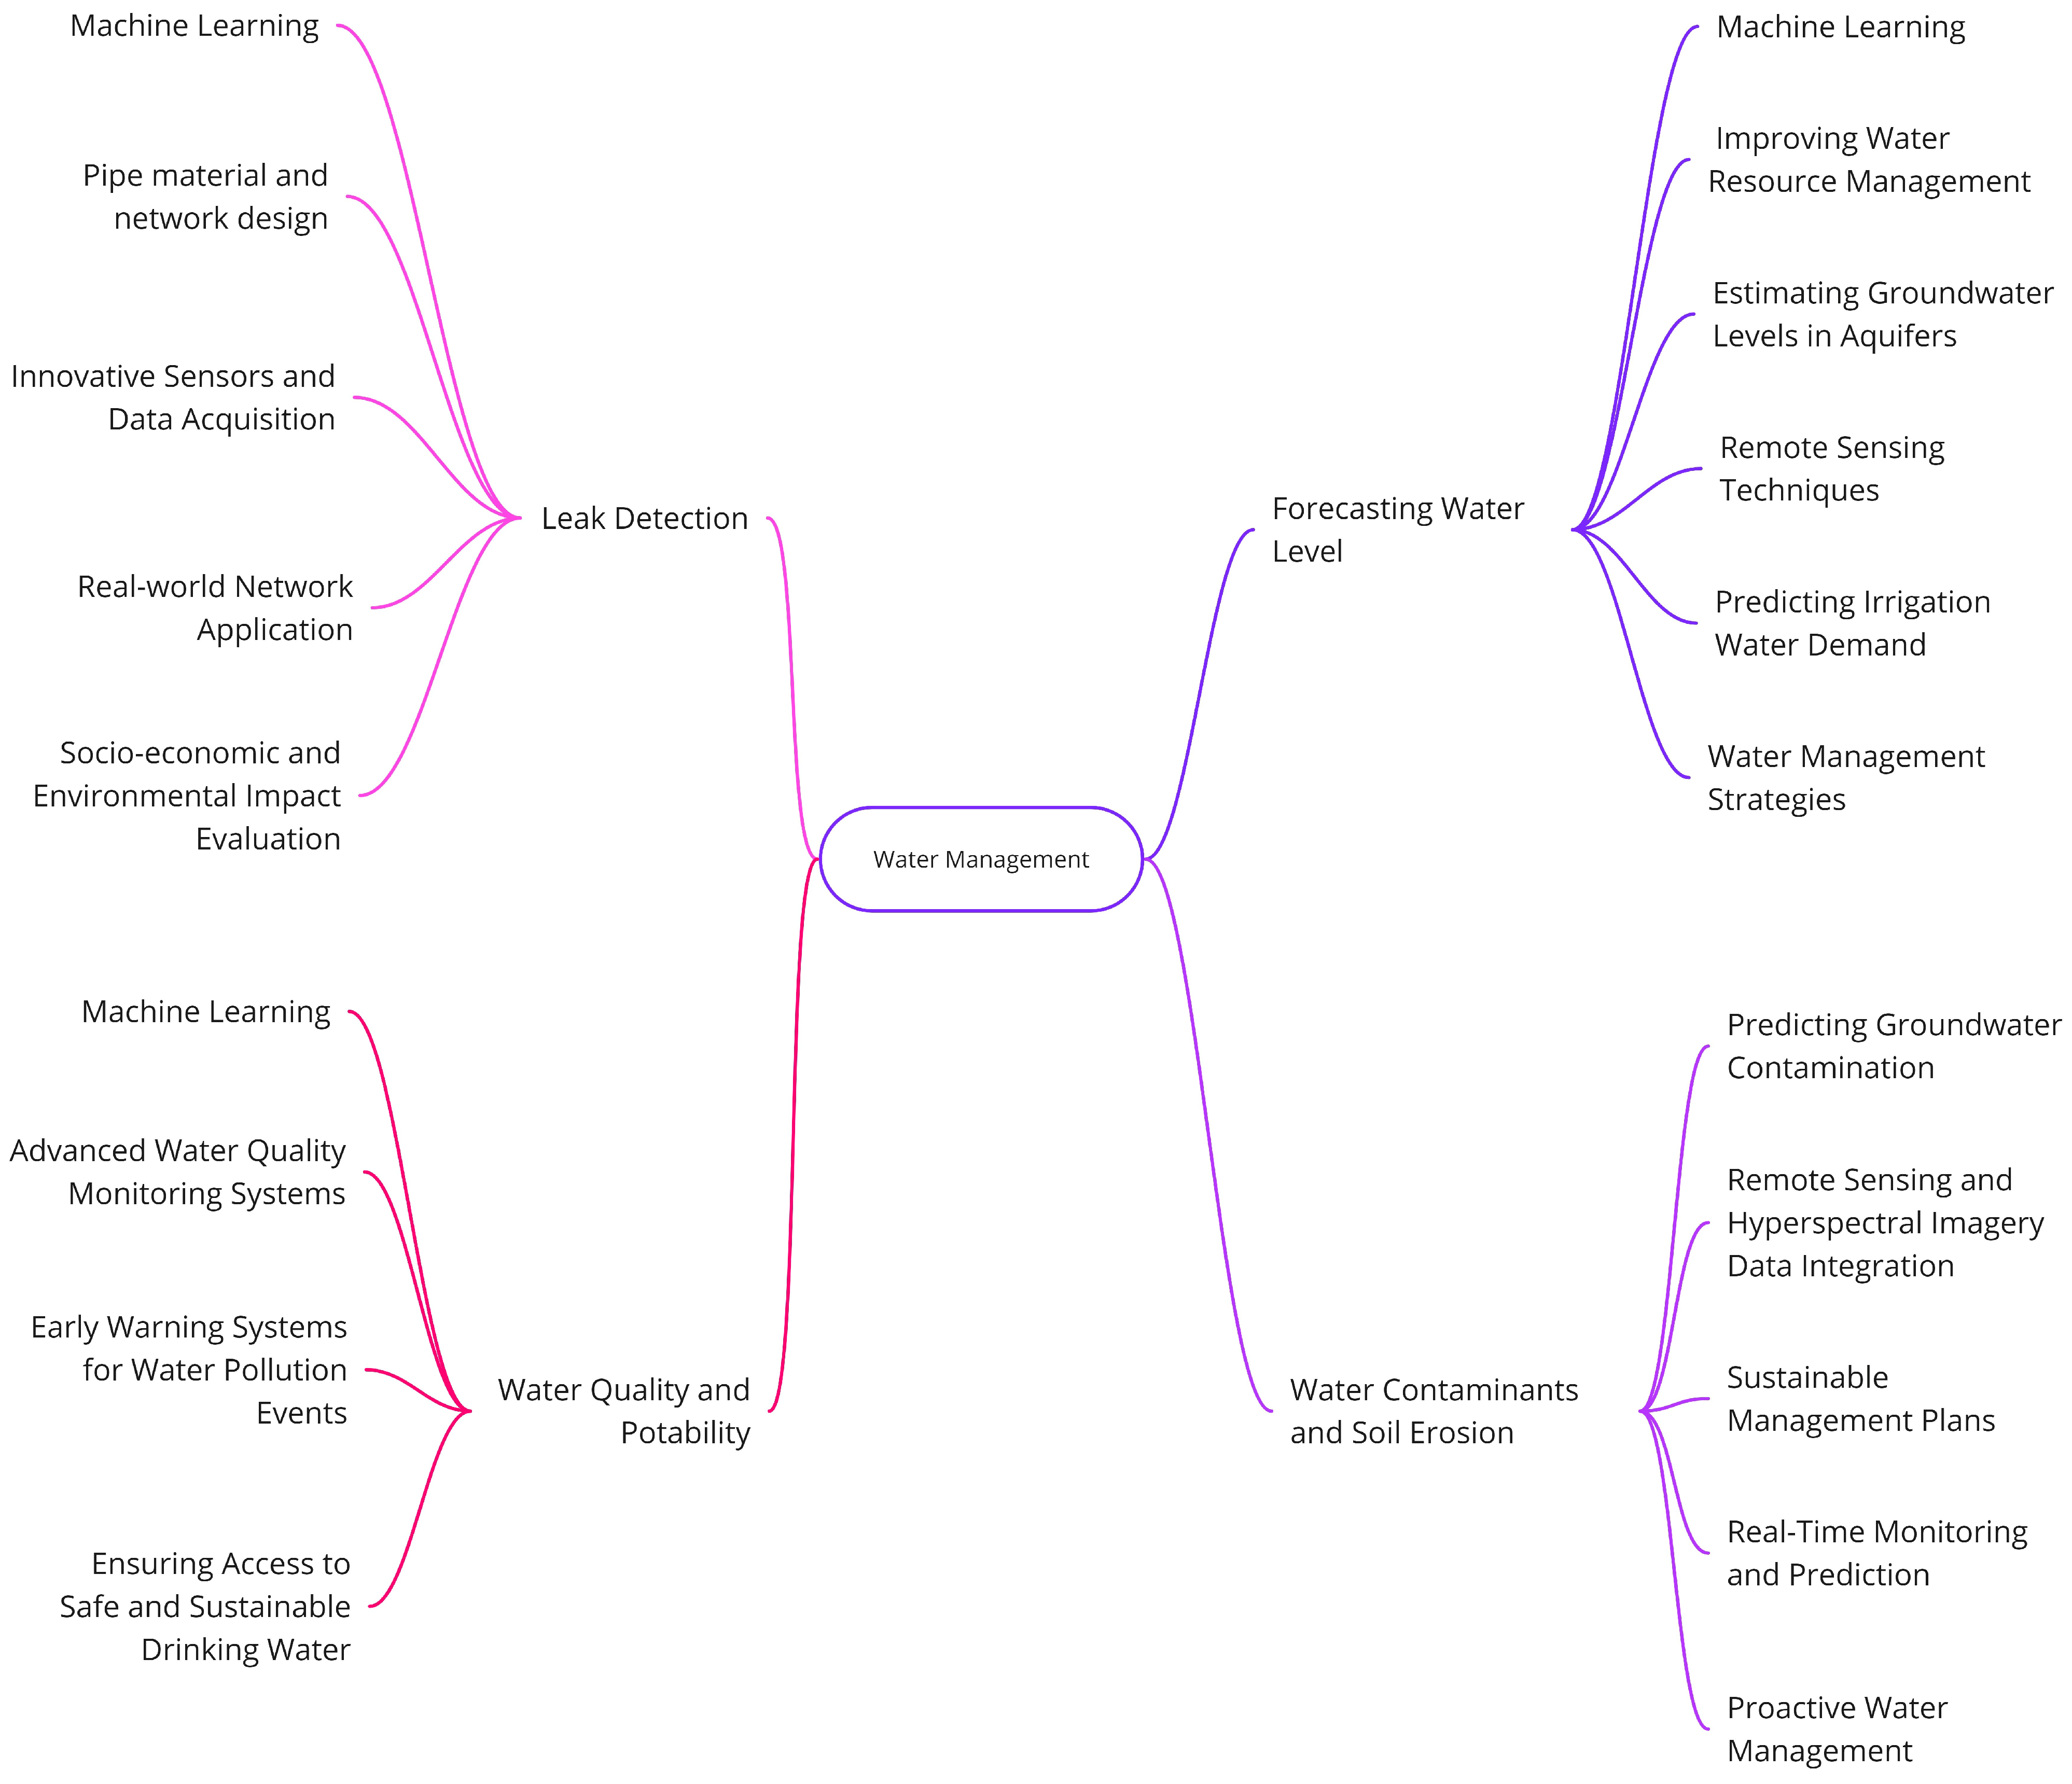
Disclaimer/Publisher’s Note: The statements, opinions and data contained in all publications are solely those of the individual author(s) and contributor(s) and not of MDPI and/or the editor(s). MDPI and/or the editor(s) disclaim responsibility for any injury to people or property resulting from any ideas, methods, instructions or products referred to in the content. |
© 2023 by the authors. Licensee MDPI, Basel, Switzerland. This article is an open access article distributed under the terms and conditions of the Creative Commons Attribution (CC BY) license (https://creativecommons.org/licenses/by/4.0/).