
Observation Capability Evaluation Model for Flood-Observation-Oriented Satellite Sensor Selection

 ,
,  and
and
Abstract
:1. Introduction
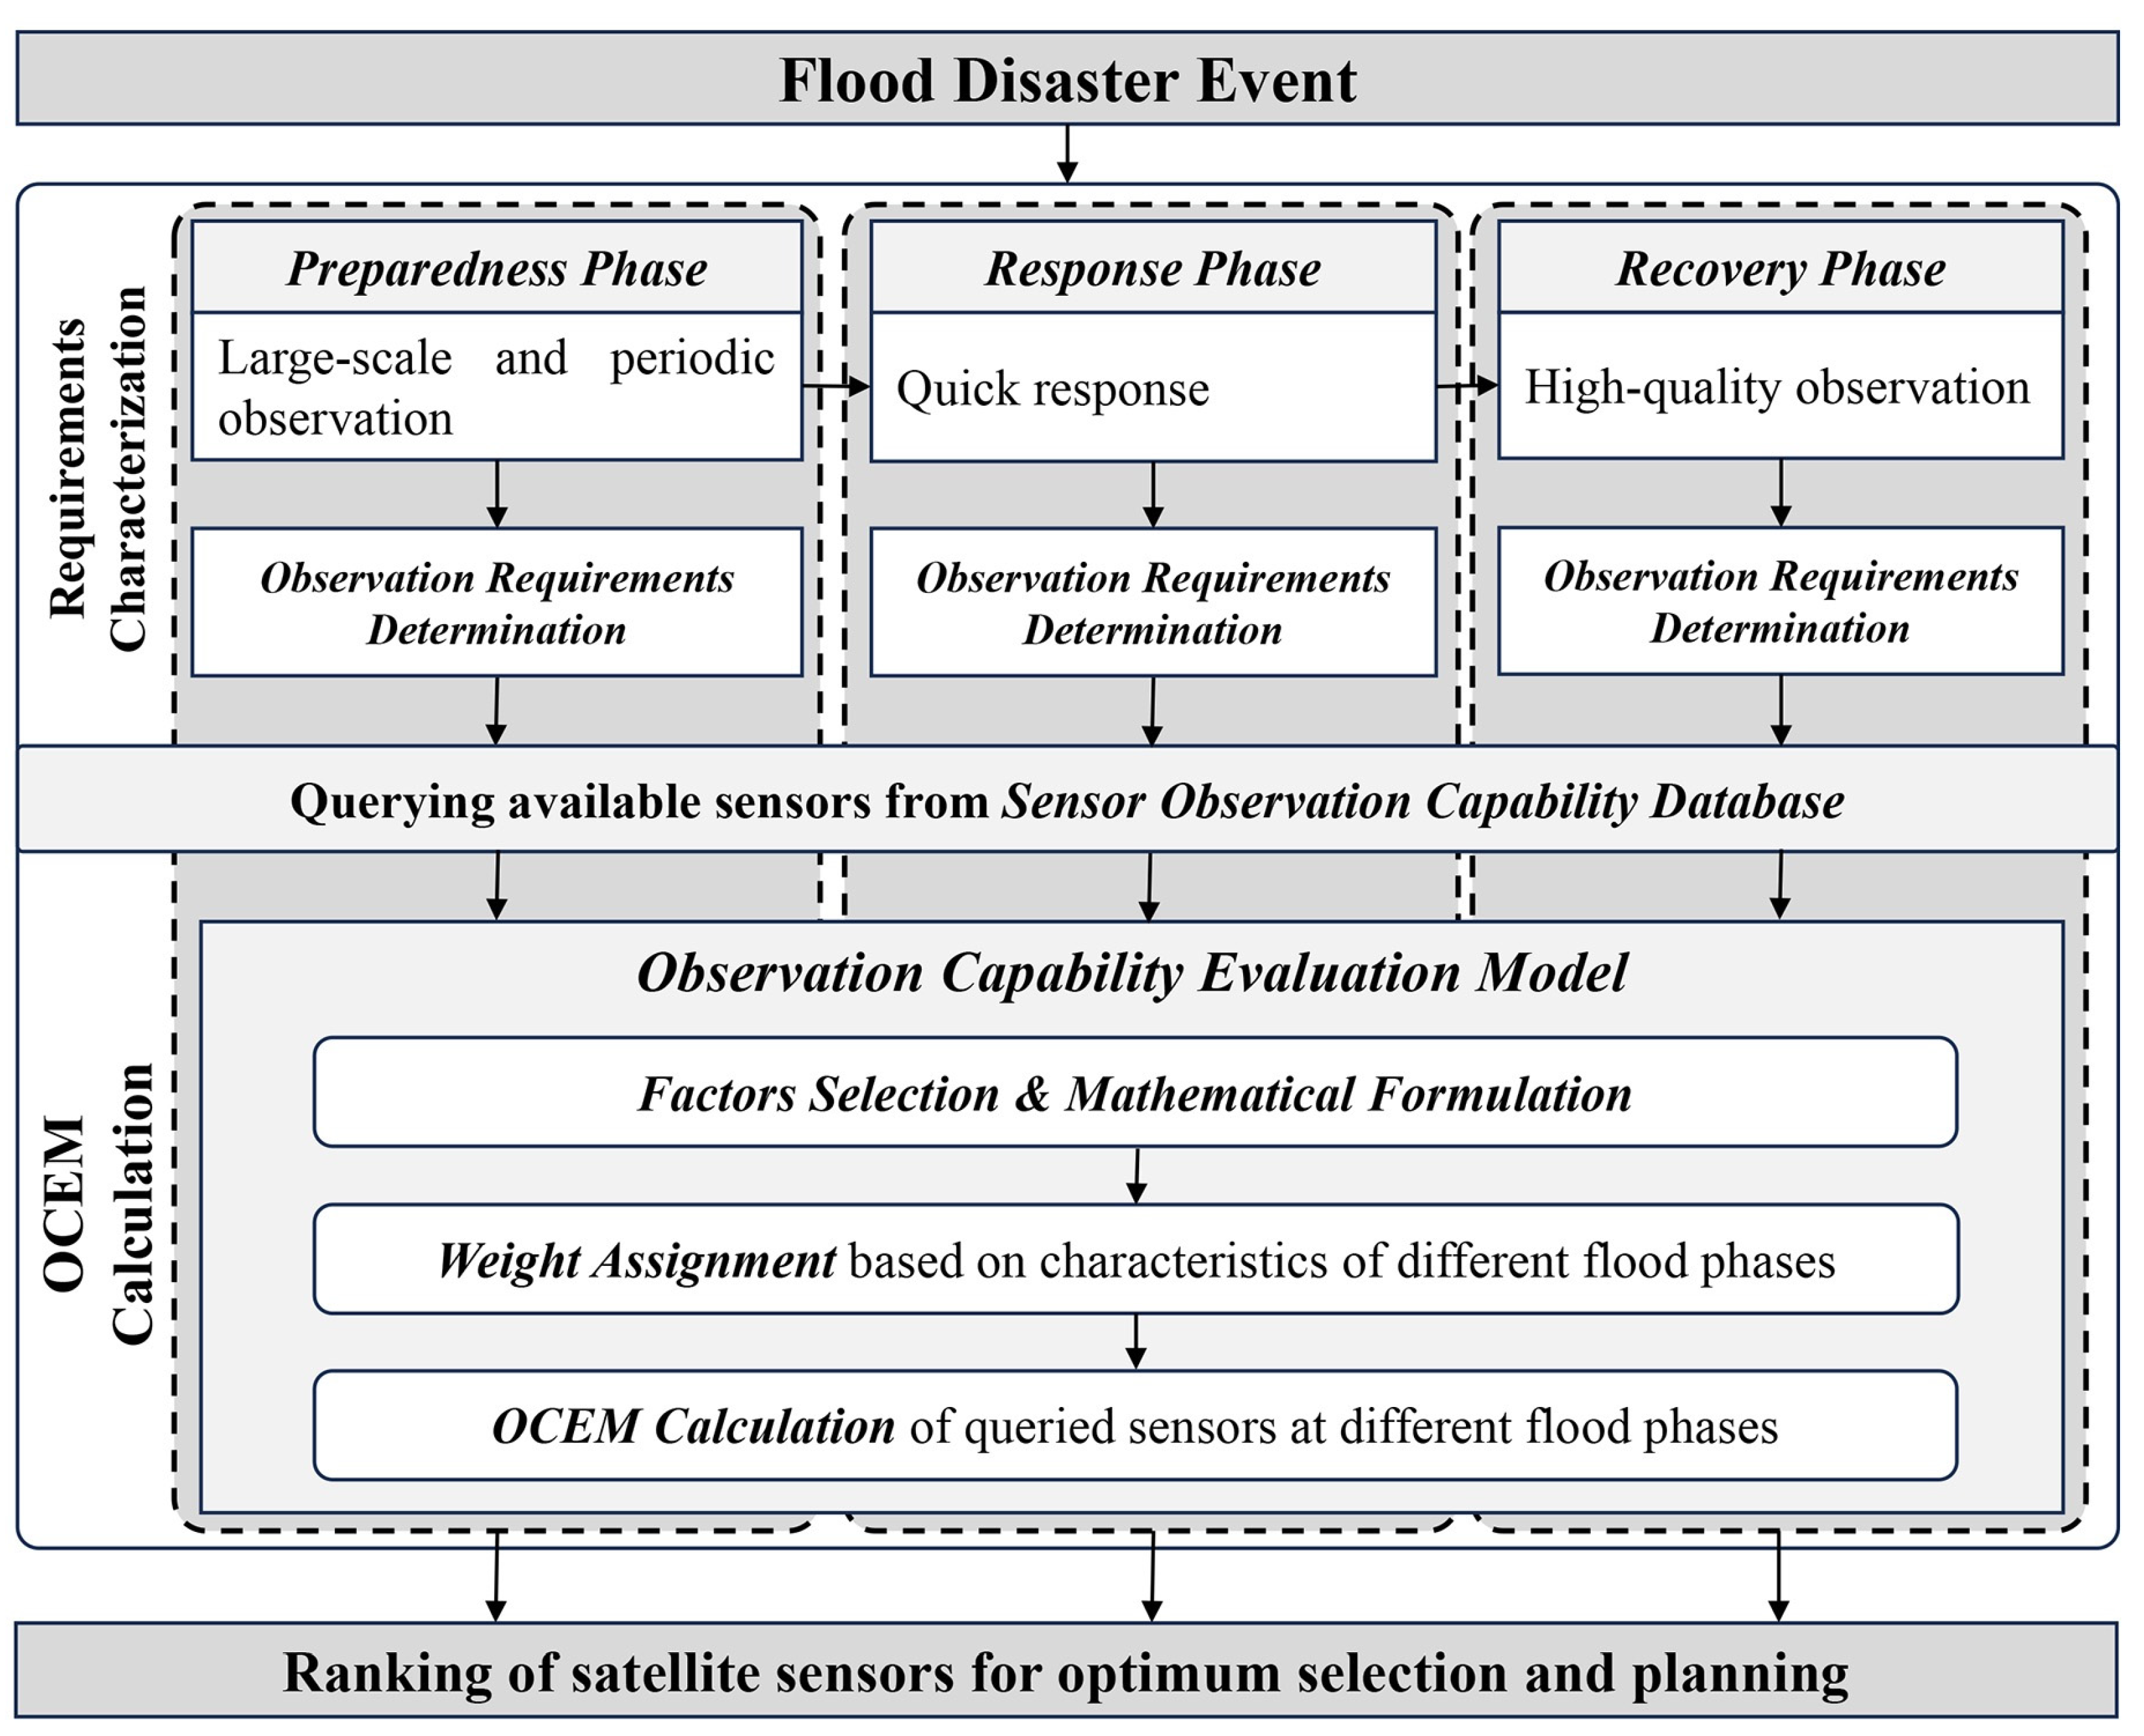
2. Methodology
2.1. Description of Flood Observation Satellite Sensor Selection Problem
2.2. OCEM Formalization
2.2.1. OCEM Framework
2.2.2. OCEM Formulation
2.3. OCEM Solving
2.3.1. Calculation of Observation Capability Factors
- SpCo: This can be calculated by using Equation (2), where is the sensor’s observation area and is the whole task area.
- TiCo: This can be calculated by using Equation (3), where is the sensor’s time window and is the task’s required time window.
- ThCo: This can be calculated by using Equations (4) and (5), where is the relevance degree of one specific observation parameter (e.g., land cover) to the flood, and is the number of the task’s required observation parameters. The relevance degrees are quantified into six values, which are sourced from the Observing System Capability Analysis and Review Tool (https://space.oscar.wmo.int/instruments (accessed on 1 September 2023)) released by the World Meteorological Organization.
- ReTi: This can be calculated by using Equation (6), where and are the start time and end time of the task, and is the time when the sensor can respond to the task.
- ReFc: This can be calculated by using Equation (7), where is the frequency of , and a higher frequency can result in a better observation performance theoretically.
- Observation quality: Observation quality is composed of four observation capability factors, namely, SpaRes, RadRes, SpeRes, and Pol. Each sensor only contains three of them because SpeRes only exists in optical sensors and Pol only exists in microwave sensors. Their detailed meanings and calculations are as follows:
- (1)
- SpaRes
This refers to the size of one pixel on the ground, which determines how detailed a satellite image is [38]. SpaRes can be calculated by using Equation (8), where is the task’s required spatial resolution, and is the spatial resolution of .- (2)
- RadRes
This reflects the capability of the sensor to recognize subtle changes in flood water radiation energy, which is represented by the radiometric quantization value of each image pixel [39]. RadRes can be obtained by using Equation (9), where is the radiometric quantization value of , and is the task’s required radiometric quantization value. A higher radiometric quantization value results in a better observation performance.- (3)
- SpeRes
This reflects the capability of the sensor to recognize spectral features of ground objects [40], and a higher spectral resolution (smaller wavelength interval) facilitates better observation of complex flood scenarios, such as flood water, vegetations, and houses. SpeRes can be calculated by using Equation (10), where is the task’s required spectral resolution, is the task’s required wavelength range, is the wavelength range of the sensor, and is the wavelength range intersection of the task and sensor.- (4)
- Pol
Different polarization modes cause different observation performance, for example, like polarization is more suitable for flood water identification when compared with cross-polarization [41,42], HH polarization is more effective than HV and VV polarization in recognizing the inundation area [43], and alternating polarization with co-polarization and cross-polarization is superior in flood mapping [44]. Consequently, on the basis of the review and analysis of related studies [43,45], Equation (11) is constructed to calculate Pol.
- EnIm: A flood event is always accompanied by bad weather (e.g., heavy rainfall and thick clouds), which can have a great impact on satellite sensors. Geographical environmental factors, such as atmospheric refraction and topography, also influence the observation quality to some extent [42]. However, the impacts caused by atmospheric refraction or topography can be reduced or eliminated by using some existing mathematical approaches and physical models [46,47]. The thick clouds can only be reduced by using external satellite images or ground observations [48,49], which conflicts with the goal of planning sensors to acquire observation data.
2.3.2. Weight Assignment of Observation Capability Factors
3. Flood-Water-Observation-Oriented Satellite Sensor Selection Experiment
3.1. Flood Event and Observation Task Requirements
3.2. Available Sensor Resources
3.3. OCEM Calculation for Supporting Satellite Sensor Selection
3.3.1. Calculation and Results of Observation Capability Factors
3.3.2. Weights Calculation and Results
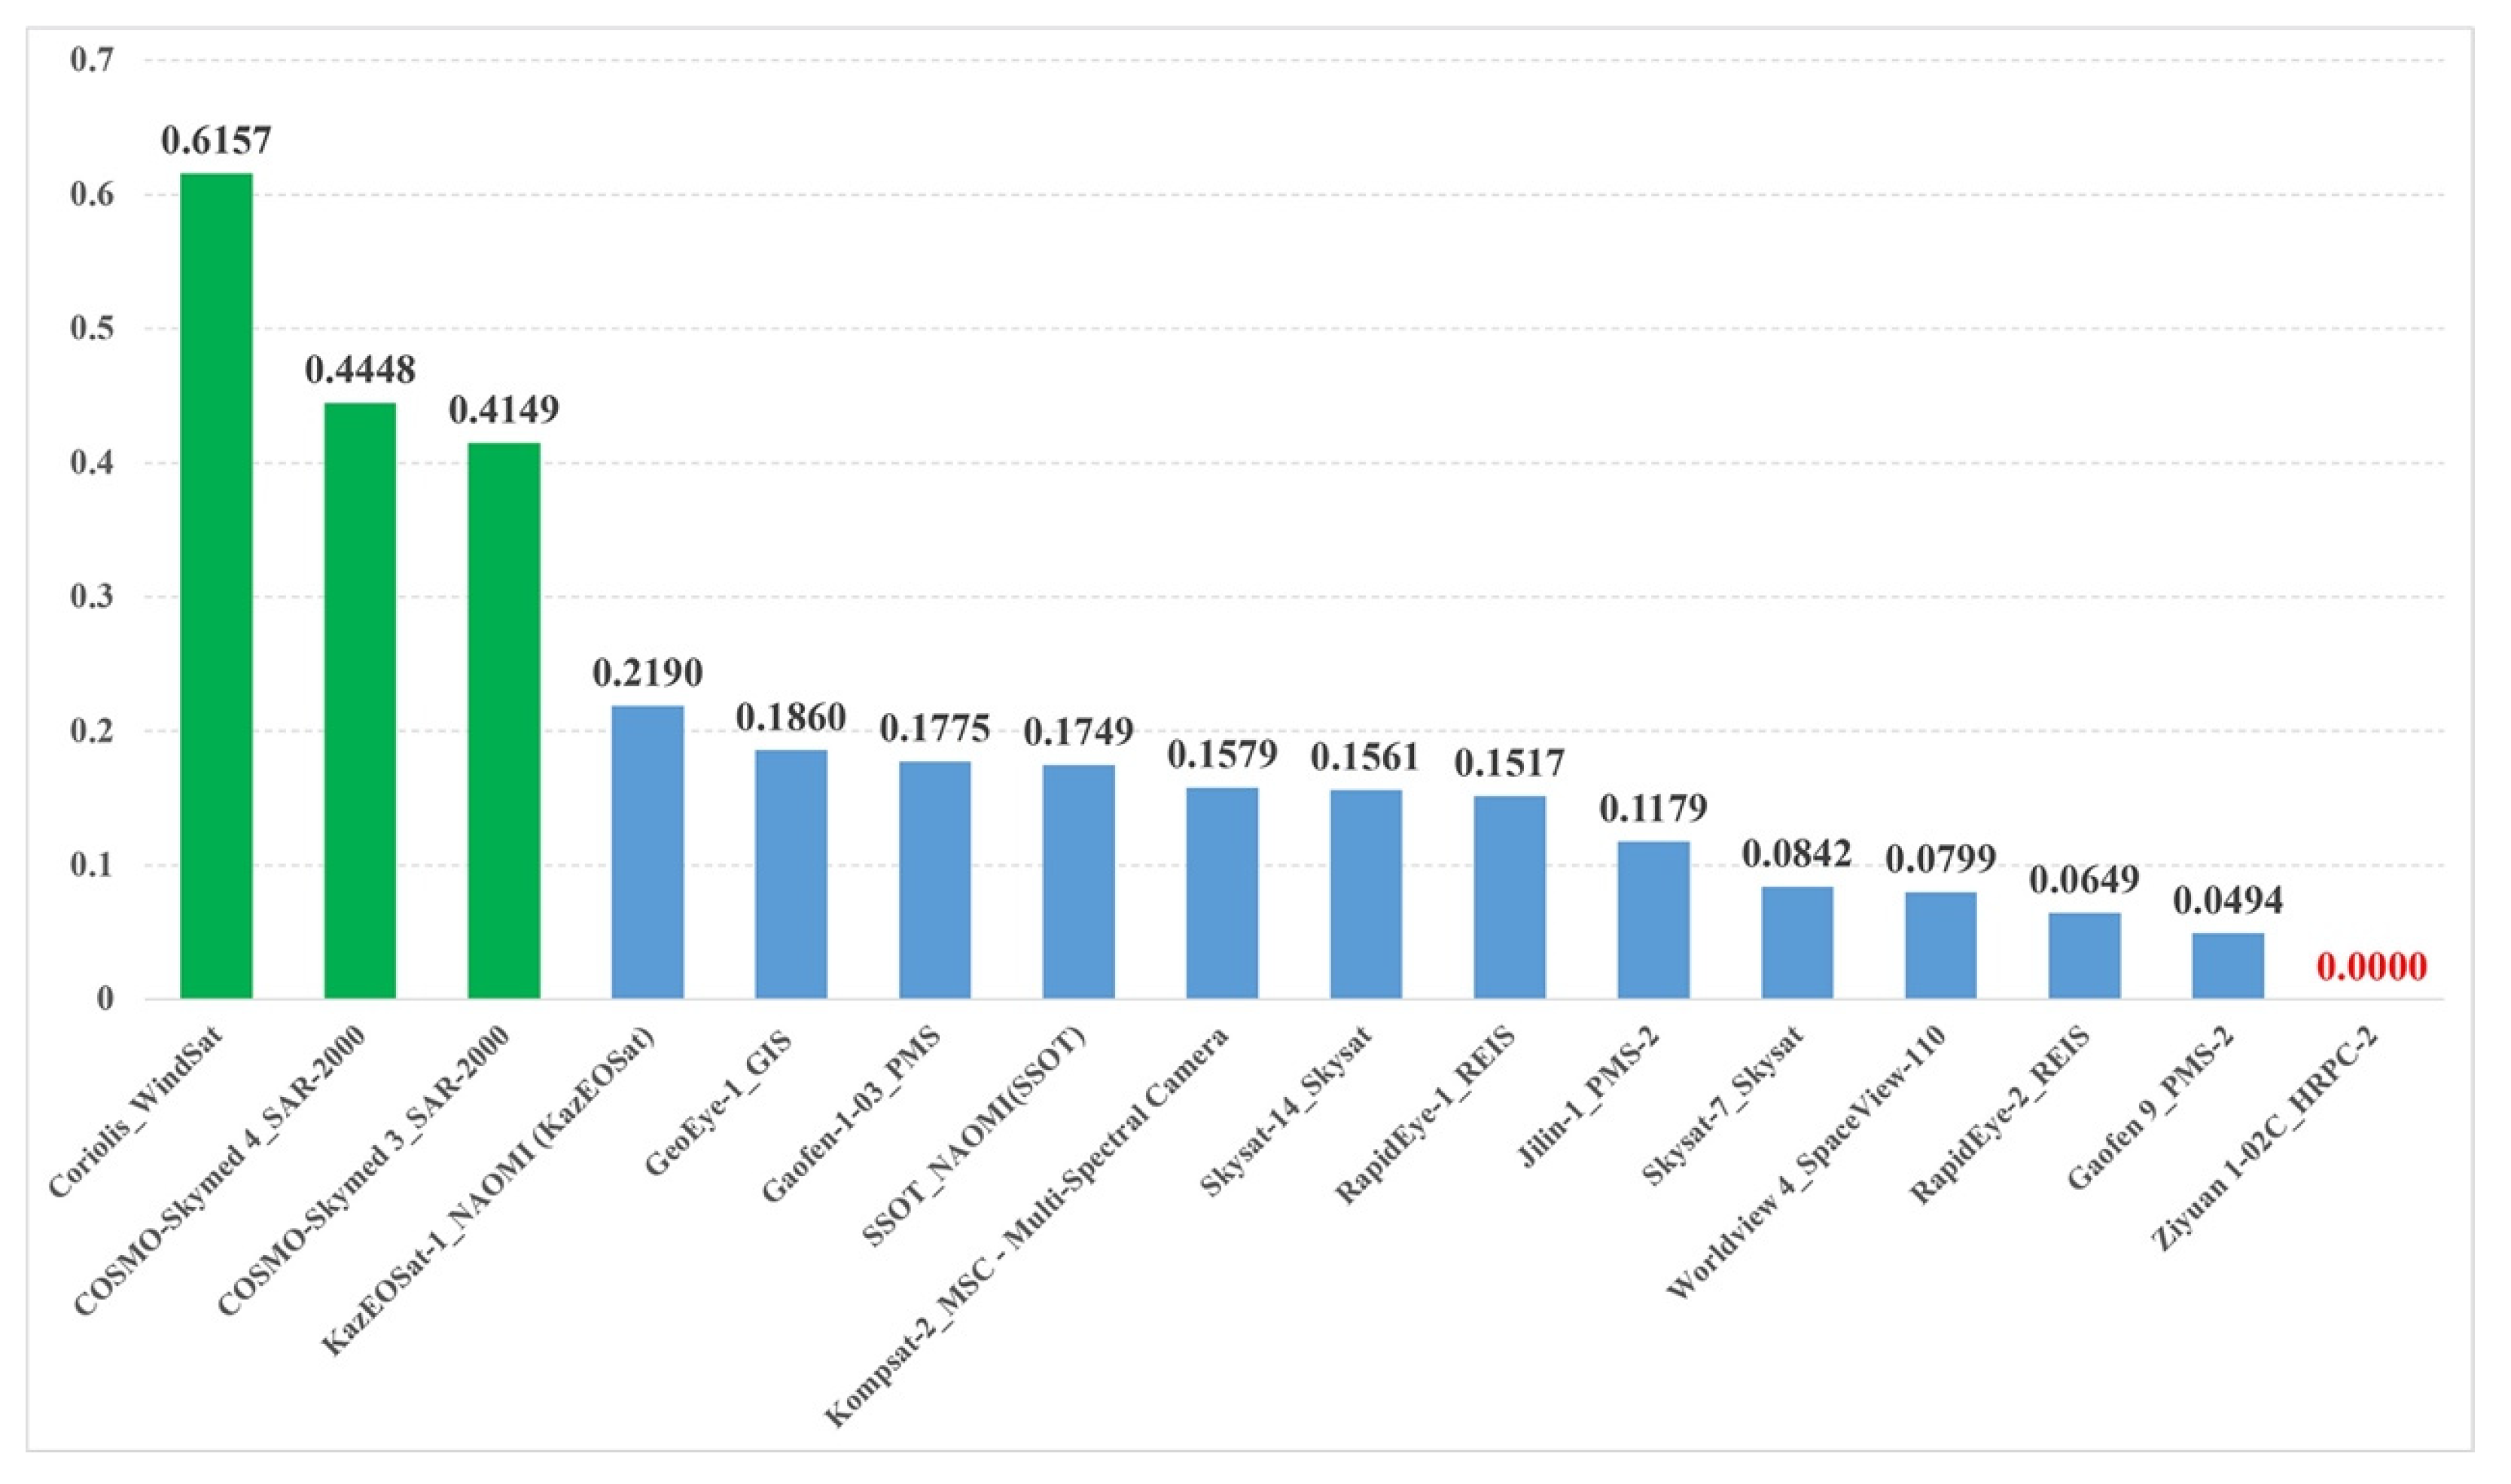
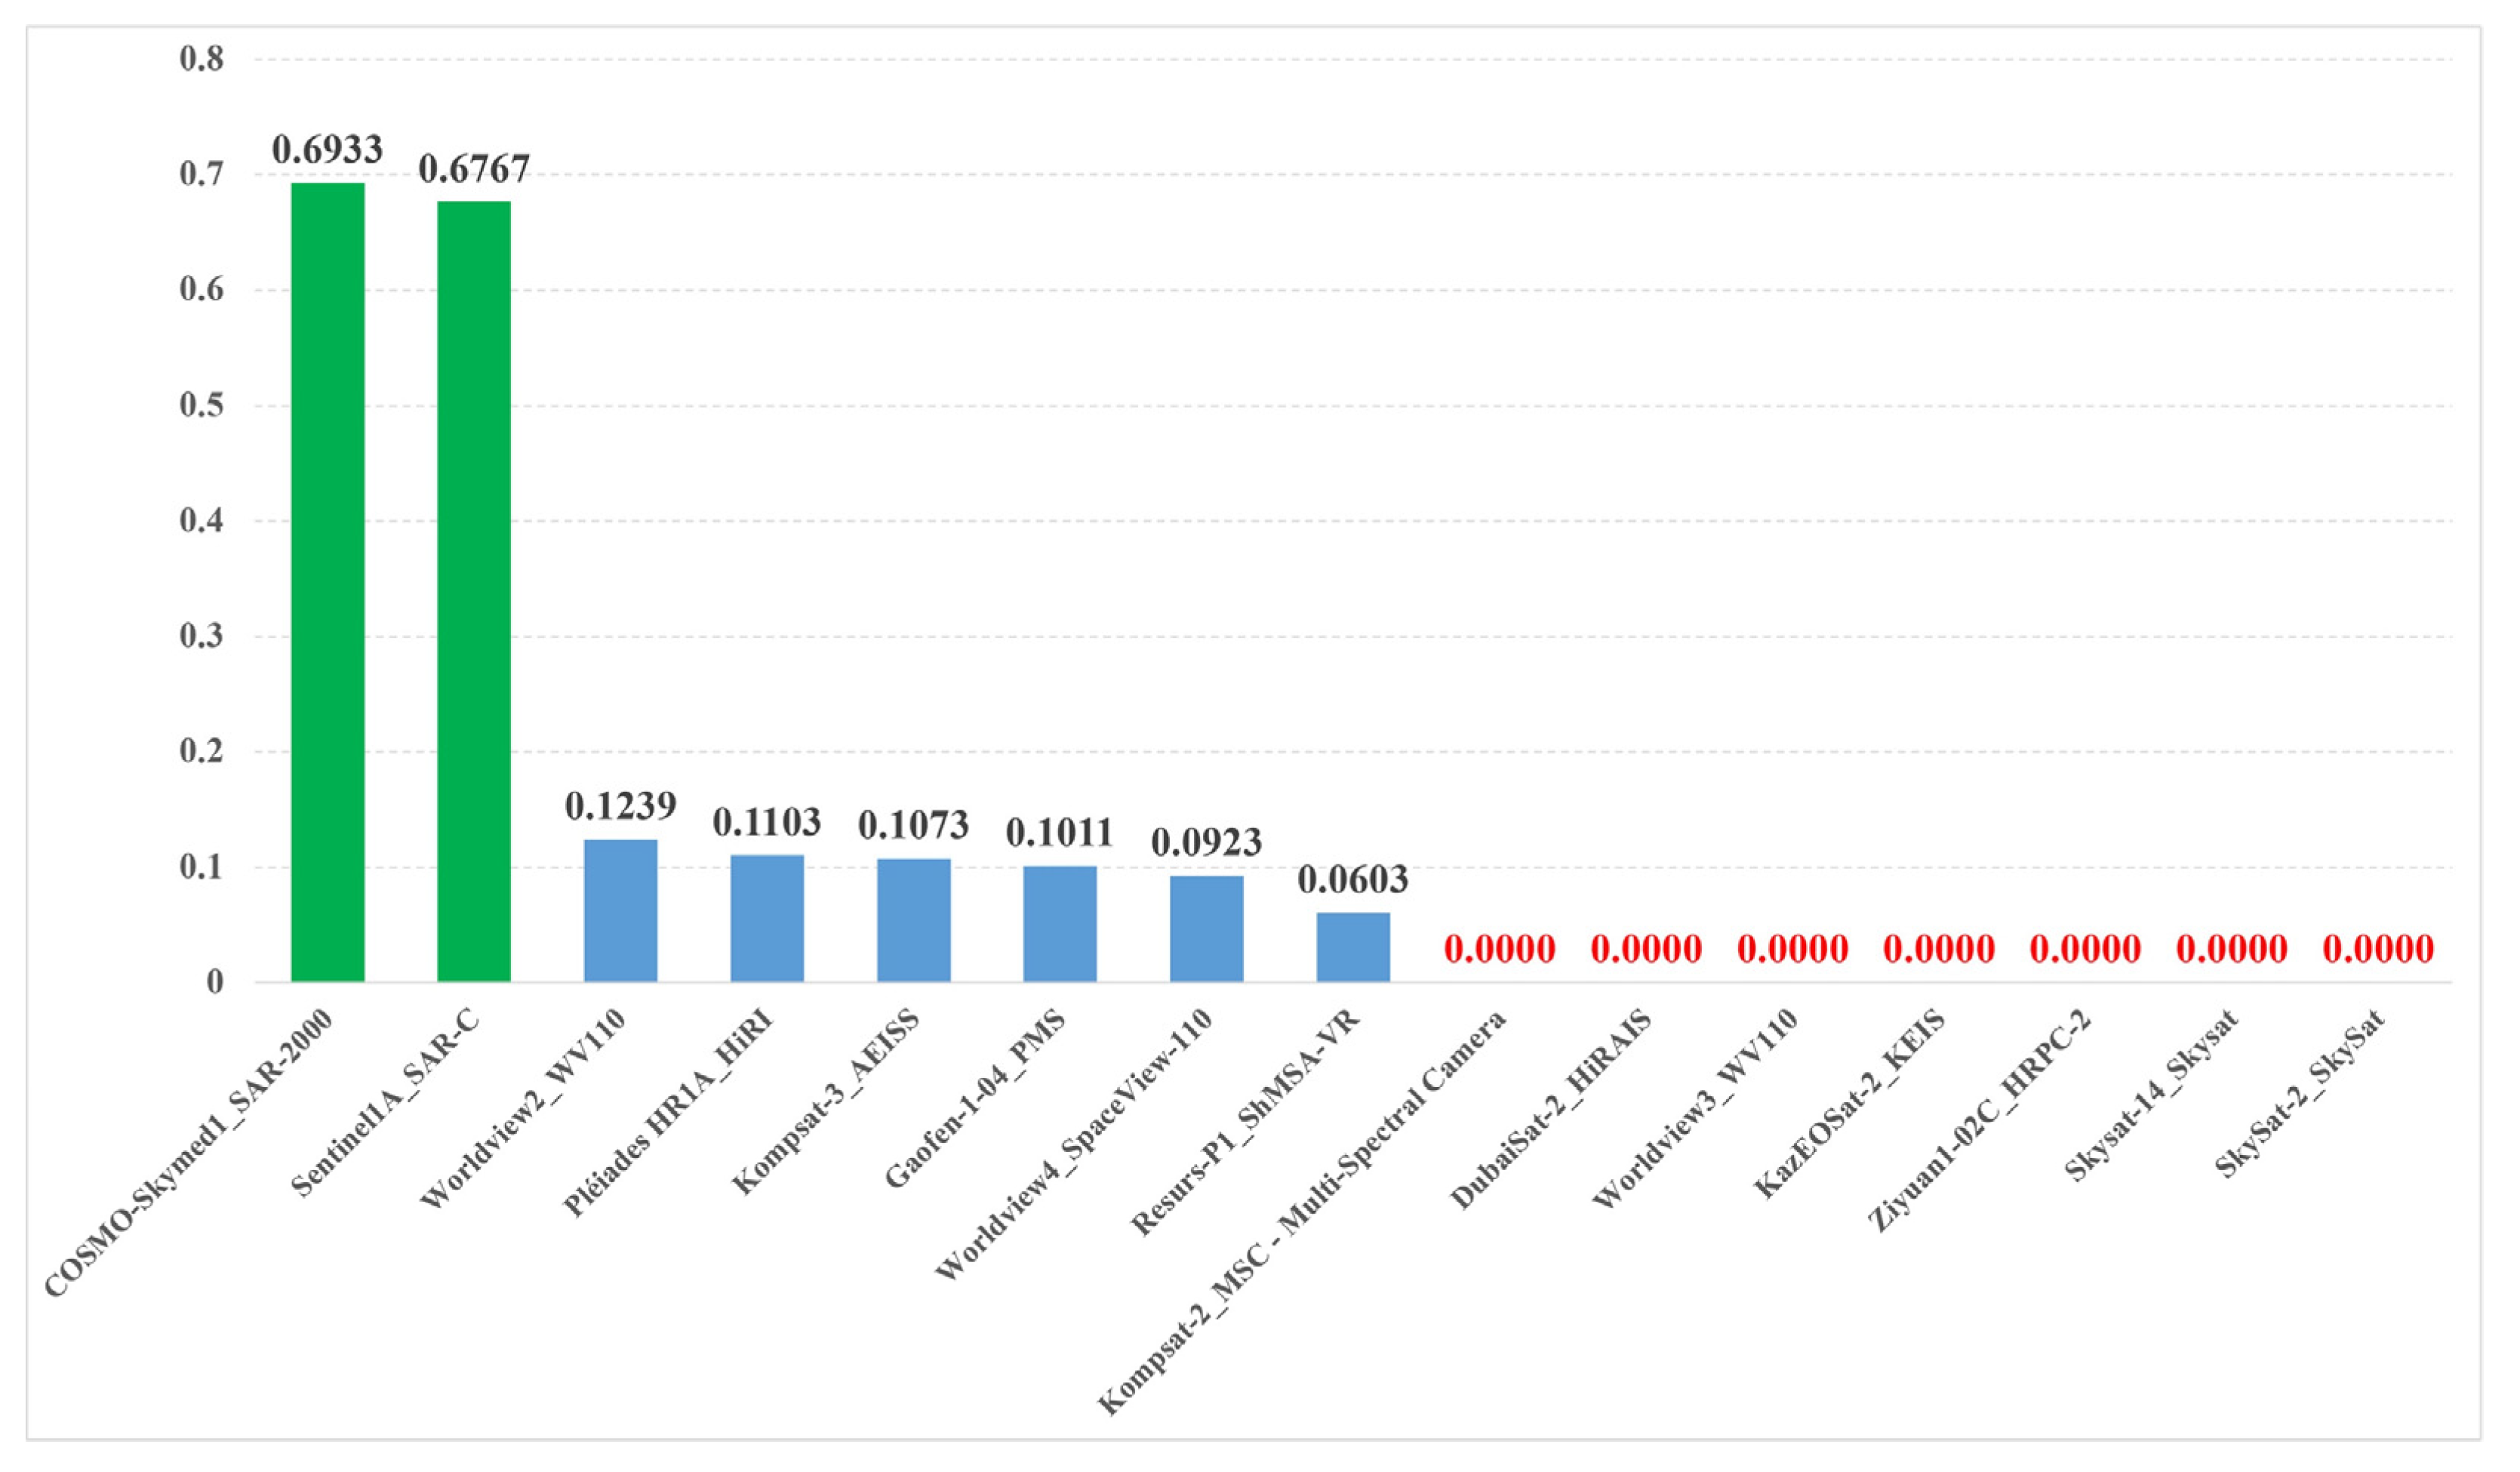
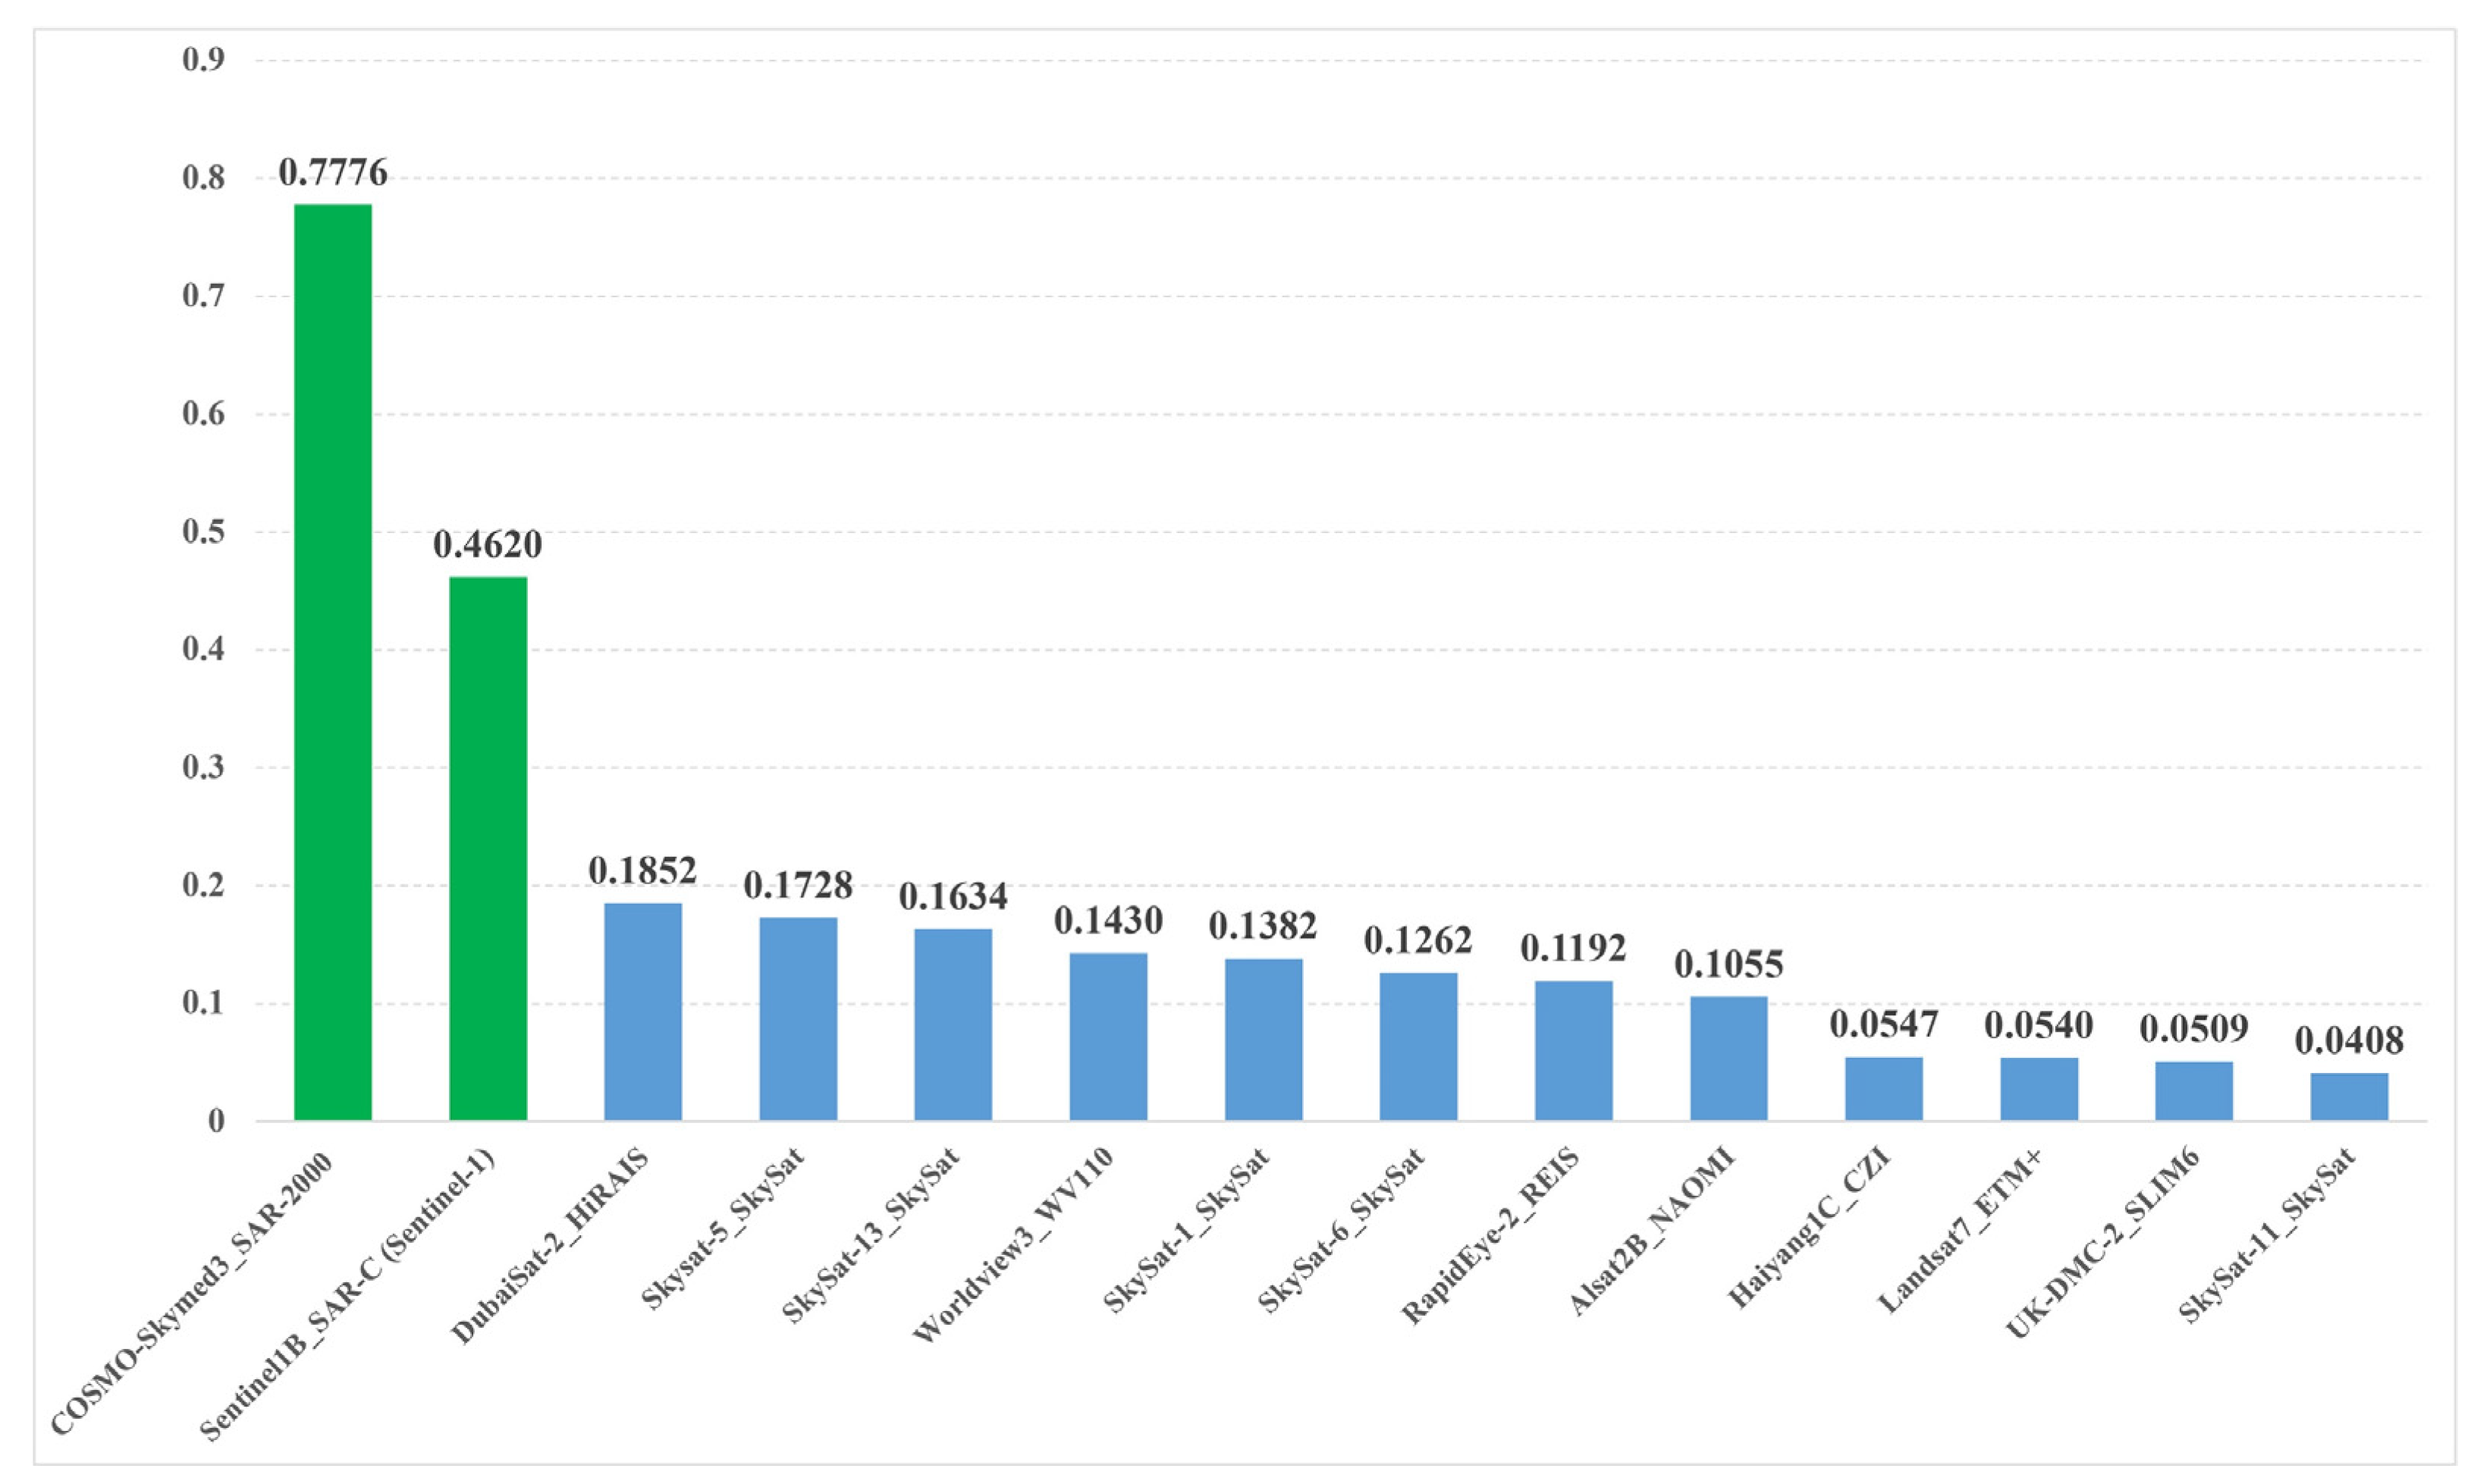
3.3.3. OCEM Calculation and Results
4. Discussion
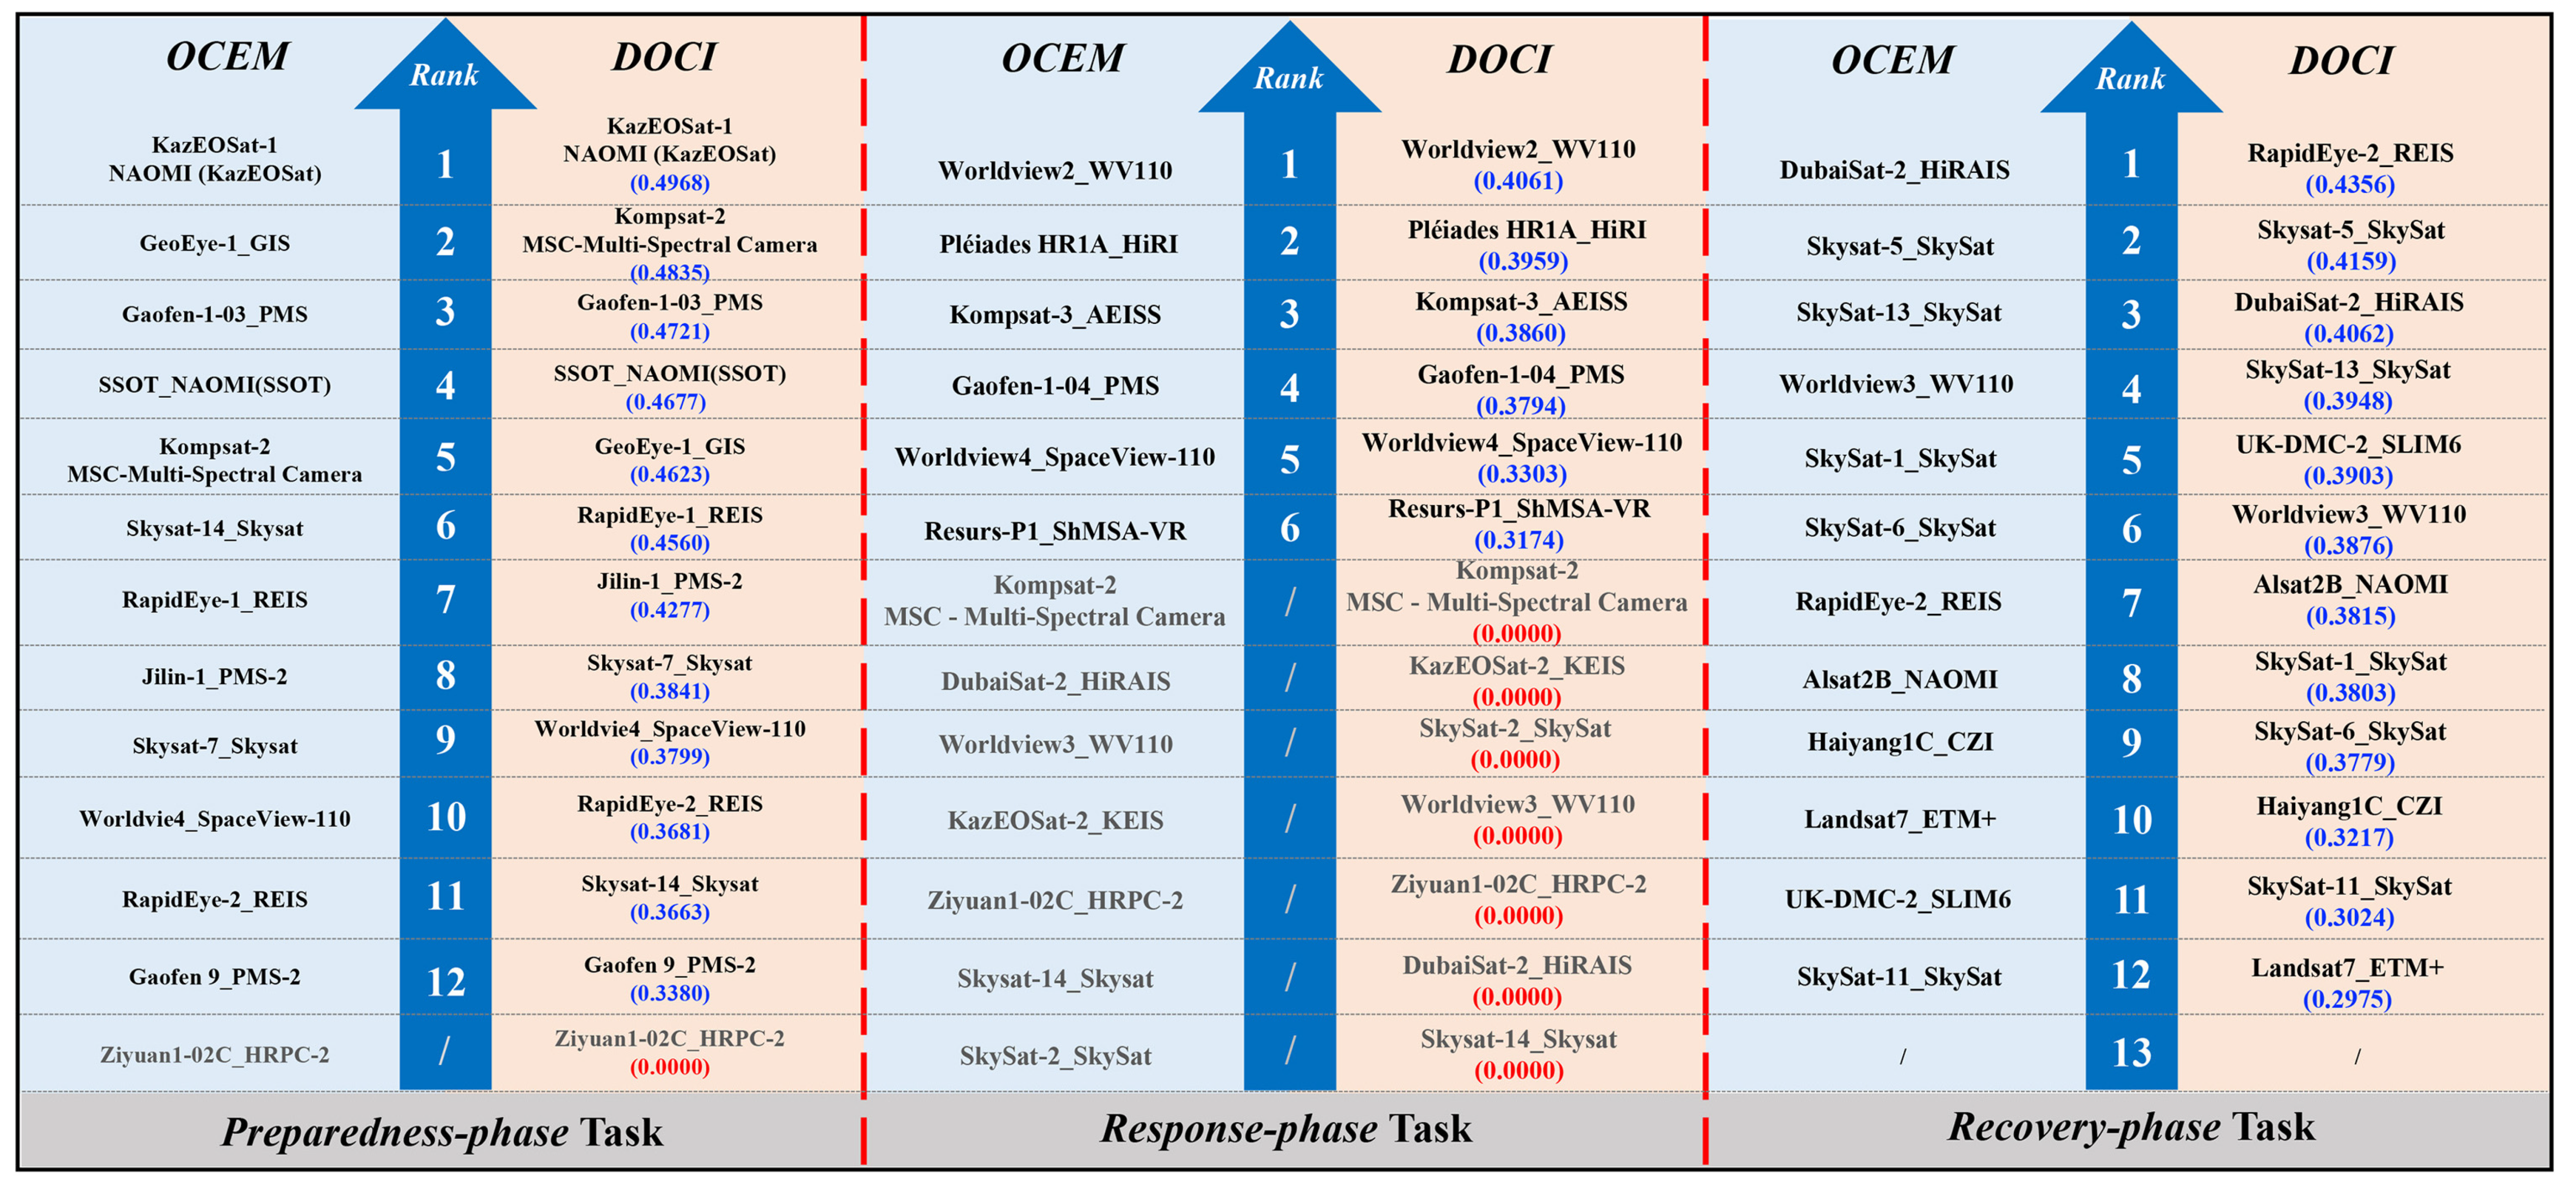
4.1. Supporting the Optimum Satellite Sensor Selection for Flood Observation
4.2. Superiority of OCEM
5. Conclusions and Future Research
Author Contributions
Funding
Institutional Review Board Statement
Informed Consent Statement
Data Availability Statement
Conflicts of Interest
List of Abbreviations
| OCEM | Observation capability evaluation model |
| EA | Experiment of application |
| CA | Capability analysis |
| SAR | Synthetic Aperture Radar |
| XPAR | X-band phased-array meteorological radar |
| DOCI | Dynamic observation capability index |
| CWRC | Changjiang Water Resource Commission |
| SpCo | Spatial coverage |
| TiCo | Time coverage |
| ThCo | Theme conformity |
| ReTi | Response timeliness |
| ReFc | Revisit frequency |
| EnIm | Environment impact |
| SpaRes | Spatial resolution conformity |
| SpeRes | Spectral resolution conformity |
| Pol | Polarization mode conformity |
| RadRes | Radiation resolution conformity |
| AHP | Analytic hierarchy process |
| OSCAR | Observing System Capability Analysis and Review Tool |
| WWO | World Weather Online |
| SOCDB | Sensor observation capability database |
| SSCI | Sensor static capability index |
| SOCA Ontology | Sensor observation capability association ontology |
| SOCO-Field | Sensor observation capability object field |
| SSOCEM | Star sensor observation capability evaluation model |
| EOPEM | Earth observation potential evaluation model |
| SBSM | Sensor band selection method |
References
- Kundzewicz, Z.W.; Huang, J.; Pinskwar, I.; Su, B.; Szwed, M.; Jiang, T. Climate Variability and Floods in China-A Review. Earth-Sci. Rev. 2020, 211, 103434. [Google Scholar] [CrossRef]
- Maranzoni, A.; D’Oria, M.; Rizzo, C. Quantitative Flood Hazard Assessment Methods: A Review. J. Flood Risk Manag. 2022, 16, e12855. [Google Scholar] [CrossRef]
- Yu, Q.; Wang, Y.; Li, N. Extreme Flood Disasters: Comprehensive Impact and Assessment. Water 2022, 14, 1211. [Google Scholar] [CrossRef]
- Chan, J.K.H.; Liao, K.-H. The Normative Dimensions of Flood Risk Management: Two Types of Flood Harm. J. Flood Risk Manag. 2022, 15, e12798. [Google Scholar] [CrossRef]
- Iliadis, C.; Glenis, V.; Kilsby, C. Cloud Modelling of Property-Level Flood Exposure in Megacities. Water 2023, 15, 3395. [Google Scholar] [CrossRef]
- Xiong, J.; Yin, J.; Guo, S.; Gu, L.; Xiong, F.; Li, N. Integrated Flood Potential Index for Flood Monitoring in the GRACE Era. J. Hydrol. 2021, 603, 127115. [Google Scholar] [CrossRef]
- Zhang, X.; Chen, N.; Chen, Z.; Wu, L.; Li, X.; Zhang, L.; Di, L.; Gong, J.; Li, D. Geospatial Sensor Web: A Cyber-Physical Infrastructure for Geoscience Research and Application. Earth-Sci. Rev. 2018, 185, 684–703. [Google Scholar] [CrossRef]
- Hu, C.; Tian, L.; Li, J.; Wang, K.; Chen, N. An Observation Capability Information Association Model for Multisensor Observation Integration Management: A Flood Observation Use Case in the Yangtze River Basin. IEEE Sens. J. 2019, 19, 11510–11525. [Google Scholar] [CrossRef]
- Sacaleanu, D.I.; Adamescu, M.; Faur, D.; Cazacu, C.; Florea, B.C.; Griparis, A.; Racoviceanu, T.; Giuca, R. Integrated Platform for Ecosystems Monitoring Based on Remote and in Situ Measurements. In Proceedings of the IGARSS 2020—2020 IEEE International Geoscience and Remote Sensing Symposium, Waikoloa, HI, USA, 26 September–2 October 2020. [Google Scholar]
- Bartolini, S.; Mecocci, A.; Pozzebon, A.; Zoppetti, C.; Bertoni, D.; Sarti, G.; Caiti, A.; Costanzi, R.; Catani, F.; Ciampalini, A.; et al. Augmented Virtuality for Coastal Management: A Holistic Use of In Situ and Remote Sensing for Large Scale Definition of Coastal Dynamics. ISPRS Int. J. Geo-Inf. 2018, 7, 92. [Google Scholar] [CrossRef]
- Farhadi, H.; Esmaeily, A.; Najafzadeh, M. Flood Monitoring by Integration of Remote Sensing Technique and Multi-Criteria Decision Making Method. Comput. Geosci. 2022, 160, 105045. [Google Scholar] [CrossRef]
- Thakur, P.K.; Ranjan, R.; Singh, S.; Dhote, P.R.; Sharma, V.; Srivastav, V.; Dhasmana, M.; Aggarwal, S.P.; Chauhan, P.; Nikam, B.R.; et al. Synergistic Use of Remote Sensing, GIS and Hydrological Models for Study of August 2018 Kerala Floods. Int. Arch. Photogramm. Remote Sens. Spat. Inf. Sci. 2020, XLIII-B3-2, 1263–1270. [Google Scholar] [CrossRef]
- Zhu, W.; Cao, Z.; Luo, P.; Tang, Z.; Zhang, Y.; Hu, M.; He, B. Urban Flood-Related Remote Sensing: Research Trends, Gaps and Opportunities. Remote Sens. 2022, 14, 5505. [Google Scholar] [CrossRef]
- Mohanta, N. How Many Satellites Are Orbiting the Earth in 2021. Available online: https://www.geospatialworld.net/blogs/how-many-satellites-are-orbiting-the-earth-in-2021/ (accessed on 24 September 2023).
- Hu, C.; Li, J.; Xiao, C.; Wang, K.; Chen, N. SOCO-Field: Observation Capability Representation for GeoTask-Oriented Multi-Sensor Planning Cognition. Int. J. Geogr. Inf. Sci. 2020, 34, 205–228. [Google Scholar] [CrossRef]
- Refice, A.; Zingaro, M.; D’Addabbo, A.; Chini, M. Integrating C- and L-Band SAR Imagery for Detailed Flood Monitoring of Remote Vegetated Areas. Water 2020, 12, 2475. [Google Scholar] [CrossRef]
- Hu, Q.; Zhu, Y.; Hu, H.; Guan, Z.; Qian, Z.; Yang, A. Multiple Kernel Learning with Maximum Inundation Extent from MODIS Imagery for Spatial Prediction of Flood Susceptibility. Water Resour. Manag. 2022, 36, 55–73. [Google Scholar] [CrossRef]
- Ban, H.-J.; Kwon, Y.-J.; Shin, H.; Ryu, H.-S.; Hong, S. Flood Monitoring Using Satellite-Based RGB Composite Imagery and Refractive Index Retrieval in Visible and Near-Infrared Bands. Remote Sens. 2017, 9, 313. [Google Scholar] [CrossRef]
- Rahman, R.; Thakur, P.K. Detecting, Mapping and Analysing of Flood Water Propagation Using Synthetic Aperture Radar (SAR) Satellite Data and GIS: A Case Study from the Kendrapara District of Orissa State of India. Egypt. J. Remote Sens. Space Sci. 2018, 21, s37–s41. [Google Scholar] [CrossRef]
- Franci, F.; Bitelli, G.; Mandanici, E.; Hadjimitsis, D.; Agapiou, A. Satellite Remote Sensing and GIS-Based Multi-Criteria Analysis for Flood Hazard Mapping. Nat. Hazards 2016, 83, 31–51. [Google Scholar] [CrossRef]
- Nanda, T.; Sahoo, B.; Beria, H.; Chatterjee, C. A Wavelet-Based Non-Linear Autoregressive with Exogenous Inputs (WNARX) Dynamic Neural Network Model for Real-Time Flood Forecasting Using Satellite-Based Rainfall Products. J. Hydrol. 2016, 539, 57–73. [Google Scholar] [CrossRef]
- Tekeli, A.E.; Fouli, H. Evaluation of TRMM Satellite-Based Precipitation Indexes for Flood Forecasting over Riyadh City, Saudi Arabia. J. Hydrol. 2016, 541, 471–479. [Google Scholar] [CrossRef]
- Mason, D.C.; Bevington, J.; Dance, S.L.; Revilla-Romero, B.; Smith, R.; Vetra-Carvalho, S.; Cloke, H.L. Improving Urban Flood Mapping by Merging Synthetic Aperture Radar-Derived Flood Footprints with Flood Hazard Maps. Water 2021, 13, 1577. [Google Scholar] [CrossRef]
- Li, X.-M.; Zhang, T.; Huang, B.; Jia, T. Capabilities of Chinese Gaofen-3 Synthetic Aperture Radar in Selected Topics for Coastal and Ocean Observations. Remote Sens. 2018, 10, 1929. [Google Scholar] [CrossRef]
- Chen, N.; Xing, C.; Zhang, X.; Zhang, L.; Gong, J. Spaceborne Earth-Observing Optical Sensor Static Capability Index for Clustering. IEEE Trans. Geosci. Remote Sens. 2015, 53, 5504–5518. [Google Scholar] [CrossRef]
- Casella, D.; Panegrossi, G.; Sanò, P.; Marra, A.C.; Dietrich, S.; Johnson, B.T.; Kulie, M.S. Evaluation of the GPM-DPR Snowfall Detection Capability: Comparison with CloudSat-CPR. Atmos. Res. 2017, 197, 64–75. [Google Scholar] [CrossRef]
- Wu, C.; Liu, L. Comparison of the Observation Capability of an X-Band Phased-Array Radar with an X-Band Doppler Radar and S-Band Operational Radar. Adv. Atmos. Sci. 2014, 31, 814–824. [Google Scholar] [CrossRef]
- Yokota, Y.; Ishikawa, T.; Watanabe, S.; Nakamura, Y. Crustal Deformation Detection Capability of the GNSS-A Seafloor Geodetic Observation Array (SGO-A), Provided by Japan Coast Guard. Prog. Earth Planet. Sci. 2021, 8, 63. [Google Scholar] [CrossRef]
- Chen, N.; Zhang, X. A Dynamic Observation Capability Index for Quantitatively Pre-Evaluating Diverse Optical Imaging Satellite Sensors. IEEE J. Sel. Top. Appl. Earth Obs. Remote Sens. 2014, 7, 515–530. [Google Scholar] [CrossRef]
- Liu, X.; Laporte, G.; Chen, Y.; He, R. An Adaptive Large Neighborhood Search Metaheuristic for Agile Satellite Scheduling with Time-Dependent Transition Time. Comput. Oper. Res. 2017, 86, 41–53. [Google Scholar] [CrossRef]
- Zhang, S.; Xiao, Y.; Yang, P.; Liu, Y.; Chang, W.; Zhou, S. An Effectiveness Evaluation Model for Satellite Observation and Data-Downlink Scheduling Considering Weather Uncertainties. Remote Sens. 2019, 11, 1621. [Google Scholar] [CrossRef]
- Chen, B.; Zheng, Y.; Xu, B.; Li, C.; Ge, F. An Evaluation Model of Star Sensor Observation Capability under Hypersonic Aerothermal Conditions. IEEE Access 2023, 11, 646–654. [Google Scholar] [CrossRef]
- Jin, M.; Lin, M.; Liu, Y.; Bai, Y. An Earth Observation Potential Evaluation Model and Its Application to SDG Indicators. Int. J. Digit. Earth 2022, 15, 1187–1203. [Google Scholar] [CrossRef]
- Ficchì, A.; Perrin, C.; Andréassian, V. Impact of Temporal Resolution of Inputs on Hydrological Model Performance: An Analysis Based on 2400 Flood Events. J. Hydrol. 2016, 538, 454–470. [Google Scholar] [CrossRef]
- Špitalar, M.; Gourley, J.J.; Lutoff, C.; Kirstetter, P.-E.; Brilly, M.; Carr, N. Analysis of Flash Flood Parameters and Human Impacts in the US from 2006 to 2012. J. Hydrol. 2014, 519, 863–870. [Google Scholar] [CrossRef]
- Wang, L.; Peng, Z.; Ma, X.; Zheng, Y.; Chen, C. Multiscale Gravity Measurements to Characterize 2020 Flood Events and Their Spatio-Temporal Evolution in Yangtze River of China. J. Hydrol. 2021, 603, 127176. [Google Scholar] [CrossRef]
- Nengcheng, C.; Jizhen, L.; Xiang, Z. Quantitative Evaluation of Observation Capability of GF-1 Wide Field of View Sensors for Soil Moisture Inversion. J. Appl. Remote Sens. 2015, 9, 097097. [Google Scholar] [CrossRef]
- Carbonneau, P.E.; Hervé, P. Introduction: The Growing Use of Imagery in Fundamental and Applied River Sciences. In Fluvial Remote Sensing for Science and Management; Wiley-Blackwell: Hoboken, NJ, USA, 2012. [Google Scholar]
- Righini, M.; Surian, N. Remote Sensing as a Tool for Analysing Channel Dynamics and Geomorphic Effects of Floods. In Flood Monitoring through Remote Sensing; Springer: Berlin/Heidelberg, Germany, 2018; pp. 27–59. [Google Scholar]
- Legleiter, C.J.; Fonstad, M.A. An Introduction to the Physical Basis for Deriving River Information by Optical Remote Sensing. In Fluvial Remote Sensing for Science and Management; Wiley Online Library: Hoboken, NJ, USA, 2012. [Google Scholar]
- Crabbe, S.; Westra, T.; Wulf, R.D. Studying Flooded Grasslands in the Waza-Logone Region of Northern Cameroon Using Envisat ASAR Alternating Polarization Images. In Proceedings of the 2nd International Symposium on Recent Advances in Quantitative Remote Sensing, Valencia, Spain, 25–27 September 2006. [Google Scholar]
- Qiu, S.; He, B.; Zhu, Z.; Liao, Z.; Quan, X. Improving Fmask Cloud and Cloud Shadow Detection in Mountainous Area for Landsats 4–8 Images. Remote Sens. Environ. 2017, 199, 107–119. [Google Scholar] [CrossRef]
- Henry, J.B.; Chastanet, P.; Fellah, K.; Desnos, Y.L. Envisat Multi-polarized ASAR Data for Flood Mapping. Int. J. Remote Sens. 2006, 27, 1921–1929. [Google Scholar] [CrossRef]
- Martinis, S.; Rieke, C. Backscatter Analysis Using Multi-Temporal and Multi-Frequency SAR Data in the Context of Flood Mapping at River Saale. Remote Sens. 2015, 7, 7732–7752. [Google Scholar] [CrossRef]
- Manavalan, R. Review of Synthetic Aperture Radar Frequency, Polarization, and Incidence Angle Data for Mapping the Inundated Regions. J. Appl. Remote Sens. 2018, 12, 021501. [Google Scholar] [CrossRef]
- Martins, V.S.; Barbosa, C.C.F.; De Carvalho, L.A.S.; Jorge, D.S.F.; Lobo, F.d.L.; Novo, E.M.L.d.M. Assessment of Atmospheric Correction Methods for Sentinel-2 MSI Images Applied to Amazon Floodplain Lakes. Remote Sens. 2017, 9, 322. [Google Scholar] [CrossRef]
- Wu, Q.; Jin, Y.; Fan, H. Evaluating and Comparing Performances of Topographic Correction Methods Based on Multi-Source DEMs and Landsat-8 OLI Data. Int. J. Remote Sens. 2016, 37, 4712–4730. [Google Scholar] [CrossRef]
- Li, X.; Wang, L.; Cheng, Q.; Wu, P.; Gan, W.; Fang, L. Cloud Removal in Remote Sensing Images Using Nonnegative Matrix Factorization and Error Correction. ISPRS J. Photogramm. Remote Sens. 2019, 148, 103–113. [Google Scholar] [CrossRef]
- Shen, H.; Li, H.; Qian, Y.; Zhang, L.; Yuan, Q. An Effective Thin Cloud Removal Procedure for Visible Remote Sensing Images. ISPRS J. Photogramm. Remote Sens. 2014, 96, 224–235. [Google Scholar] [CrossRef]
- Saaty, T.L. What Is the Analytic Hierarchy Process? In Mathematical Models for Decision Support; Springer: Berlin/Heidelberg, Germany, 1988; pp. 109–121. [Google Scholar]
- Reuters. Death Toll from Floods in China’s Henan Province Rises to 302. Available online: https://www.reuters.com/world/china/death-toll-flooding-chinas-henan-province-rises-302-2021-08-02/ (accessed on 2 August 2023).
- Ayan, B.; Abacioğlu, S.; Basilio, M.P. A Comprehensive Review of the Novel Weighting Methods for Multi-Criteria Decision-Making. Information 2023, 14, 285. [Google Scholar] [CrossRef]
- Pamučar, D.; Stević, Ž.; Sremac, S. A New Model for Determining Weight Coefficients of Criteria in Mcdm Models: Full Consistency Method (Fucom). Symmetry 2018, 10, 393. [Google Scholar] [CrossRef]
- Žižović, M.; Pamucar, D. New Model for Determining Criteria Weights: Level Based Weight Assessment (LBWA) Model. Decis. Mak. Appl. Manag. Eng. 2019, 2, 126–137. [Google Scholar] [CrossRef]
- Zhu, Y.; Tian, D.; Yan, F. Effectiveness of Entropy Weight Method in Decision-Making. Math. Probl. Eng. 2020, 2020, 1–5. [Google Scholar] [CrossRef]
- Zavadskas, E.K.; Podvezko, V. Integrated Determination of Objective Criteria Weights in MCDM. Int. J. Inf. Technol. Decis. Mak. 2016, 15, 267–283. [Google Scholar] [CrossRef]
- Basilio, M.P.; Pereira, V.; Yigit, F. New Hybrid EC-Promethee Method with Multiple Iterations of Random Weight Ranges: Applied to the Choice of Policing Strategies. Mathematics 2023, 11, 4432. [Google Scholar] [CrossRef]
- Hu, C.; Li, J.; Lin, X.; Chen, N.; Yang, C. An Observation Capability Semantic-Associated Approach to the Selection of Remote Sensing Satellite Sensors: A Case Study of Flood Observations in the Jinsha River Basin. Sensors 2018, 18, 1649. [Google Scholar] [CrossRef]
- Chen, X.; Jia, S.; Xiang, Y. A Review: Knowledge Reasoning over Knowledge Graph. Expert Syst. Appl. 2020, 141, 112948. [Google Scholar] [CrossRef]


| Variable | Meaning |
|---|---|
| SpCo (spatial coverage) | The spatial coverage ratio of a sensor to the task area. |
| TiCo (time coverage) | The time coverage ratio of a sensor to the task time window. |
| ThCo (theme conformity) | The similarity between a sensor’s observation parameters and the task’s required parameters under a specific observation theme. |
| ReTi (response timeliness) | The response timeliness of a sensor to the task. |
| ReFc (revisit frequency) | The frequency of a sensor observing the task area within the task time window. |
| SpaRes (spatial resolution conformity) | The coincidence rate of a sensor’s spatial resolution to the task’s required one. |
| SpeRes (spectral resolution conformity) | The coincidence rate of a sensor’s spatial resolution to the task’s required one. |
| Pol (polarization mode conformity) | The coincidence rate of a sensor’s polarization resolution to the task’s required one. |
| RadRes (radiation resolution conformity) | The coincidence rate of a sensor’s radiation resolution to the task’s required one. |
| EnIm (environment impact) | The extent to which geographical environmental factors influence the observation quality. |
| Intensity of Importance | Definition | Explanation |
|---|---|---|
| 1 | Equal importance | Two activities contribute equally to the object |
| 2 | Weak or slight | |
| 3 | Moderate importance | Experience and judgment favor slightly one activity over another |
| 4 | Moderate plus | |
| 5 | Strong importance | Experience and judgment strongly favor one activity over another |
| 6 | Strong plus | |
| 7 | Very strong or demonstrated importance | An activity is favored very strongly over another; its dominance is demonstrated in practice |
| 8 | Very, very strong | |
| 9 | Extreme importance | The evidence favoring one activity over another is of the highest possible order of affirmation |
| Order | Phases | Time Window | Characteristics | Spatial Resolution | Spectral Resolution | Radiometric Resolution | Polarization Mode | Observation Parameters |
|---|---|---|---|---|---|---|---|---|
| 1 | Preparedness | 13 July 0:00– 16 July 0:00 | Large-scale and periodic observation | 30 m | 0.07 Micrometer (optical) | 12 bits (radiometric quantization) | HH (microwave) |
|
| 2 | Response | 19 July 0:00–24:00 | Quick response | 10 m | ||||
| 3 | Recovery | 23 July 0:00–24:00 | High-quality observation | 1 m |
| Flood Observation Task | #Available Optical Sensor | #Available Microwave Sensor |
|---|---|---|
| Preparedness phase | 13 | 3 |
| Response phase | 13 | 2 |
| Recovery phase | 12 | 2 |
| Sensor Type | Satellite Sensor | SpCo | ThCo | EnIm | SpaRes | SpeRes | Pol | RadRes | TiCo | ReTi | ReFc |
|---|---|---|---|---|---|---|---|---|---|---|---|
| Optics | Worldview 4_SpaceView-110 | 0.2057 | 0.2667 | 0.2600 | 1 | 1 | / | 1 | 0.2607 | 0.6153 | 0.2500 |
| Ziyuan1-02C_HRPC-2 | 0.4529 | 0 | 0.5400 | 1 | 0 | 1 | 0.2731 | 0.8539 | 0.2500 | ||
| KazEOSat-1_NAOMI (KazEOSat) | 0.4836 | 0.2667 | 0.4700 | 1 | 1 | 1 | 0.2980 | 0.8449 | 0.2500 | ||
| RapidEye-1_REIS | 0.3462 | 0.2667 | 0.4400 | 1 | 1 | 1 | 0.2731 | 0.5213 | 0.2500 | ||
| GeoEye-1_GIS | 0.4081 | 0.2667 | 0.4700 | 1 | 1 | 1 | 0.2731 | 0.8413 | 0.2500 | ||
| SSOT_NAOMI(SSOT) | 0.3771 | 0.2667 | 0.4700 | 1 | 1 | 1 | 0.2731 | 0.8437 | 0.2500 | ||
| Kompsat-2_MSC-Multi-Spectral Camera | 0.4232 | 0.2667 | 0.3800 | 1 | 1 | 1 | 0.2855 | 0.5346 | 0.2500 | ||
| RapidEye-2_REIS | 0.1573 | 0.2667 | 0.2500 | 1 | 1 | 1 | 0.1241 | 0.1893 | 0.2500 | ||
| Gaofen9_PMS-2 | 0.0734 | 0.2667 | 0.2100 | 1 | 1 | 1 | 0.0497 | 0.3547 | 0.2500 | ||
| Jilin-1_PMS-2 | 0.0891 | 0.2667 | 0.6100 | 1 | 1 | 1 | 0.0621 | 0.8624 | 0.2500 | ||
| Skysat-7_Skysat | 0.2694 | 0.2667 | 0.2200 | 1 | 1 | 1 | 0.2607 | 0.6928 | 0.2500 | ||
| Gaofen-1-03_PMS | 0.3846 | 0.2667 | 0.4700 | 1 | 1 | 1 | 0.2731 | 0.8411 | 0.2500 | ||
| Skysat-14_Skysat | 0.2697 | 0.2667 | 0.5400 | 1 | 1 | 0.7500 | 0.2607 | 0.8496 | 0.2500 | ||
| SAR | COSMO-Skymed 3_SAR-2000 | 0.3596 | 0.2000 | 1 | 1 | / | 0.8000 | 1 | 0.2607 | 0.9174 | 0.2500 |
| COSMO-Skymed 4_SAR-2000 | 0.3941 | 0.2000 | 1 | 1 | 0.8000 | 1 | 0.2855 | 0.7432 | 0.2500 | ||
| Coriolis_WindSat | 0.5061 | 0.2667 | 1 | 1 | 0.8000 | 1 | 0.2855 | 0.2373 | 0.2500 |
| Sensor Type | Satellite Sensor | SpCo | ThCo | EnIm | SpaRes | SpeRes | Pol | RadRes | TiCo | ReTi | ReFc |
|---|---|---|---|---|---|---|---|---|---|---|---|
| Optics | Worldview4_SpaceView-110 | 0.2045 | 0.2667 | 0.0300 | 1 | 1 | / | 1 | 0.2510 | 0.8414 | 0.2582 |
| Worldview2_WV110 | 0.4909 | 0.2667 | 0.0500 | 1 | 1 | 1 | 0.2869 | 0.5280 | 0.2582 | ||
| Kompsat-2_MSC—Multi-Spectral Camera | 0.4245 | 0.2667 | 0 | 1 | 1 | 1 | 0.2749 | 0.6091 | 0.2582 | ||
| KazEOSat-2_KEIS | 0.3742 | 0.2667 | 0 | 1 | 1 | 1 | 0.2630 | 0.0403 | 0.2582 | ||
| SkySat-2_SkySat | 0.2232 | 0.2667 | 0 | 1 | 1 | 1 | 0.1554 | 0.1681 | 0.2582 | ||
| Worldview3_WV110 | 0.3887 | 0.2667 | 0 | 1 | 1 | 1 | 0.2749 | 0.0580 | 0.2582 | ||
| Pléiades HR1A_HiRI | 0.4350 | 0.2667 | 0.0500 | 1 | 1 | 1 | 0.2749 | 0.5253 | 0.2582 | ||
| Ziyuan1-02C_HRPC-2 | 0.4927 | 0 | 0.0200 | 1 | 0 | 0.7500 | 0.2869 | 0.5664 | 0.2582 | ||
| Kompsat-3_AEISS | 0.4269 | 0.2667 | 0.0900 | 1 | 1 | 1 | 0.2749 | 0.4361 | 0.2582 | ||
| Resurs-P1_ShMSA-VR | 0.1671 | 0.2667 | 0.0200 | 0.8333 | 1 | 1 | 0.1554 | 0.5729 | 0.2582 | ||
| DubaiSat-2_HiRAIS | 0.3615 | 0.2667 | 0 | 1 | 1 | 1 | 0.2630 | 0.6138 | 0.2582 | ||
| Gaofen-1-04_PMS | 0.4049 | 0.2667 | 0.0700 | 1 | 1 | 1 | 0.2630 | 0.4619 | 0.2582 | ||
| Skysat-14_Skysat | 0.2692 | 0.2667 | 0 | 1 | 1 | 1 | 0.2510 | 0.0681 | 0.2582 | ||
| SAR | COSMO-Skymed1_SAR-2000 | 0.3771 | 0.2000 | 1 | 1 | / | 0.8000 | 1 | 0.2630 | 0.7607 | 0.2582 |
| Sentinel1A_SAR-C | 0.4525 | 0.1333 | 1 | 1 | 0.8000 | 1 | 0.2869 | 0.7175 | 0.2582 |
| Sensor Type | Satellite Sensor | SpCo | ThCo | EnIm | SpaRes | SpeRes | Pol | RadRes | TiCo | ReTi | ReFc |
|---|---|---|---|---|---|---|---|---|---|---|---|
| Optics | SkySat-1_SkySat | 0.3547 | 0.2667 | 0.0500 | 1 | 1 | / | 1 | 0.2841 | 0.5304 | 0.2673 |
| DubaiSat-2_HiRAIS | 0.3568 | 0.2667 | 0.2200 | 1 | 1 | 1 | 0.2841 | 0.1480 | 0.2673 | ||
| UK-DMC-2_SLIM6 | 0.3945 | 0.2667 | 0.0600 | 0.0455 | 0 | 1 | 0.2841 | 0.7429 | 0.2673 | ||
| Haiyang1C_CZI | 0.1849 | 0.2667 | 0.0500 | 0.0040 | 1 | 1 | 0.1162 | 0.5325 | 0.2673 | ||
| Alsat2B_NAOMI | 0.4210 | 0.2667 | 0.0200 | 0.4000 | 1 | 1 | 0.2970 | 0.5491 | 0.2673 | ||
| SkySat-13_SkySat | 0.2524 | 0.2667 | 0.2100 | 1 | 1 | 1 | 0.2583 | 0.9386 | 0.2673 | ||
| SkySat-11_SkySat | 0.2687 | 0.2667 | 0.1100 | 0.0008 | 0 | 1 | 0.2712 | 0.4215 | 0.2673 | ||
| Worldview3_WV110 | 0.3716 | 0.2667 | 0.0500 | 1 | 1 | 1 | 0.2841 | 0.5337 | 0.2673 | ||
| Skysat-5_SkySat | 0.3068 | 0.2667 | 0.2400 | 1 | 1 | 1 | 0.2841 | 0.0804 | 0.2673 | ||
| SkySat-6_SkySat | 0.1549 | 0.2667 | 0.2400 | 1 | 1 | 1 | 0.1550 | 0.0802 | 0.2673 | ||
| Landsat7_ETM+ | 0.0010 | 0.3333 | 0.1200 | 0.0667 | 11 | 1 | 0.2841 | 0.7657 | 0.2673 | ||
| RapidEye-2_REIS | 0.3537 | 0.2667 | 0.2500 | 0.1538 | 1 | 0.2841 | 0.0953 | 0.2673 | |||
| SAR | COSMO-Skymed3_SAR-2000 | 0.3775 | 0.2000 | 1 | 1 | / | 0.8000 | 1 | 0.2841 | 0.7607 | 0.2673 |
| Sentinel1B_SAR-C (Sentinel-1) | 0.4336 | 0.1333 | 1 | 0.2500 | 0.8000 | 1 | 0.2970 | 0.2474 | 0.2673 |
| ReTi | TiCo | ReFc | SpaRes | SpeRes/Pol | RadRes | Weight | |
|---|---|---|---|---|---|---|---|
| ReTi | 1 | 1/5 | 1/9 | 1/3 | 1/3 | 1/3 | 0.032 |
| TiCo | 5 | 1 | 1/5 | 5 | 5 | 5 | 0.236 |
| ReFc | 9 | 5 | 1 | 7 | 7 | 7 | 0.534 |
| SpaRes | 3 | 1/5 | 1/7 | 1 | 1 | 1 | 0.066 |
| SpeRes/Pol | 3 | 1/5 | 1/7 | 1 | 1 | 1 | 0.066 |
| RadRes | 3 | 1/5 | 1/7 | 1 | 1 | 1 | 0.066 |
| = 6.340, CR = 0.055 < 0.1 | |||||||
| ReTi | TiCo | ReFc | SpaRes | SpeRes/Pol | RadRes | Weight | |
|---|---|---|---|---|---|---|---|
| ReTi | 1 | 7 | 9 | 5 | 5 | 5 | 0.514 |
| TiCo | 1/7 | 1 | 3 | 1/3 | 1/3 | 1/3 | 0.057 |
| ReFc | 1/9 | 1/3 | 1 | 1/5 | 1/5 | 1/5 | 0.030 |
| SpaRes | 1/5 | 3 | 5 | 1 | 1 | 1 | 0.133 |
| SpeRes/Pol | 1/5 | 3 | 5 | 1 | 1 | 1 | 0.133 |
| RadRes | 1/5 | 3 | 5 | 1 | 1 | 1 | 0.133 |
| = 6.190, CR = 0.031 < 0.1 | |||||||
| ReTi | TiCo | ReFc | SpaRes | SpeRes/Pol | RadRes | Weight | |
|---|---|---|---|---|---|---|---|
| ReTi | 1 | 2 | 3 | 1/5 | 1/5 | 1/5 | 0.067 |
| TiCo | 1/2 | 1 | 2 | 1/7 | 1/7 | 1/7 | 0.042 |
| ReFc | 1/3 | 1/2 | 1 | 1/9 | 1/9 | 1/9 | 0.027 |
| SpaRes | 5 | 7 | 9 | 1 | 1 | 1 | 0.288 |
| SpeRes/Pol | 5 | 7 | 9 | 1 | 1 | 1 | 0.288 |
| RadRes | 5 | 7 | 9 | 1 | 1 | 1 | 0.288 |
| = 6.051, CR = 0.008 < 0.1 | |||||||
| Methods | Applicable Scenario | Evaluation Mode | Spatiotemporal Characteristics Considered | Main Content | |
|---|---|---|---|---|---|
| Spatiotemporal Process | Environmental Impact | ||||
| OCEM | Flood | Quantitative | √ | √ | Quantitatively evaluate the performance of satellite sensors in flood water observation tasks, considering the spatiotemporal characteristics of the flood event. This enables the optimum selection and planning of sensors |
| DOCI | General | Quantitative | × | √ | Quantitatively evaluate the observation performance of satellite sensors in various scenarios to support their optimal selection and planning |
| SSCI | General | Quantitative | × | × | Cluster satellite sensors based on the evaluation of their static observation capability, enabling the recommendation of multiple sensors for different observation scenarios |
| SOCA Ontology | General | Qualitative | × | × | Create a semantic web where each satellite sensor is semantically linked to its multidimensional observation capabilities (e.g., {SensorA, hasObservationSpace, SpaceA}), supporting the fast and semantic discovery of satellite sensors |
| SOCO-Field | General | Qualitative | × | √ | Establish the linkage between geographical locations and sensor observation capabilities based on the GIS object field model. This enables location-based discovery and qualitative cognition of sensors |
| SSOCEM | Astronomy | Quantitative | × | √ | Evaluate the observation stability and accuracy of star sensors in hypersonic aerothermal conditions |
| EOPEM | General | Quantitative | × | × | Assess the degree of satisfaction of Earth observation sensor capabilities in meeting SGD demand, as well as its future potential |
| SBSM | Flood | Quantitative | × | × | Use the Elimination and Choice Expressing Reality method to select the optimal bands of sensors for flood area detection and mapping |
Disclaimer/Publisher’s Note: The statements, opinions and data contained in all publications are solely those of the individual author(s) and contributor(s) and not of MDPI and/or the editor(s). MDPI and/or the editor(s) disclaim responsibility for any injury to people or property resulting from any ideas, methods, instructions or products referred to in the content. |
© 2023 by the authors. Licensee MDPI, Basel, Switzerland. This article is an open access article distributed under the terms and conditions of the Creative Commons Attribution (CC BY) license (https://creativecommons.org/licenses/by/4.0/).
Share and Cite
Duan, M.; Zhang, Y.; Liu, R.; Chen, S.; Deng, G.; Yi, X.; Li, J.; Yang, P. Observation Capability Evaluation Model for Flood-Observation-Oriented Satellite Sensor Selection. Appl. Sci. 2023, 13, 12482. https://doi.org/10.3390/app132212482
Duan M, Zhang Y, Liu R, Chen S, Deng G, Yi X, Li J, Yang P. Observation Capability Evaluation Model for Flood-Observation-Oriented Satellite Sensor Selection. Applied Sciences. 2023; 13(22):12482. https://doi.org/10.3390/app132212482
Chicago/Turabian StyleDuan, Mu, Yunbo Zhang, Ran Liu, Shen Chen, Guoquan Deng, Xiaowei Yi, Jie Li, and Puwei Yang. 2023. "Observation Capability Evaluation Model for Flood-Observation-Oriented Satellite Sensor Selection" Applied Sciences 13, no. 22: 12482. https://doi.org/10.3390/app132212482
APA StyleDuan, M., Zhang, Y., Liu, R., Chen, S., Deng, G., Yi, X., Li, J., & Yang, P. (2023). Observation Capability Evaluation Model for Flood-Observation-Oriented Satellite Sensor Selection. Applied Sciences, 13(22), 12482. https://doi.org/10.3390/app132212482