
Numerical Study on Welding Structure of Connecting Fin Used in Thermal Power Plant

Abstract
1. Introduction
2. Welding Structural Parameter
3. Method
3.1. Model Size and Material Parameter
3.2. Calculation Process
3.2.1. Thermal Model
3.2.2. Residual Stress Model
3.2.3. Boundary Conditions and Parameter Design
4. Results
4.1. Sensitivity Analysis of the Number of Water-Cooled Tubes
4.2. Effect of Welding Rate on Residual Stress and Deformation
4.3. Effect of Fin Size on Residual Stress and Deformation
5. Discussion
5.1. Relationship between Welding Rate and Stress/Deformation
5.2. Relationship between Fin Size and Stress/Deformation
5.3. Brief Summary
6. Conclusions
- (1)
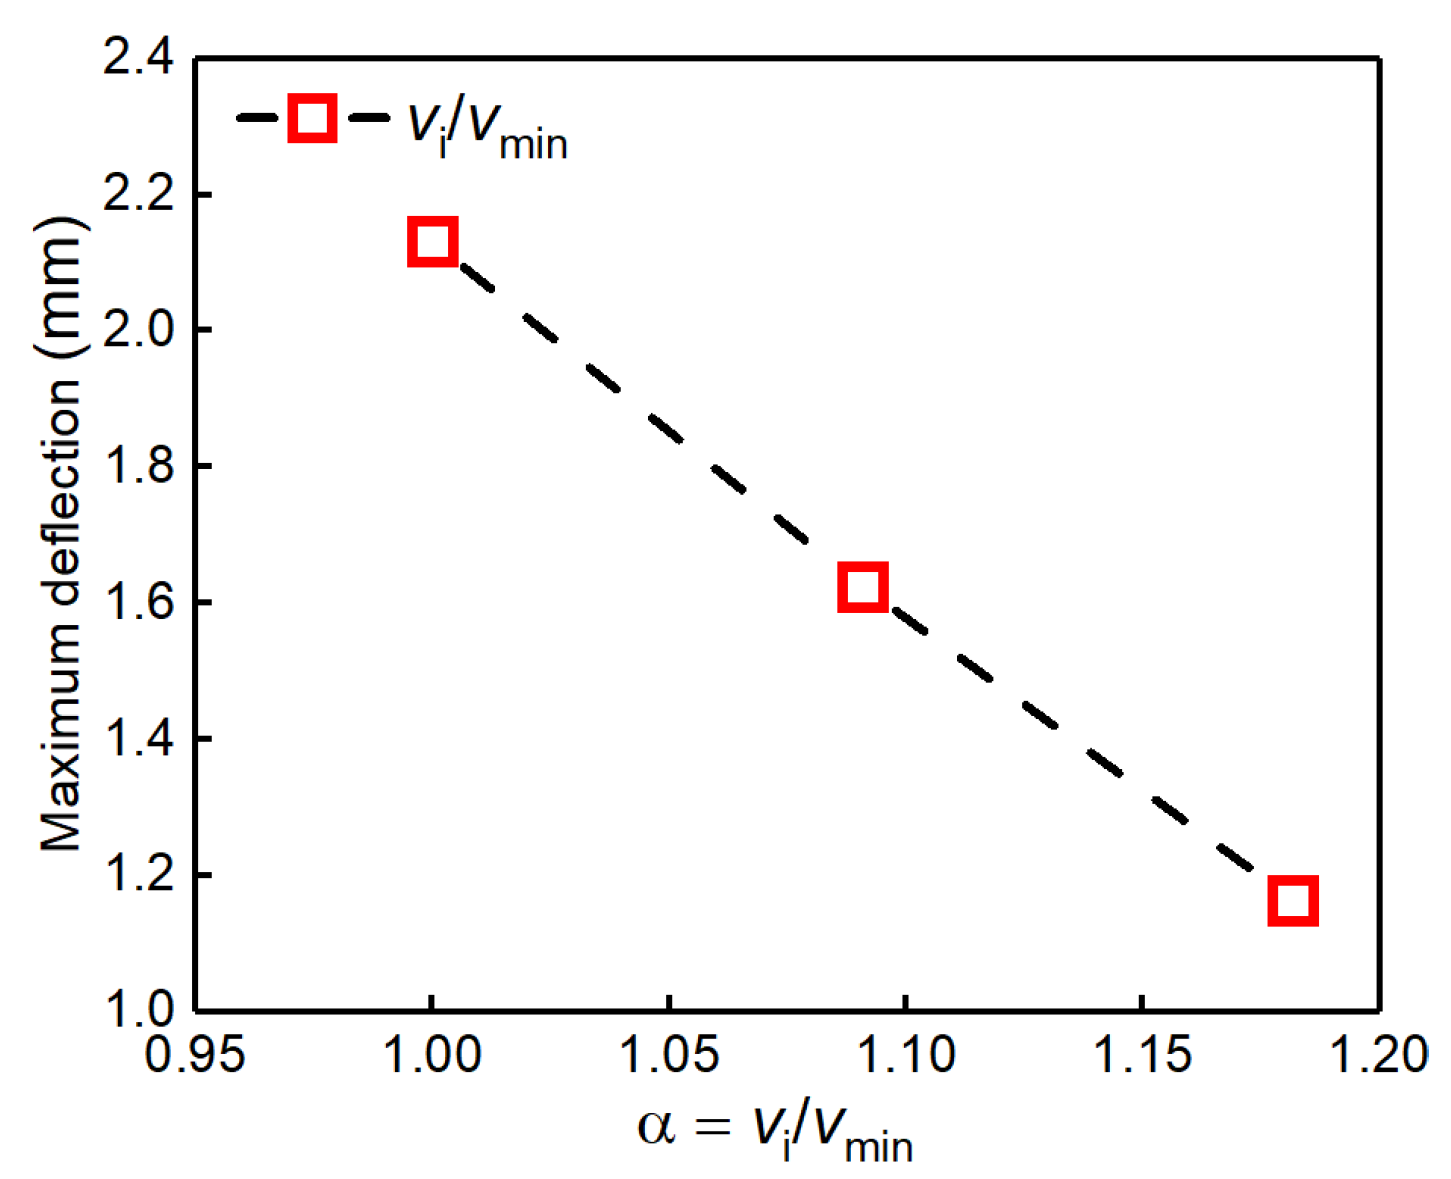
- When the welding line energy was fixed, the deflection deformation of the flue-side wall decreased with the increase in the welding rate.
- (2)
- The connecting fin yielded in all cases. The yield range increased with the increasing width of the connecting fin. The maximum deformation decreased with the increase in thickness, while it decreased first and then increased with the increasing width.
- (3)
- The post-welding stress and deformation of the boiler flue-side wall exhibited more sensitivity to the width of the connecting fin.
Author Contributions
Funding
Institutional Review Board Statement
Informed Consent Statement
Data Availability Statement
Acknowledgments
Conflicts of Interest
References
- Shi, Y.W.; Li, Y.P.; Zhou, Y.; Xu, R.; Feng, D.H.; Yan, Z.; Fang, C. Optimal scheduling for power system peak load regulation considering short-time startup and shutdown operations of thermal power unit. Int. J. Electr. Power Energy Syst. 2021, 131, 107012. [Google Scholar] [CrossRef]
- Yang, B.; Cao, X.Y.; Cai, Z.H.; Yang, T.G.; Chen, D.W.; Gao, X.H.; Zhang, J. Unit Commitment Comprehensive Optimal Model Considering the Cost of Wind Power Curtailment and Deep Peak Regulation of Thermal Unit. IEEE Access 2020, 8, 71318–71325. [Google Scholar] [CrossRef]
- Zhou, J.; Chen, W.; Shi, X.; Li, S.; Li, Y.; Lu, C.; Li, H.; Cheng, Y.; Yang, J.; Zou, H.; et al. Adhesive and tensile properties of diamond(001)/TiC(111) interfaces: A first-principles investigation. Int. J. Refract. Hard Met. 2023, 117, 106397. [Google Scholar] [CrossRef]
- Yang, L.; Zhou, N.; Zhou, G.; Chi, Y.; Wang, Q.; Lyu, X.; Chang, D.; Ji, W. An Accurate Ladder-type Ramp Rate Constraint Derived from Field Test Data for Thermal Power Unit with Deep Peak Regulation. IEEE Trans. Power Syst. 2023, 1–14. [Google Scholar] [CrossRef]
- Lu, C.; Qin, Z.; Wang, S.; He, Y.; Sun, Y.; Gao, Z.; Tu, S.-T. Uncovering the high-temperature microstructural evolution and creep-fatigue damage mechanism of CMSX-4 brazed joints. Int. J. Fatigue 2023, 173, 107681. [Google Scholar] [CrossRef]
- Moghari, M.; Hosseini, S.; Shokouhmand, H.; Sharifi, H.; Izadpanah, S. A numerical study on thermal behavior of a D-type water-cooled steam boiler. Appl. Therm. Eng. 2012, 37, 360–372. [Google Scholar] [CrossRef]
- Wang, J.J.; Zhang, S.; Huo, J.K.; Zhou, Y.; Li, L.; Han, T.Y. Dispatch optimization of thermal power unit flexibility transformation under the deep peak shaving demand based on invasive weed optimization. J. Clean. Prod. 2021, 315, 128047. [Google Scholar] [CrossRef]
- Beni, M.H.; Emami, S.; Isfahani, A.H.M.; Shirneshan, A.; Kalbasi, R. Transient simulation and exergy analysis of a D-type steam boiler with natural circulation during cold start: A case study. Appl. Therm. Eng. 2022, 210, 118367. [Google Scholar] [CrossRef]
- An, Q.; Wang, J.; Li, G.; Zhou, M. Role of optimal transmission switching in accommodating renewable energy in deep peak regulation-enabled power systems. Glob. Energy Interconnect. 2020, 3, 577–584. [Google Scholar] [CrossRef]
- Guo, X.; Liao, Y.; Li, G.; Han, Y.; Ma, X. Low-carbon economic dispatch of Photovoltaic-Carbon capture power plant considering deep peak regulation. J. Clean. Prod. 2023, 420, 138418. [Google Scholar] [CrossRef]
- Sethi, A.K.; Vikash, O. Failure analysis of the water-wall tube in once through Benson boiler. Mater. Today Proc. 2022. [Google Scholar] [CrossRef]
- Liu, S.W.; Wang, W.Z.; Liu, C.J. Failure analysis of the boiler water-wall tube. Case Stud. Eng. Fail. Anal. 2017, 9, 35–39. [Google Scholar] [CrossRef]
- Khedr, M.; Abd_Elaziem, W.; Newishy, M.; Abdel-Aleem, H. Metallurgical analysis of ASME SA213 T12 boiler vertical water-wall tubes failure. Eng. Fail. Anal. 2023, 145, 107016. [Google Scholar] [CrossRef]
- Assefinejad, A.H.; Kermanpur, A.; Eslami, A.M.; Kangazian, J. Failure investigation of water wall tubes in a drum boiler of a thermal power plant. Eng. Fail. Anal. 2020, 118, 104869. [Google Scholar] [CrossRef]
- Assefinejad, A.H.; Kermanpur, A.; Eslami, A.M. A semi-analytical approach on critical thermal states in water wall tubes of a subcritical drum boiler of a thermal power plant. Int. J. Press. Vessels Pip. 2021, 194, 104507. [Google Scholar] [CrossRef]
- Duarte, C.A.; Espejo, E.; Martinez, J.C. Failure analysis of the wall tubes of a water-tube boiler. Eng. Fail. Anal. 2017, 79, 704–713. [Google Scholar] [CrossRef]
- Fu, J.; Wei, L.; Li, N.; Zhou, Q.; Liu, T. Experimental study on temperature, heat flux, strain and stress distribution of boiler water walls. Appl. Therm. Eng. 2017, 113, 419–425. [Google Scholar] [CrossRef]
- Qiu, J.Y.; Guo, Q.H.; Xu, J.L.; Gong, Y.; Yu, G.S. Numerical study on heat transfer and thermal stress of the upper cone membrane wall in radiant syngas cooler. Appl. Therm. Eng. 2020, 169, 114845. [Google Scholar] [CrossRef]
- Fan, Q.; Hui, S.; Zhao, S.; Zhou, Q.; Chen, X.; Zhao, Q. Thermal stress and strain distributions of a laboratory scale wall fired furnace: A numerical study and experimental verification. Eng. Fail. Anal. 2012, 25, 227–237. [Google Scholar] [CrossRef]
- Wei, L.; Zhou, Q.L.; Li, N. Experimental study and simulation analysis of heat and deformation in the water walls of an opposed firing boiler under flexible operating conditions. Appl. Therm. Eng. 2022, 213, 118726. [Google Scholar] [CrossRef]
- Dhua, S.K.; Saxena, A.; Jha, B.K. Failure Analysis of Boiler Tubes Used in a Thermal Power Plant. Trans. Indian Inst. Met. 2016, 69, 653–657. [Google Scholar] [CrossRef]
- Singh, P.M.; Mahmood, J. Stress assisted corrosion of waterwall tubes in recovery boiler tubes: Failure analysis. J. Fail. Anal. Prev. 2007, 7, 361–370. [Google Scholar] [CrossRef]
- Ge, X.L.; Zhang, Z.X.; Fan, H.J.; Zhang, J.; Bi, D.G. Unsteady-state heat transfer characteristics of spiral water wall tube in advanced-ultra-supercritical boilers from experiments and distributed parameter model. Energy 2019, 189, 116158. [Google Scholar] [CrossRef]
- Ray, A.K.; Sahay, S.K.; Goswami, B. Assessment of service exposed boiler tubes. Eng. Fail. Anal. 2003, 10, 645–654. [Google Scholar] [CrossRef]
- Liu, S.J.; Wu, H.M.; Zhao, Q.X.; Liang, Z.Y. Corrosion failure analysis of the heat exchanger in a hot water heating boiler. Eng. Fail. Anal. 2022, 142, 106847. [Google Scholar] [CrossRef]
- Srikanth, S.; Gopalakrishna, K.; Das, S.K.; Ravikumar, B. Phosphate induced stress corrosion cracking in a waterwall tube from a coal fired boiler. Eng. Fail. Anal. 2003, 10, 491–501. [Google Scholar] [CrossRef]
- Beghini, M.; Bertini, L.; Santus, C. A procedure for evaluating high residual stresses using the blind hole drilling method, including the effect of plasticity. J. Strain Anal. Eng. Des. 2010, 45, 301–318. [Google Scholar] [CrossRef]
- Chen, X.; Yan, J.; Karlsson, A.M. On the determination of residual stress and mechanical properties by indentation. Mater. Sci. Eng. A 2006, 416, 139–149. [Google Scholar] [CrossRef]
- Pintschovius, L.; Jung, V.; Macherauch, E.; Vöhringer, O. Residual stress measurements by means of neutron diffraction. Mater. Sci. Eng. 1983, 61, 43–50. [Google Scholar] [CrossRef]
- Withers, P.J.; Turski, M.; Edwards, L.; Bouchard, P.J.; Buttle, D.J. Recent advances in residual stress measurement. International J. Press. Vessel. Pip. 2008, 85, 118–127. [Google Scholar] [CrossRef]
- Xu, C.; Song, W.; Pan, Q.; Li, H.; Liu, S. Nondestructive Testing Residual Stress Using Ultrasonic Critical Refracted Longitudinal Wave. Phys. Procedia 2015, 70, 594–598. [Google Scholar] [CrossRef]
- Vourna, P.; Ktena, A.; Tsarabaris, P.; Hristoforou, E. Magnetic Residual Stress Monitoring Technique for Ferromagnetic Steels. Metals 2018, 8, 592. [Google Scholar] [CrossRef]
- Lu, C.; Wang, P.; Zheng, S.; Wu, X.; Liu, R.; He, Y.; Yang, J.; Gao, Z.; Tu, S.T. Creep behavior and life prediction of a reactor pressure vessel steel above phase-transformation temperature via a deformation mechanism-based creep model. Fatigue Fract. Eng. Mater. Struct. 2023, 46, 3342–3359. [Google Scholar] [CrossRef]
- Gou, R.; Zhang, Y.; Xu, X.; Sun, L.; Yang, Y. Residual stress measurement of new and in-service X70 pipelines by X-ray diffraction method. NDT E Int. 2011, 44, 387–393. [Google Scholar] [CrossRef]
- Zheng, X.; Li, J.; Zhou, Y. X-ray diffraction measurement of residual stress in PZT thin films prepared by pulsed laser deposition. Acta Mater. 2004, 52, 3313–3322. [Google Scholar] [CrossRef]
- Allen, A.J.; Hutchings, M.T.; Windsor, C.G.; Andreani, C. Neutron diffraction methods for the study of residual stress fields. Adv. Phys. 2006, 34, 445–473. [Google Scholar] [CrossRef]
- Wang, X.; Zhu, Y.; Shi, X.; Chi, Y.; Dong, X.; Lu, C.; He, Y. Numerical simulation of structural stress of flue side wall connected finned area. Press. Vessel. Technol. 2023. (Under review). [Google Scholar]
- Pan, J. Practical Handbook of Pressure Vessel Materials—Carbon Steel and Alloy Steel; Chemical Industry Press: Beijing, China, 2000; pp. 356–362. [Google Scholar]
- Malik, A.M.; Qureshi, E.M.; Ullah Dar, N.; Khan, I. Analysis of circumferentially arc welded thin-walled cylinders to investigate the residual stress fields. Thin-Walled Struct. 2008, 46, 1391–1401. [Google Scholar] [CrossRef]
- Akbari, D.; Sattari-Far, I. Effect of the welding heat input on residual stresses in butt-welds of dissimilar pipe joints. Int. J. Press. Vessel. Pip. 2009, 86, 769–776. [Google Scholar] [CrossRef]
- Guimarães, P.B.; Pedrosa, P.M.A.; Yadava, Y.P.; Barbosa, J.M.A.; Filho, A.V.S.; Ferreira, R.A.S. Determination of Residual Stresses Numerically Obtained in ASTM AH36 Steel Welded by TIG Process. Mater. Sci. Appl. 2013, 4, 268–274. [Google Scholar] [CrossRef][Green Version]
- Deng, D.; Murakawa, H. Prediction of welding distortion and residual stress in a thin plate butt-welded joint. Comput. Mater. Sci. 2008, 43, 353–365. [Google Scholar] [CrossRef]


| Residual Stress Test Method | Disadvantage | |
|---|---|---|
| Destructive testing | Blind-hole method | Causes damage |
| Indentation method | Causes damage | |
| Cutting method | Causes damage | |
| Nondestructive Testing | Ultrasonic method | Weak detection depth |
| Magnetic method | Imperfect development | |
| X-ray diffraction method | Only magnetic materials | |
| Eutron diffraction method | Poor test sensitivity | |
| Species | Value |
|---|---|
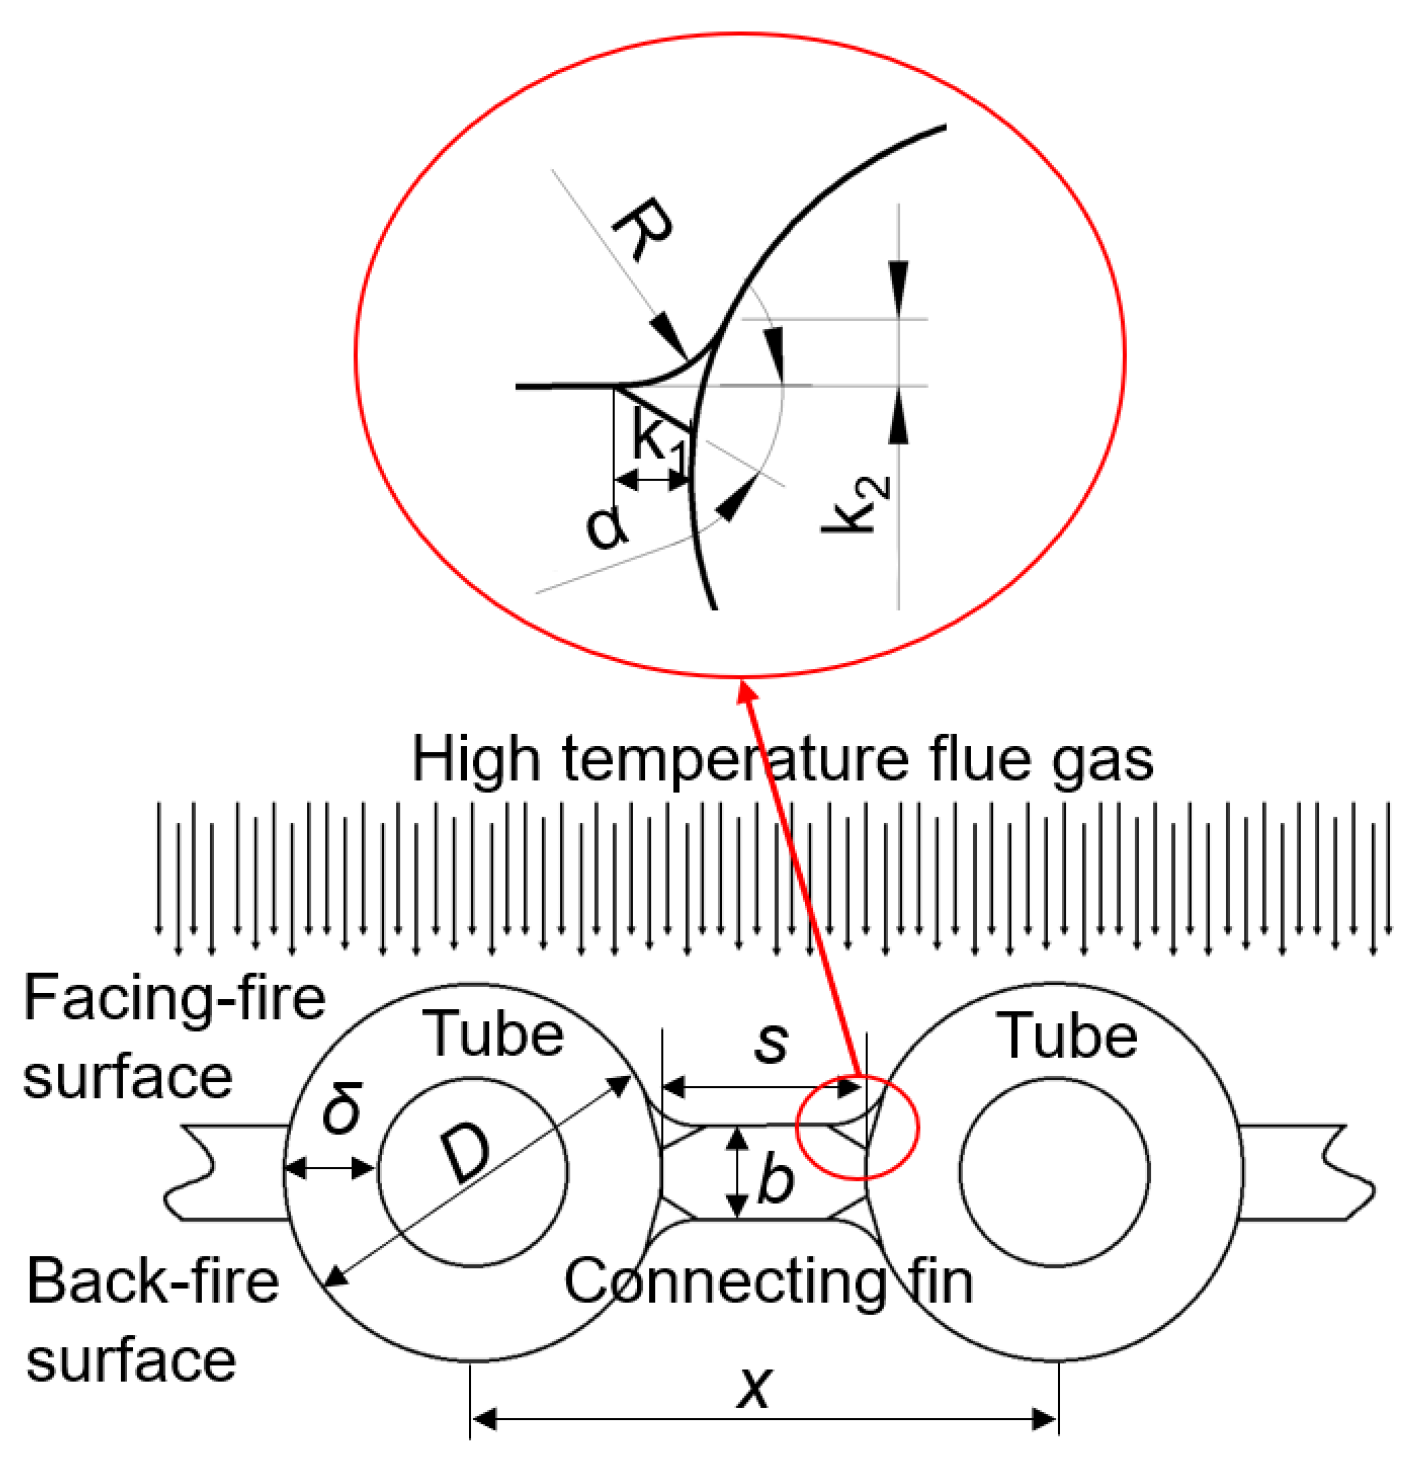
| Outer diameter of wall tube D (mm) | 32 |
| Thickness of water-cooled wall δ (mm) | 8 |
| Pitch x (mm) | 49.5 |
| Horizontal flue-side wall cladding wall pipe length L1 (mm) | 11,180 |
| Tail flue-side wall package wall pipe length L2 (mm) | 19,410 |
| Connecting fin length L3 (mm) | 10,520 |
| Weld fin angle α (°) | 31 |
| Weld radian radius R (mm) | 5 |
| Size of welding toe at connecting fin k1 (mm) | 3.33 |
| Size of welding toe at wall pipe k2 (mm) | 2.86 |
| T | C | λ | α | E | G | ν | σs |
|---|---|---|---|---|---|---|---|
| 20 | 560 | 45.2 | 10.80 | 214 | 83.5 | 0.28 | 393 |
| 100 | 569 | 45.2 | 13.00 | 211 | 81.8 | 0.28 | 374 |
| 200 | 586 | 45.2 | 13.36 | 206 | 79.2 | 0.30 | 359 |
| 300 | 611 | 42.7 | 13.55 | 195 | 74.0 | 0.31 | 308 |
| 400 | 653 | 40.5 | 13.83 | 187 | 72.2 | 0.29 | 285 |
| 500 | 682 | 37.7 | 14.15 | 179 | 68.6 | 0.30 | 266 |
| 600 | 729 | 35.5 | 14.38 | 167 | 63.1 | 0.32 | 251 |
| 700 | — | 33.4 | 14.62 | — | — | 0.32 | — |
| Fin Thickness b (mm) | Fin Width s (mm) |
|---|---|
| 8 | 10, 17.5, 30, 50, 70 |
| 6, 8, 10, 12 | 17.5 |
Disclaimer/Publisher’s Note: The statements, opinions and data contained in all publications are solely those of the individual author(s) and contributor(s) and not of MDPI and/or the editor(s). MDPI and/or the editor(s) disclaim responsibility for any injury to people or property resulting from any ideas, methods, instructions or products referred to in the content. |
© 2023 by the authors. Licensee MDPI, Basel, Switzerland. This article is an open access article distributed under the terms and conditions of the Creative Commons Attribution (CC BY) license (https://creativecommons.org/licenses/by/4.0/).
Share and Cite
Guo, E.; Huang, W.; Shi, X.; Zhu, Y.; Cui, Y.; Wang, X.; Lu, C.; Lou, Y.; He, Y. Numerical Study on Welding Structure of Connecting Fin Used in Thermal Power Plant. Appl. Sci. 2023, 13, 12454. https://doi.org/10.3390/app132212454
Guo E, Huang W, Shi X, Zhu Y, Cui Y, Wang X, Lu C, Lou Y, He Y. Numerical Study on Welding Structure of Connecting Fin Used in Thermal Power Plant. Applied Sciences. 2023; 13(22):12454. https://doi.org/10.3390/app132212454
Chicago/Turabian StyleGuo, Entao, Weiqiang Huang, Xian Shi, Yuce Zhu, Yimin Cui, Xianming Wang, Chuanyang Lu, Yumin Lou, and Yanming He. 2023. "Numerical Study on Welding Structure of Connecting Fin Used in Thermal Power Plant" Applied Sciences 13, no. 22: 12454. https://doi.org/10.3390/app132212454
APA StyleGuo, E., Huang, W., Shi, X., Zhu, Y., Cui, Y., Wang, X., Lu, C., Lou, Y., & He, Y. (2023). Numerical Study on Welding Structure of Connecting Fin Used in Thermal Power Plant. Applied Sciences, 13(22), 12454. https://doi.org/10.3390/app132212454