1. Introduction
Retrograde intrarenal surgery (RIRS) is a standard procedure dedicated to the treatment of kidney stones. The continuous development of endourology allows the use of minimally invasive treatment methods that improve patient safety. In the case of RIRS, regardless of the necessary armamentarium used for the procedure, the most crucial aspect is the balance of physical conditions (intrarenal pressure and temperature) prevailing in the operated space, the pelvicalyceal system of the kidney. Until now, there has been no standardised and universally available method to assess physical conditions in the renal pelvis in real time during flexible ureterorenoscopy [
1], hence the need for experimental research to improve endourological techniques, which will lead to more effective surgery and better patient safety. The predominant conditions in the renal pelvis during RIRS are the result of several factors that influence the outcome of laser lithotripsy under optimal visibility conditions. The most important factor includes the balance between irrigation inflow (the IPP-generating irrigation system) and outflow (uretroscope: ureteral access sheath ratio) [
2,
3,
4].
The normal (‘physiological’) intrarenal pressure range is 0–20 cmH
2O [
2]. Intrarenal backflow (flow from the renal pelvis to the renal parenchyma) and impaired arterial perfusion have been reported at approximately 40 cmH
2O in both human [
3] and animal studies [
4]. Pressure above 40 cmH
2O leads to a pyelovenous backflow [
5]. Previously published studies have shown that during flexible ureterorenoscopy, a very high peak IPP of up to 300–400 cmH
2O can be generated [
6,
7]. Therefore, the use of UAS (ureteral access sheath) during RIRS is one of the ways to reduce IPP. The application of UAS allows the safe insertion of endoscopic tools into the upper urinary tract and their easier navigation, as well as the improvement of vision by continuous flow establishment. Based on the cadaver study performed by Rehman et al., application of UAS during surgery results in an increase in irrigation flow of 35 to 80% compared to the group without the UAS used [
8]. Irrigation pressures transmitted to the renal pelvis are significantly higher during flexible URS without the use of the UAS. Auge et al. showed that, regardless of the type of ureteroscope or the position of the UAS, the irrigation pressures transmitted to the renal pelvis are significantly greater during flexible URS with no utility of the UAS (pressure measured in the renal pelvis through the nephrostomy tube without the use of UAS was more than twice as high compared to measurements with UAS) [
9].
The aim of the study was to evaluate IPP during RIRS procedures on 3D printed models with chemically synthesised stones. The 3D model allows RIRS procedures to be carried out under almost identical conditions, using stones of comparable size and density. The study evaluated the differences in real-time IPP generated during RIRS with two different sizes of UAS (10/12Fr vs. 12/14Fr) using different energy settings generated by the holmium:YAG laser. To the best of our knowledge, this is the first study to assess IPP in ex vivo conditions using 3D models created from plasticised thermoplastic polyurethane with chemically synthesised stones.
2. Materials and Methods
2.1. The 3D Printed Renal Pelvicalyceal Model and Stone Development
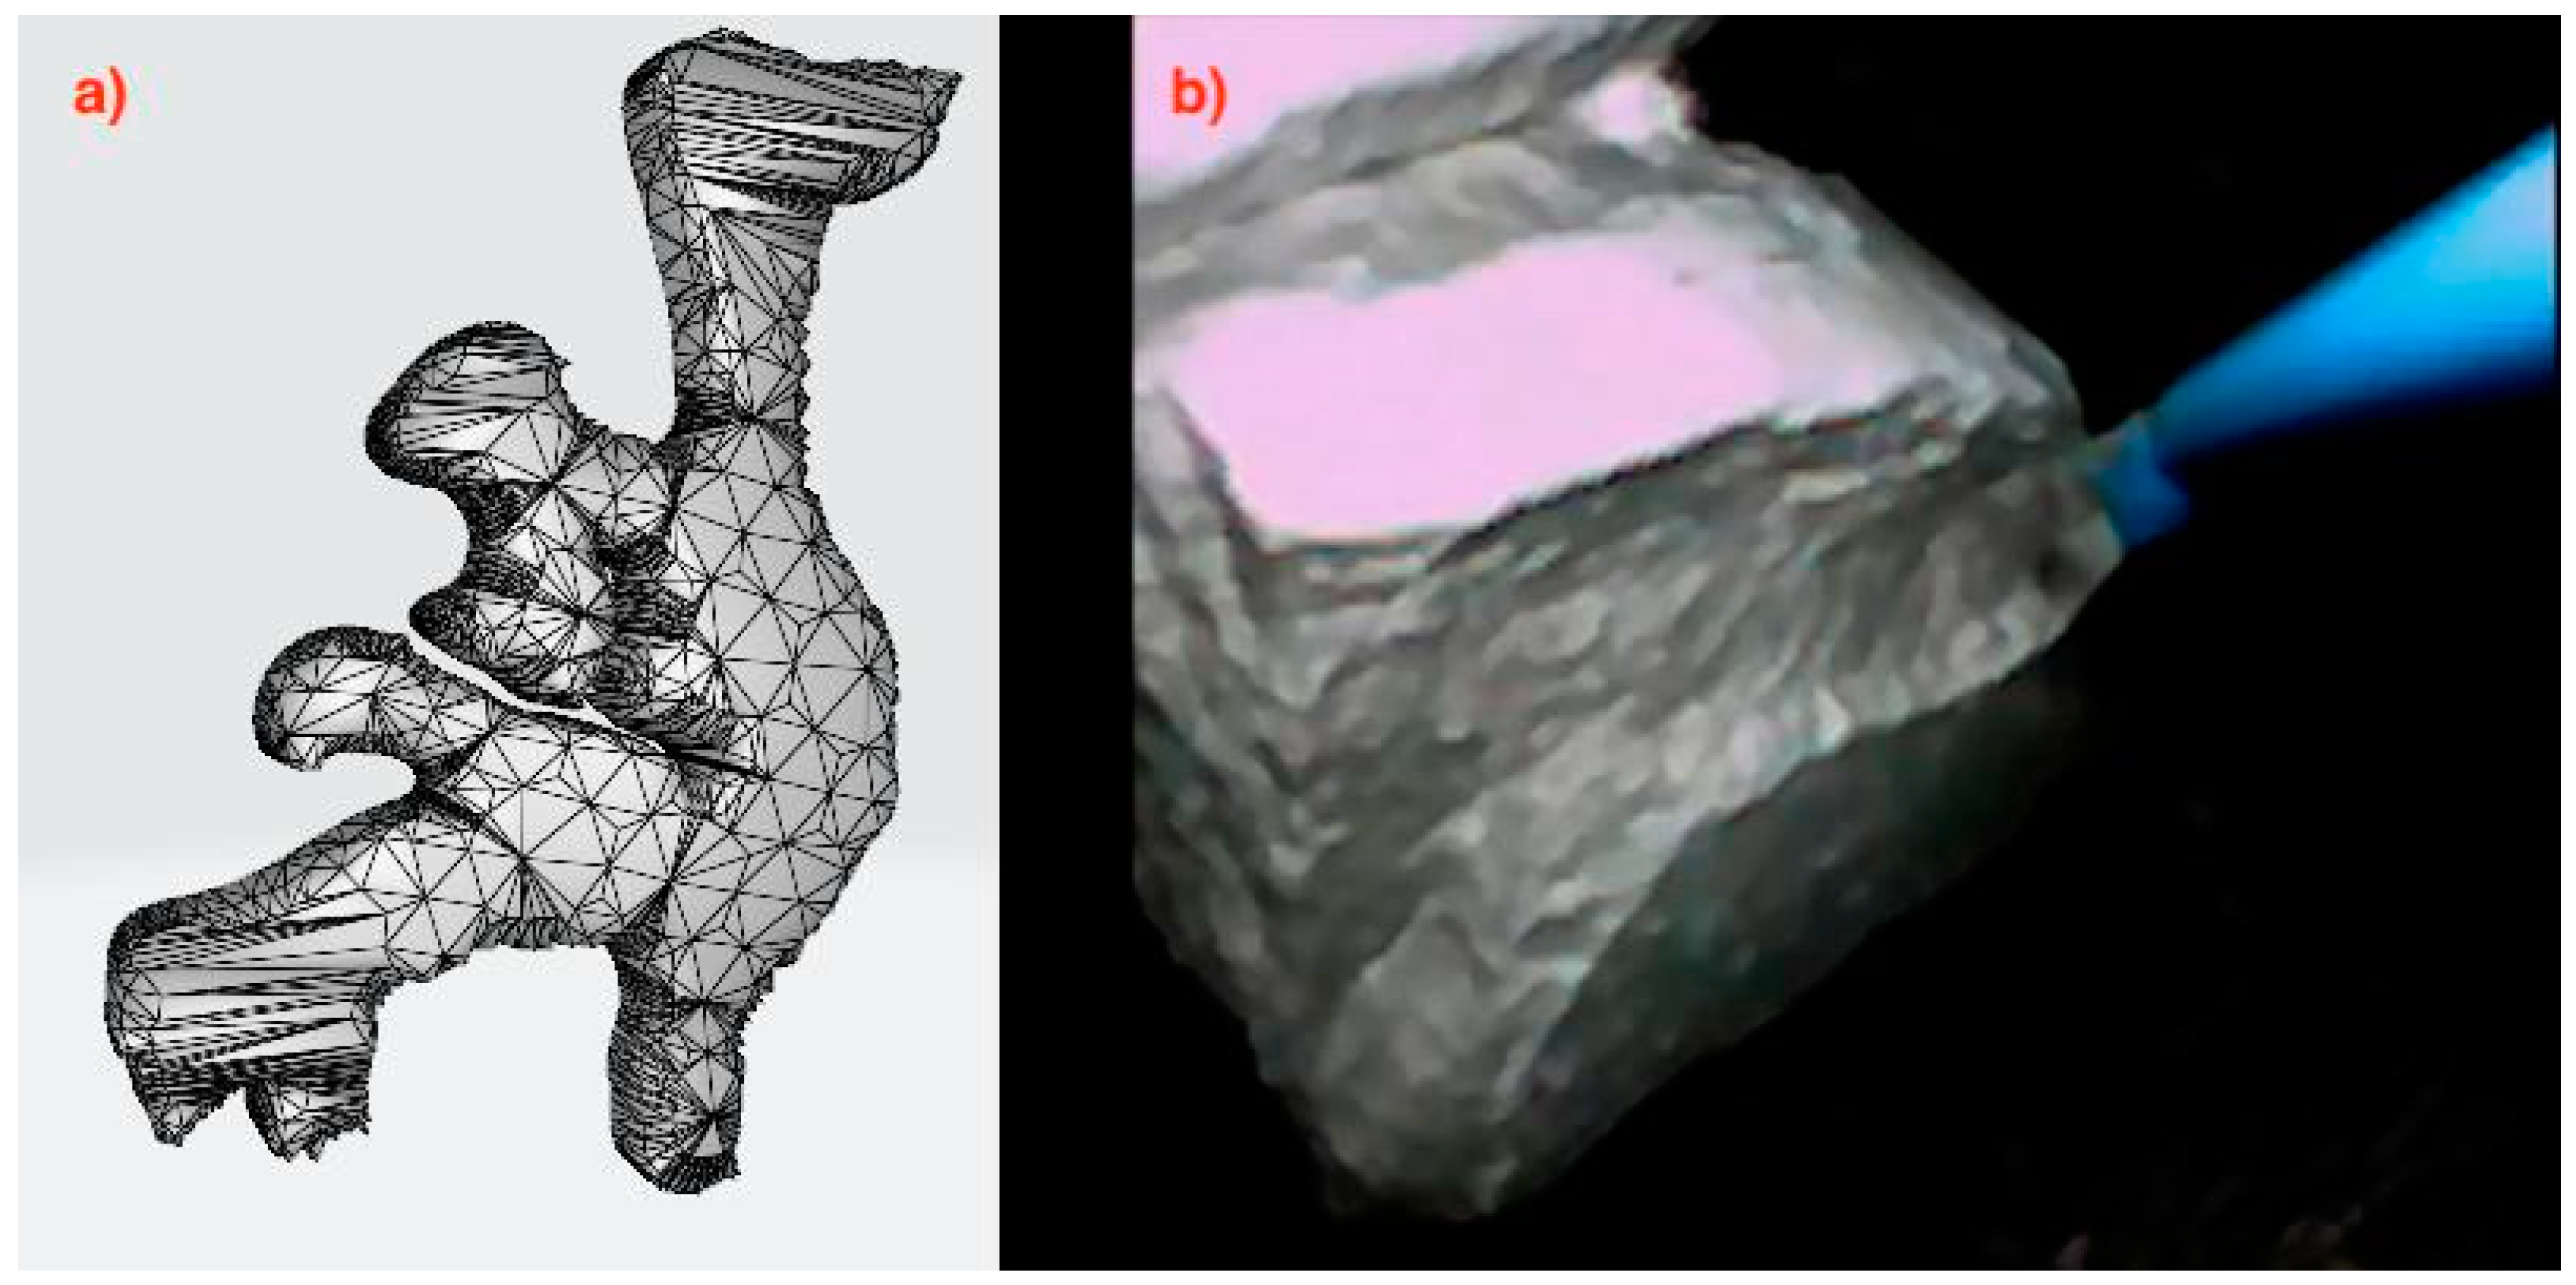
On the basis of the computed tomography (CT) scans, DICOM files were extracted, and the model was created. The first essential task was to determine the structure of the model in order to select the appropriate method, and then transform it morphologically using Boolean operations, followed by the creation of a “triangle network” mask with specified parameters and density, and then exporting the 3D image to an a.stl file (
Figure 1a). The pelvicalyceal tract model was obtained using the Ultimaker 2+ Connect 3D printer working in Fused Filament Fabrication (FFF) technology, from plasticised thermoplastic polyurethane (TPU) according to patent application P.442625 (application to the Patent Office of the Republic of Poland on 24 October 2022—WIPO ST 10/C PL442625). The phosphate stones were chemically synthesised from phosphate salts (calcium phosphate), which were mixed in a 3:1 ratio with distilled water and acrylic styrene resin (1:1) (
Figure 1b). A hydraulic press at a pressure of 3 MPa was used. The roasting temperature in the tube furnace was 950 °C.
2.2. Intrapelvic Pressure Measurement
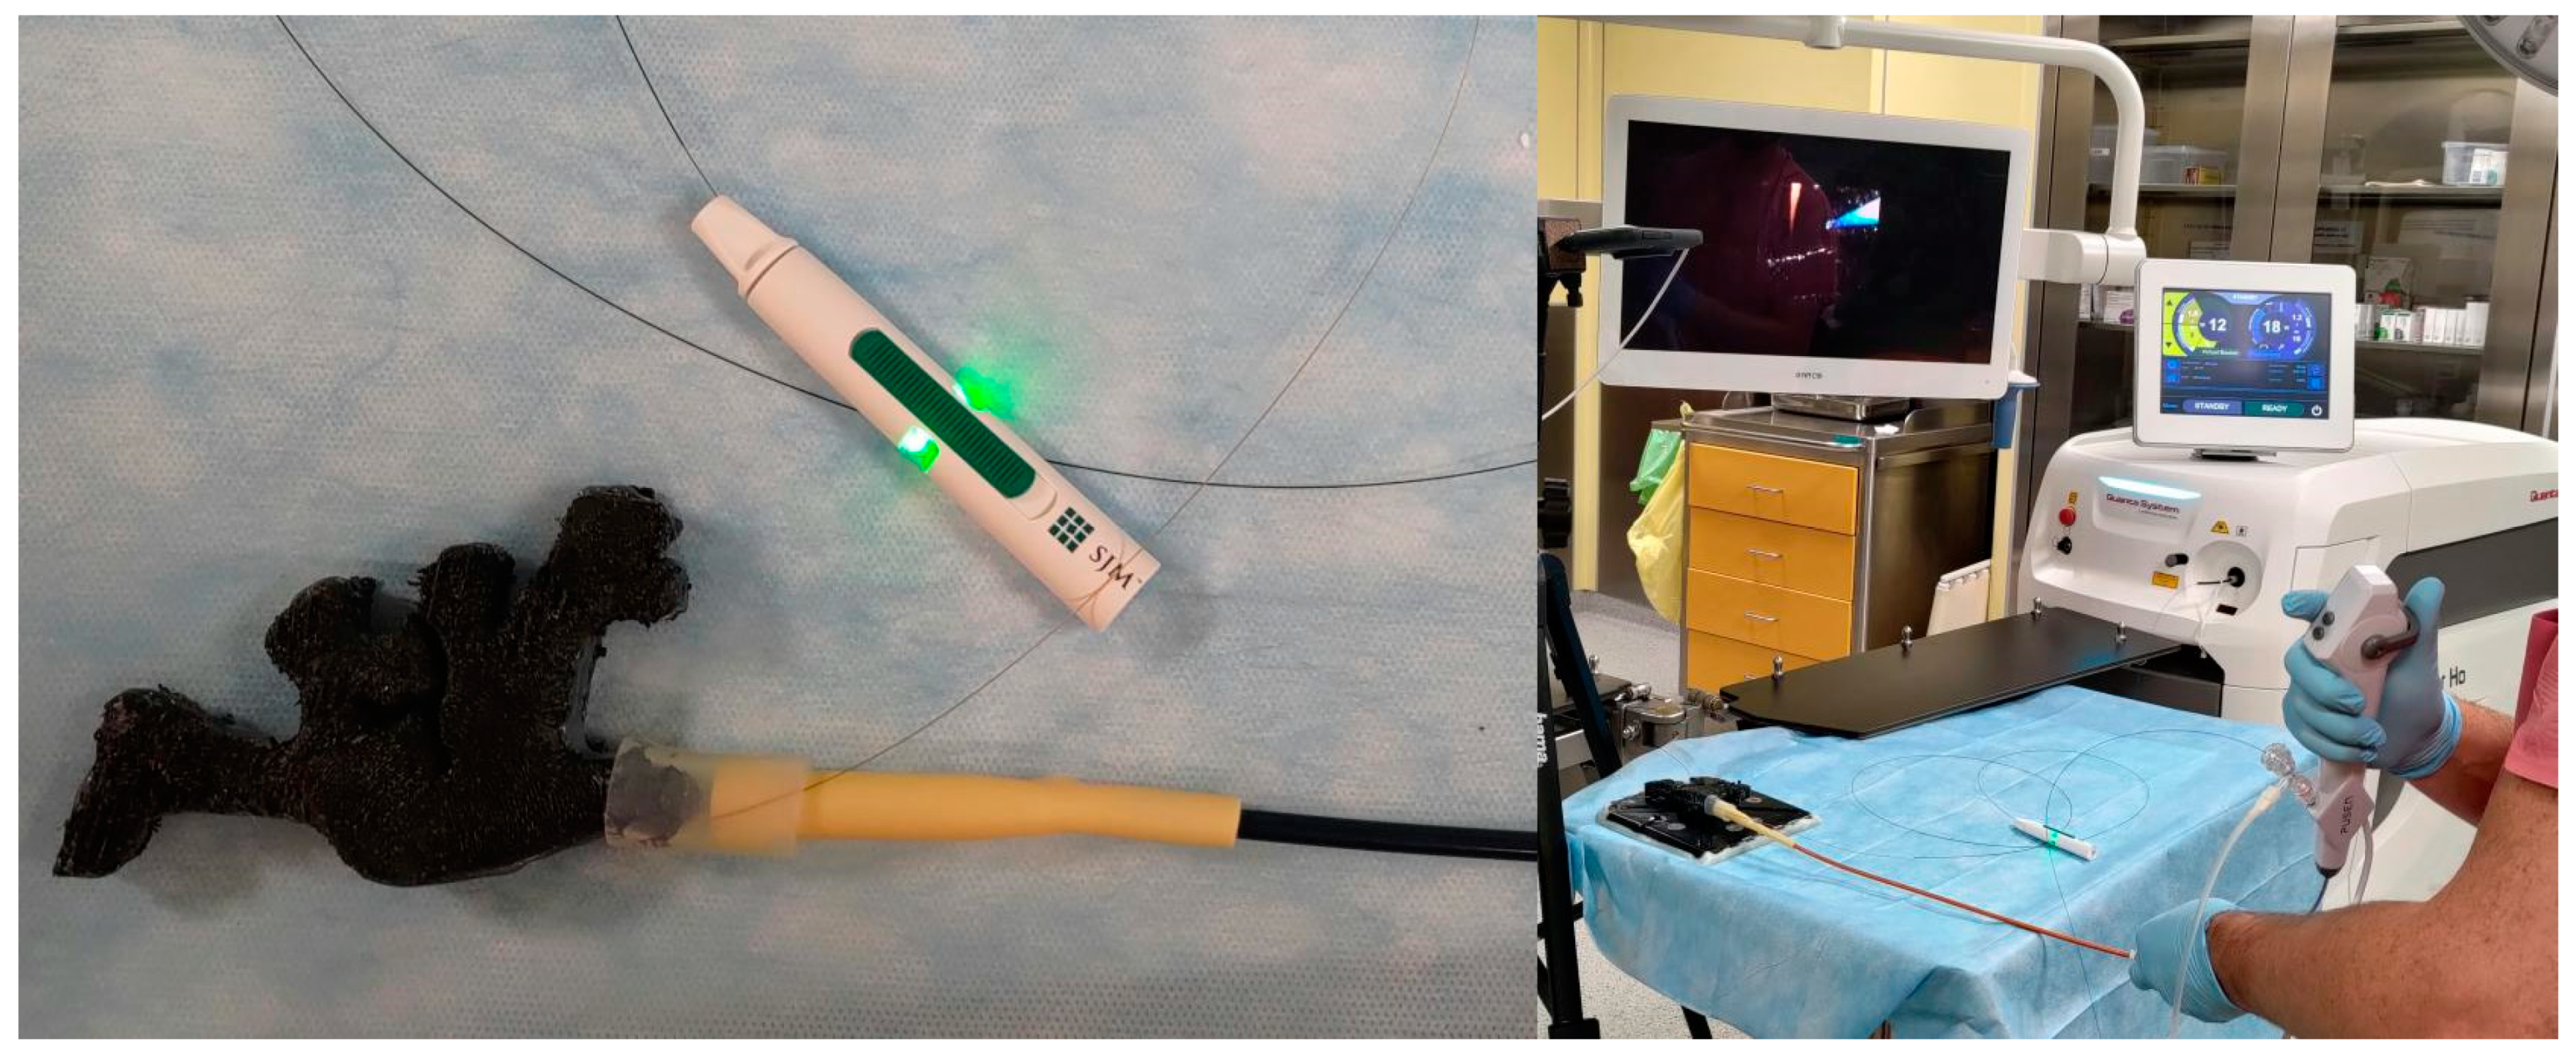
IPP monitoring during RIRS was performed using PressureWire X Guidewire (Abbott Medical, Plymouth, MA, USA) compatible with the CoroFlow system (Coroventis Research AB, Uppsala, Sweden) dedicated to displaying measured values. The pressure measurement method used in the study is one of the tools available for real-time pressure measurement in the renal pelvis. The PressureWire Guidewire has been used in two studies published hitherto. Doizi et al. analysed pressure measurements during five flexible ureterorenoscopies for kidney stone disease [
6]. In the prospective pilot study by Sierra et al., the system was used during flexible ureterorenoscopy for different treatments (authors included 20 patients in the study) [
10]. The pressure signal was transmitted wirelessly to the CoroFlow system using a CoroHub transmitter (
Figure 2). The sampling rate of the CoroFlow system reaches 100 Hz, and the accuracy of pressure measurement is 0.1 mmHg. The CoroFlow measures the pressure values automatically in mmHg; therefore, for the purposes of our study, the results obtained were converted to cmH
2O. The recordings of the IPP generated during the procedures were blinded to the operator and assistant.
2.3. Study Design
The 3D printed model and the chemically synthesised stones were used in the study. All RIRS procedures were performed under almost identical conditions using a 3D model and phosphate artificial stones of comparable size deposited in the renal pelvis of the model. The 3D printed pelvicalyceal system, together with the ureteropelvic junction, was sealed with hot melt adhesive after placing the stone in the renal pelvis. The average stone size was 471.6 mm
3 (the volume was calculated according to the formula of Sorokin et al. A × B × C × 0.524 [
11]). The average dimensions of the stones were as follows: length 15 mm, width 12 mm, height 5 mm. The mean stone density in NCCT was 1021 HU (620–1383, SD ± 150). A flexible ureteroscope (Pusen, Zhuhai, China; PU3022A) was used by insertion through the 10/12Fr (Flexor; Cook Medical; Bloomington, IN, USA) or 12/14Fr (ReTrace; Coloplast, Fontenay-sous-Bois, France) ureteral access sheath, which was placed approximately 1 cm below the model ureteropelvic junction. The ureteral access sheath was attached to the model with a rubber connector. A holmium:YAG laser (Quanta System Cyber Ho 60 W; Samarate, Italy) with a 272 mm laser fibre (Quanta System; Samarate, Italy) was used to fragment the stones (
Figure 3).
Constant gravity-based irrigation was used, with a height of 50 cm above the model, and a hand pumping system if necessary. The hand pumping system was used on-demand during lithotripsy when reduced visibility made it difficult to continue the procedure. The operator has 15 years of experience in endourology, including 8 years of experience in RIRS. The laser energy and pulse frequency were used in 7 fixed settings. The laser power ranged from 12 to 25 watts. The pulse frequency was in the range of 10 to 50 Hz, while the energy was in the range of 0.3 to 2.5 joules. All procedures were carried out in dusting mode using the virtual basket option. Endourological materials, such as flexible ureteroscope, holmium laser fibre, and ureteral access sheath, were recycled and disinfected for study use. The PressureWire was placed in the model’s renal pelvis. We started recording intrapelvic pressure measurements after filling the model with fluid shortly before beginning the lithotripsy. The baseline intrapelvic pressure in the model after fluid filling was 6.8 cmH2O.
2.4. Methodology
The significance level of the statistical tests in this analysis was set at α = 0.05. The remaining pressure values with units of mmHg were multiplied stepwise by 1.35951 to convert to cmH2O. The effects of the categorical explanatory variables group (two categories) and the parameter (seven categories) on the numerical IPP response variable were estimated using a multiple linear regression model.
The model was designed as a 7 × 2 factorial ANCOVA and fitted with the ordinary least squares (OLS) estimator based on Formula (1):
represents the model intercept, the expected IPP for the baseline group and parameter categories. represents the expected increase in IPP in the case of a category of group different from the baseline with the baseline parameter category. represents the interaction effect between the parameter and the group as moderator. Finally, the error terms represent the deviations between actual and predicted IPP that are not explained by a linear trend. The variability of these deviations from the regression model is denoted by . The interpretation of the magnitude of the coefficients of determination of the fitted model was based on Cohen’s convention. The deviation of the values of the coefficients of the regression model from zero was tested with the F-test. The mean IPP at all factor levels was estimated using the marginal means. In the first step, estimated marginal means were performed for the main effect of the group, and in the next for the interaction effect of the parameters within the groups. The significance of the differences between the estimated marginal means was determined using marginal contrast analysis. The effect sizes of the marginal contrasts with the corresponding confidence intervals were calculated using the pairwise differences of the estimates, taking into account the uncertainty in both the estimated effects and the standard deviation of the population (Cohen’s d effect size). Standardised parameters were obtained by fitting the model on a standardised version of the data set. A Wald t-distribution approximation was used to calculate 95% confidence intervals and p-values.
2.5. Statistical Environment
Analyses were conducted using the R Statistical language (version 4.1.1; R Core Team, 2021) on Windows 10 Pro 64 bit (build 19045), using packages lme4 (version 1.1.27.1), Matrix (version 1.5.1), effectsize (version 0.8.3), emmeans (version 1.8.2), interactions (version 1.1.5), sjPlot (version 2.8.14), performance (version 0.10.4), modelbased (version 0.8.5), report (version 0.5.1.3), psych (version 2.1.6), broom (version 1.0.1), readxl (version 1.3.1) and dplyr (version 1.1.2).
3. Results
3.1. Characteristic of the Sample
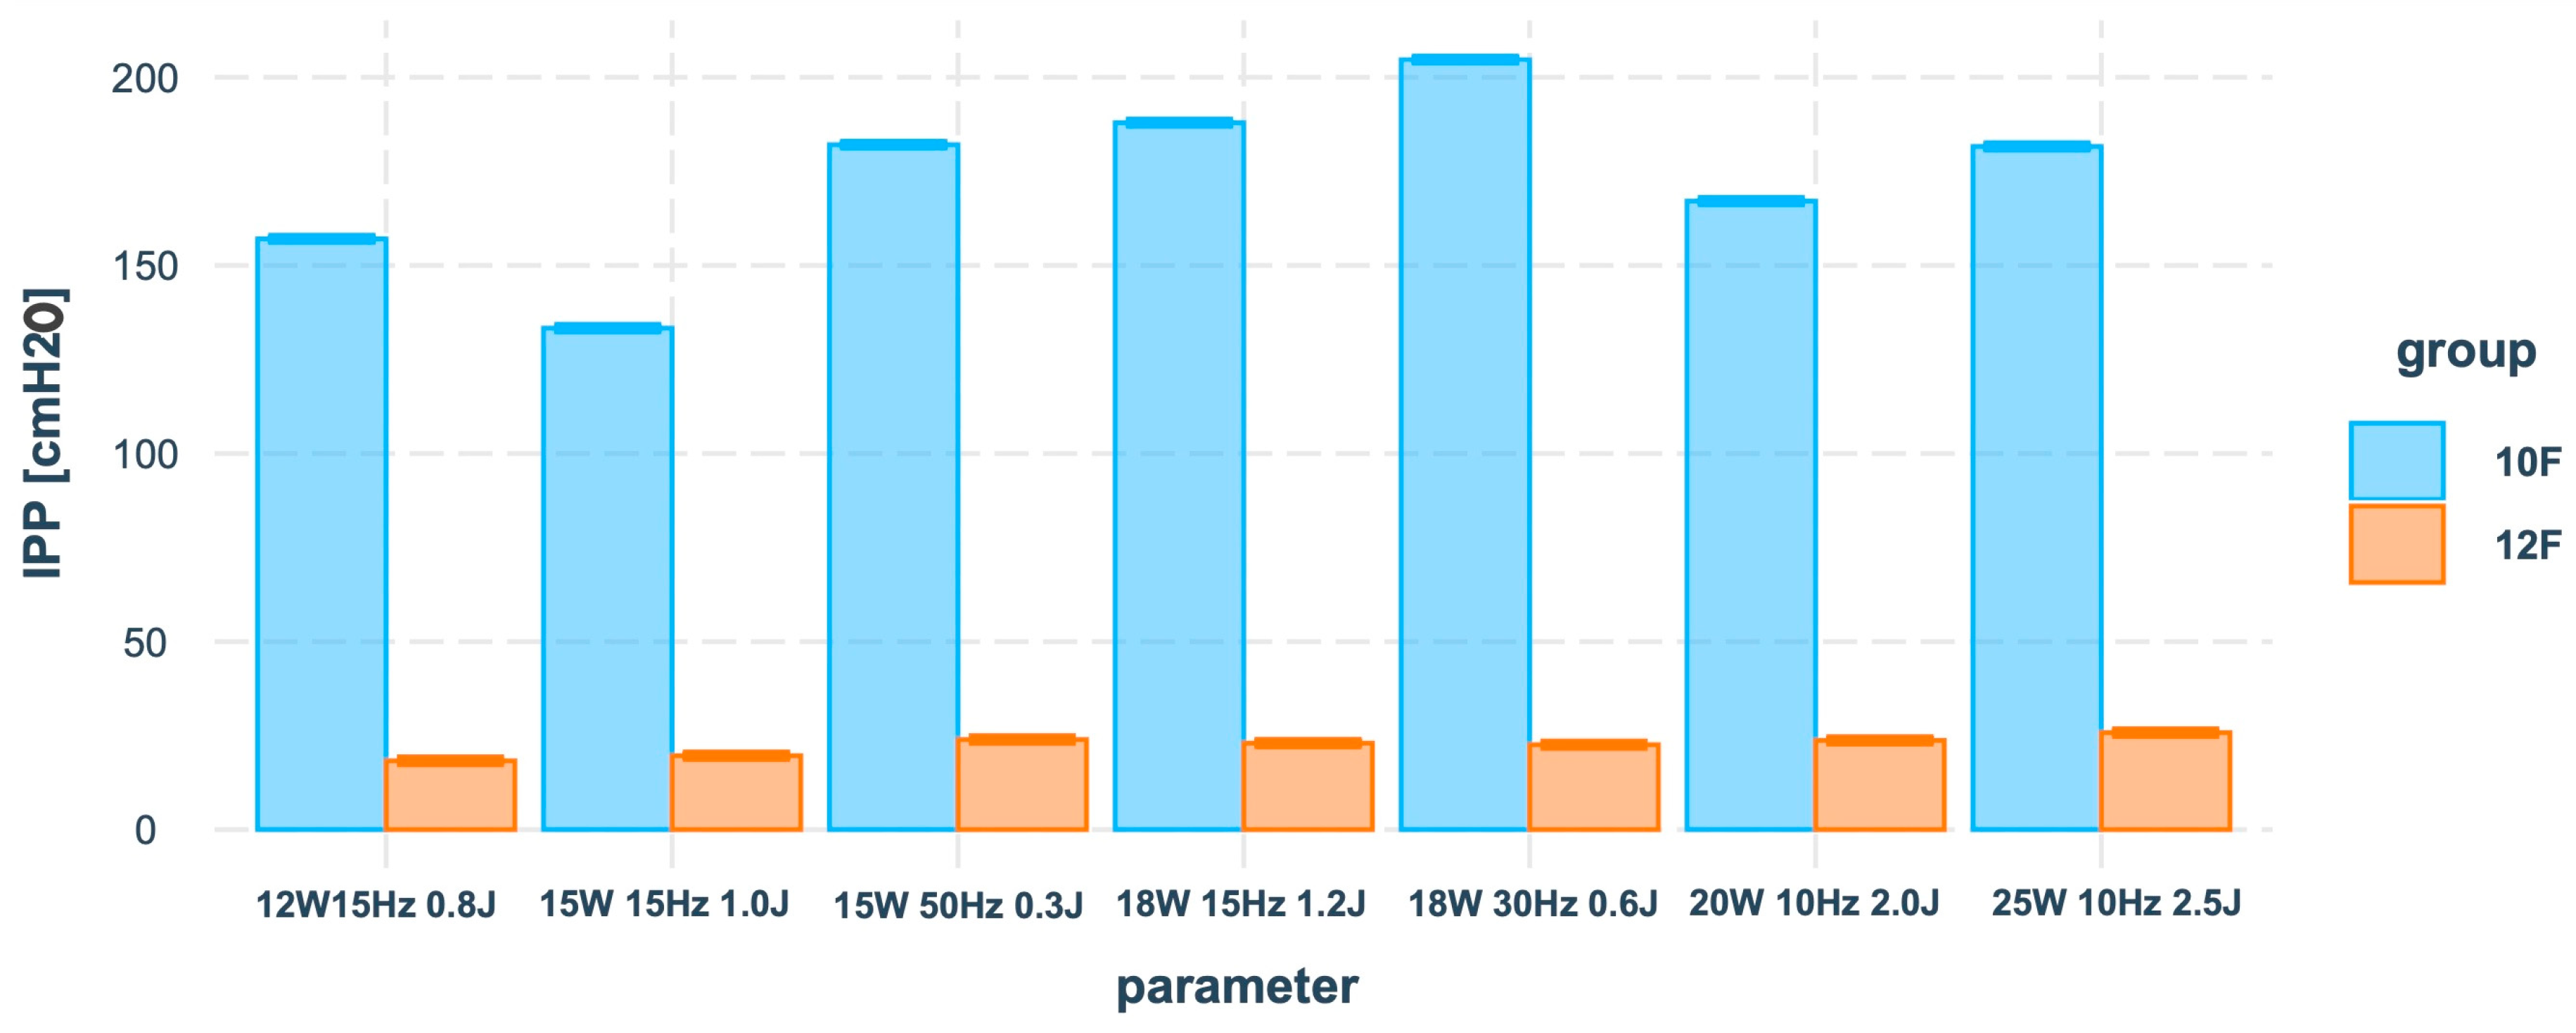
The results of pressure measurements provided during a total of 50 RIRS procedures in 3D printed models with chemically synthesised stones (25 RIRS procedures with the use of 10/12Fr UAS and 25 with the use of 12/14Fr UAS) were eligible for the study. The sample of N = 4,880,251 IPP readings in the 10/12Fr AUS (n1 = 2,957,775) and 12/14Fr UAS (n2 = 1,922,476) groups was analysed for seven parameters. Each parameter represented an aggregate holmium:YAG laser setting of the watts/hertz/joule value.
The descriptive statistics of the IPP distributions for groups 10/12Fr and 12/14Fr UAS without breakdown of parameters are shown in
Table 1.
The descriptive statistics of the IPP distributions for the 10/12Fr and 12/14Fr UAS groups by individual parameters can be found in
Table 2.
Estimation of the group effect on the IPP value was first investigated in the framework of a mixed model with a random effect in the form of parameter categories (formula: IPP ~ group + (1|parameter)). However, the results of the values of the coefficients of determination R2Conditional = 0.58, R2Marginal = 0.56, and the very low value of ICC = 0.04 evidenced a lack of variance differences within each category of random intercepts, so the effect of the group was estimated based on the OLS model.
3.2. Study of Group and Parameter Effects on IPP in the Form of an ANCOVA Model
We fitted a linear model to predict IPP with group and parameter (formula: IPP ~ group + parameter * group). The model explained a statistically significant and substantial proportion of variance (R2 = 0.59, F(13, 4880237) = 5.32 * 105, p < 0.001, R2adj = 0.59).
The estimated marginal means for the groups only and for the parameters within the groups can be found in
Table 3 and
Table 4.
The estimated marginal contrast for the group (10/12Fr-12/14Fr) in
Table 3 was 150.98 cmH
2O,
95% CI [150.86, 151.10],
SE = 0.06,
p < 0.001 with large effect size,
d = 2.37,
95% CI [2.37, 2.38],
SE < 0.01.
The results of the contrast analysis along with the effect sizes between the 10/12Fr and 12/14Fr w groups for each parameter are shown in
Table 4.
See
Figure 4 for a visualisation of the IPP means of conditional effects between groups and the parameter predictor based on the results of
Table 4.
Calculation of the standardised model coefficients suggested that the absolute value of the main effect of the group factor on IPP β1 = |1.40| was much higher than the absolute values of the interaction effects of the parameter and the group factors β2 = [|0.10|, |0.48|].
The results of the contrast analysis in
Table 5 showed significant differences between the 10/12Fr and 12/14Fr groups interpreted as large (
d ≥ 0.80).
4. Discussion
The enormous technological advances in endourology that have occurred over the past two decades of the 21st century have led to the dominance of minimally invasive methods in the catalogue of surgical treatments for kidney stones. The challenge of modern endoscopic urology in the treatment of urolithiasis is to establish a universally applied method for the real-time evaluation of physical conditions in the upper urinary tract during surgery. The consequences of increased IPP are urinary tract infections, increased risk of bleeding, and damage to the renal parenchyma [
12,
13]. Heretofore published studies have indicated that, regardless of the IPP measurement method, the equipment used, or the instrument’s size, the pelvic pressure generated can exceed the safe threshold value of 40 cmH
2O a few times. The morphological consequences for the kidney as a result of high IPP were revealed in animal studies. High pressure elicited diffuse denudation and flattening of the calyx urothelium, submucosal oedema and congestion, which were not observed in calyxes undergoing low-pressure irrigation. Four to six weeks later, a higher incidence of columnar metaplasia, subepithelial nests, and periurethral vasculitis was observed in high-pressure treated calyces compared to low-pressure irrigated ones [
14].
A factor with a protective function for the upper urinary tract during flexible URS is UAS. First applied in 1974 by Hisao Takayasu and Yoshio Aso [
15], UAS is currently a standard option when performing flexible URS. Based on the results of the animal study reported by Neuraldin et al., a larger UAS (12/14Fr and 14/16Fr) mitigated intrarenal pressure, while smaller access sheaths (9.5/11.5Fr) provided inadequate drainage ureteroscopy [
16]. Surgeons prefer a 10/12Fr and 12/14Fr size in most cases [
1]; therefore, the primary objective of our study was to analyse the IPP according to these sizes of the UAS used. In addition, some studies have shown that a reduction in the size of the ureteroscope used for fixed-size UAS also results in a reduction in IPP [
17,
18,
19].
The evidence on changes in IPP in the pyelocalyceal system during flexible URS is mainly based on single animal model studies published hitherto. Animal studies evaluated IPP using a wire inserted through a nephrostomy tube (in some studies, using urodynamic devices). The cutting-edge study was published in 2021 by Doizi et al. [
6]. The authors, using a sensor (The PressureWire Guidewire) for real-time measurement of IPP inserted into the renal pelvis through the ureter, evaluated changes in intrapelvic pressure during flexible URS in four patients. Following the results reported by Doizi et al., the mean IPP during laser lithotripsy using on-demand forced irrigation was 115.3 cmH
2O. The maximum peak pressure measured during the therapeutic period using forced irrigation was 436 cmH
2O for UAS 10/12Fr, while for UAS 12/14Fr, it reached approximately 340 cmH
2O [
6]. The second study that assessed IPP during flexible URS was one reported in 2023 by Sierra et al. Using PressureWire Guidewire, the authors measured changes in IPP in a group of 20 patients undergoing flexible URS. The median IPP during the therapeutic period with the use of forced irrigation on demand reached 61.2 (27.2–149.5) cmH
2O. The maximum peak pressure measured during the therapeutic period using forced irrigation was 236.6 cmH
2O for UAS 10/12Fr, while for UAS 12/14Fr, it reached 171 cmH
2O [
10].
Printing a 3D model of the pelvicalyceal system on the basis of a RIRS trainer (according to the patent application P.442625) and producing chemically synthesised stones allowed a statistically significant series of RIRS procedures to be performed under almost the same conditions, as well as using PressureWire Guidewire to measure the dynamics of IPP (total of 50 procedures). For the first time, the authors used a 3D model that allowed simulation of the RIRS procedure to assess IPP. The study performed provides a new complement to the knowledge of IPP during flexible URS, and repeatable ex vivo conditions allowed RIRS to be simulated using different holmium laser parameters without any risk to the patient. For the printing of the model, thermoplastic polyurethane (TPU) was chosen after the available materials were analysed because, to the authors’ knowledge, it most closely reflects the biostructure in terms of hardness and elasticity. In comparison, one of the new 3D models of the upper urinary tract dedicated to the simulation of the RIRS procedure is the model proposed by Orecchia et al. The authors introduced the models of the upper urinary tract which were digitally optimised and 3D printed from real-life cases. An additional advantage of the trainer is 3D printed models of urinary stones with two different degrees of hardness. The presented system allows us to perform RIRS simulation, which allows us to learn how to explore the pelvicalyceal system, as well as the performance of lithotripsy [
20]. Our model similarly allows us to learn how to navigate a flexible ureteroscope in the pelvicalyceal system, while chemically synthesised stones of different densities enable us to perform laser lithotripsy even more faithfully, which, according to the perception of the surgeons participating in the testing phase of the trainer, practically reflects the real lithotripsy in the patient’s body. The lithotripsy of chemically synthesised calculi is not free from the phenomenon of residual lithotripsy formation and the dusty environment in which we work, which fully reflects natural conditions. Another system for RIRS simulation is the model presented by Trelles Guzmán et al. It is also based on a 3D printout of the upper urinary tract, which allows us to learn how to manoeuvre flex-URS and how to mobilise and evacuate natural kidney stones deposited in the pelvicalyceal system using an endoscopic basket. The model in the presented version does not allow one to simulate laser lithotripsy [
21].
According to our study, the median IPP measured during the therapeutic period using forced irrigation on demand was 172 cmH2O for UAS 10/12 Fr, while for UAS 12/14Fr, it was 21 cmH2O. The maximum peak pressure measured during the therapeutic period using forced irrigation on demand was 461.7 cmH2O for UAS 10/12 Fr, while for UAS 12/14Fr, it reached 106.5 cmH2O. The estimated marginal means (EMMs) of IPP for the 10/12Fr and 12/14Fr groups were 173,43 cmH2O and 22.46 cmH2O, respectively. The results of the contrast analysis showed significant differences between the 10/12Fr and 12/14Fr groups regardless of the laser parameters used. The size of the UAS is an important determinant of the IPP generated during surgery that, with the current technology stage that does not allow for continuous intraoperative pressure monitoring, is an important element that the surgeon should always consider.
The use of the PressureWire Guidewire with retrograde approach provides an effective and safe tool for monitoring IPP, a system that is dedicated to assessing the pressure gradient in the coronary arteries, while in endourology it is currently being used in an experimental phase. At the experimental stage, a preliminary assessment of the system used could already be made: the 0.36 mm wire is safe for the patient, and it allows real-time measurement of IPP; the guidewire works in wireless mode, which greatly facilitates work during RIRS. A notable drawback is the high price and the single use option. In addition, performing lithotripsy during RIRS with PressureWire Guidewire in the pelvicalyceal system requires the operator to take additional care with the laser fibre especially when the working space in the kidney is small (in our study, wire damage occurred during a single procedure due to the laser beam being directed on the wire). An innovation in endourology equipment is the LithoVue Elite (LVE) ureteroscope (Boston Scientific Corp., Marlborough, MA, USA), the first flexible ureterorenoscope with the capability of continuous intraoperative monitoring of IPP during RIRS. In September 2023, the first results of the study using the new system were published. Bhojani et al. reported the results of a single-arm retrospective observational analysis of 50 patients undergoing RIRS. The authors conclude that the new ureteroscope will allow us to better understand the role that IPP plays in the clinical outcomes of URS [
22].
Study Limitations
The experimental study highlights the importance of IPP evaluation during laser lithotripsy; however, it is not devoid of some limitations. The idea of the study was to evaluate the effect of the size of the UAS used on the IPP during laser lithotripsy, and hence, the study was designed to maximise the similarity of the lithotripsy conditions, with the variables being the size of the UAS and the holmium laser parameters. Three-dimensional printed models based on CT images of a patient were used for the study. The thermoplastic polyurethane used to print the models does not replicate the natural elasticity of the pelvicalyceal system; however, according to experts in the field, it matches the physical parameters of the renal collecting system. The models were printed according to the patent application but were not externally validated. The chemically synthesised stones were placed only in the renal pelvis of the models to standardise the conditions in the working space of the renal collecting system.


