1. Introduction
A comprehensive analysis of postural abnormality is necessary, since many healthcare practitioners often deal with lower-extremity musculoskeletal disorders (MSD) that could potentially influence people’s quality of life [
1]. Among all diseases in Saudi Arabia, MSD was seventh in prevalence with an age-standardized prevalence of 19.05% in 2019. Additionally, MSD were the second-highest cause of disability between 1990 and 2019, affecting more women than men [
2]. Typically, young females with MSD experience balance abnormality which mostly affects their dynamic balance [
3,
4]. Proper dynamic balance is necessary for implementing a number of daily functional tasks, such as walking, stair negotiation, as well as for occupational tasks and leisure [
5]. Clinically, Star Excursion Balance Test (SEBT) is a widely used assessment tool that is commonly conducted to evaluate dynamic balance irregularities. The SEBT has been simplified into three main directions: the anterior (ANT), posteromedial (PM), and posterolateral (PL) directions, and termed as modified star excursion balancing test (mSEBT).
Similar to SEBT, healthcare providers commonly use mSEBT to assess dynamic balance [
6] as it considered reliable and valid method when used with both healthy and injured individuals [
7,
8]. Moreover, the mSEBT test offers a practical alternative to less comprehensive assessments such as measurements of range of motion [
6]. The test scores have also been related to lower extremity deficits in patients with lower extremity MSD and have been shown to be injury predictors in athletes [
9,
10]. Although understanding the association between postural stability and the strength of lower extremity muscles may be crucial to recognize individuals who are more susceptible to injury [
11], previous studies were limited to assess the association between the reached distance values and lower extremity strength in old age or sports injuries individuals [
12,
13,
14]. No studies to date have examined the association between mSEBT and the strength of lower extremity muscles in young healthy females.
The balance test requires strength, as well as flexibility, however, the mSEBT is merely a test and does not assess the etiology of the disorder [
15]. Therefore, the mSEBT may be useful in exploring flexibility asymmetries and flexibility deficiencies in the lower extremity in healthy adults, but other tests may also be integrated in order to provide a more comprehensive view of functional mobility and injury risk [
16]. Recently, Kim and Yim hypothesized that improvements in hip muscle flexibility could improve balancing capacity through changing hip joint strategies [
17].
Understanding these relationships is crucial not only for expanding our knowledge of dynamic balance in this population, but also for identifying individuals who may be more susceptible to injury. The insights from this study may have implications for the development of targeted interventions to enhance balance, particularly in anterior and posteromedial reach movements. Such interventions could benefit a range of individuals, from athletes to those undergoing physical therapy, by optimizing both flexibility and strength for specific reach movements. As a result, investigating the correlation between mSEBT and lower limb muscular flexibility and strength is of clinical importance. A societal investigation is still needed to assess balance and lower limb muscular strength and flexibility. To the best of our knowledge, convincing data on female Saudi populations are not yet available. Hence, the main objective of this study was to establish the association between the mSEBT score and the strength and flexibility of lower extremity muscles in young healthy Saudi females.
2. Materials and Methods
2.1. Design
A cross-sectional study was conducted to assess the association between mSEBT distance and the lower extremity muscles strength and flexibility of healthy young females in Saudi Arabia.
2.2. Sample Characteristics
Seventy-four healthy females participated in this study. Participants who completed the mSEBT and were aged 18 to 25 were included in the study. This sample size was carefully determined through a priori power analysis (G*power 3.1 software), ensuring that our study maintains a type I error rate (α) below 0.05 and a type II error rate (1-β) below 0.20 while detecting a large effect size of 0.7. This statistical power analysis specified that a total of 72 subjects would be enough to establish a power of 0.95 with a large effect size of 0.7. Participants who were outside the age range or unable to complete the test were excluded from the study. None of the participants had been injured in the previous 6 months or reported an impairment in a lower extremity. Injury in the present study was defined as any disorder that could prevent the participant from her workout routine. Participants who suffered from visual, vestibular, neurological and/or musculoskeletal disorders or received medicine that potentially influence their balance were also excluded. Prior to enrolling in the study, each participant provided written informed consent.
2.3. Instruments
In this study, a MicroFet2 Hand-Held Dynamometer (Hoggan Health Industries, Salt Lake City, UT, USA) was employed to assess muscle strength. The MicroFet2 is a portable and reliable device that measures muscle strength in a specific muscle group of the lower extremity. It provides precise measurements in pounds (lbs) and has been validated for its accuracy in various clinical settings.
The sit-and-reach test utilizes a wooden box with specified dimensions: base length 35 cm, width 45 cm, height 32 cm, and overall length 55 cm. A standard meter rule is securely placed on the sit-and-reach box, ensuring that the reading of 23 cm aligns with the participant’s heel position for consistent measurement. The sit-and-reach box was employed to assess muscle flexibility.
The SEBT is designed to assess the dynamic postural control, wherein the individual stands on one leg at the center of a star-shaped pattern on the floor. Afterward, individual instructed to reach as far as possible with the other leg in eight specific directions for balance evaluation [
18,
19]. The SEBT has been shown to be a valid and reliable tool for assessing postural control with good to excellent intratester and intertester reliability (intraclass correlation coefficients 0.76 to 0.93) [
6,
7] In contrast, the mSEBT, which was employed in this study, serves as a measure of dynamic stability. The choice of using mSEBT is justified by the increased challenge it presents in maintaining balanced pelvic movement over the stance leg during directional reaches [
20,
21]. Failure to control this pelvic movement has implications for neuromuscular control at the hip joint, potentially leading to patellofemoral dysfunction and an elevated risk of Anterior Cruciate Ligament (ACL) injury [
22,
23].
2.4. Procedure
Participants who satisfied the participation criteria for the study were instructed to change into comfortable wear. Initial assessments encompassed height and weight measurements, followed by a number of anthropometric measurements which included limb length (measured in a supine position from anterior superior iliac spine to the center of ipsilateral medial malleolus), femur length (measured from greater trochanter to lateral knee joint line), shank length (measured from lateral knee joint line to the tip of the medial malleolus), and pelvic width (measured from right anterior superior iliac spine to the left anterior superior iliac spine). Lastly, participants were allowed to run on treadmill for a 5 min at their own pace. In the following five minutes, a dynamic stretching exercise was performed.
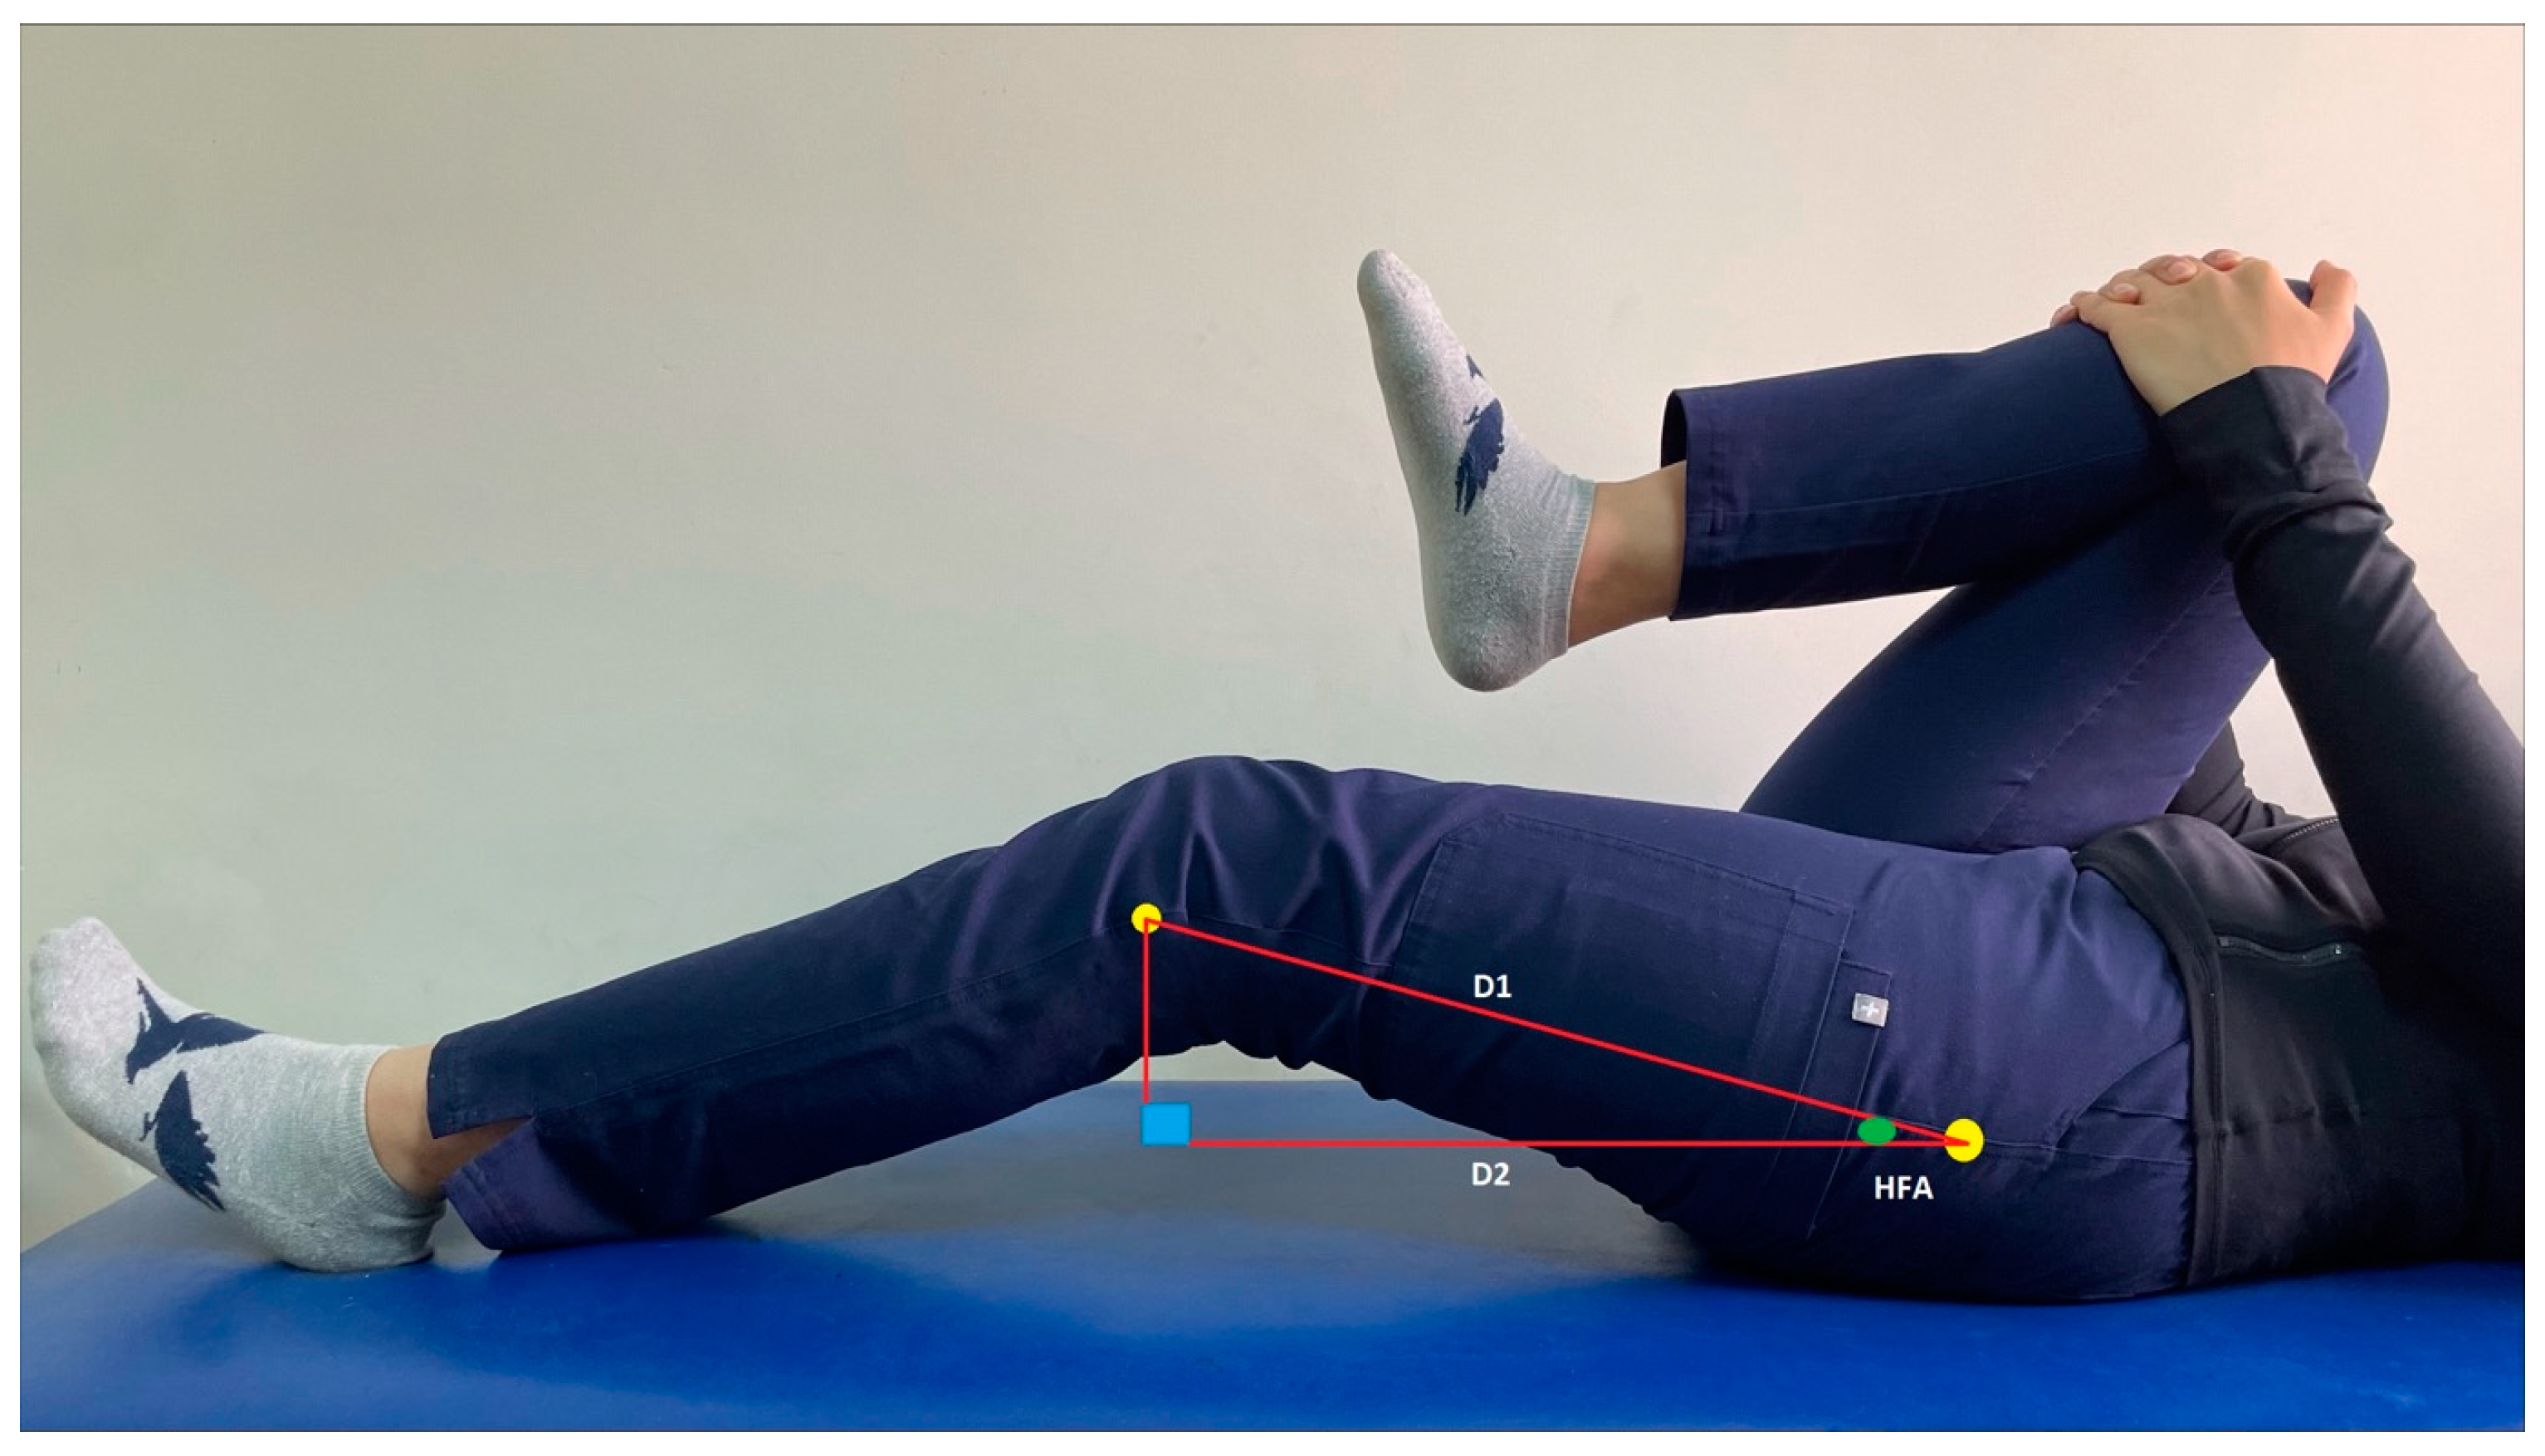
The flexibility testing was carried out after completing the warming-up period. Initially, the flexion hip range was measured bilaterally using the Thomas test [
24]. This maneuver helps in quantifying the hip flexion angle (HFA) and consequently reflects the flexibility of hip flexor muscles (
Figure 1). The distance between the greater trochanter and the head of the fibula was measured (D1). Afterward, the participant assumed a supine lying position and the investigator bent one of her hips to approximately 90° or slightly higher to flatten the lumbar spine and stabilize the pelvis. Excessive hip flexion is not recommended, as it could move the hip from its neutral position. The participant was instructed to hold the aforementioned position using crossed hands around the flexed knee while the examiner measured the vertical distance from the fibular head of the extended limb to the testing table (D2). In order to quantify the flexibility of the lower back and hamstring muscles, a sit-and-reach test was carried out using a testing box. Based on guidelines of the American College of Sport Medicine, the participant placed her bare feet against the testing box, keeping her knee straight. Then, the participant was instructed to gradually reach both hands simultaneously forwards as far as possible. Once the participant reached the maximum forward distance and held this reach for a minimum of 2 s, the measurement was recorded. The participant was requested to repeat this process for three trials [
25,
26].
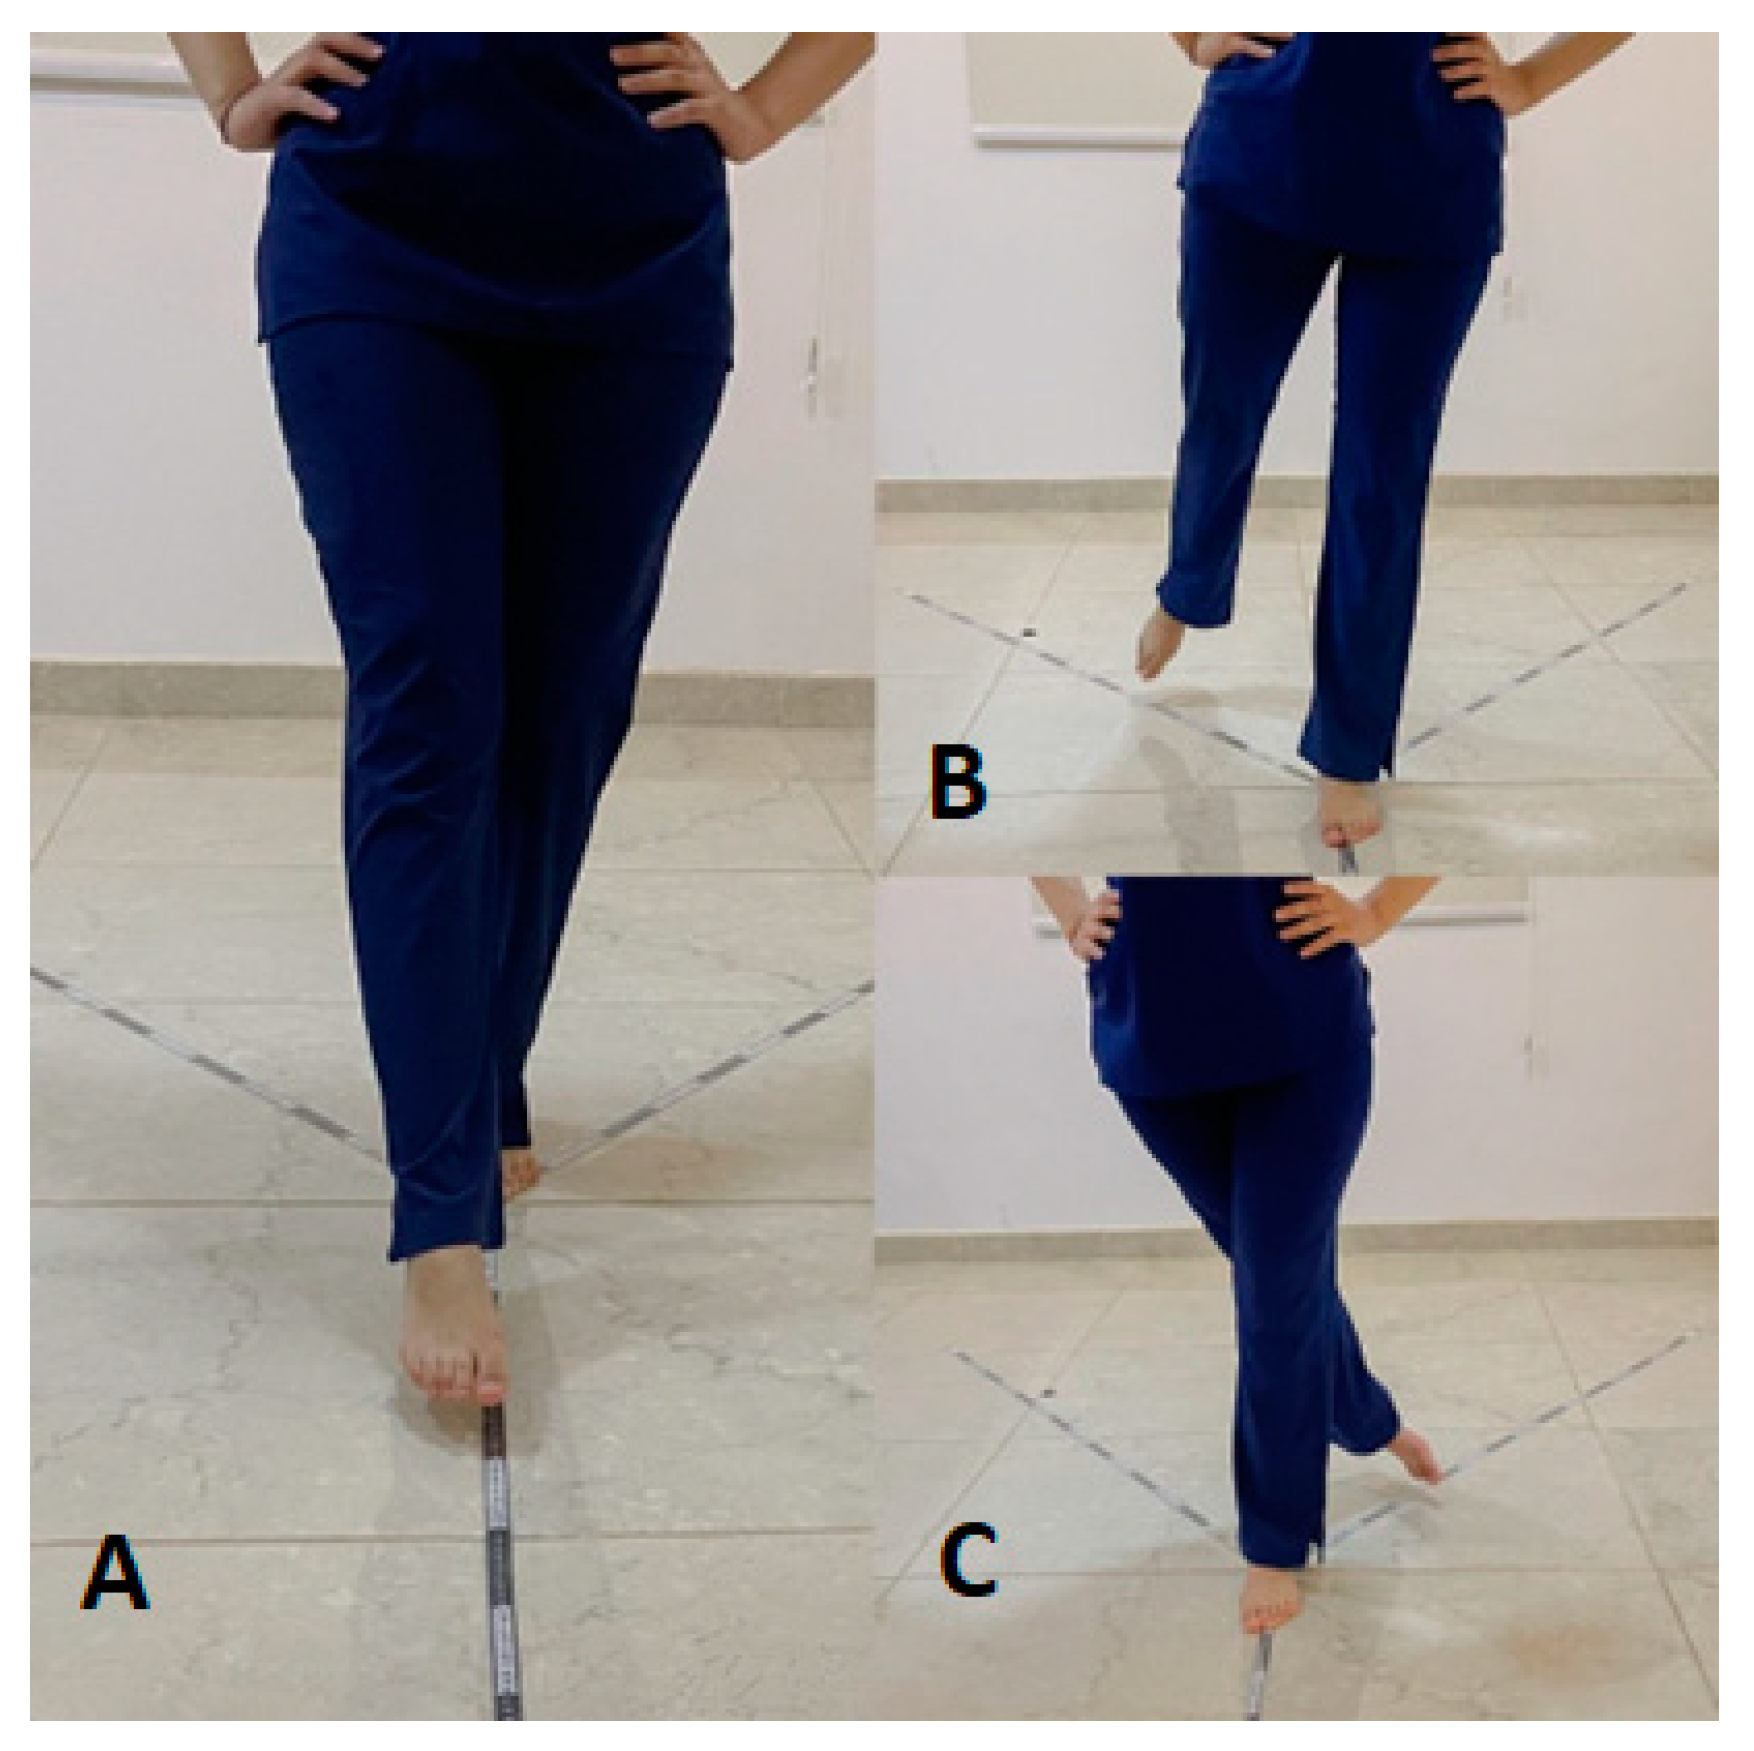
For balance testing, three measuring tapes were glued onto the lab ground. The prime tape was oriented anteriorly to the apex, while the others were aligned at 135° in posteromedial and posterolateral directions (
Figure 2). This created three directions: ANT, PM, and PL, with a central common point. The participant was instructed to take off her shoes and socks to eliminate the shoe–surface interface and to limit any potential effect on balance. Clear instruction on how to stand (i.e., align the second toe of the one leg at the convergence of the three tapes when performing anterior reach direction and the heel of the planted limb when performing the other two directions and keep the hands over the hips during reach for all directions) and how to reach the maximal distance for each direction. During the test, participants were asked to move their legs in the tested direction as far as they could without touching the tape or losing their balance, then return to resting. In addition, a short video showing the optimal performance of the balance test was delivered to the participants. Afterward, the participant was allowed 6 familiarization trials in each direction with corrective feedback. After the practice trials, the participant was given 2 min to recover before recording three successful attempts in each direction. The participant returned to the starting point prior to starting a new testing trial. The participant was requested to repeat one of the testing trials if her hands were removed from her hip, did not come back to the starting point after each trial, landed with moving foot on the floor, or elevated or shifted the stance foot. Data analysis was carried out based on the maximum reach distance in each direction. The order of testing directions and the tested limb was randomized.
After finishing the balance test, the participants were asked to perform strength testing for hip extensor, flexor, abductor, and knee extensors. The strength test was carried out using a hand-held dynamometer (MicroFet F1, Hoggan Industry, Salt Lake City, UT, USA). The participant assumed the testing positions described in the dynamometer manual for each tested muscle [
14]. The participant was instructed to gradually develop her maximum voluntary isometric contraction against the examiner’s manual resistance. The developed contraction was held for 5 s and then recorded. The same process was repeated for 3 repetitions with a 30-s rest period between each. In the subsequent data analysis, the maximum of the three attempts was used. The order of testing was randomized and always performed after the balance test to avoid the influence of fatigue on the participant’s performance.
2.5. Data Analysis
The hip flexion angle was calculated using a trigonometric equation. This equation stated that HFA = Sin − 1(D1/D2), in which D1 is the distance from the greater trochanter to the fibular head and D2 is the perpendicular distance from the fibular head to the testing table [
24]. For measuring the flexibility of the hamstring, the mean of the three trials was estimated and the score was used during the statistical analysis. To normalize the score obtained in mSEBT, the score of the successful trials for each direction was firstly averaged (in cm), then divided by the length of the tested leg and multiplied by 100 [
27,
28]. This normalization method takes the differences in limb length into account and permits the inter and intra-subject comparisons [
29]. Scores obtained from the three directions were added up, divided by 3 times the leg length, and then multiplied by 100 to create the composite score [
27]. For normalizing the score of the strength test, the value of the maximal contraction of the tested muscle was multiplied by the femur length and then divided by the participant’s weight [
30].
The mSEBT distance, muscle strength, and flexibility scores from both lower extremities were investigated among female participants. In addition to calculating descriptive statistics for all parameters, Kolmogorov–Smirnov tests were carried out to determine the distribution of the data. Pearson’s correlation coefficients were computed to determine the correlations between mSEBT and the muscles’ strength and flexibility. To evaluate the degree of correlation between variables, we applied the following guideline for interpreting correlation coefficients: correlation coefficients between 0 and 0.19 were regarded as very weak, those between 0.2 and 0.39 as weak, values from 0.40 to 0.59 were considered moderate, correlations between 0.6 and 0.79 were classified as strong, and coefficients from 0.8 to 1 indicated a very strong and highly pronounced correlation between the variables [
31]. The statistical significance threshold was established at
p < 0.05, and the statistical analysis was conducted using Statistical Package for the Social Sciences (SPSS) software, version 26.0, designed for Windows by SPSS Inc. in Chicago, IL, USA.
3. Results
Table 1 displays anthropometric data related to the participants’ physical characteristics. The Kolmogorov–Smirnov tests revealed that all variables exhibited normal distribution (
p > 0.05 for all).
Table 2 presents a more comprehensive presentation of the Pearson correlation coefficients (r) between lower limb strength, flexibility, and mSEBT reach distances in various directions. A positive and statistically significant correlation (r = 0.270, 0.256, 0.283) was observed between hip flexor strength and reach distance in the ANT, PM direction and composite directions, respectively, suggesting that individuals with greater hip flexor strength tend to achieve longer reach distances in these directions. Conversely, hip extensor, hip abductor, and knee extensor strengths displayed weak and non-significant correlations with reach distances, indicating that these strength parameters may have limited influence on reach performance.
Regarding flexibility for the Thomas test, negative and statistically significant correlations (r = −0.254) were observed between flexibility as measured by the Thomas test and reach distances in the ANT direction. This suggests that individuals with lower flexibility, particularly in the hip flexors, may achieve shorter reach distances in the ANT direction. However, in the PM and PL directions, the correlations were weak and non-significant (r = −0.124 and r = −0.018, respectively). The correlations between flexibility as measured by the sit-and-reach test and reach distances were weak and non-significant in all tested directions, with r-values close to zero. This indicates that flexibility measured using the sit-and-reach test does not strongly affect reach distances.
4. Discussion
To date, no full datasets have been conducted on the correlation between muscular strength, flexibility, and the reached distance measured in all directions of the mSEBT in young healthy women. Accordingly, this is the first investigation to report on this possible connection. In the present study, peak strength of hip flexors and knee extensors showed a significant positive correlation with reach distance in the ANT direction. These findings are partially consistent with the findings of Nelson et al. [
32] who reported a positive correlation between the ANT reach distance and hip flexion range of motion and hip extensor moment. Likewise, the results of our investigation are partially consistent with the outcomes of Branch [
33], who reported a significant positive correlation between hip flexion and extension strength and ANT direction reach distance. This could be greatly attributed to the participant’s posture while performing the task, as his trunk tends to lean backward in order to maintain his balance. In response to the effect gravity action on the upper body, there is a large hip-extension moment, which necessitates generation of internal flexion moment. A paucity of research endeavors has examined the kinematic prognosticators influencing mSEBT proficiency, with each investigation yielding heterogeneous outcomes. The discrepancies in the association between mSEBT scores and muscle strength could be explained by how the test was conducted such as the allowance of heel lift during reaching [
32]. Performing the mSEBT under such limitations could lead to variations in posture control mechanisms, as it heavily depends on a feedforward control strategy until toe contact happens [
29]. This strategy necessitates more activity of the hip flexor muscles in order to maintain balance and accomplish the anterior reach task by trunk movement. However, while trunk kinematics is not within the scope of the present study, it was reported that contralateral trunk rotation was the most salient kinematic interpreter of ANT reach distances [
27,
32].
The current study’s findings showed a positive correlation between hip and knee strength and the reach component in the PM direction, with a significant positive correlation in hip flexor muscle strength. Such a finding could occur as a result of the feedforward control strategy, as previously mentioned. Additionally, the PM and PL reaches were carried out in the diagonal planes, as opposed to the sagittal plane used for the ANT reach, which may have necessitated compensatory trunk motions to achieve balance within the combined plane. This explanation is supported by Kang et al. [
27], who articulated that the conjunction of hip flexion with ipsilateral trunk bending and hip flexion with contralateral trunk bending amplified the prognostic utility of reach performance in the PM and PL directions, respectively. In the current investigation, it was observed that there was no statistically significant correlation between hip and knee strength parameters, aside from hip abduction and extension strength, and the PM and PL reach components. This outcome stands in contrast to previous studies, such as those conducted in [
14,
34,
35], which reported that a notable correlation between hip abduction and extension strength and the achieved PM and PL reach distances. This disparity could potentially be attributed to variations in the demographic attributes of the study participants. The individuals included in prior research were either individuals afflicted with chronic ankle instability, or were middle-aged to older females (ranging from 45 to 80 years), whereas the present study focused on the evaluation of a cohort of healthy young female subjects. Therefore, during dynamic postural control tasks, young females may rely heavily on hip flexors and different trunk kinematics to maintain their balance.
The current study highlighted the positive correlation between hip flexor strength and reach distances in the ANT and PM directions. This underscores the potential benefits of targeted strength training programs for individuals aiming to improve their balance and reach capabilities in these specific directions. Clinically, this could translate into targeted strength training programs for individuals who exhibit deficits in hip flexor strength and who need to perform tasks that require anterior and posteromedial reach movements, such as athletes and individuals involved in physical therapy. On the other hand, the absence of significant correlations between hip extensor, hip abductor, and knee extensor strength with reach distances in the mSEBT indicates that these particular strength parameters may have a limited impact on balance and reach performance. Clinicians can take this information into account when designing rehabilitation programs or interventions for individuals focusing on balance and stability, as they may need to address factors beyond strength to improve performance in dynamic balance tests.
Interestingly, the current study found that the angle of hip flexion measured during the Thomas test showed a negative correlation with all reach directions of the mSEBT, with a significant correlation found in ANT and composite directions. The absence of analogous investigations within the existing body of literature precludes the possibility of conducting a direct comparison with the existing outcomes. However, previous studies stated that active hip flexion range was significantly linked to PM, PL and composite reach distances, while the hip extension range showed no correlation [
16,
32]. When performing the ANT reach task, the flexibility of hip flexor muscles plays an important role. The data conveyed within this study provide support for the argument that factors like flexibility, range of motion, and muscle strength should be considered due to their influence on reach distance [
10].
On the other hand, the present study showed a very weak correlation between sit-and-reach values and all reach directions of the mSEBT. This may be due to the testing position of sit-and-reach, which includes hip flexion with knee extension (passive insufficiency). Although, the lower limb position in PM or PL directions includes hip and knee extension and hip flexion and knee extension in ANT directions, hence none of the previous directions placed the hamstring in fully stretched position. Previous studies confirmed this explanation by stating that knee flexion range was not considered as a predictor of ANT, PL, or PM reach distances [
27,
32]; however, it is correlated with ANT reach distance. In light of both the preceding research outcomes [
27,
32] and our own findings, it is advisable for clinicians to conduct supplementary clinical evaluations pertaining to the flexibility and strength of the hip flexors. This is essential in order to ascertain whether suboptimal performance on the mSEBT, particularly with regard to deficits in the ANT reach direction, is associated with challenges in achieving increased hip extension, which may be indicative of muscle tightness, or with limitations in providing adequate trunk support.
Our study further emphasized the impact of flexibility, as assessed through the Thomas test, on reach distances. The observed negative correlation between hip flexor flexibility and ANT reach distance indicates that reduced flexibility in the hip flexors may pose obstacles to achieving optimal reach distances in this specific direction. This finding holds particular relevance for clinicians and trainers who are involved with individuals necessitating precise control of anterior reach movements, underscoring the importance of striking a balance between hip flexor flexibility and strength. It suggests the need for interventions that optimize both aspects for particular reach movements. Regarding the sit-and-reach test, which exhibited only weak correlations with reach distances in the mSEBT, its limited role in predicting reach performance suggests that alternative measures, such as the Thomas test or specific strength training, maybe more relevant for clinical assessments of balance and reach capabilities.
Some limitations necessitate acknowledgment in the current study. Firstly, the study exclusively encompassed healthy individuals, thus warranting future investigations to explore whether the notable correlations between strength, flexibility, and mSEBT performance would hold true among individuals who have incurred injuries leading to joint stiffness. Secondly, the prospective impacts of trunk movements on hip muscle strength necessitate examination in subsequent studies, as the trunk and hip exhibit interconnected kinematic relationships. Lastly, it is essential to highlight that the study’s sample consisted exclusively of females. Consequently, future research endeavors should involve male participants to facilitate a comprehensive exploration of potential distinctions in trunk and hip mechanics during mSEBT performance.


 ,
, 
