Article

Pile Arrangement for Minimizing Plastic Deformation in Pile-Supported Immersed Tunnel under Seismic Loads

1
School of Civil, Architecture and Environment, Hubei University of Technology, Wuhan 430068, China
2
Key Laboratory of Concrete and Prestressed Concrete Structures of Ministry of Education, School of Civil Engineering, Southeast University, Nanjing 210096, China
*
Author to whom correspondence should be addressed.
Appl. Sci. 2023, 13(22), 12331; https://doi.org/10.3390/app132212331
Submission received: 16 October 2023 / Revised: 7 November 2023 / Accepted: 10 November 2023 / Published: 15 November 2023

Abstract

:
The plastic region of piles under seismic loads is a crucial concern in seafloor improvement design. This paper establishes a physical model of the sand compaction pile-immersed tunnel–water pressure system. This research studies pile arrangements that minimize the sand compaction pile plastic region under seismic loads. The experiments were validated through numerical simulations. The results show that “X-shaped” and rectangular pile groups increase the Energy Residual Index (ERI) due to differences in pile spacing and the instability of the quadrilateral prism damping units formed by piles and soil. In this scenario, piles are limited to heavy and mild plastic regions, with boundary depths at L = 2.25 D and L = 2.08 D (L represents the pile length, and D is the pile diameter). Furthermore, increased water pressure amplifies the structural resonance injury, increasing ERI. In conjunction with the soil, hexagonal pile groups create triangular prism damping units that counteract seismic wavefronts. The total kinetic energy and strain energy of the piled foundation are lower than those of the “X-shaped” and rectangular pile groups. The boundaries between the heavy plastic region, the moderate plastic region, and the mild plastic region are located at depths of L = 4 D and L = 8 D, respectively. This study also reveals that a top-heavy mass distribution in the structure leads to maximum deformation in the heavy plastic region. Pile–soil damping units primarily operate within the moderate plastic region.

1. Introduction

During an earthquake, the characteristics of the seafloor exhibit a significant reduction in strength and stiffness, accompanied by a substantial increase in pore water pressure. The reduced mutual support among solid soil particles typically results in damage to underwater foundations, such as collapse and significant deformation. This often comes with significant economic losses and casualties. For instance, in the 2011 Great East Japan Earthquake, the foundations of thousands of structures were damaged [1]. In earthquakes such as the 1983 Central Japan Sea Earthquake [2], the 1964 Niigata Earthquake [3], and the 1995 Southern Hyogo Prefecture Earthquake [4], among others, many foundations experienced significant deformation and collapse. Over the past few decades, extensive research has been conducted on seismic-related damage to soil and structures [5,6,7,8].
Piles are widely used to mitigate the impact of dynamic loads on structures [9,10,11,12,13]. Since shear seismic waves carry the most seismic energy, most existing studies on pile–soil interaction assume that it is induced by vertically propagating S-waves [14,15,16,17]. Under seismic loads, the deformation of most structures is caused by lateral soil movement beneath the structure [18]. Therefore, lateral dynamic load tests on piles have been extensively researched. Various methods, including empirical and analytical approaches [19,20,21], numerical analyses [22,23,24], and physical experiments [25,26], have been widely employed in the dynamic load analysis of piles. These methods effectively analyze pile–soil interface interactions, non-uniform settlement of piles, the influence of soil liquefaction, and the impact of changes in saturation pore water pressure on pile strength. Most of the foundation above strengthening studies involve lateral cyclic loads or seismic tests simulated on shaking tables, effectively addressing pile–soil movement issues under seismic conditions [27]. However, the mechanical behavior of piles essentially represents a process of energy changes. Further research is needed to understand the relationship between energy dissipation and plastic deformation during the seismic response of piles.
Underwater piled foundations are often reinforced using sand compaction piles (SCP). The construction of sand compaction piles involves the insertion of sand into the ground through casings and compaction by means of vibration and impact techniques [28,29,30,31]. SCP, combined with the surrounding soil, forms a composite stratum, creating drainage pathways that reduce pore water pressure, thereby enhancing densification effects [32,33]. In seismic safety assessments, most research on sand compaction piles (SCP) primarily focuses on significant lateral displacements caused by earthquakes, which can lead to structural damage. Alternatively, researchers aim to enhance seismic performance by considering factors such as the replacement rate of the piled foundation, slenderness ratio, and arrangement methods [34,35,36]. In order to explore the seismic response of piled foundation structures, a significant number of seismic model tests have been conducted, including shake table tests [37,38] and centrifuge tests [39,40]. Furthermore, the finite element analysis method is widely employed for the investigation of the seismic behavior of the pile–structure–soil [41,42,43]. Most such studies primarily emphasize the bending moment and acceleration responses of piles. However, they often do not take into account the impact of pile group arrangements on seismic performance assessments. There is a lack of research examining the relationship between pile arrangement and the extent of pile plastic regions.
This paper investigates the mechanical behavior of the pile–soil interface in the sand compaction pile (SCP)-immersed tunnel-water pressure system (SIS system) using physical experiments. Numerical analysis is employed to validate the physical experiments. This study analyzes the energy absorption and dissipation processes of the piled foundation in response to seismic forces, examining the patterns of energy variation within the piled foundation. It establishes a relationship between the plastic region of SCP and the arrangement of the piles. These findings provide a reliable basis for designing pile arrangements to support immersed tunnel structures.

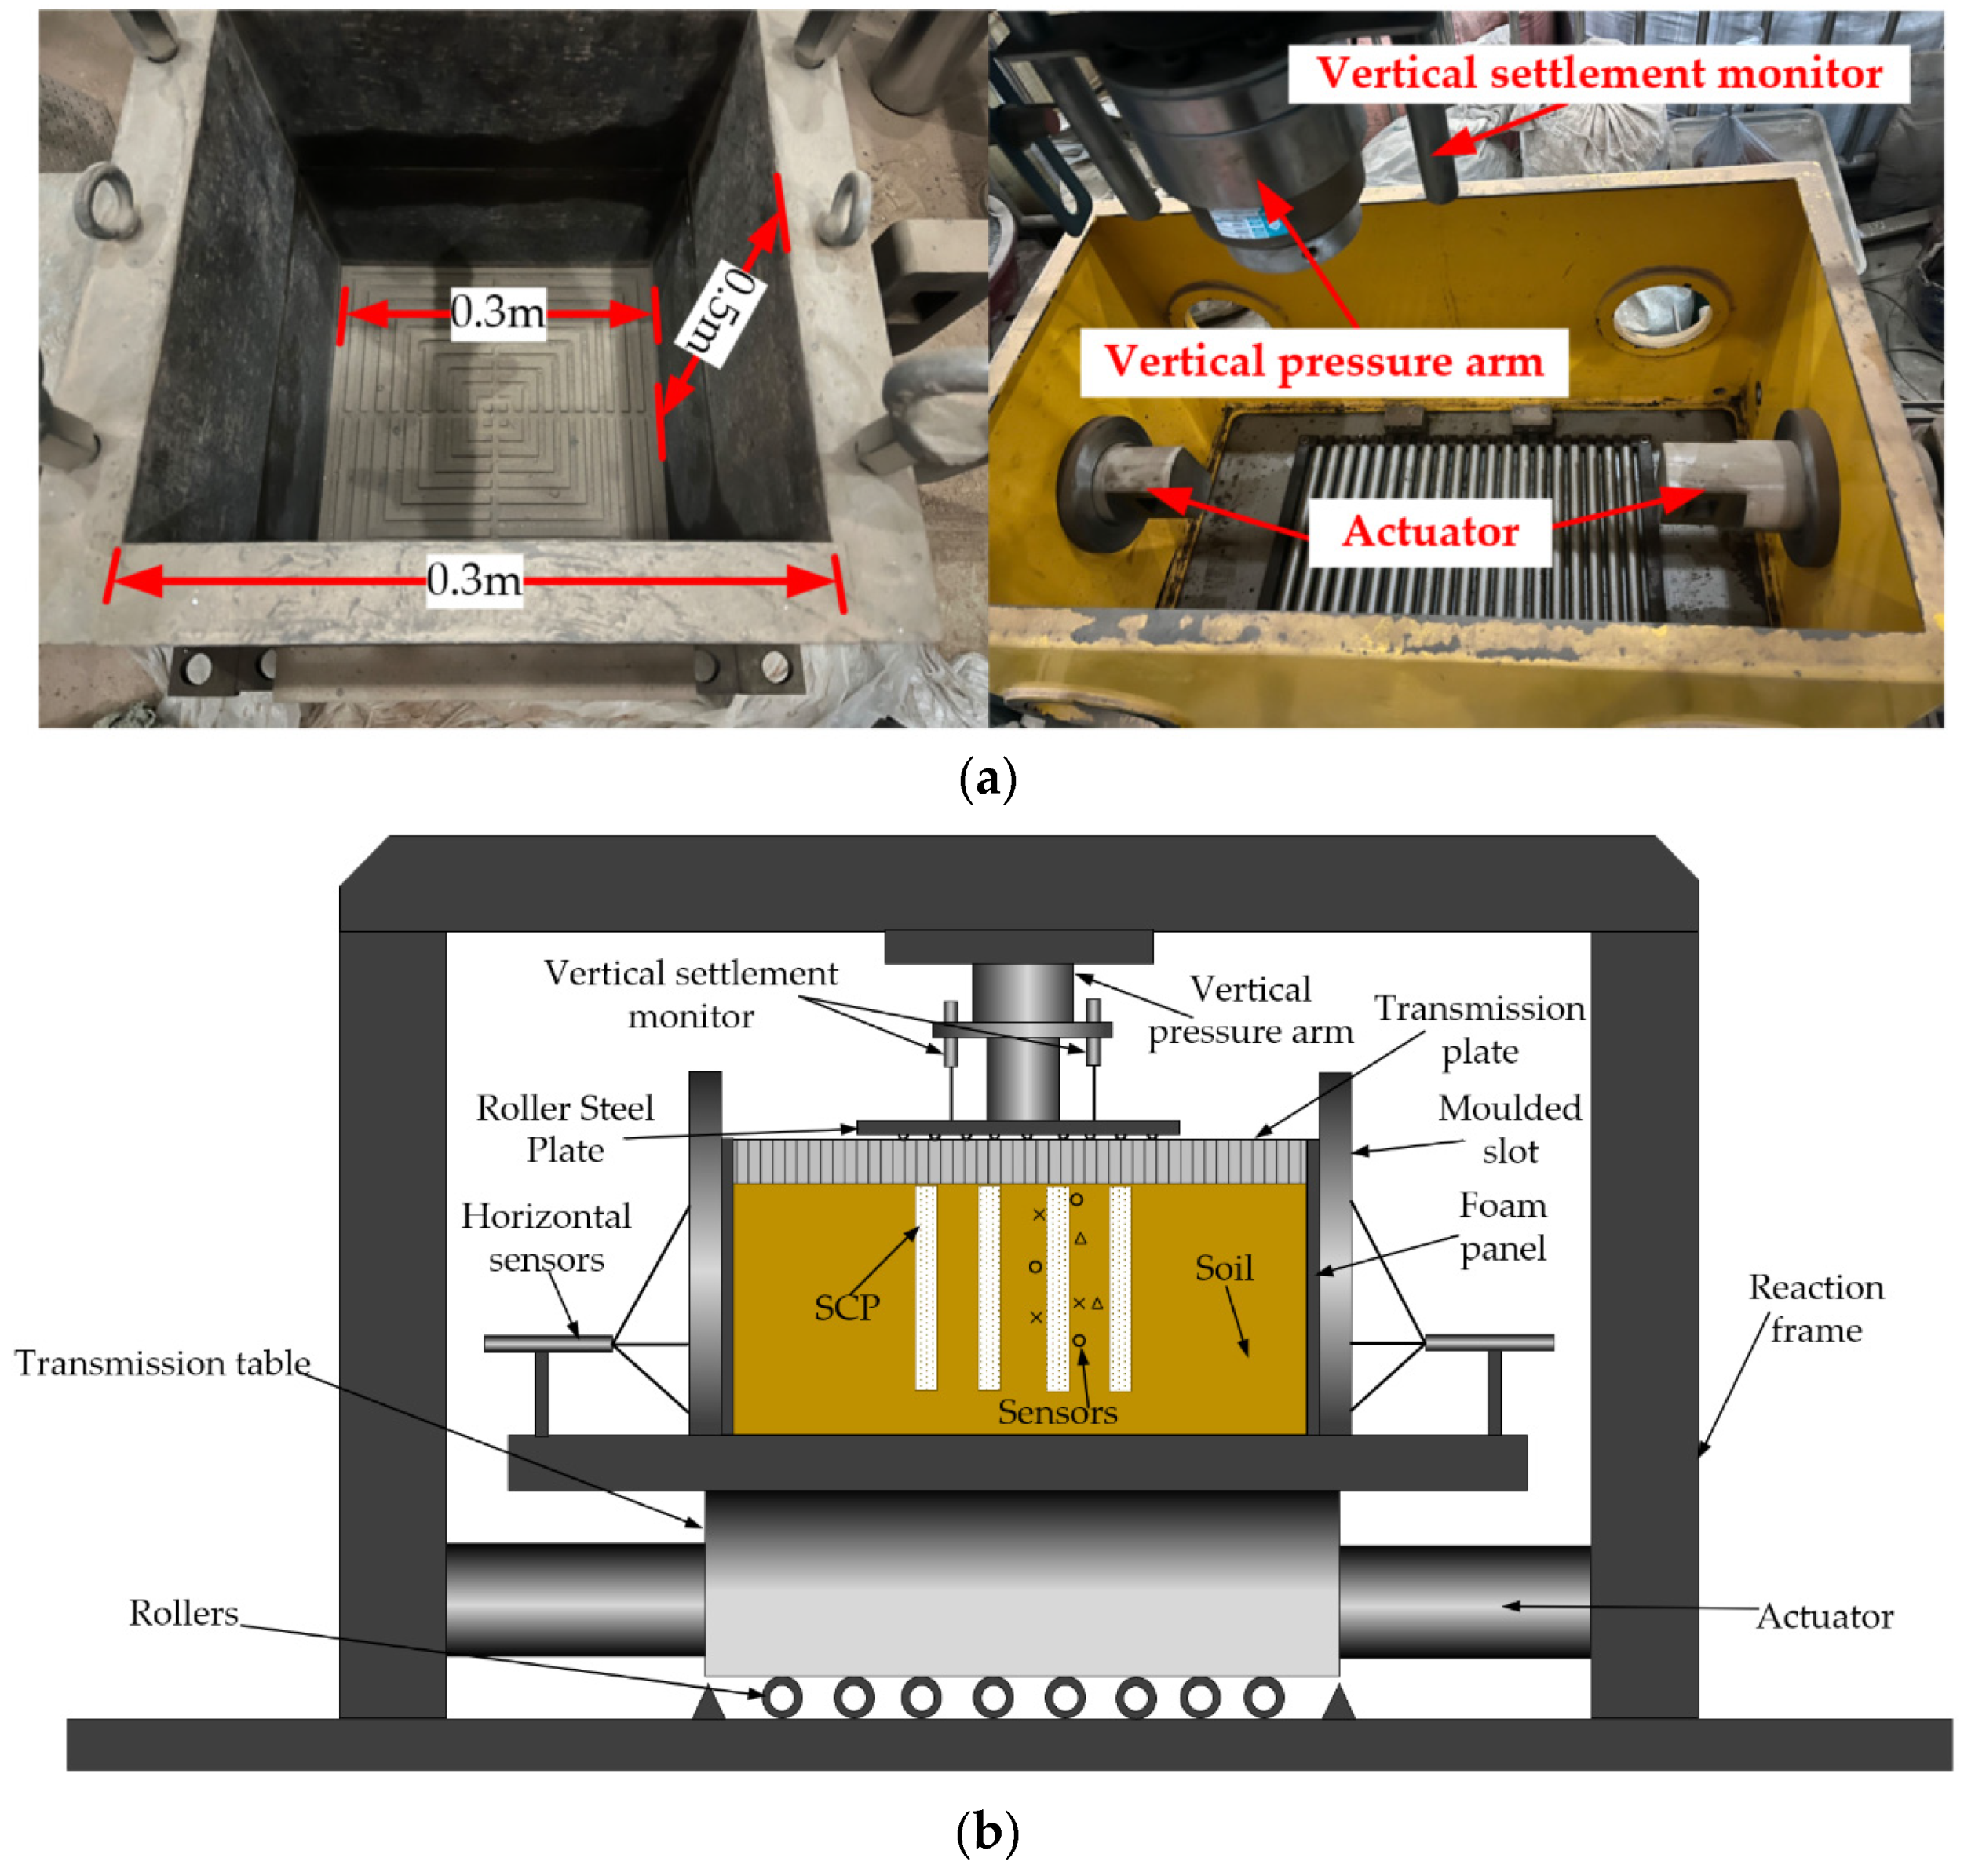
2. Physical Modelling

Objectives: assessing the effectiveness of different arrangements of SCP in improving seabed foundations through physical model experiments; investigating the relationship between pile arrangements and pile plastic regions; and analyzing the damping characteristics of pile foundations when water depth varies.

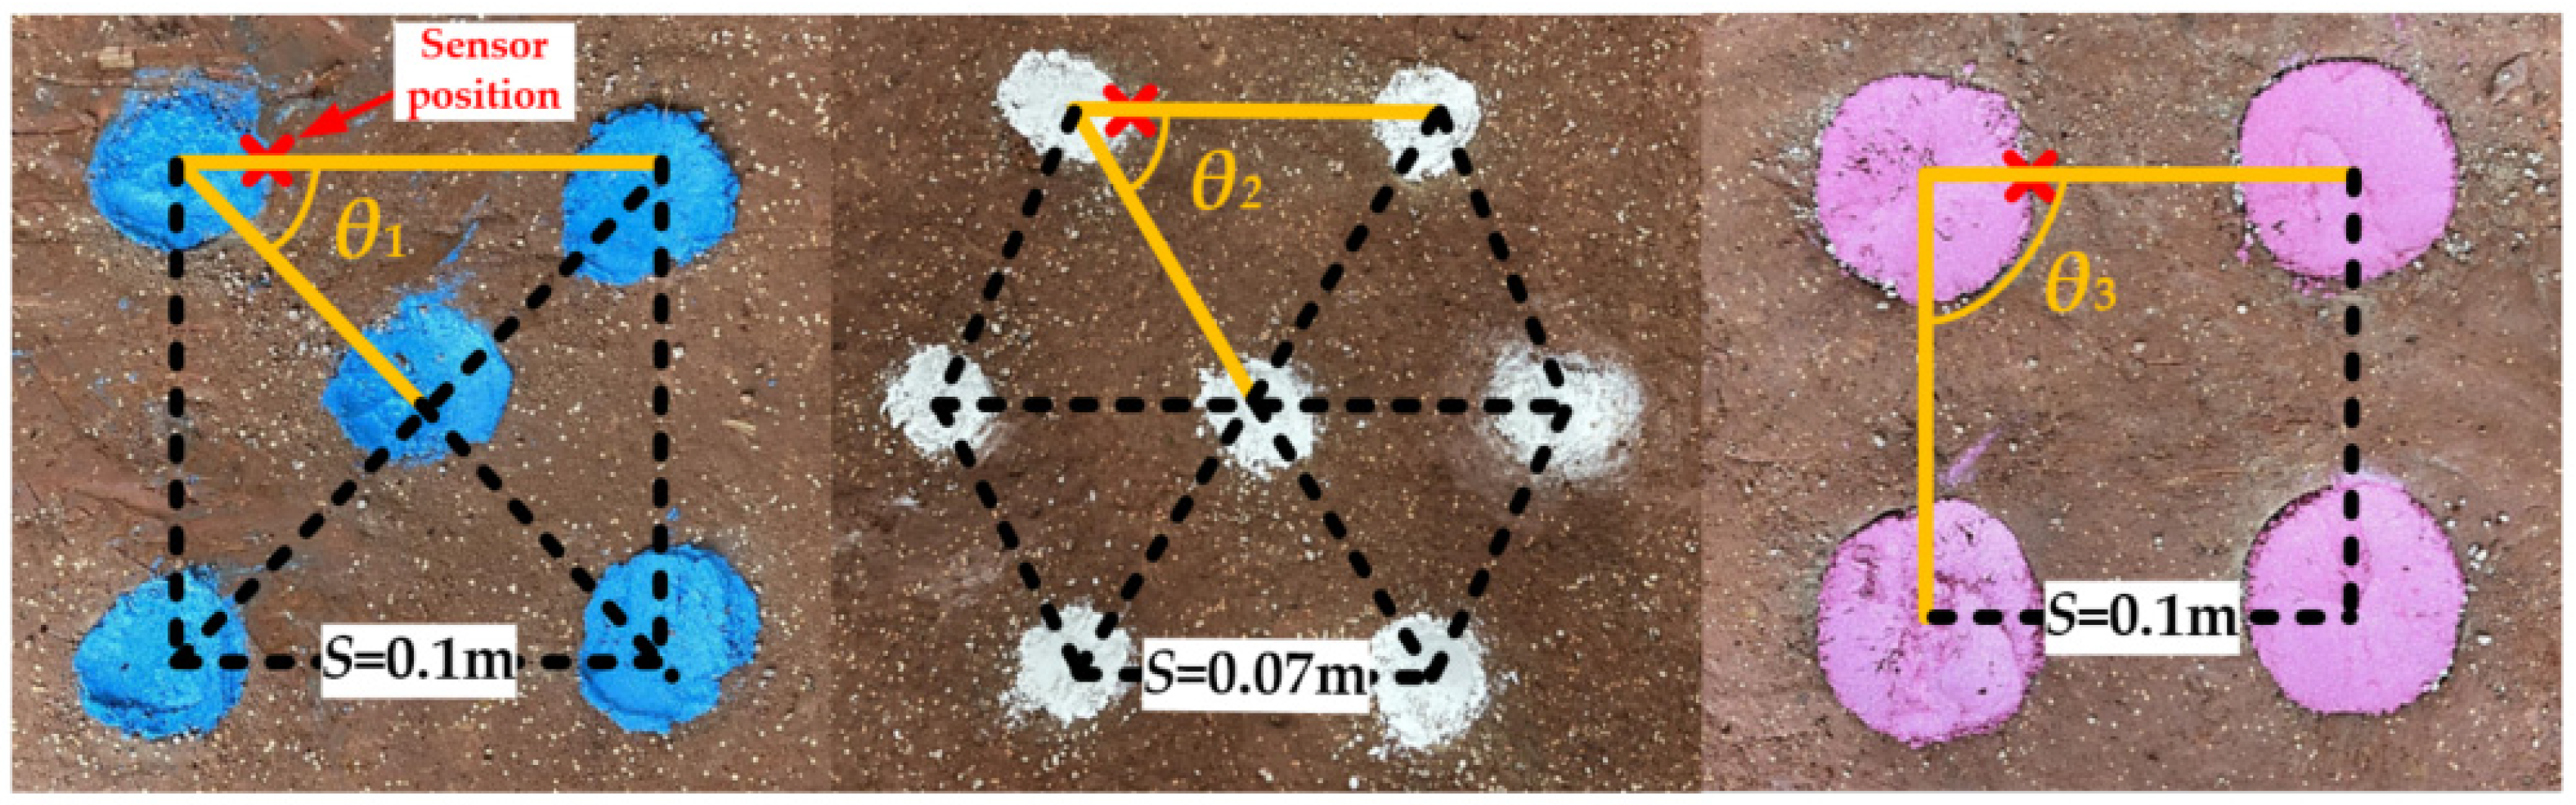
2.1. Design of Physical Model

This study investigates the arrangement angles (θ) for rectangular pile groups (displacement rate 50%, slenderness ratio 6.25), “X-shaped” pile groups (displacement rate 37%, slenderness ratio 9.37), and hexagonal pile groups (displacement rate 62%, slenderness ratio 15). It conducts nine sets of physical model experiments with varying water pressure (P) at different depths (H1 = 48.78 m, H2 = 32.12 m, H3 = 23 m). The model dimensions and experimental equipment are depicted in Figure 1a. Figure 2 illustrates the vertical SCP improvement zone, where the highest degree of soil densification occurs within a 2 D (with D being the pile diameter) range [44]. The arrangement of the three types of piles mentioned above is determined based on the replacement rate of the foundation [44].

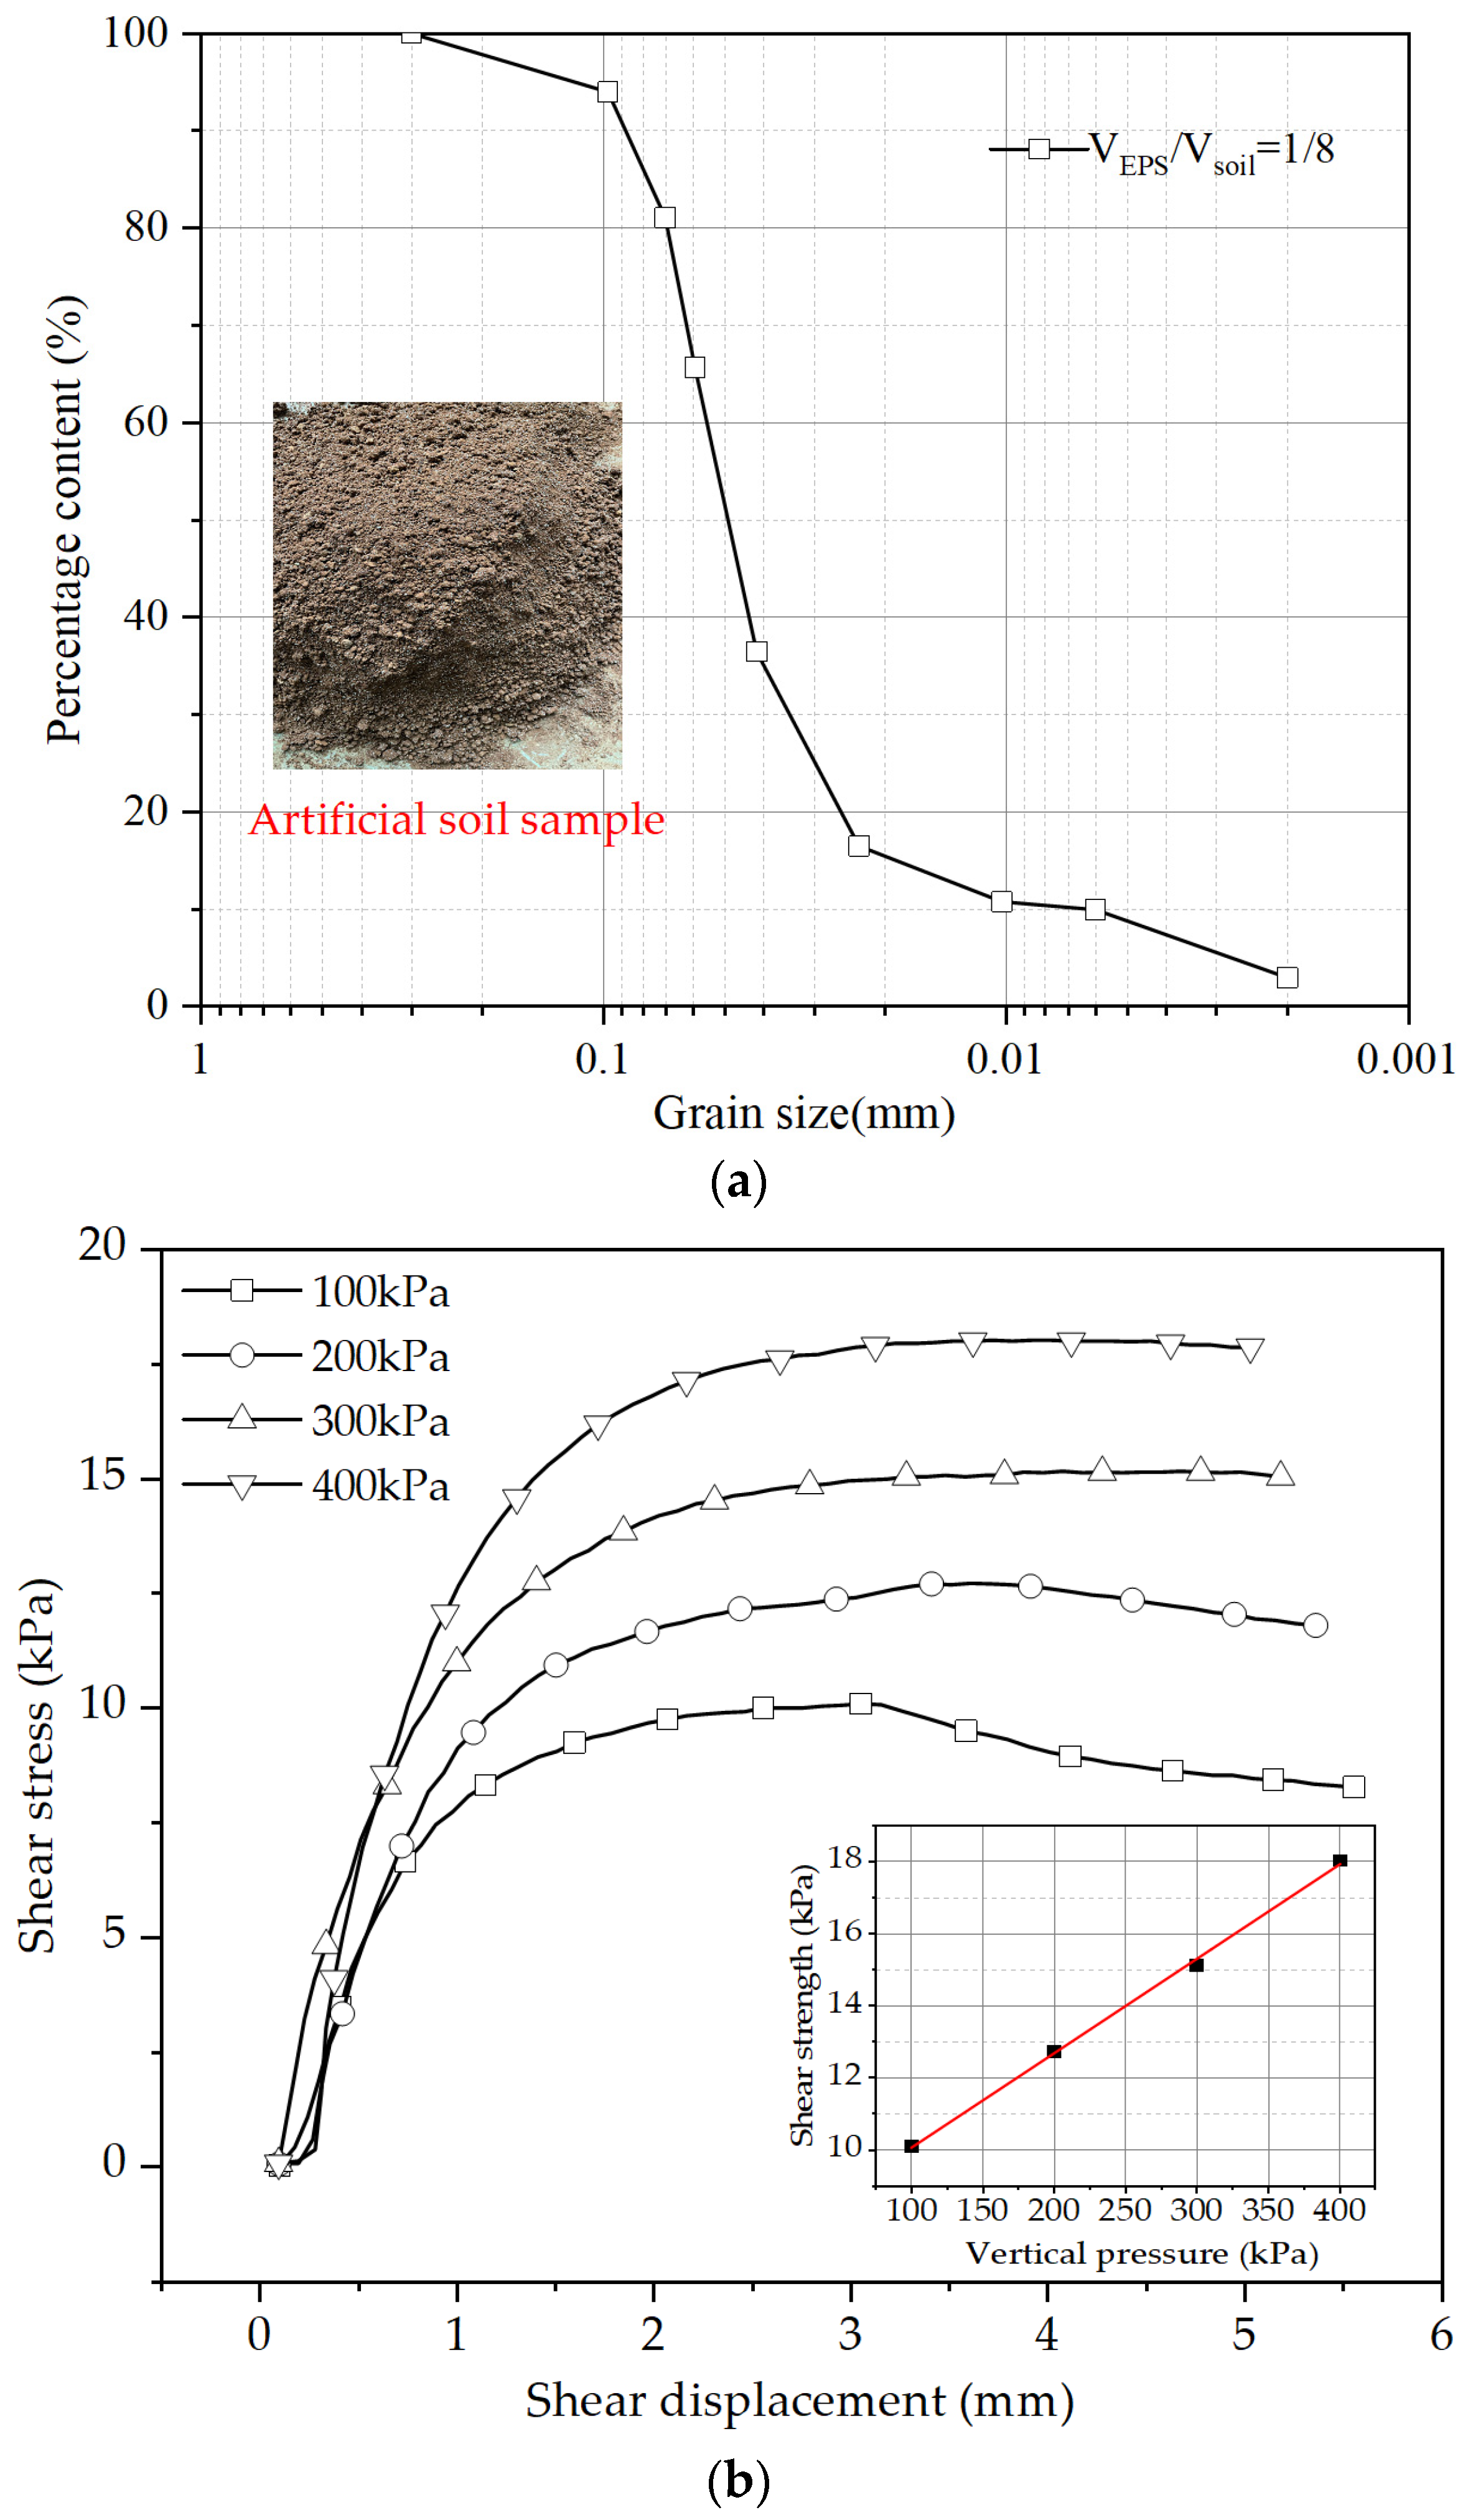
2.2. Research Material

The model trench has dimensions of a rigid container measuring 0.3 m × 0.3 m × 0.5 m. The composition of SCP is as follows: sand with particle sizes greater than 0.25 mm accounts for 23% of the total weight, sand with particle sizes between 0.18 mm and 0.25 mm constitutes 70% of the total weight, and sand with particle sizes smaller than 0.18 mm makes up 7% of the total weight. Sand compaction is performed in six layers using the sand compaction pile (SCP) method, with a compaction density (DL) of 90%. The selection of the foundation materials takes into account the pore water pressure and consolidation state in the long-term seabed environment. Polystyrene particles (EPS) are employed, mixed with clay at the optimal moisture content, to replicate the high compressibility and low permeability characteristics of marine clay [45]. The polystyrene particle (EPS) foam has a particle size of 0.3 mm, with specific characteristics as detailed in Table 1. The physical properties of the artificially deposited seabed soil in the experiment are presented in Figure 3.
At the pile–soil interface shown in Figure 1b, soil pressure box sensors, displacement sensors, and strain gauges are evenly distributed along the depth direction, as depicted in Figure 2. The stress and deformation within the plastic regions of the piles are measured under different water pressures and SCP arrangement angles. The seismic input for the model is selected from the PEER Ground Motion Database-NGA west2, and time-history analysis is performed using data from the Hexi Lin Earthquake Observatory in Greece. The earthquake has an intensity of 7.5, a characteristic period of 0.40 s, a damping ratio of 0.05, and a peak acceleration of 0.05 g, categorizing it as a major seismic event. This information is illustrated in Figure 4.

3. Analysis of Experimental Results

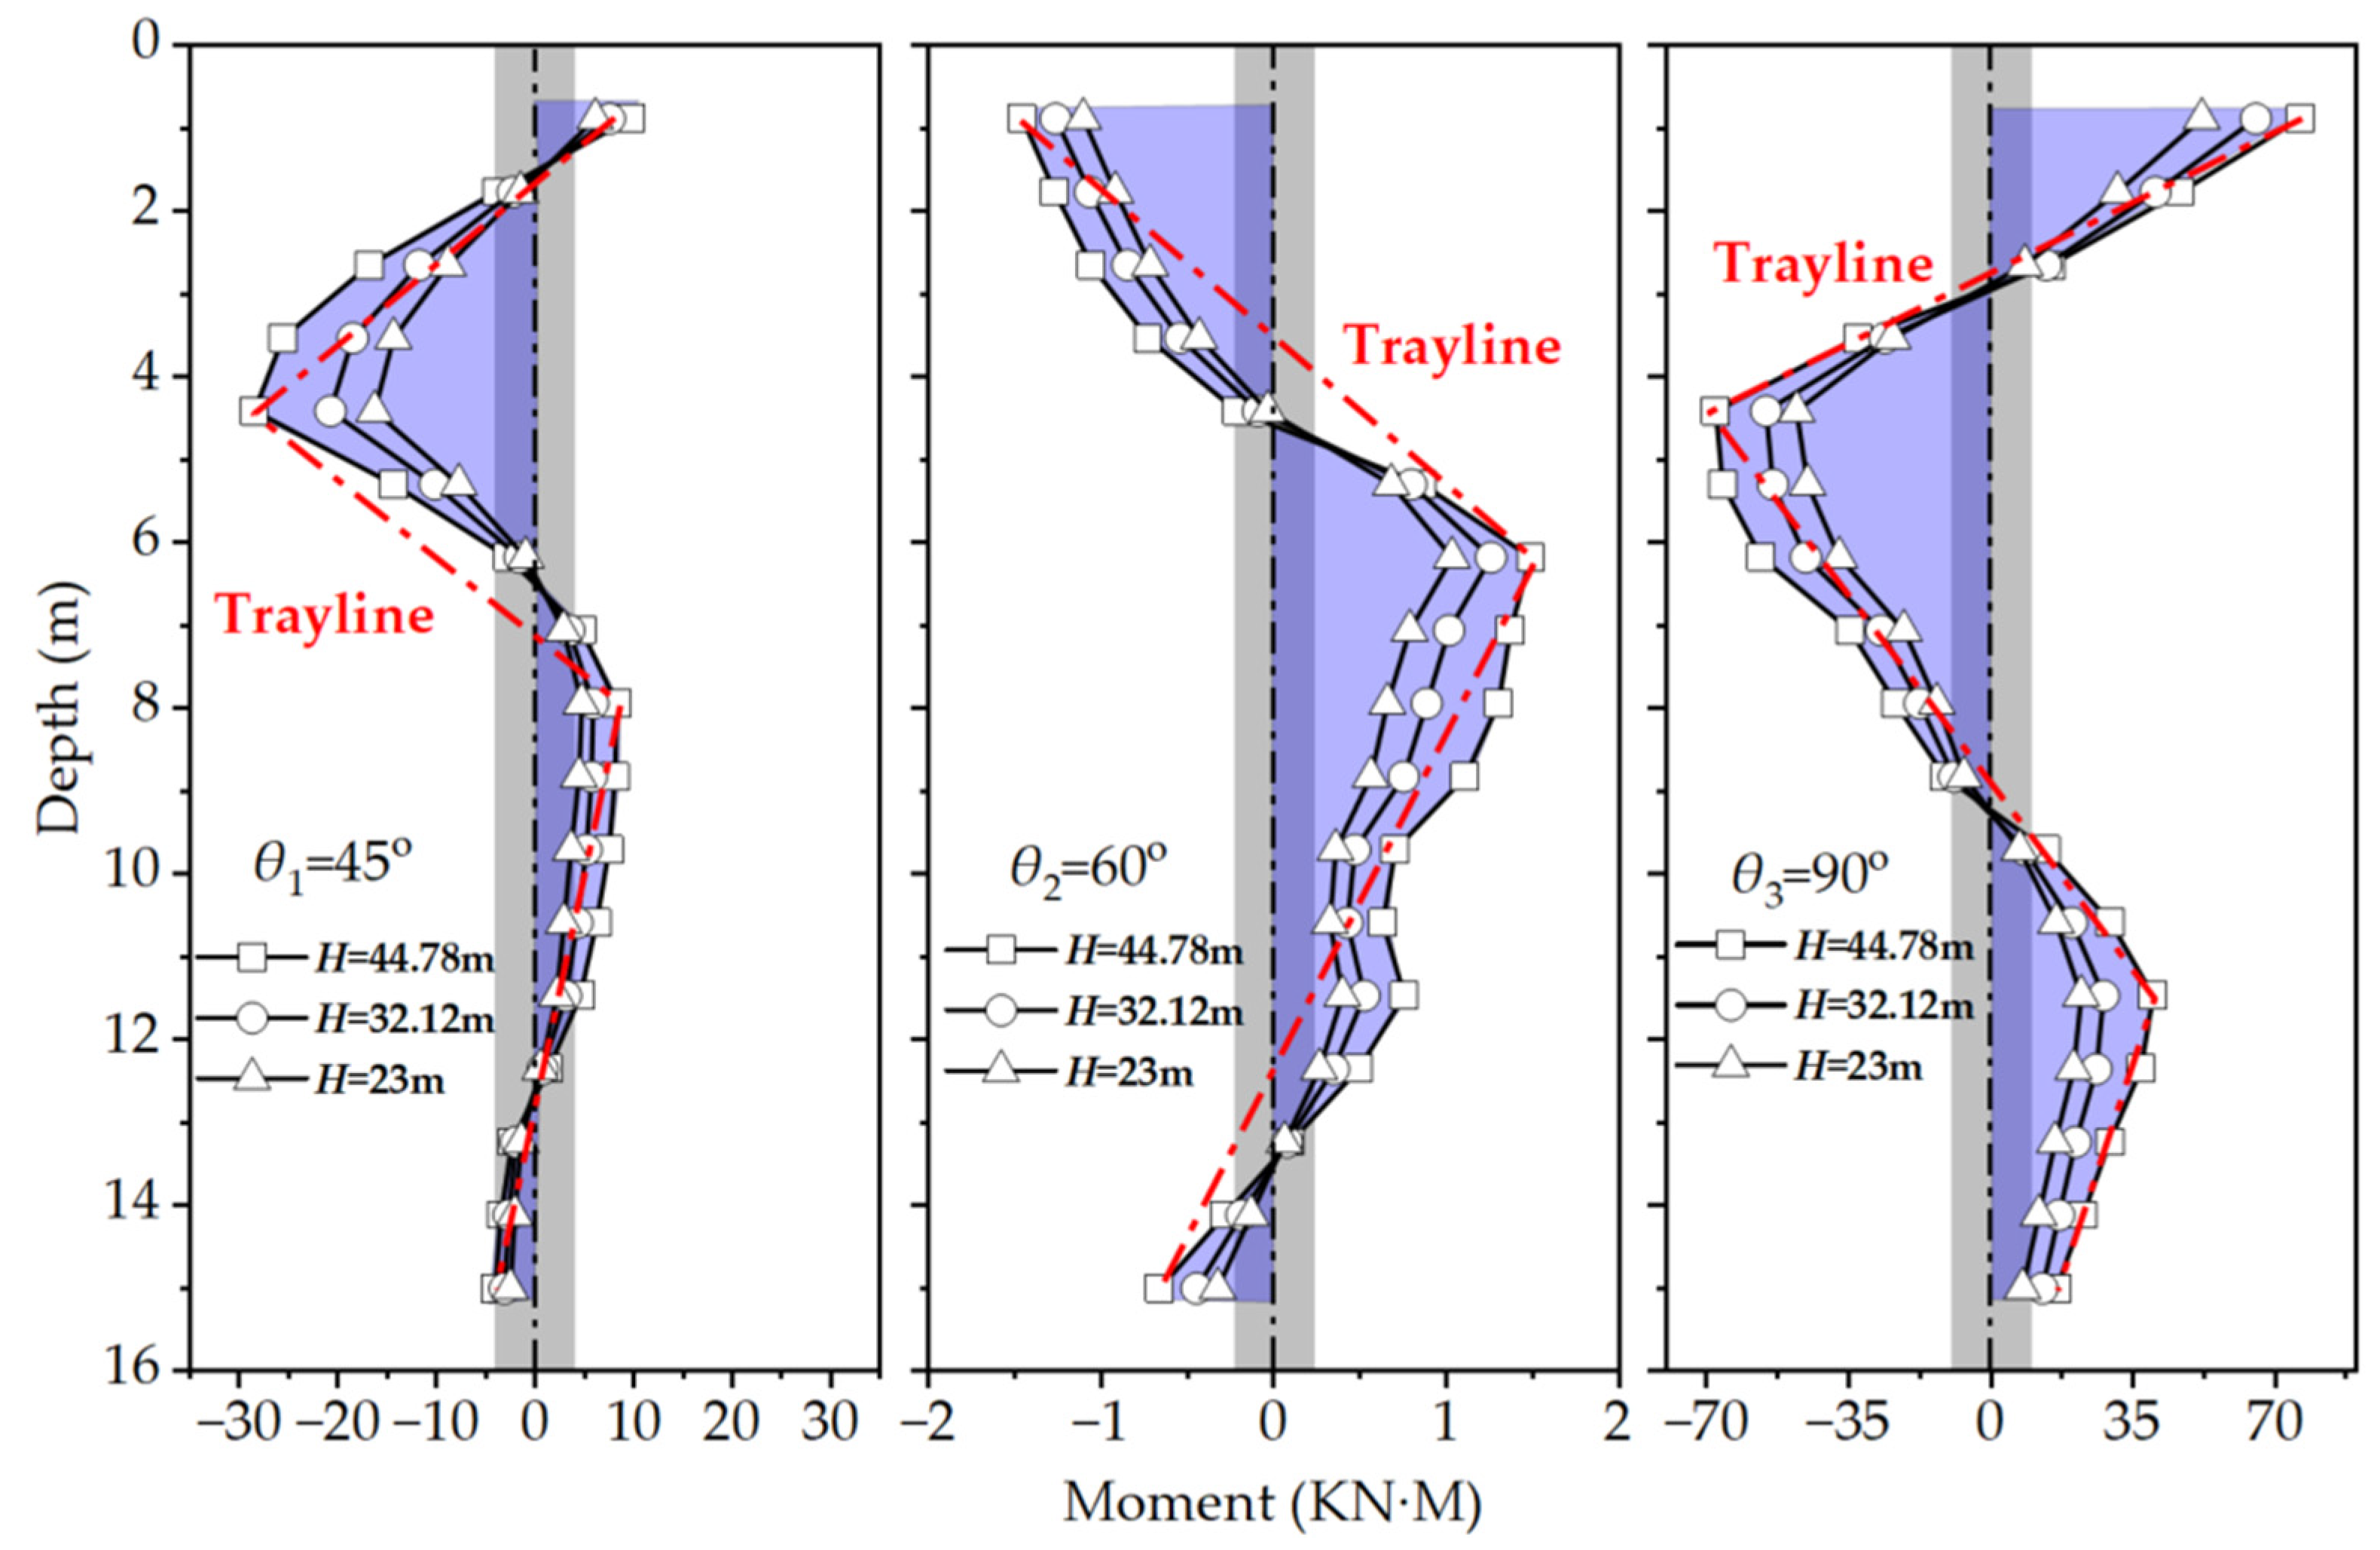
3.1. Bending Moment of the Piles

Figure 5 displays the distribution of the maximum bending moments in a single pile within the pile group. As θ increases from 45° to 90°, the depth of the maximum bending moment below the pile decreases from 6 D to 4.58 D. Simultaneously, zero bending moment points appear both in the upper and lower regions of the pile. The overall trend of the pile rotation is counterclockwise, with the right side of the pile top experiencing tension while the left side of the pile bottom is under tension. The higher bending moments in the upper portion of the pile compared with the lower portion are a result of greater horizontal displacement. This P-Δ effect is similar to the study conducted by Wen et al. [46]. The maximum bending moments in the upper part of the SCP occur at depths ranging from 1 D to 2.68 D for all three angles. Increasing the angle θ causes the migration of the maximum bending moment towards the pile head. This phenomenon is attributed to soil degradation around the intermediate piles. González et al. [47] also observed similar phenomena during their study on soil degradation at the pile–soil interface. It is worth noting that for the same θ value, an increase in water pressure enhances soil confinement and stiffness. However, the location of the maximum bending moment does not change with the increasing pile bending moment.

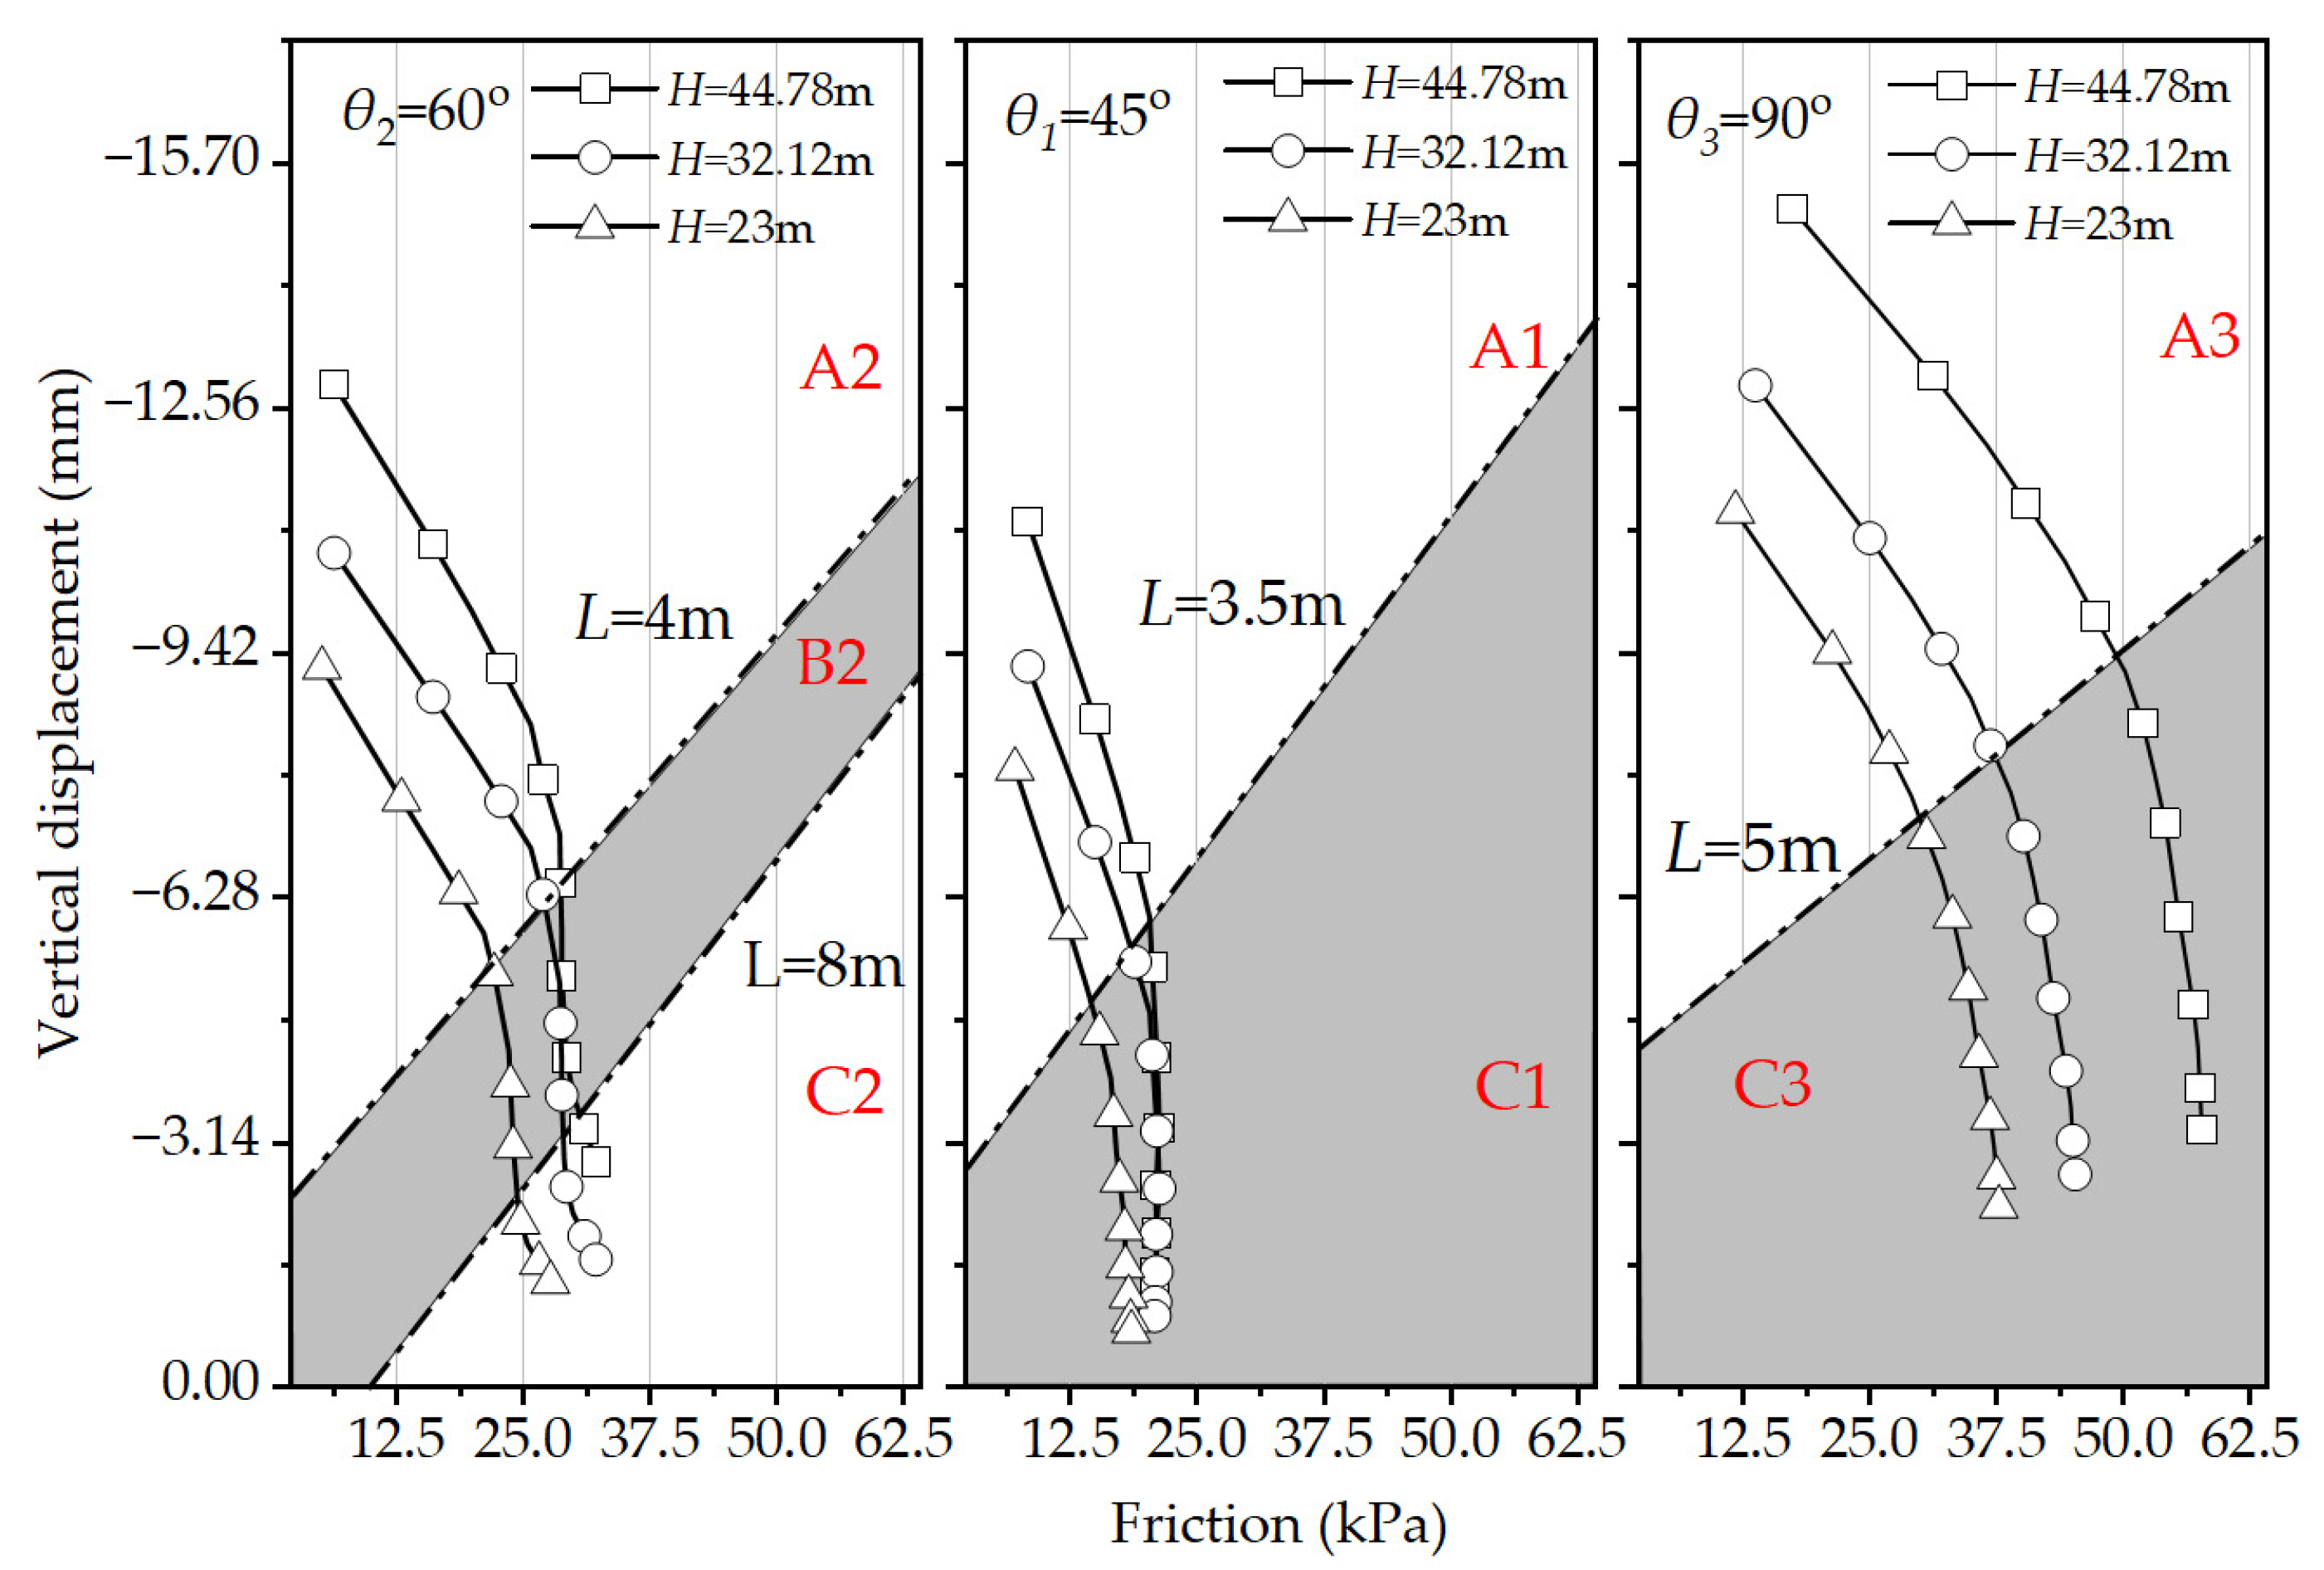
3.2. Friction and Displacement of the Pile–Soil Interface

The frictional-displacement (f-s) relationship at the pile–soil interface, where the response is maximum, is depicted in Figure 6. Due to the significant soil settlement exceeding that of the pile group unit, it results in the relative upward movement of the piles. With the increase in θ values and water pressure, this relative movement exhibits an exponential growth trend. The deformation zones in the soil are classified based on the slope of the frictional displacement curve (f-s). When θ1 = 45 degrees, a heavy plastic region (A2) and a mild plastic region (C2) are formed, with L = 3.5 m serving as the boundary. When θ2 = 60°, noticeable changes in the slope of the f-s curves occur at L = 4 m and L = 8 m (L represents the pile length). This leads to the formation of a heavy plastic region (A1), a moderate plastic region (B1), and a mild plastic region (C1). When θ3 = 90°, the plastic regions A3 and C3 are separated by L = 5 m.
After the earthquake, the maximum settlement zone of the soil around the pile is located in the heavy plastic region A. In this area, the bending moment on the pile is also at its highest. The vertical displacement decreases in a linear manner. When the frictional reaches a critical value, the vertical displacement decreases. This is due to the mobilization of the bearing capacity end of the pile and the frictional side of the pile to resist axial forces [46]. The soil around the pile is in a state of force equilibrium. In the lower part, within the mild plasticity region C, the frictional undergoes minimal variations. However, there is a sudden and steep reduction in settlement. In this region, which is closer to the seismic sources, the soil experiences a high degree of compaction. This results in an increase in effective stress. Additionally, the “X-shape” pile group exhibits a similar frictional to the hexagonal pile group. However, it does not display the intermediate plasticity region B. In the “X-shape” pile group, the boundary of the heaviest plasticity region with the most deformation is shallow, at 0.5 m. This indicates that the pile spacing differences in the “X-shape” pile group may result in an incomplete group pile effect [48]. Under the same seismic conditions, differences in pile spacing result in non-uniform soil compression. This phenomenon is closely related to the location of the peak moments on the pile sides.

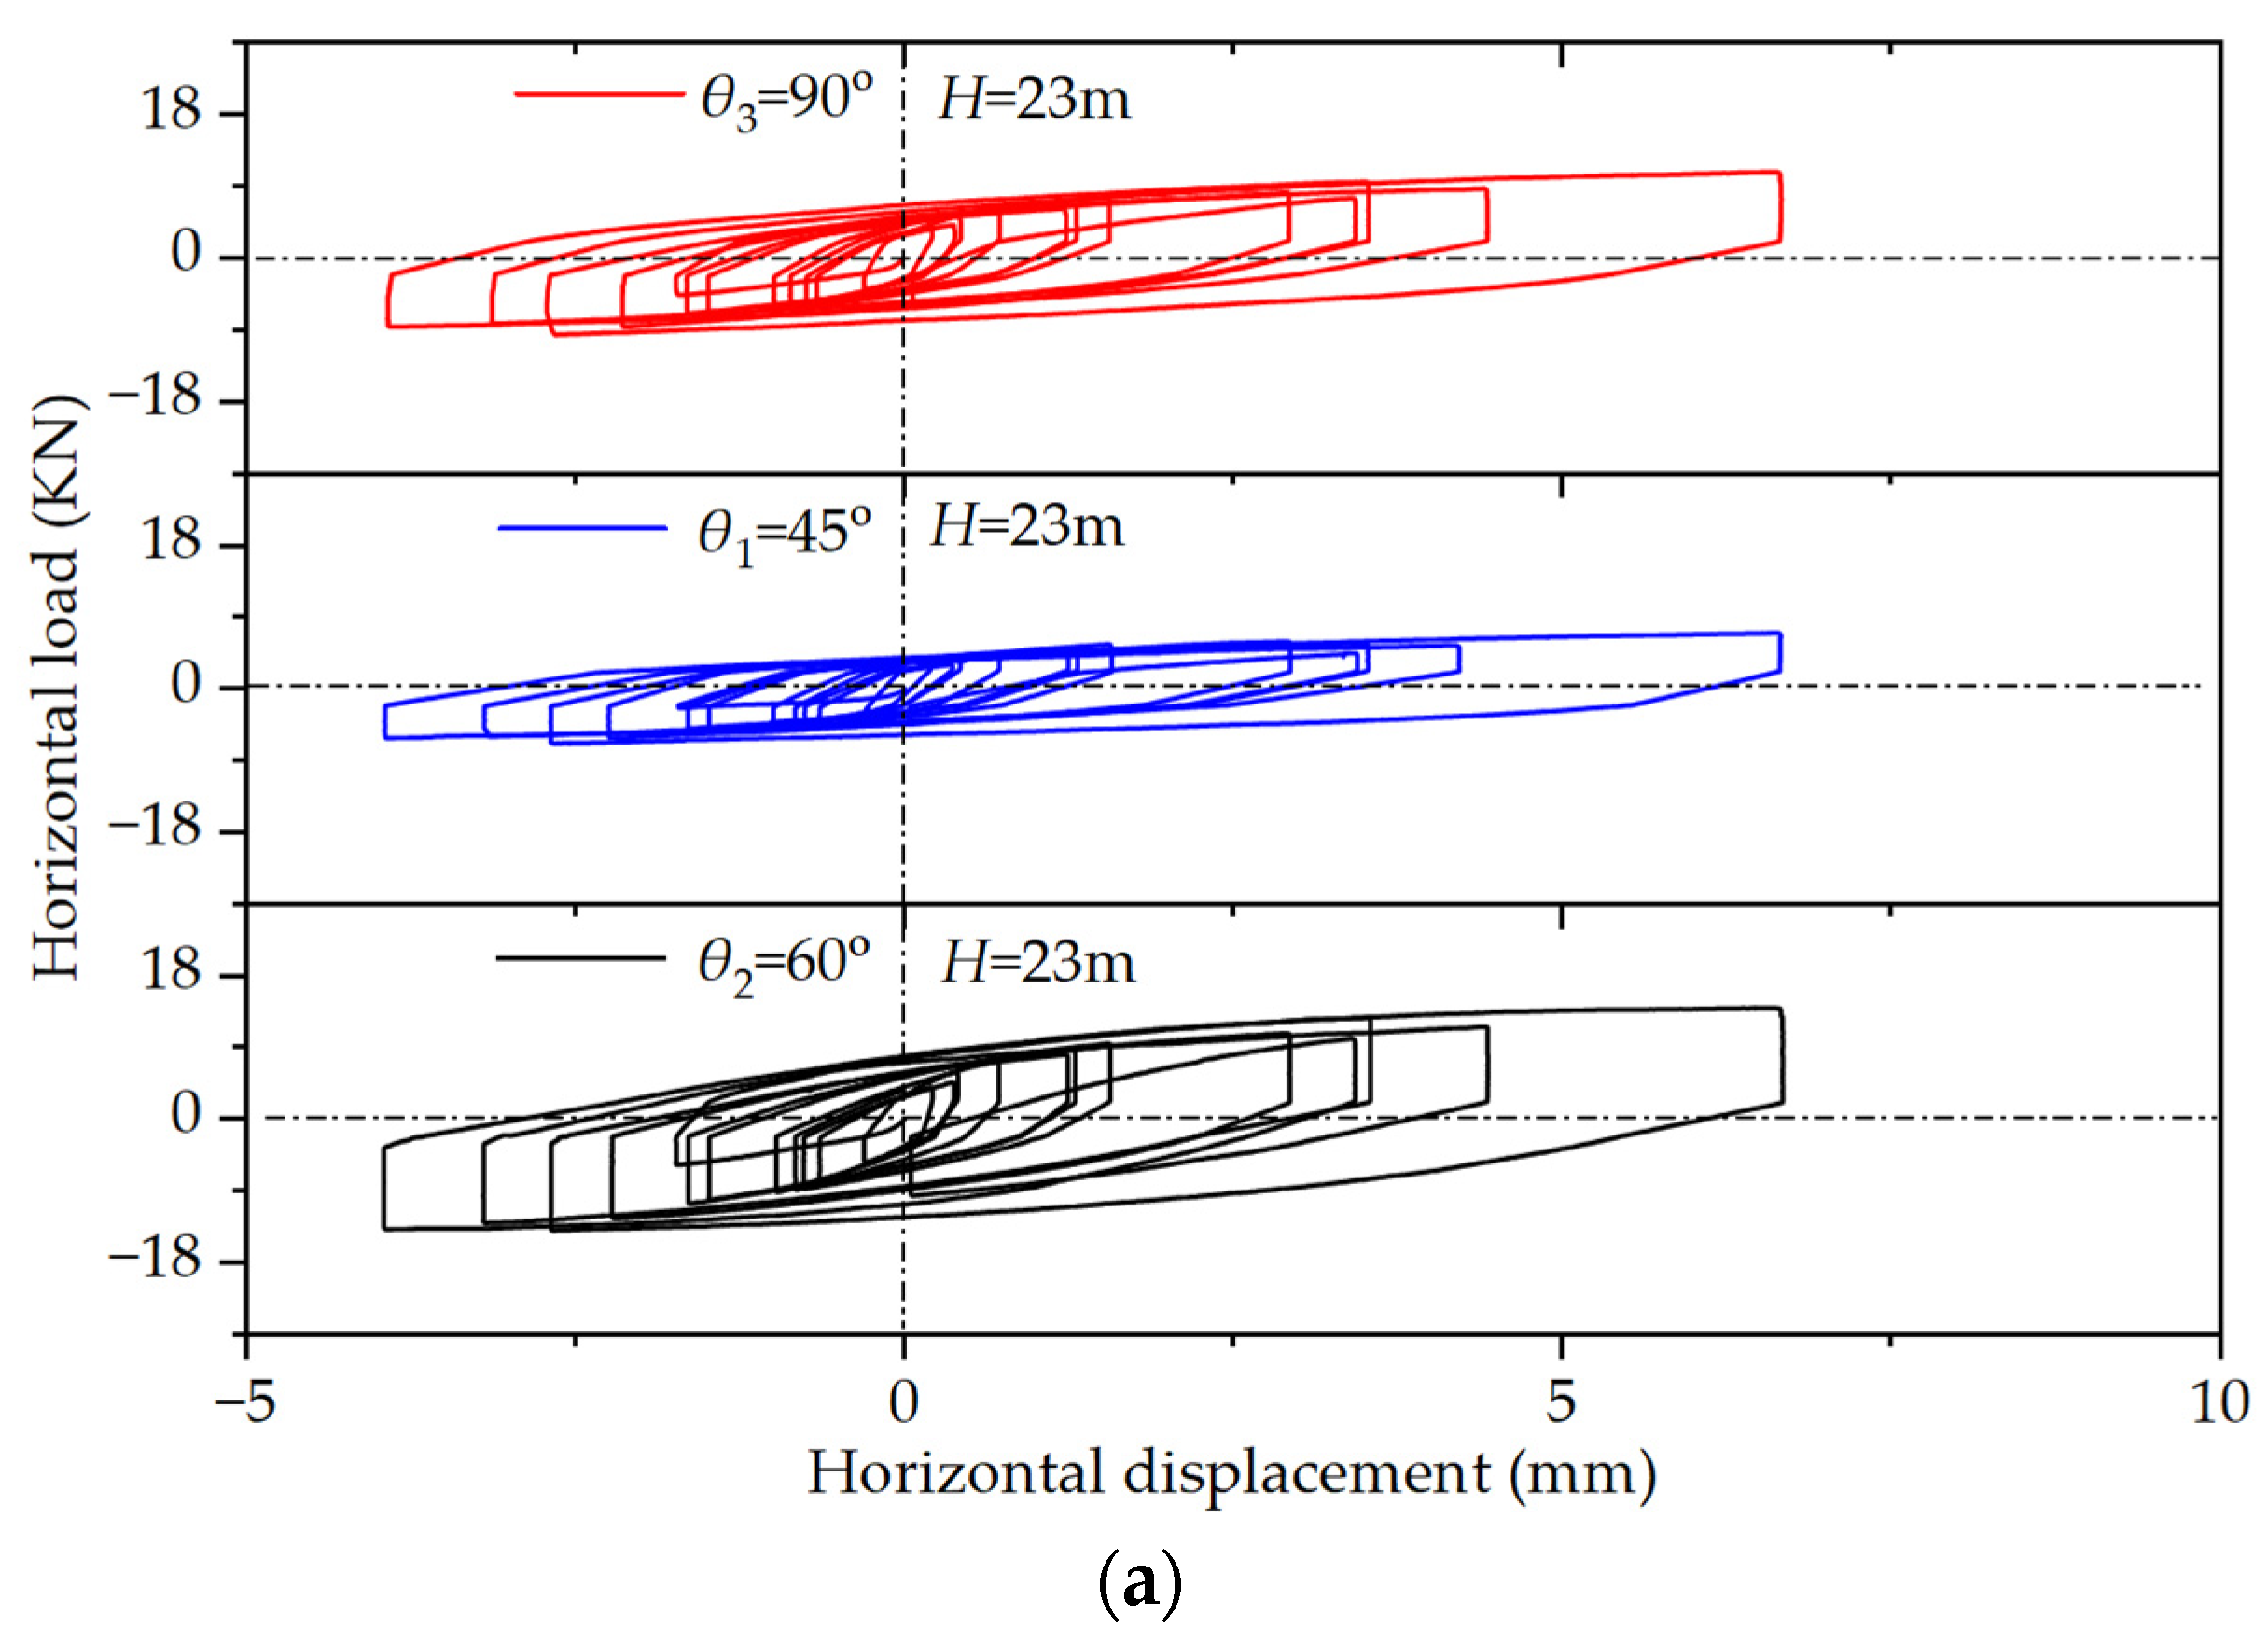
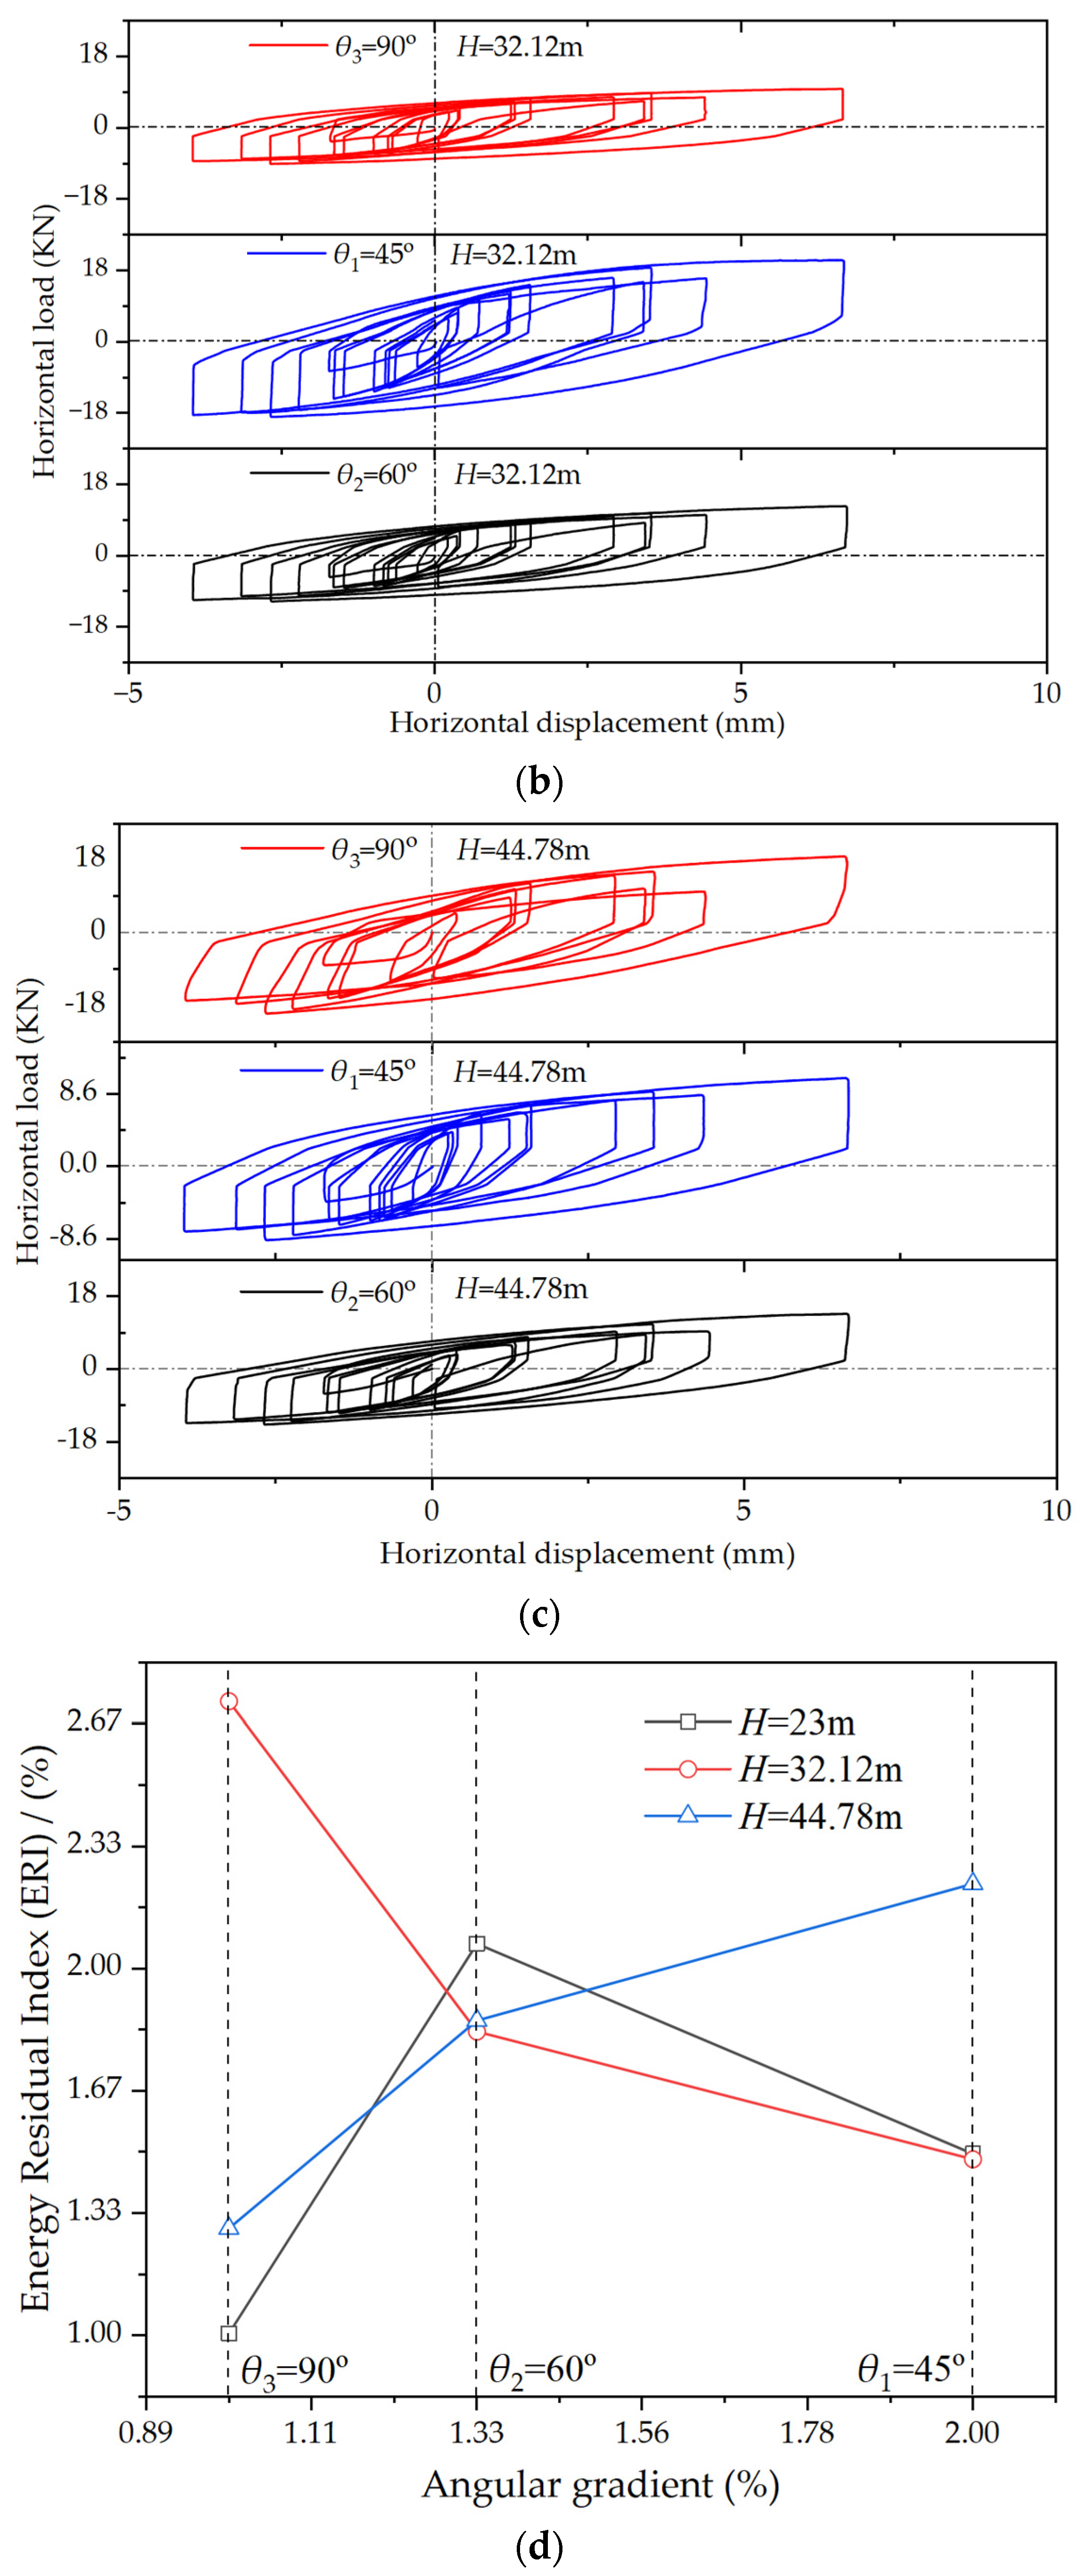
3.3. Piled Foundation Energy Absorption and Dissipation

The seismic performance of a structure fundamentally represents its capacity to dissipate seismic energy. This dissipation of seismic energy within a structure occurs primarily in two main forms: firstly, through internal damage transforming into thermal energy dissipated into space, and secondly, through external dissipation associated with the pile–soil interface interaction. These correspond primarily to the internal strain energy (ALLSE) and the external kinetic energy (ALLKE). Therefore, analyzing these two energy variations determines the position and size of the plastic region of the pile [49].
Figure 7a–c represent the plastic hysteresis loops from the piled foundation seismic loads tests. The area under the loading-displacement curve in the hysteresis loop reflects the magnitude of energy absorbed by the structure, while the area under the unloading-displacement curve represents the dissipated energy. It can be observed that the area under the loading curve is consistently greater than the area under the unloading curve.
The Energy Residue Index (ERI) of the piles is shown in Figure 7d. ERI is calculated as the difference between energy absorption and dissipation in the piles, divided by the total work done by seismic loads on the piled foundation. When θ = 90°, the ERI at H = 32.12 m under water pressure is 2.67 times higher than that at H = 23 m. Additionally, at H = 44.78 m, the ERI is two times higher than that at H = 23 m. At this point, the pile group forms a rectangular spatial volume. The piles experience irregular lateral displacement due to insufficient stability. The surrounding soil experiences relatively minor deformation, resulting in low energy dissipation. Most of the energy is transformed into the internal energy of the soil, leading to an increase in ERI. When θ = 45°, the maximum ERI value occurs at an H = 44.78 m water pressure. This is due to the inhibitory effect of water pressure on the vertical frequency of the structure [50,51]. The foundation acts as a transmission medium between these two factors. The piled foundation experiences frequency resonance. Resonance results in additional energy being absorbed by the foundation. This leads to the peak in the ERI. When θ = 60°, the ERI values under three different water pressures are relatively close. This reflects the stability of the hexagonal pile arrangement.
The ratio γ of the damping coefficient is between the piled foundation and the non-piled foundation. This ratio γ reflects the energy dissipation capacity when the foundation exhibits elastic-plastic behavior. From the relationship shown in Figure 8, the change in the γ over the course of the earthquake can be seen. At θ = 60°, as a result of the seismic-induced plastic deformation of the foundation increasing, γ gradually decreases. However, the decrease in value ∆γ is consistently 2.5. At θ = 4 5° and θ = 90°, γ values exhibit significant fluctuations. These fluctuations may pose a safety risk due to the instability of the damping ratio in seismic design.

4. Numerical Modelling

In physical experiments, there are limitations in analyzing the energy dissipation effects in the foundation. ABAQUS software (version 2020) offers advantages in parameterized analysis and visualization. Therefore, finite element analysis is employed to study the energy conversion efficiency of piled foundations. Shear seismic waves carry the majority of seismic energy. Strong seismic motion is induced by vertically propagating waves. This phenomenon has been documented in previous studies [14,15,16,17]. Earthquake-induced horizontal and vertical loads act on tunnel structures. These loads lead to deformations and stress concentrations in tunnel structures. Potential injury can also result from these earthquake effects. Prior research has extensively investigated these phenomena [52,53].

4.1. Seismic Loads Input

Numerous research findings indicate that when seismic waves occur on the foundation, the seabed and its surroundings are considered as an unbounded, infinite space. Seismic waves penetrating through the foundation experience damping from the surrounding soils. The upper boundary of the model is in contact with the water, preventing seismic waves from propagating upward and generating reflected waves. In this study, viscoelastic boundaries were employed to simulate the penetration and reflection injury of seismic waves within the SIS system. An equivalent seismic loads program for the numerical surface of the model was developed based on the principles of three-dimensional wave theory. The seismic loads were implemented and transmitted through the input model file using MATLAB. The input equation for this process was derived from the work of Liu et al. [54].
F n t = A n σ f f ( x n , y n , z n , t ) + K u f f x n , y b , z n , t + C v f f x n , y n , z n , t
where Fn(t) represents the seismic load at any given time at arbitrary point, n, on the boundary of the model. An corresponds to the control area at point n. σff denotes the stress tensor generated by the seismic waves in the normal direction to the boundary in the free field. uff stands for the displacement vector of the incident wave. vff represents the velocity vector of the incident wave. xn, yn, and zn indicate the coordinates of point n. t signifies the transit time of the wave, encompassing both the incident wave, t1, and the reflected wave, t2. K and C are the stiffness and damping coefficients of the viscoelastic boundary, as illustrated in Figure 9.

4.2. Model Parameters

The fundamental parameters of the Modified Cam-Clay (MCC) soil model include M, e0, e1, λ, Kr, and ν. These parameters can be estimated based on theoretical analysis and empirical data [55,56,57]. In the p–q coordinate system, the slope of the Critical State Line (CSL), denoted as M, is given by M = 6sinφ/(3 − sinφ). In the e–lnp coordinate system, the slope of the Normal Consolidation Line (NCL) is represented by λ = Cc/2.3, and in the same coordinate system, the slope of the rebound line is denoted as Kr, which falls within the range of 0.2 to 0.5 times λ. The relationship between the soil void ratio and the over-consolidation ratio (OCR) at a specific location is expressed as e1 = e0 + λlnp0 + Krln(OCR). During the consolidation process of the seabed, the sand compaction pile forms drainage channels that reduce excess pore water pressure. The permeability coefficient ks in the soil is related to the change in soil void ratio e during deformation. The equation for ks is ks = Cf e3/(1 + e), where Cf = k0(1 + e0)/e03 is an empirical coefficient [58]. Here, e0 and k0 represent the initial void ratio and permeability, respectively. This process increases the seabed density and deformation. On the other hand, the hardening behavior of SCP under seismic loads is simulated using the Cap model (DP) and the Porous Elastic (Proelastic) material model. The immersed tunnel and the gravel cushion layer are considered impermeable and experience minimal deformation. Therefore, linear elasticity modeling is applied to simulate their behavior. Specific parameters for these components can be found in Table 2.

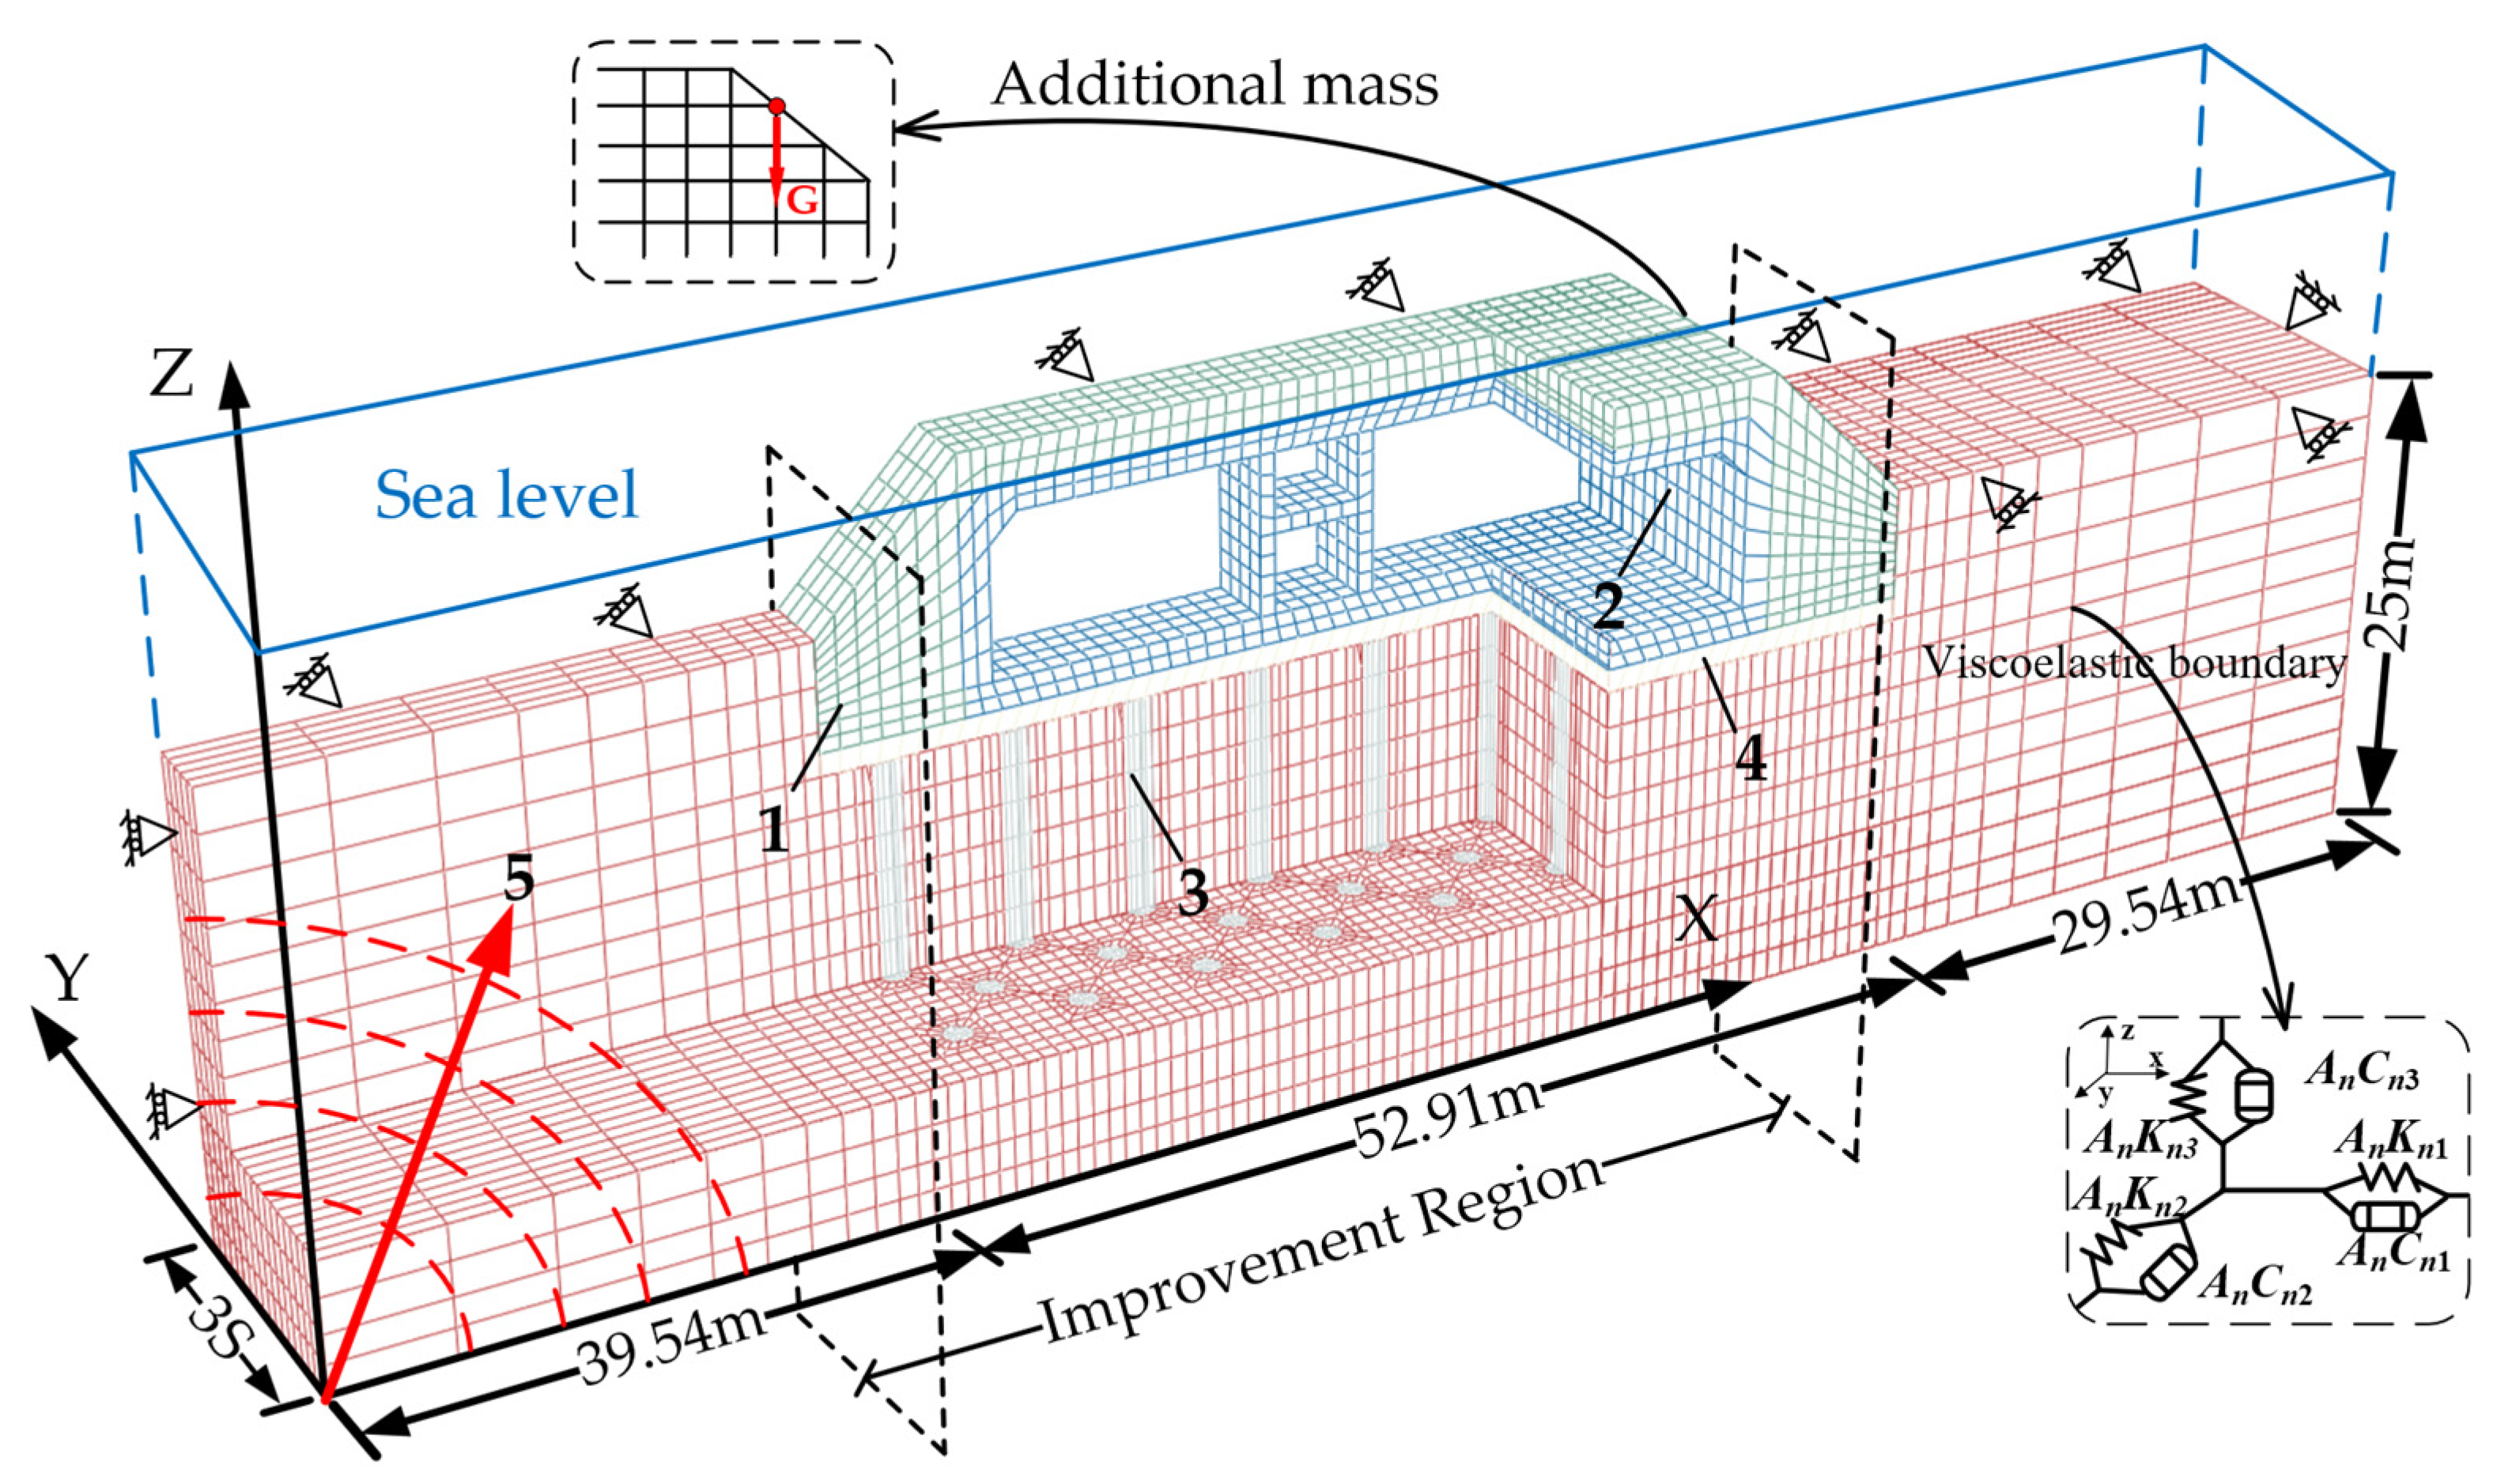
4.3. Finite Element Mesh and Boundary Condition

The interaction between the piles and the surrounding soil is modeled as frictional contact, combining normal direction hard contact with tangential friction contact. An interface strength reduction factor of 0.8 is applied [59]. Initial overburden stress is determined using the static earth pressure coefficient, with K0 = 1 – sinφ, where φ represents the soil friction angle. Finite element analysis is used to simulate the behavior of the pile–soil interaction, with C3D8P elements employed for the piles and C3D8R elements used for the gravel cushion layer and tunnel. In order to account for the longitudinal tunnel similarity to an infinitely long cavity, a single group of SCP pile elements is considered along the Y-axis direction, and the width of the model extends up to 112 m to eliminate boundary effects. In the Z-axis direction, the bottom of the model is situated 3.1 D (D represents the pile diameter) away from the pile ends [60]. Constraints are applied to the boundaries of the model and base, and spring-dashpot elements are included to represent viscoelastic boundaries. Within the SIS system, the effect of water pressure is implemented by adding additional mass at the top of the model, as depicted in Figure 9.

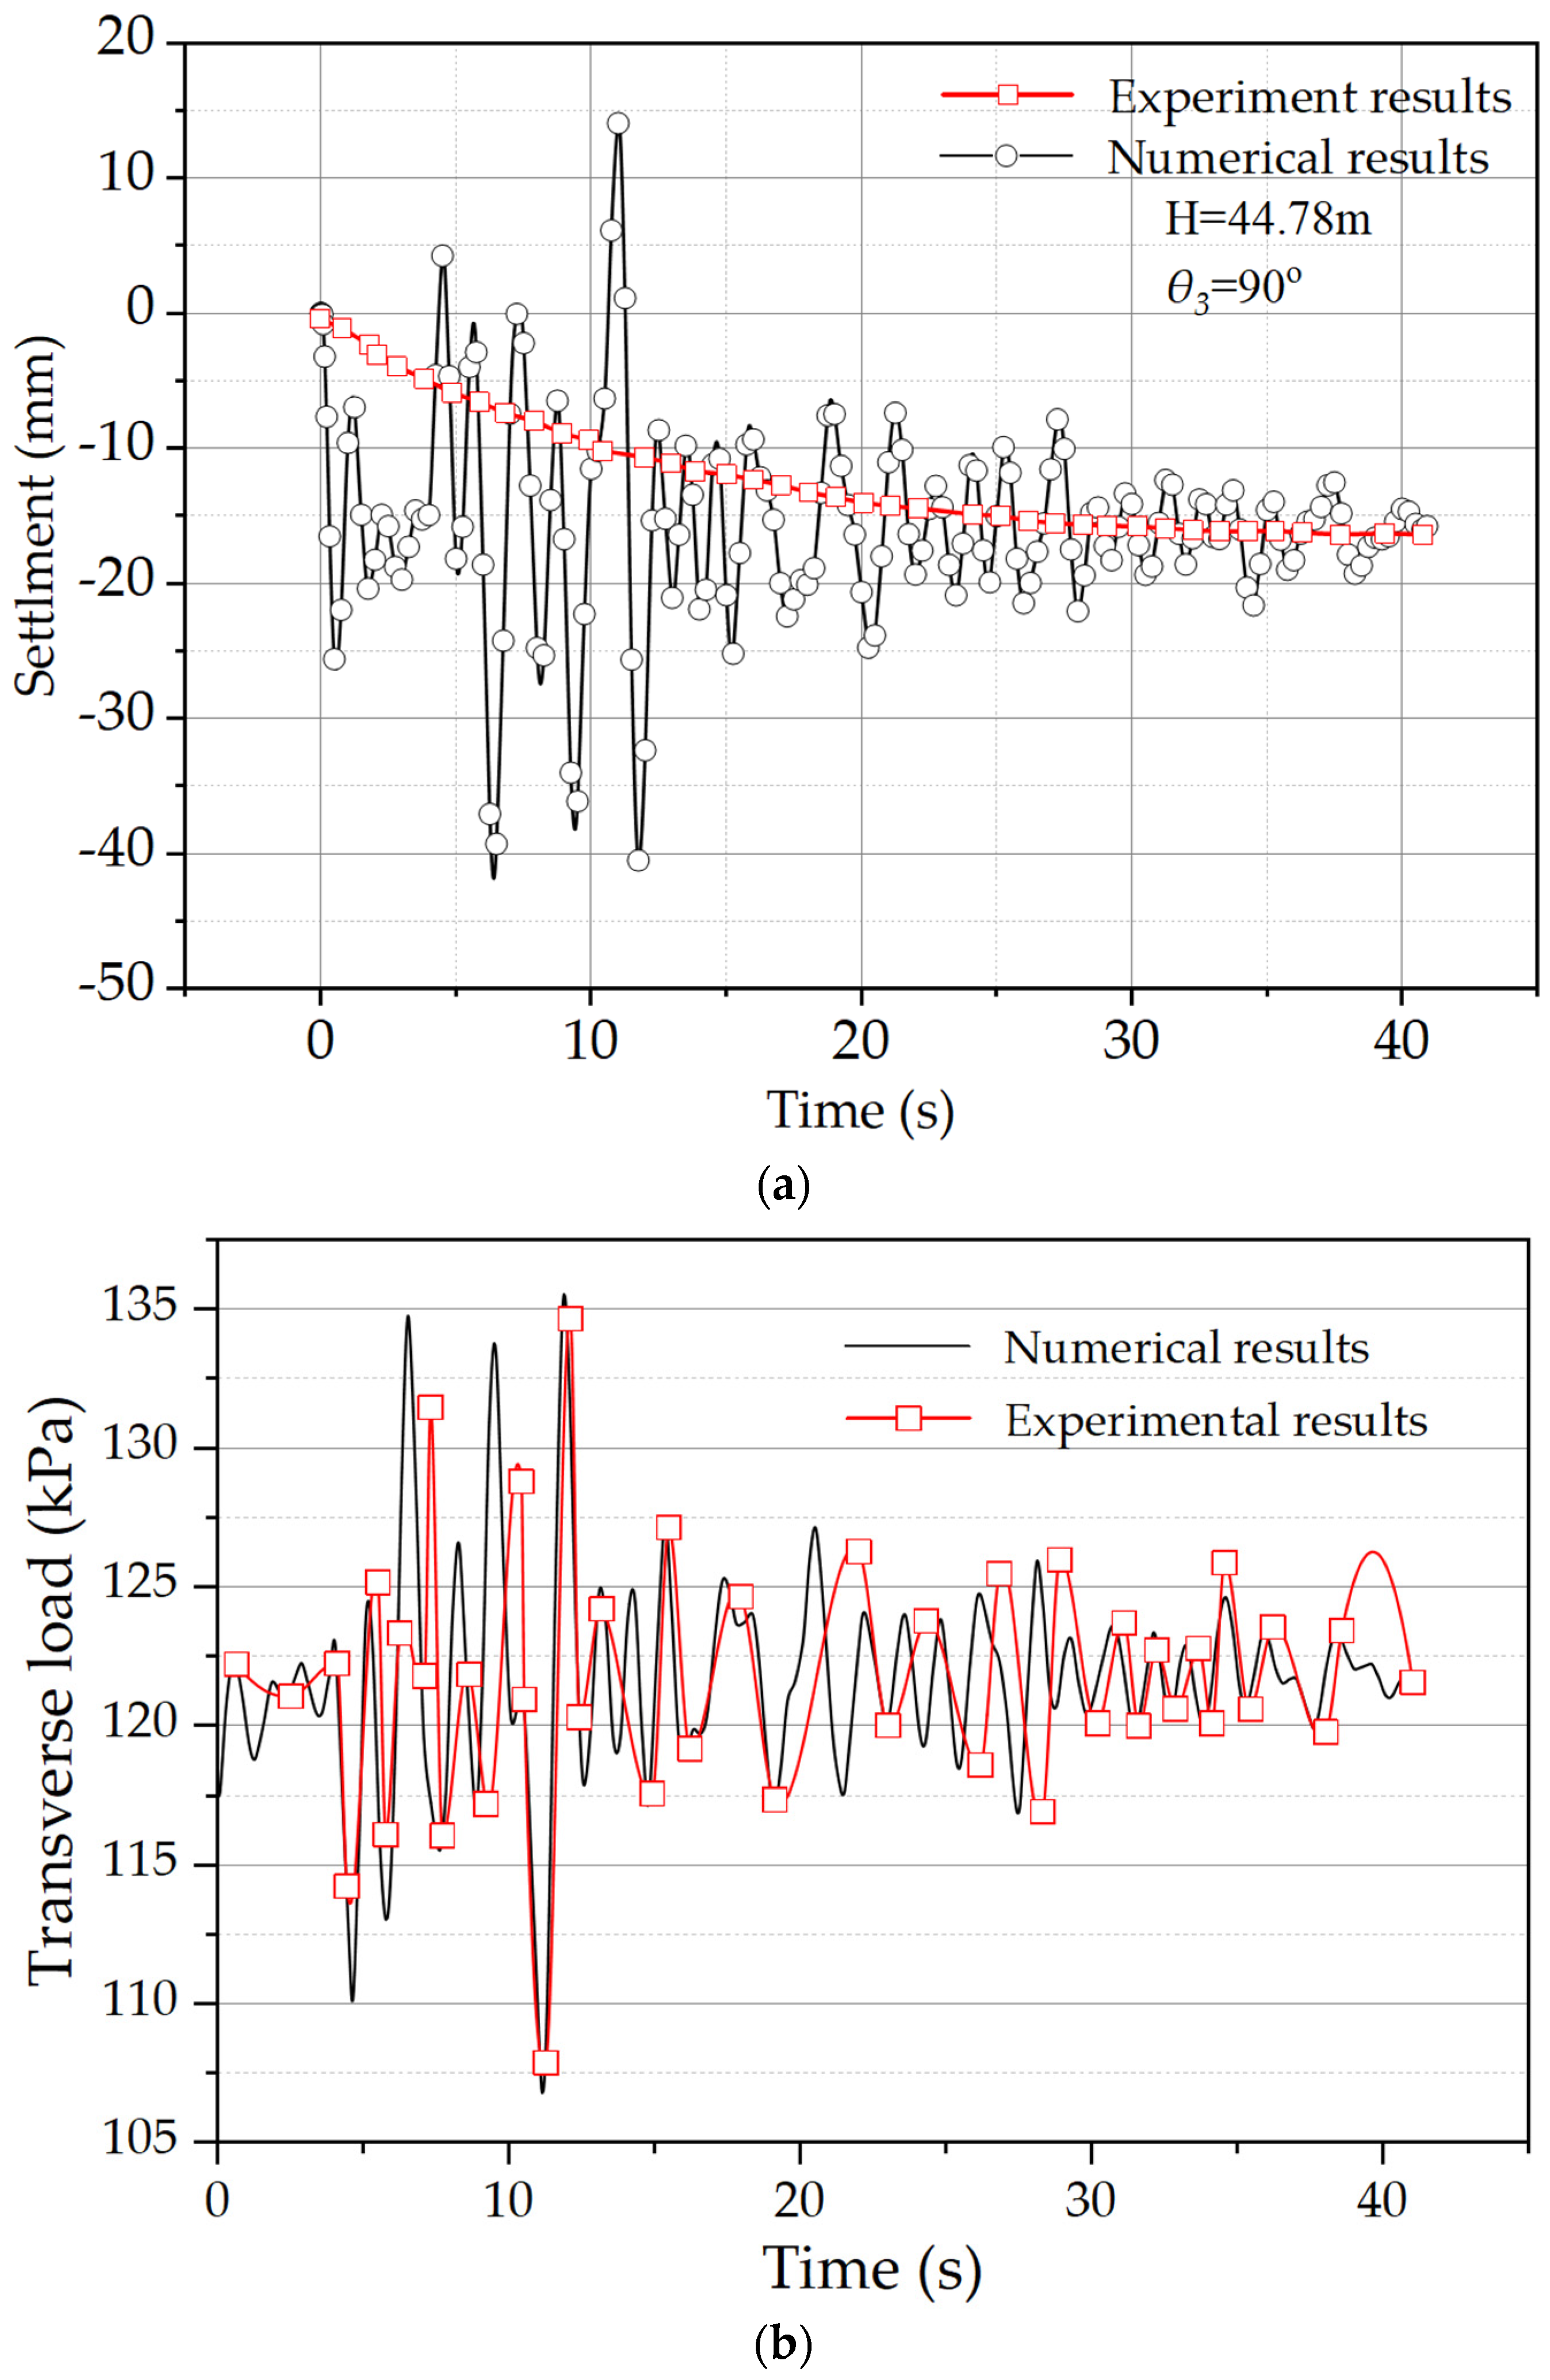
4.4. Verification of Numerical Results

In order to validate the accuracy of the numerical model, a comparison was conducted regarding pile foundation settlement and lateral load. This comparison aimed to assess the consistency between the numerical and physical models. Figure 10a illustrates the piled foundation settlement curve. Throughout the simulation process, noticeable fluctuations of approximately 15 mm were observed, gradually converging to a stable value. The final settlement results from the physical model deviated by only 4% from the stable settlement values obtained in the numerical model. From Figure 10b, it can be observed that the two models exhibited a similar variation pattern in horizontal loads, with the maximum difference in peak points being 9%. The reasons for the observed differences include boundary effects in the physical model and the absence of seismic wave reflection effects in the physical model. It is evident from these results that the consistency between the experimental and numerical findings is satisfactory.

5. Energy Absorption and Dissipation of the SCP and Soil

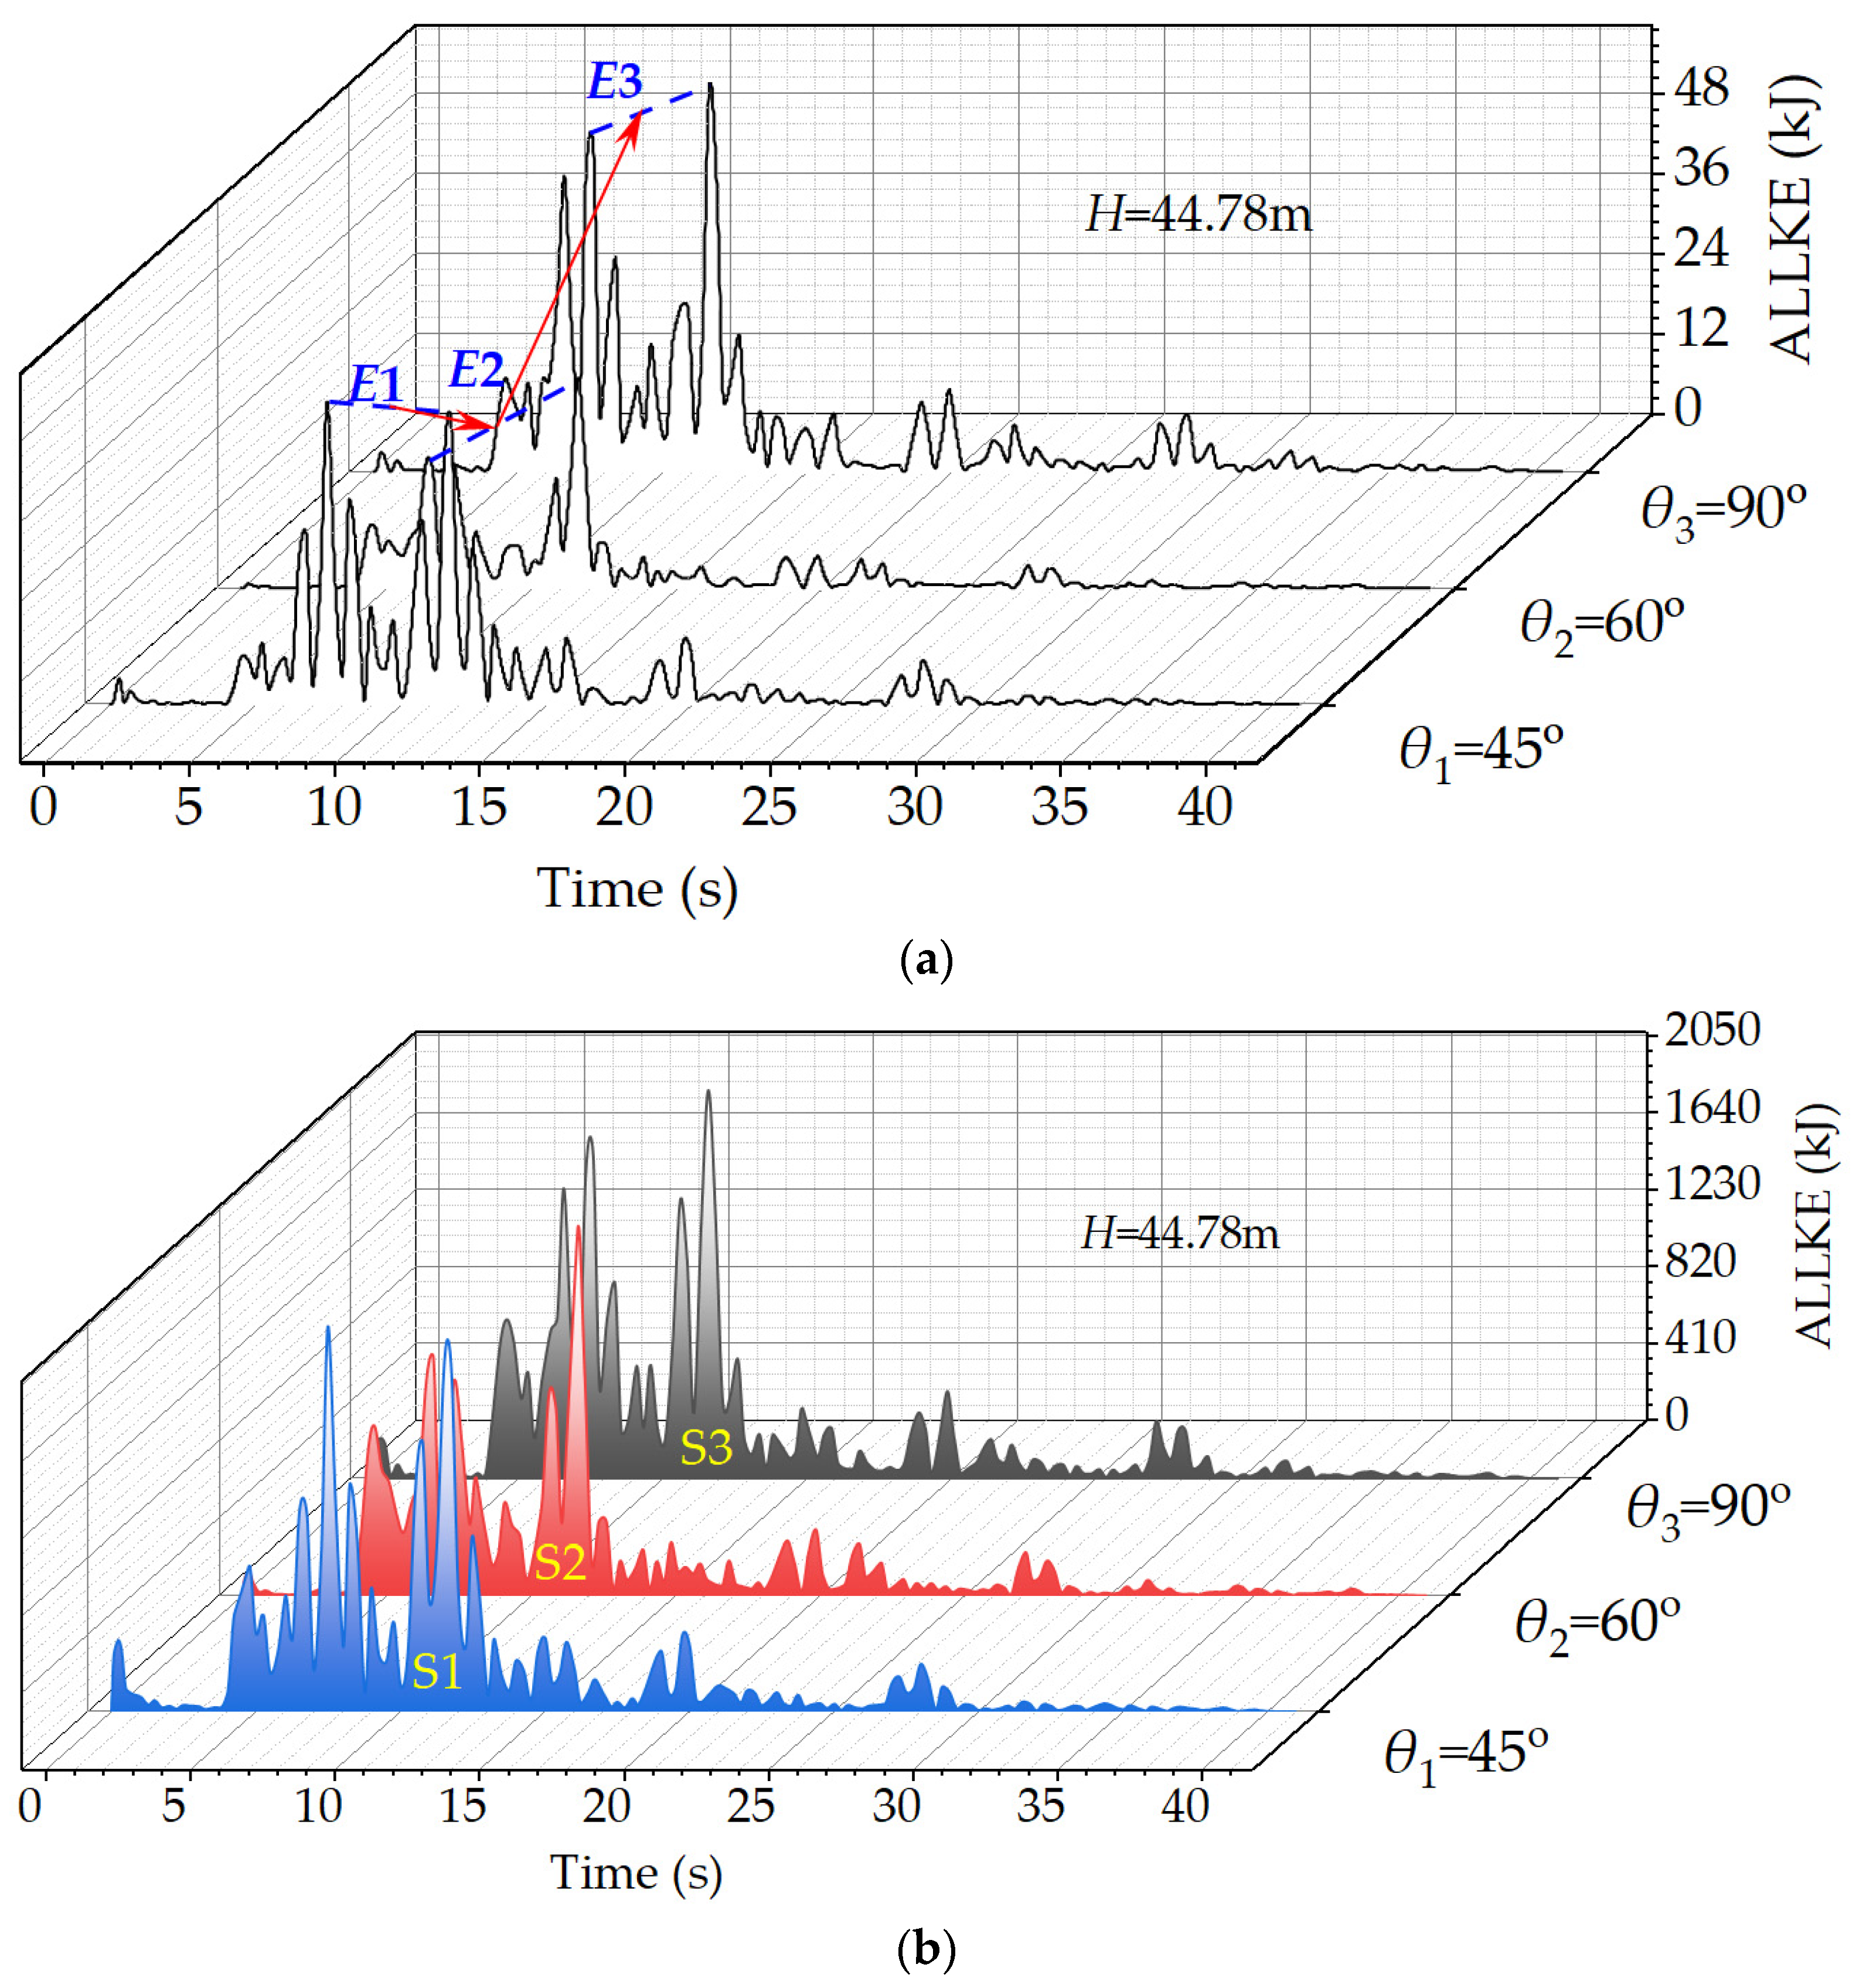
5.1. Total Kinetic Energy (ALLKE) of the Piles and Foundation

Figure 11 shows the variation in the total kinetic energy (ALLKE) of the pile group and the foundation. When the θ value ranges from 45° to 90° in the seismic energy field, there is an observed energy change phenomenon where E1 > E2 < E3, as shown in Figure 11a. The generation of pile group kinetic energy is attributed to the lateral loads of the earthquake on the pile sides, resulting in vibrations and stresses in the SCP. When an external force acts on an object, it produces inertia. This inertia induces deformations in the SCP. At θ2 = 60°, the SCP forms an equilateral triangle arrangement. In this configuration, the deformations and vibrations of the SCP are evenly distributed, leading to soil densification between the piles. The densified soil forms a triangular prism damping unit with the hexagonal pile group, reducing the response of SCP level. At θ1 = 45°, the differences in pile spacing cause a 120% amplification of kinetic energy. For θ3 = 90°, the pile-to-soil interaction forms an unstable rectangular damping unit, resulting in a 60% increase in kinetic energy. This is consistent with the law observed in the pile–soil interface f–s curves in Section 3.2.
Figure 11b clearly shows that the area under the kinetic energy of the piled foundation curve follows the pattern S2 < S3 < S1. In the context of seismic energy conservation, it is observed that in Figure 5 and Figure 6, the hexagonal pile group exhibits the least bending moments and axial forces but the largest deformations. In terms of the dissipation of seismic energy, it is divided into two parts: one involving motion and friction and the other related to structural internal injury converted into thermal energy. Piles with higher strains dissipate more internal energy, resulting in lower kinetic energy associated with motion. As a result, the hexagonal pile group exhibits the smallest area under its kinetic energy curve, signifying greater structural stability.

5.2. Total Strain Energy (ALLSE) of the Pile

Internal strain energy dissipation within SCP is a crucial mechanism for resisting seismic energy-induced damage in the foundation. Figure 12 shows the total strain energy of a single pile. When θ1 = 45° and θ3 = 90°, the strain energy of the pile only undergoes the ∆e1 energy change process. This leads to the maximum strain energy near the top of the pile. The fixed connection between the pile top and the immersed tunnel structure results in a top-heavy structural mass distribution, intensifying the seismic forces on the top of the pile. Conversely, at θ2 = 60°, there are both strain energy increase (∆e1) and decrease (∆e2) processes. This distribution of mass, with more mass concentrated at the top, causes reduced strain energy both at the top of the pile and at the end of the pile. The presence of the triangular prism damping units impacts this variation. It partially cancels the seismic wavefront, reducing the energy transmitted to the top. The larger embedment depth of the pile at the bottom increases the surrounding soil pressure. This also reduces the deformations of the pile. As a result, there is a lower strain energy than that in the middle section.
To distinguish the ability of a pile to absorb seismic energy, we evaluate the difference in strain energy transition amplitudes. Refer to the energy change lines (denoted as λ) in Figure 12a–c, where λ1 = 3.75 m, λ2 = 4.1 m, λ3 = 8.3 m, and λ4 = 5 m. This correlates with the plastic regions discussed in Section 3.2.

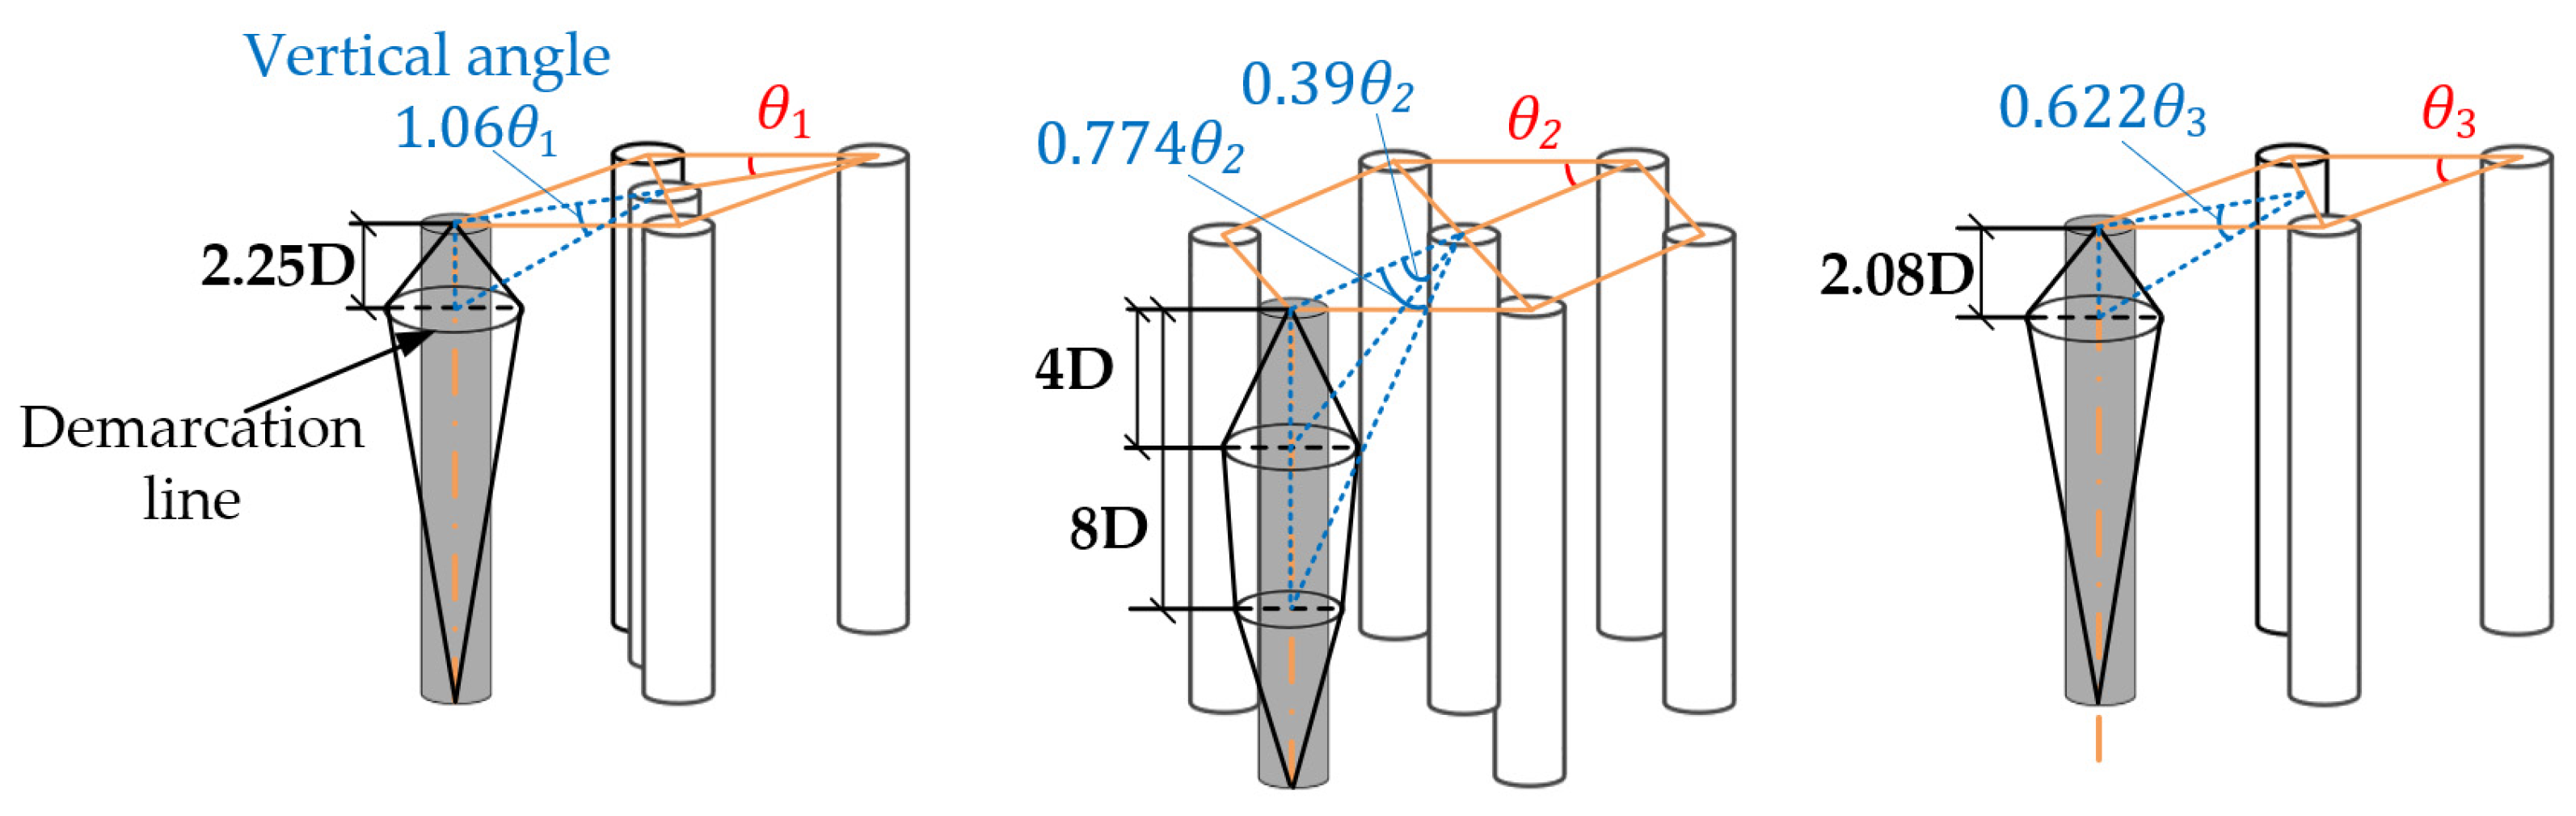
6. Location of the Boundaries of the Damaged Region

Based on the analysis of the mechanical behavior at the pile–soil interface and the energy change, the relationship between the plastic regions of the piles and θ values is quantified, as shown in Figure 13. For the “X-shaped” pile group, the boundary between the heavy and mild plastic region is located at a depth of L = 2.25 D, with a vertical angle of 1.06 θ1. In the case of the hexagonal pile group, the boundaries between heavy, moderate, and mild plastic regions are found at depths of L = 4 D and L = 8 D, with vertical angles of 10.39 θ2 and 0.774 θ2, respectively. The rectangular pile group has boundaries for heavy and mild plastic regions at a depth of L = 2.08 D, with a vertical angle of 0.622 θ3. The arrangement of SCP should aim to form triangular prism damping units and establish a mass distribution where the upper part is lighter than the lower part. This ensures that the structure can achieve optimal support and protection during seismic events.

7. Conclusions

This study investigates the seismic response of the SIS system. Physical experiments were conducted to analyze the distribution of pile bending moments, pile–soil interface interactions, and plastic hysteresis loops of the pile foundation in a detailed parameterized manner. Subsequently, numerical analysis was employed to validate the physical model, and further analysis was carried out to examine the energy variations in the sand pile and foundation within the seismic energy field. The key research findings are summarized as follows:
The “X-shaped” and rectangular pile groups only exhibit heavy plastic region A with significant mass distribution and mild plastic region C with less soil compression. The absence of a moderate plastic region B is attributed to the variations in pile spacing and instability caused by the formation of quadrangular prism damping units between the piles.
The hexagonal pile group, which forms a triangular prism damping unit with the surrounding soil, mitigates the piled foundation response. It partially counteracts the seismic wavefront, reducing the extent of injury to structures with a top-heavy mass distribution. This enhances the energy dissipation capacity of the piled foundation and stabilizes the damping characteristics.
The greater the Energy Residual Index (ERI), the lower the structural energy dissipation, indicating poorer seismic performance. Irregular pile spacing and the instability of the quadrilateral prism damping unit formed by piles and soil increase the ERI of the piled foundation. An increased underwater pressure results in higher ERI due to the enhanced suppression of vertical seismic frequencies. The occurrence of frequency resonance-induced injury leads to additional energy.
The relationship between the plastic region and pile arrangement was determined based on the mechanical behavior of the pile–soil interface and the energy changes. For the “X-shaped” pile group, the boundary between the heavy and mild plastic regions is located at a depth of L = 2.25 D. In the hexagonal pile group, the boundaries between the heavy, moderate, and mild plastic regions are situated at depths of L = 4 D and L = 8 D. The boundaries between the heavy and mild plastic regions are found in the rectangular pile group at a depth of L = 2.08 D.

Author Contributions

Conceptualization, H.F. and Y.Z.; methodology, H.F.; software, J.L.; validation, H.F., Y.Z. and J.L.; formal analysis, J.L.; investigation, Z.C.; resources, Y.Z.; data curation, Z.C.; writing—original draft preparation, H.F.; writing—review and editing, H.F.; visualization, Z.C.; supervision, J.L.; project administration, Z.C.; funding acquisition, Y.Z. All authors have read and agreed to the published version of the manuscript.

Funding

The financial support of the National Natural Science Foundation for General Program of China (Grant No. 52178316) and the National Science Foundation for Excellent Young Scholars of China (Grant No. 51922029) is acknowledged.

Institutional Review Board Statement

Not applicable.

Informed Consent Statement

Not applicable.

Data Availability Statement

The data presented in this study are available on request from the corresponding author. The data are not publicly available due to network security issues.

Conflicts of Interest

The authors declare no conflict of interest.

References

  1. Oka, F.; Tsai, P.; Kimoto, S.; Kato, R. Damage patterns of river embankments due to the 2011 off the Pacific Coast of Tohoku Earthquake and a numerical modeling of the deformation of river embankments with a clayey subsoil layer. Soils Found. 2012, 52, 890–909. [Google Scholar] [CrossRef]
  2. Tani, S. Consideration of Earthquake Damage to Earth Dam for Irrigation in Japan. In Proceedings of the International Conferences on Recent Advances in Geotechnical Earthquake Engineering and Soil Dynamics, St. Louis, MO, USA, 11–15 March 1991. [Google Scholar]
  3. Kawakami, F.; Asada, A. Damage to the Ground and Earth Structures by the Niigata Earthquake of June 16, 1964. Soils Found. 1966, 6, 14–30. [Google Scholar] [CrossRef]
  4. Tani, S. Damage to Earth Dams. Soils Found. 1996, 36, 263–272. [Google Scholar] [CrossRef] [PubMed]
  5. Sasaki, Y.; Towhata, I.; Tokida, K.-I.; Yamada, K.; Matsumoto, H.; Tamari, Y.; Saya, S. Mechanism of Permanent Displacement of Ground Caused by Seismic Liquefaction. Soils Found. 1992, 32, 79–96. [Google Scholar] [CrossRef] [PubMed]
  6. Koga, Y.; Matsuo, O. Shaking Table Tests of Embankments Resting on Liquefiable Sandy Ground. Soils Found. 1990, 30, 162–174. [Google Scholar] [CrossRef] [PubMed]
  7. Matsuo, O. Damage to River Dikes. Soils Found. 1996, 36, 235–240. [Google Scholar] [CrossRef]
  8. Anas, S.M.; Alam, M.; Umair, M. Experimental and numerical investigations on performance of reinforced concrete slabs under explosive-induced air-blast loading: A state-of-the-art review. Structures 2021, 31, 428–461. [Google Scholar] [CrossRef]
  9. Zhang, Y.; Liu, H.; Wu, W.; Wang, L.; Jiang, G. A 3D analytical model for distributed low strain test and parallel seismic test of pipe piles. Ocean. Eng. 2021, 225, 108828. [Google Scholar] [CrossRef]
  10. Zheng, C.; Kouretzis, G.; Ding, X.; Luan, L. Vertical vibration of end-bearing single piles in poroelastic soil considering three-dimensional soil and pile wave effects. Comput. Geotech. 2022, 146, 104740. [Google Scholar] [CrossRef]
  11. Zheng, C.; Gan, S.; Luan, L.; Ding, X. Vertical dynamic response of a pile embedded in a poroelastic soil layer overlying rigid base. Acta Geotech. 2020, 16, 977–983. [Google Scholar] [CrossRef]
  12. Li, L.; Liu, H.; Wu, W.; Wen, M.; El Naggar, M.H.; Yang, Y. Investigation on the behavior of hybrid pile foundation and its surrounding soil during cyclic lateral loading. Ocean. Eng. 2021, 240, 110006. [Google Scholar] [CrossRef]
  13. Wu, W.; Yang, Z.; Liu, X.; Zhang, Y.; Liu, H.; El Naggar, M.H.; Xu, M.; Mei, G. Horizontal dynamic response of pile in unsaturated soil considering its construction disturbance effect. Ocean. Eng. 2022, 245, 110483. [Google Scholar] [CrossRef]
  14. Faghihnia Torshizi, M.; Saitoh, M.; Álamo, G.M.; Goit, C.S.; Padrón, L.A. Influence of pile radius on the pile head kinematic bending strains of end-bearing pile groups. Soil Dyn. Earthq. Eng. 2018, 105, 184–203. [Google Scholar] [CrossRef]
  15. Anand, V.; Satish Kumar, S.R. Seismic Soil-structure Interaction: A State-of-the-Art Review. Structures 2018, 16, 317–326. [Google Scholar] [CrossRef]
  16. Cui, C.; Meng, K.; Xu, C.; Liang, Z.; Li, H.; Pei, H. Analytical solution for longitudinal vibration of a floating pile in saturated porous media based on a fictitious saturated soil pile model. Comput. Geotech. 2021, 131, 103942. [Google Scholar] [CrossRef]
  17. Naggar, M.H.E.; Shayanfar, M.A.; Kimiaei, M.; Aghakouchak, A.A. Simplified BNWF model for nonlinear seismic response analysis of offshore piles with nonlinear input ground motion analysis. Can. Geotech. J. 2005, 42, 365–380. [Google Scholar] [CrossRef]
  18. Li, Y.; Kitazume, M.; Takahashi, A.; Harada, K.; Ohbayashi, J. Centrifuge study on the effect of the SCP improvement geometry on the mitigation of liquefaction-induced embankment settlement. Soil Dyn. Earthq. Eng. 2021, 148, 106852. [Google Scholar] [CrossRef]
  19. Yang, X.; Zhang, Y.; Liu, H.; Fan, X.; Jiang, G.; El Naggar, M.H.; Wu, W.; Liu, X. Analytical solution for lateral dynamic response of pile foundation embedded in unsaturated soil. Ocean. Eng. 2022, 265, 112518. [Google Scholar] [CrossRef]
  20. Chen, L.; Wu, W.; Liu, H.; Li, J.; Newson, T.; El Naggar, M.H. Analytical solution for kinematic response of offshore piles under vertically propagating S-waves. Ocean. Eng. 2022, 262, 112018. [Google Scholar] [CrossRef]
  21. Huang, Y.; Wang, P.; Zhao, M.; Zhang, C.; Du, X. Dynamic responses of an end-bearing pile subjected to horizontal earthquakes considering water-pile-soil interactions. Ocean. Eng. 2021, 238, 109726. [Google Scholar] [CrossRef]
  22. Wang, C.; Ding, X.; Cao, G.; Jiang, C.; Fang, H.; Wang, C. Numerical investigation of the effect of particle gradation on the lateral response of pile in coral sand. Comput. Geotech. 2022, 152, 105012. [Google Scholar] [CrossRef]
  23. Su, D.; Wu, Z.; Lei, G.; Zhu, M. Numerical study on the installation effect of a jacked pile in sands on the pile vertical bearing capacities. Comput. Geotech. 2022, 145, 104690. [Google Scholar] [CrossRef]
  24. Zhao, M.-H.; Heng, S.; Zheng, Y. Numerical simulation on behavior of pile foundations under cyclic axial loads. J. Cent. South Univ. 2017, 24, 2906–2913. [Google Scholar] [CrossRef]
  25. Yadav, S.K.; Ye, G.-L.; Khalid, U.; Fukuda, M. Numerical and centrifugal physical modelling on soft clay improved with floating and fixed sand compaction piles. Comput. Geotech. 2019, 115, 103160. [Google Scholar] [CrossRef]
  26. Rouholamin, M.; Lombardi, D.; Bhattacharya, S. Experimental investigation of transient bending moment of piles during seismic liquefaction. Soil Dyn. Earthq. Eng. 2022, 157, 107251. [Google Scholar] [CrossRef]
  27. Hong, Y.; He, B.; Wang, L.Z.; Wang, Z.; Ng, C.W.W.; Mašín, D. Cyclic lateral response and failure mechanisms of semi-rigid pile in soft clay: Centrifuge tests and numerical modelling. Can. Geotech. J. 2017, 54, 806–824. [Google Scholar] [CrossRef]
  28. Kim, B.I.; Lee, S.H. Comparison of bearing capacity characteristics of sand and gravel compaction pile treated ground.pdf. KSCE J. Civ. Eng. 2005, 9, 197–203. [Google Scholar] [CrossRef]
  29. Solymar, Z.V.; Samsudin; Osellame, J.; Purnomo, B.J. Ground Improvement by Compaction Piling. J. Geotech. Eng. 1986, 112, 1069–1083. [Google Scholar] [CrossRef]
  30. Yi, J.T.; Goh, S.H.; Lee, F.H. Effect of sand compaction pile installation on strength of soft clay. Géotechnique 2013, 63, 1029–1041. [Google Scholar] [CrossRef]
  31. Jung, J.-B.; Lee, K.-I.; Lee, J.-S. Consolidation behavior of clay ground improved by sand compaction piles. KSCE J. Civ. Eng. 1999, 3, 205–212. [Google Scholar] [CrossRef]
  32. Murali Krishna, A.; Madhav, M. Treatment of loose to medium dense sands by granular piles: Improved SPT’ N 1′Values. Geotech. Geol. Eng. 2009, 27, 455–459. [Google Scholar] [CrossRef]
  33. Aarthi, N.; Dodagoudar, G.R. Three-Dimensional Finite-Element Analysis of Pressure–Settlement Response of Sand Compaction Pile-Treated Cohesionless Deposits. Int. J. Geomech. 2021, 21, 04021019. [Google Scholar] [CrossRef]
  34. Padmanabhan, G.; Shanmugam, G.K. Liquefaction and reliquefaction resistance of saturated sand deposits treated with sand compaction piles. Bull. Earthq. Eng. 2021, 19, 4235–4259. [Google Scholar] [CrossRef]
  35. He, H.; Lin, Y.; Li, J.; Zhang, N. Immersed tunnel foundation on marine clay improved by sand compaction piles. Mar. Georesour. Geotechnol. 2017, 36, 218–226. [Google Scholar] [CrossRef]
  36. Saha, R.; Haldar, S.; Dutta, S.C. Influence of dynamic soil-pile raft-structure interaction: An experimental approach. Earthq. Eng. Eng. Vib. 2015, 14, 625–645. [Google Scholar] [CrossRef]
  37. Deb Roy, S.; Pandey, A.; Saha, R. Shake table study on seismic soil-pile foundation-structure interaction in soft clay. Structures 2021, 29, 1229–1241. [Google Scholar] [CrossRef]
  38. Yang, J.; Yang, M.; Chen, H. Influence of pile spacing on seismic response of piled raft in soft clay: Centrifuge modeling. Earthq. Eng. Eng. Vib. 2019, 18, 719–733. [Google Scholar] [CrossRef]
  39. Jian, Z.; Yurun, L.; Zhixiao, Y.; Da, H.; Xian, R.; Yan, L. Experimental study of vertical and batter pile groups in saturated sand using a centrifuge shaking table. Earthq. Eng. Eng. Vib. 2021, 21, 23–36. [Google Scholar] [CrossRef]
  40. Zhang, L.; Goh, S.H.; Liu, H. Seismic response of pile-raft-clay system subjected to a long-duration earthquake: Centrifuge test and finite element analysis. Soil Dyn. Earthq. Eng. 2017, 92, 488–502. [Google Scholar] [CrossRef]
  41. Dehghanpoor, A.; Thambiratnam, D.; Taciroglu, E.; Chan, T. Soil-pile-superstructure interaction effects in seismically isolated bridges under combined vertical and horizontal strong ground motions. Soil Dyn. Earthq. Eng. 2019, 126, 105753. [Google Scholar] [CrossRef]
  42. Azizkandi, A.S.; Baziar, M.H.; Yeznabad, A.F. 3D Dynamic Finite Element Analyses and 1 g Shaking Table Tests on Seismic Performance of Connected and Nonconnected Piled Raft Foundations. KSCE J. Civ. Eng. 2017, 22, 1750–1762. [Google Scholar] [CrossRef]
  43. Wang, Z.; Yi, J.T.; Kang, C.Y.; Xu, S.J.; Yin, S.; Pan, Y.T. A novel numerical strategy to analyse the installation and set-up effects of sand compaction piling. Ocean. Eng. 2023, 285, 115331. [Google Scholar] [CrossRef]
  44. Su, C.; Wang, P.; Zhao, M.; Zhang, G.; Bao, X. Dynamic interaction analysis of structure-water-soil-rock systems under obliquely incident seismic waves for layered soils. Ocean. Eng. 2022, 244, 110256. [Google Scholar] [CrossRef]
  45. Niu, Y.; Xie, Y.; Zhang, H.; Yue, X.; Han, Y.; Hu, Z. Study on bearing characteristics of marine subsoil for semi-rigid immersed tunnel. Mar. Georesour. Geotechnol. 2021, 40, 1171–1183. [Google Scholar] [CrossRef]
  46. Wen, K.; Wu, X.; Zhu, B. Numerical investigation on the lateral loading behaviour of tetrapod piled jacket foundations in medium dense sand. Appl. Ocean. Res. 2020, 100, 102193. [Google Scholar] [CrossRef]
  47. González, F.; Padrón, L.A.; Aznárez, J.J.; Maeso, O. Equivalent linear model for the lateral dynamic analysis of pile foundations considering pile-soil interface degradation. Eng. Anal. Bound. Elem. 2020, 119, 59–73. [Google Scholar] [CrossRef]
  48. Jones, K.; Sun, M.; Lin, C. Numerical analysis of group effects of a large pile group under lateral loading. Comput. Geotech. 2022, 144, 104660. [Google Scholar] [CrossRef]
  49. Gholami, N.; Garivani, S.; Askariani, S.S. State-of-the-Art Review of Energy-Based Seismic Design Methods. Arch. Comput. Methods Eng. 2021, 29, 1965–1996. [Google Scholar] [CrossRef]
  50. Saleh Asheghabadi, M.; Rahgozar, M.A. Finite Element Seismic Analysis of Soil–Tunnel Interactions in Clay Soils. Iran. J. Sci. Technol. Trans. Civ. Eng. 2018, 43, 835–849. [Google Scholar] [CrossRef]
  51. Aknouche, H.; Airouche, A.; Bechtoula, H. Influence of Earthquake Frequency Nonstationarity on Seismic Structural Response. Iran. J. Sci. Technol. Trans. Civ. Eng. 2020, 44, 603–614. [Google Scholar] [CrossRef]
  52. Balaam, N.P.; Booker, J.R. Effect of stone column yield on settlement of rigid foundations in stabilized clay. Num. Anal. Meth Geomech. 1985, 9, 331–351. [Google Scholar] [CrossRef]
  53. Aboshi, H.; Mizuno, Y.; Kuwabara, M. Present State of Sand Compaction Pile in Japan. In Deep Foundation Improvements: Design, Construction, and Testing; ASTM International: West Conshohocken, PA, USA, 1991; pp. 32–35. [Google Scholar]
  54. Liu, J.; Du, Y.; Du, X.; Wang, Z.; Wu, J. 3D viscous-spring artificial boundary in time domain. Earthq. Eng. Eng. Vib. 2006, 5, 93–102. [Google Scholar] [CrossRef]
  55. Ye, J.; He, K.; Zhou, L. Subsidence prediction of a rubble mound breakwater at Yantai port: A application of FSSI-CAS 2D. Ocean Eng. 2021, 219, 108349. [Google Scholar] [CrossRef]
  56. Savvides, A.A.; Papadrakakis, M. A computational study on the uncertainty quantification of failure of clays with a modified Cam-Clay yield criterion. SN Appl. Sci. 2021, 3, 659. [Google Scholar] [CrossRef]
  57. Kavvadas, M.; Amorosi, A. A constitutive model for structured soils. Géotechnique 2000, 50, 263–273. [Google Scholar] [CrossRef]
  58. Miyamoto, J.; Sassa, S.; Sekiguchi, H. Progressive solidification of a liquefied sand layer during continued wave loading. Géotechnique 2004, 54, 617–629. [Google Scholar] [CrossRef]
  59. Huang, J.; Han, J. Two-dimensional parametric study of geosynthetic-reinforced column-supported embankments by coupled hydraulic and mechanical modeling. Comput. Geotech. 2010, 37, 638–648. [Google Scholar] [CrossRef]
  60. Zhang, G.; Wang, P.; Zhao, M.; Du, X.; Zhao, X. Seismic structure-water-sediment-rock interaction model and its application to immersed tunnel analysis under obliquely incident earthquake. Tunn. Undergr. Space Technol. 2021, 109, 103758. [Google Scholar] [CrossRef]
Figure 1. Experimental equipment: (a) model scale; (b) schematic diagram of the equipment.
Applsci 13 12331 g001
Figure 2. Arrangement angle of the SCP.
Applsci 13 12331 g002
Figure 3. Basic physical properties: (a) gradation curve; (b) shear strength.
Applsci 13 12331 g003
Figure 4. Time history acceleration.
Applsci 13 12331 g004
Figure 5. Bending moment distribution of the piles.
Applsci 13 12331 g005
Figure 6. Friction-displacement curves of the pile–soil interface.
Applsci 13 12331 g006
Figure 7. Plastic hysteresis curves for different θ values of the piled foundation: (a) H = 23 m; (b) H = 32.12 m; (c) H = 44.78 m; (d) Area different of hysteresis curves.
Applsci 13 12331 g007aApplsci 13 12331 g007b
Figure 8. Damping coefficients ratio of the piled foundation.
Applsci 13 12331 g008
Figure 9. Schematic of the numerical model. 1—backfill; 2—immersed tunnel; 3—SCP; 4—gravel cushion; 5—incident wave.
Applsci 13 12331 g009
Figure 10. Result validation: (a) settlement of the foundation; (b) transverse load of the foundation.
Applsci 13 12331 g010
Figure 11. Kinetic energy change: (a) Kinetic energy of the SCP; (b) Kinetic energy of foundation.
Applsci 13 12331 g011
Figure 12. Strain energy at different depths of the piles: (a) θ1 = 45°, H = 44.78 m; (b) θ2 = 60°, H = 44.78 m; (c) θ3 = 90°, H = 44.78 m.
Applsci 13 12331 g012aApplsci 13 12331 g012b
Figure 13. Plastic regions of the pile.
Applsci 13 12331 g013
Table 1. Parameters of sand piles and foundations.
FoundationSand
PropertiesValuePropertyValue
Particle size dEPS (mm)0.3γ1 (d > 0.25 mm)0.23
Volume ratio Vsoil:VEPS8/1γ2 (d = 0.18–0.25 mm)0.7
Permeability (m/d)0.0016γ3 (d < 0.18 mm)0.07
Void ratio e1.07Permeability (m/d)2.592
Moisture content Ws0.216Pile depth L (m)0.2
Table 2. Material constants for modeling.
ParametersMarine ClaySCPImmersedGravel CushionBackfill
Consolidation index, λ0.1130.023
Swelling index, Kr0.050580.0103
Critical state parameter, M0.6681.2
Poisson’s ratio, ν0.360.30.170.450.37
Density, ρ (g/m3)1.8511.7652.450.92
Buoyant density, ρw (g/m3)0.8010.7151.40.850.95
Cohesion, C (kPa)7.40.5
Friction angle φ (o)1530
Young’s modulus, E (kPa)2821.83E*30,00020,000150,000
Permeability, κ (m/s)1.8 × 10−83 × 10−5
Coefficient of lateral pressure0.5770.5
Initial void ratio, e01.0590.72
Degree of saturation11
Note: E* = 0.6σat(σm/σat)λ, where “σat” is the stress of atmospheric and “σm” is the current average principal stress in the soil unit under consideration [46].
Disclaimer/Publisher’s Note: The statements, opinions and data contained in all publications are solely those of the individual author(s) and contributor(s) and not of MDPI and/or the editor(s). MDPI and/or the editor(s) disclaim responsibility for any injury to people or property resulting from any ideas, methods, instructions or products referred to in the content.

