1. Introduction
Irrigation area water measurement technology is a core technology in irrigation area water monitoring and information construction [
1]. Accurate flow measurement can improve the water supply capacity of all levels of channels and reduce water loss, which is the foundation of scientific water allocation and the modern management of irrigation areas [
2,
3]. In recent years, Ningxia has vigorously carried out modernization transformation of irrigation areas and installed over 4000 sets of measurement and control gates, involving more than 20 domestic and foreign manufacturers. The measurement and control gate is a new type of measurement and control facility that integrates flow measurement and control. It adopts the principle of the ultrasonic time difference method for real-time flow measurement. The Ningxia Yellow Diversion Irrigation Area has the largest number of measurement and control gates in China and the measurement accuracy problem is the most prominent in this area. However, due to the large number of manufacturers involved, there are significant differences in the flow measured by different types of equipment. In addition to the Ningxia Yellow Diversion Irrigation Area, other irrigation areas in China also suffer from the problem that the measurement accuracy of the measurement and control gate cannot be calibrated [
4]. There is an urgent need to find a way to calibrate and adjust the flow measured by the measurement box.
The integrated measurement and control gate is designed based on the gate outflow principle. However, the traditional gate overflow formula requires selecting different flow calculation formulas based on different water flow patterns in practical applications. When the flow pattern changes rapidly or when it is difficult to distinguish between different flow patterns, this will lead to a large deviation between the calculated value and the measured value. In order to improve the accuracy of water measurement in irrigation areas, researchers have improved traditional flow calculation formulas or calibrated them for specific channels. Liu et al. [
5] calibrated the water level–flow relationship of the main canal in Heping Irrigation District, Qing’an County, Heilongjiang Province, by using the uniform flow formula of the open channel. They also compared the calculated values with the measured flows and verified the correctness of the calibrated water level–flow relationship curve. Liu et al. [
6] improved the “six-point method” of cross-section flow measurement for large channels in irrigation areas. They obtained the “one-point method” flow formula for the surface flow velocity at the center vertical line, which is applicable to wide shallow trapezoidal channels. The improved formula improves the efficiency of flow measurement and can obtain instantaneous flow. Deng et al. [
7] compared three commonly used river flow calculation methods using the measured flow velocity and flow data from the Feilaixia Hydrological Station. They proposed that adding a velocity observation point in the river section can significantly improve the calculation accuracy of the traditional water level-flow method. Qin et al. [
8] proposed a free outflow flow coefficient formula for the gate hole of Huaidian Gate in Huaihe River Basin on the basis of comparing five different functional forms of gate flow calculation formulas. This calculation formula adopts a segmented function form, which can improve the adaptability and calculation accuracy of traditional flow coefficient calculation formulas. Guan et al. [
9] established a unified flow calibration model for flat gates and verified the effectiveness of the model by using the Flow-3D three-dimensional simulation model and field measurement data of large-scale control gates. The above flow calculation models or flow coefficient calibration models are for specific flow patterns or fixed structure channels, and their scope of application is relatively limited.
In actual irrigation areas, it is difficult to accurately distinguish the various flow patterns of water flow, and corresponding flow calculation formulas cannot be selected in a timely manner, which will result in significant calculation errors. The existing research has shown that neural networks can effectively solve the above problems [
10,
11,
12]. Zhang [
13] investigated the application of different artificial neural networks and their optimization models for flow prediction in channel systems. The research shows that the optimization model of the BP neural network is not affected by the change in flow pattern, and has high flow prediction accuracy and convergence speed, which can be used to calculate the flow of the main channels in the Ganfu Plain irrigation area. Li et al. [
14] established a prediction model of diversion capacity for Weishan sluice based on the GA-RBF neural network. They concluded that the GA-RBF model has the characteristics of high prediction accuracy and strong adaptability. The data samples chosen in the above studies for the training and testing of neural network models are limited, and the generalization ability of the prediction model needs to be verified. Therefore, it is necessary to verify the generalization and prediction accuracy of neural network models through a large amount of experimental data.
In this paper, taking the widely used box culvert-type integrated measurement and control gate in Ningxia Yellow Diversion Irrigation Area as an example, a large number of overflow tests with different gate openings and flow discharges were conducted at Ningxia Tianxianglin Water Conservancy Measurement Facility Inspection Co., Ltd. (located in Wuzhong, China). The gate discharge was predicted using the traditional gate overflow formula and the neural network prediction model. The predictive performance of traditional flow calculation methods and neural network prediction methods, as well as the predictive performance of three different neural network models, were compared. The reasons for errors in different neural network models were analyzed. This study can provide an efficient and fast method for precise control of the integrated measurement and control gate and the prediction of gate flow.
2. Flow Gauging Test of the Integrated Measurement and Control Gate
The irrigation flow gauging test is limited by many factors. For example: the flow gauging test directly affects farmland irrigation; irrigation gates cannot be arbitrarily raised and lowered; the upstream water flow cannot be freely controlled; the water flow pattern needs some time to stabilize after the gate opening change; flow measurement equipment is greatly affected by environmental factors and large measurement errors can lead to low accuracy of the flow calculation model; and there is a lack of a professional testing institution and testing platform for the integrated measurement and control gates. Due to the above reasons, there are few reports of indoor flow gauging tests, and most scholars mainly use numerical simulation to conduct flow gauging tests [
15,
16]. The numerical simulation results need to be verified with actual measurement data, so there is an urgent need to conduct indoor flow gauging tests to provide data support for subsequent research.
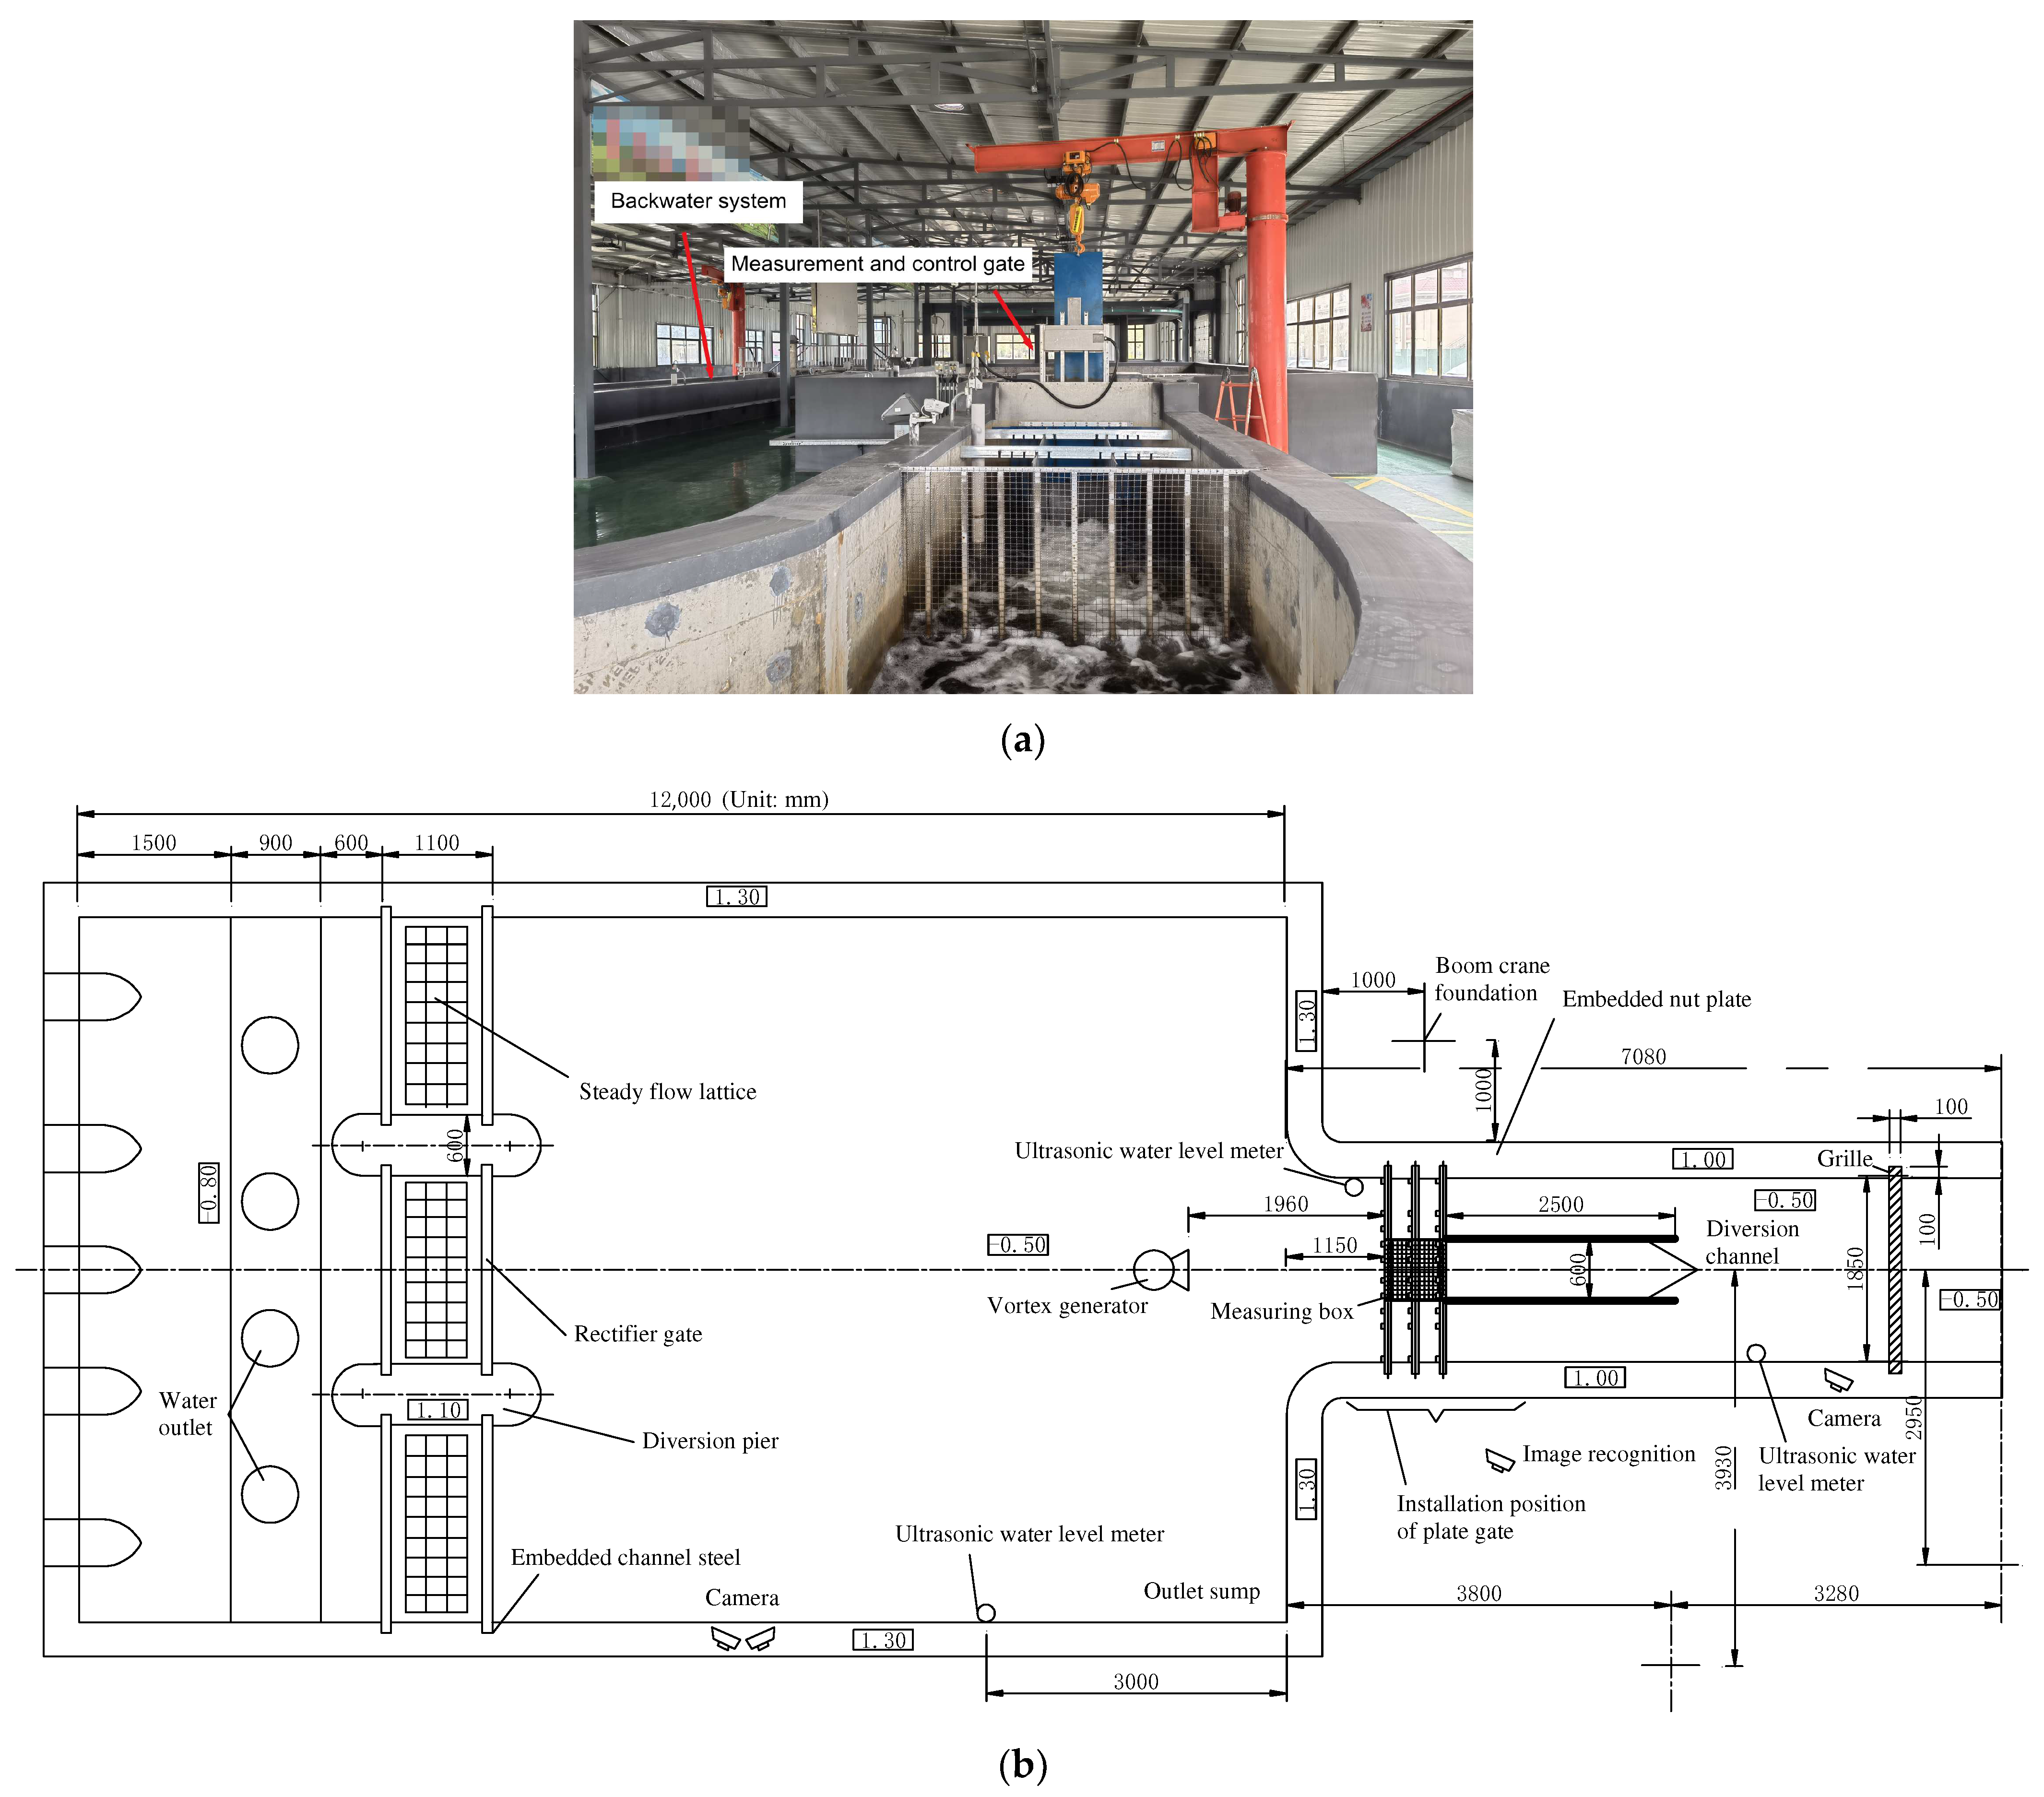
The flow gauging test in this study was conducted at the measurement and control integrated gate testing center of Ningxia Tianxianglin Water Conservancy Measurement Facility Inspection Co., Ltd. This testing center is the only professional testing institution for integrated measurement and control gates in China. The experimental platform consists of three parts: a water supply system, a flow measurement section, and a return water system. The water supply system consists of three sets of water pumps, with a discharge range of 100~2600 m
3/h. Discharge can be controlled by the frequency conversion system, and the flow measurement equipment is the internationally advanced Siemens electromagnetic flow meter. The flow measurement section can be equipped with pool flow disturbance devices, water inlet obstacles, and different types of integrated gates for measurement and control, as well as different sizes of guide channels and energy dissipation grids behind the flow measurement equipment. The return water system consists of water pumps, a rectangular pool, a flow measurement section, return water channels, and a stilling pool. The testing platform for the integrated measurement and control gate is shown in
Figure 1.
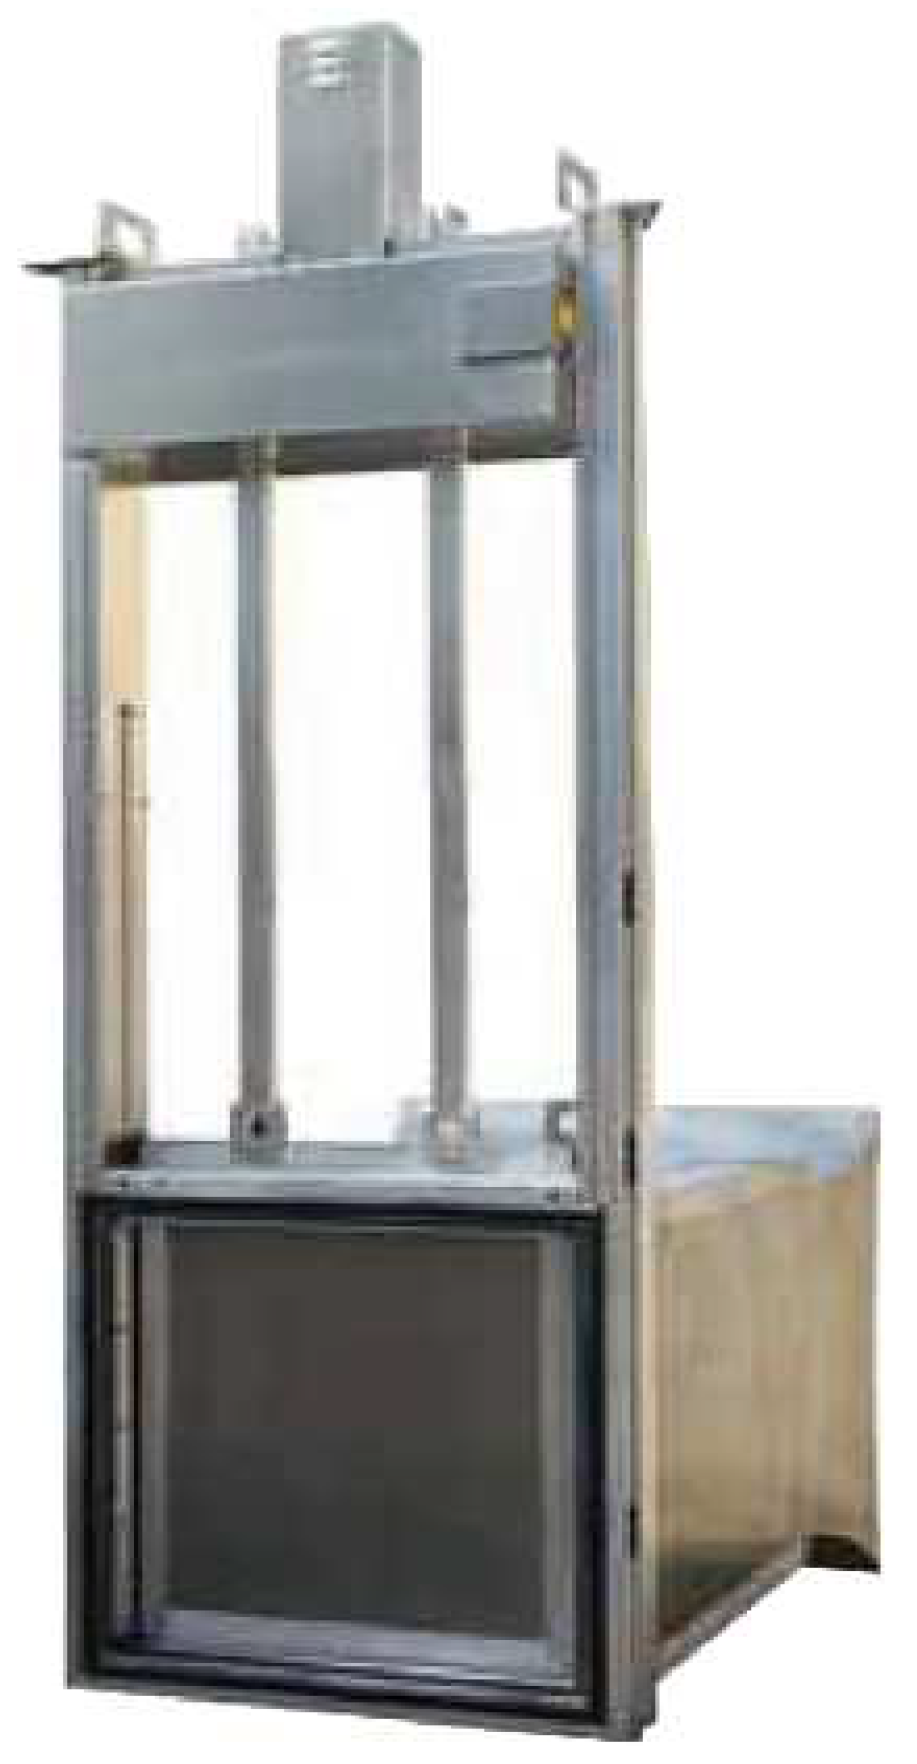
The flow measurement device is a box culvert integrated measurement and control gate flow meter produced by a certain company, as shown in
Figure 2. The opening size of the measurement box is 600 mm × 600 mm, the maximum water retaining height is 1500 mm, the width of the frame is 862 mm, the overall height is 2088 mm, and the length of the measurement box is 707 mm. Based on the 16 pairs of ultrasonic probes arranged in the flow measurement box, the ultrasonic time difference method is used to calculate the layer velocity of water flow in each layer of the flow measurement box, and then the flow speed area method is used to calculate the total discharge. A total of 30 gate flow measurement tests were conducted using the flow measurement device under different operating conditions, with a discharge variation range of 110~2500 m
3/h and a gate opening variation range of 100~590 mm. In order to ensure the accuracy of the data and the stability of the water flow through the gate and to eliminate the measurement error caused by changes in the gate opening, each gate opening and given discharge were stabilized for 30 min, and 15 sets of data were continuously obtained. A total of 450 data sets were obtained as training samples for all working conditions. Subsequently, nine sets of gate overflow tests were conducted within the same range of flow and gate opening variations, and a total of 135 sets of data were obtained as prediction samples.
4. Comparative Analysis of the Prediction Results
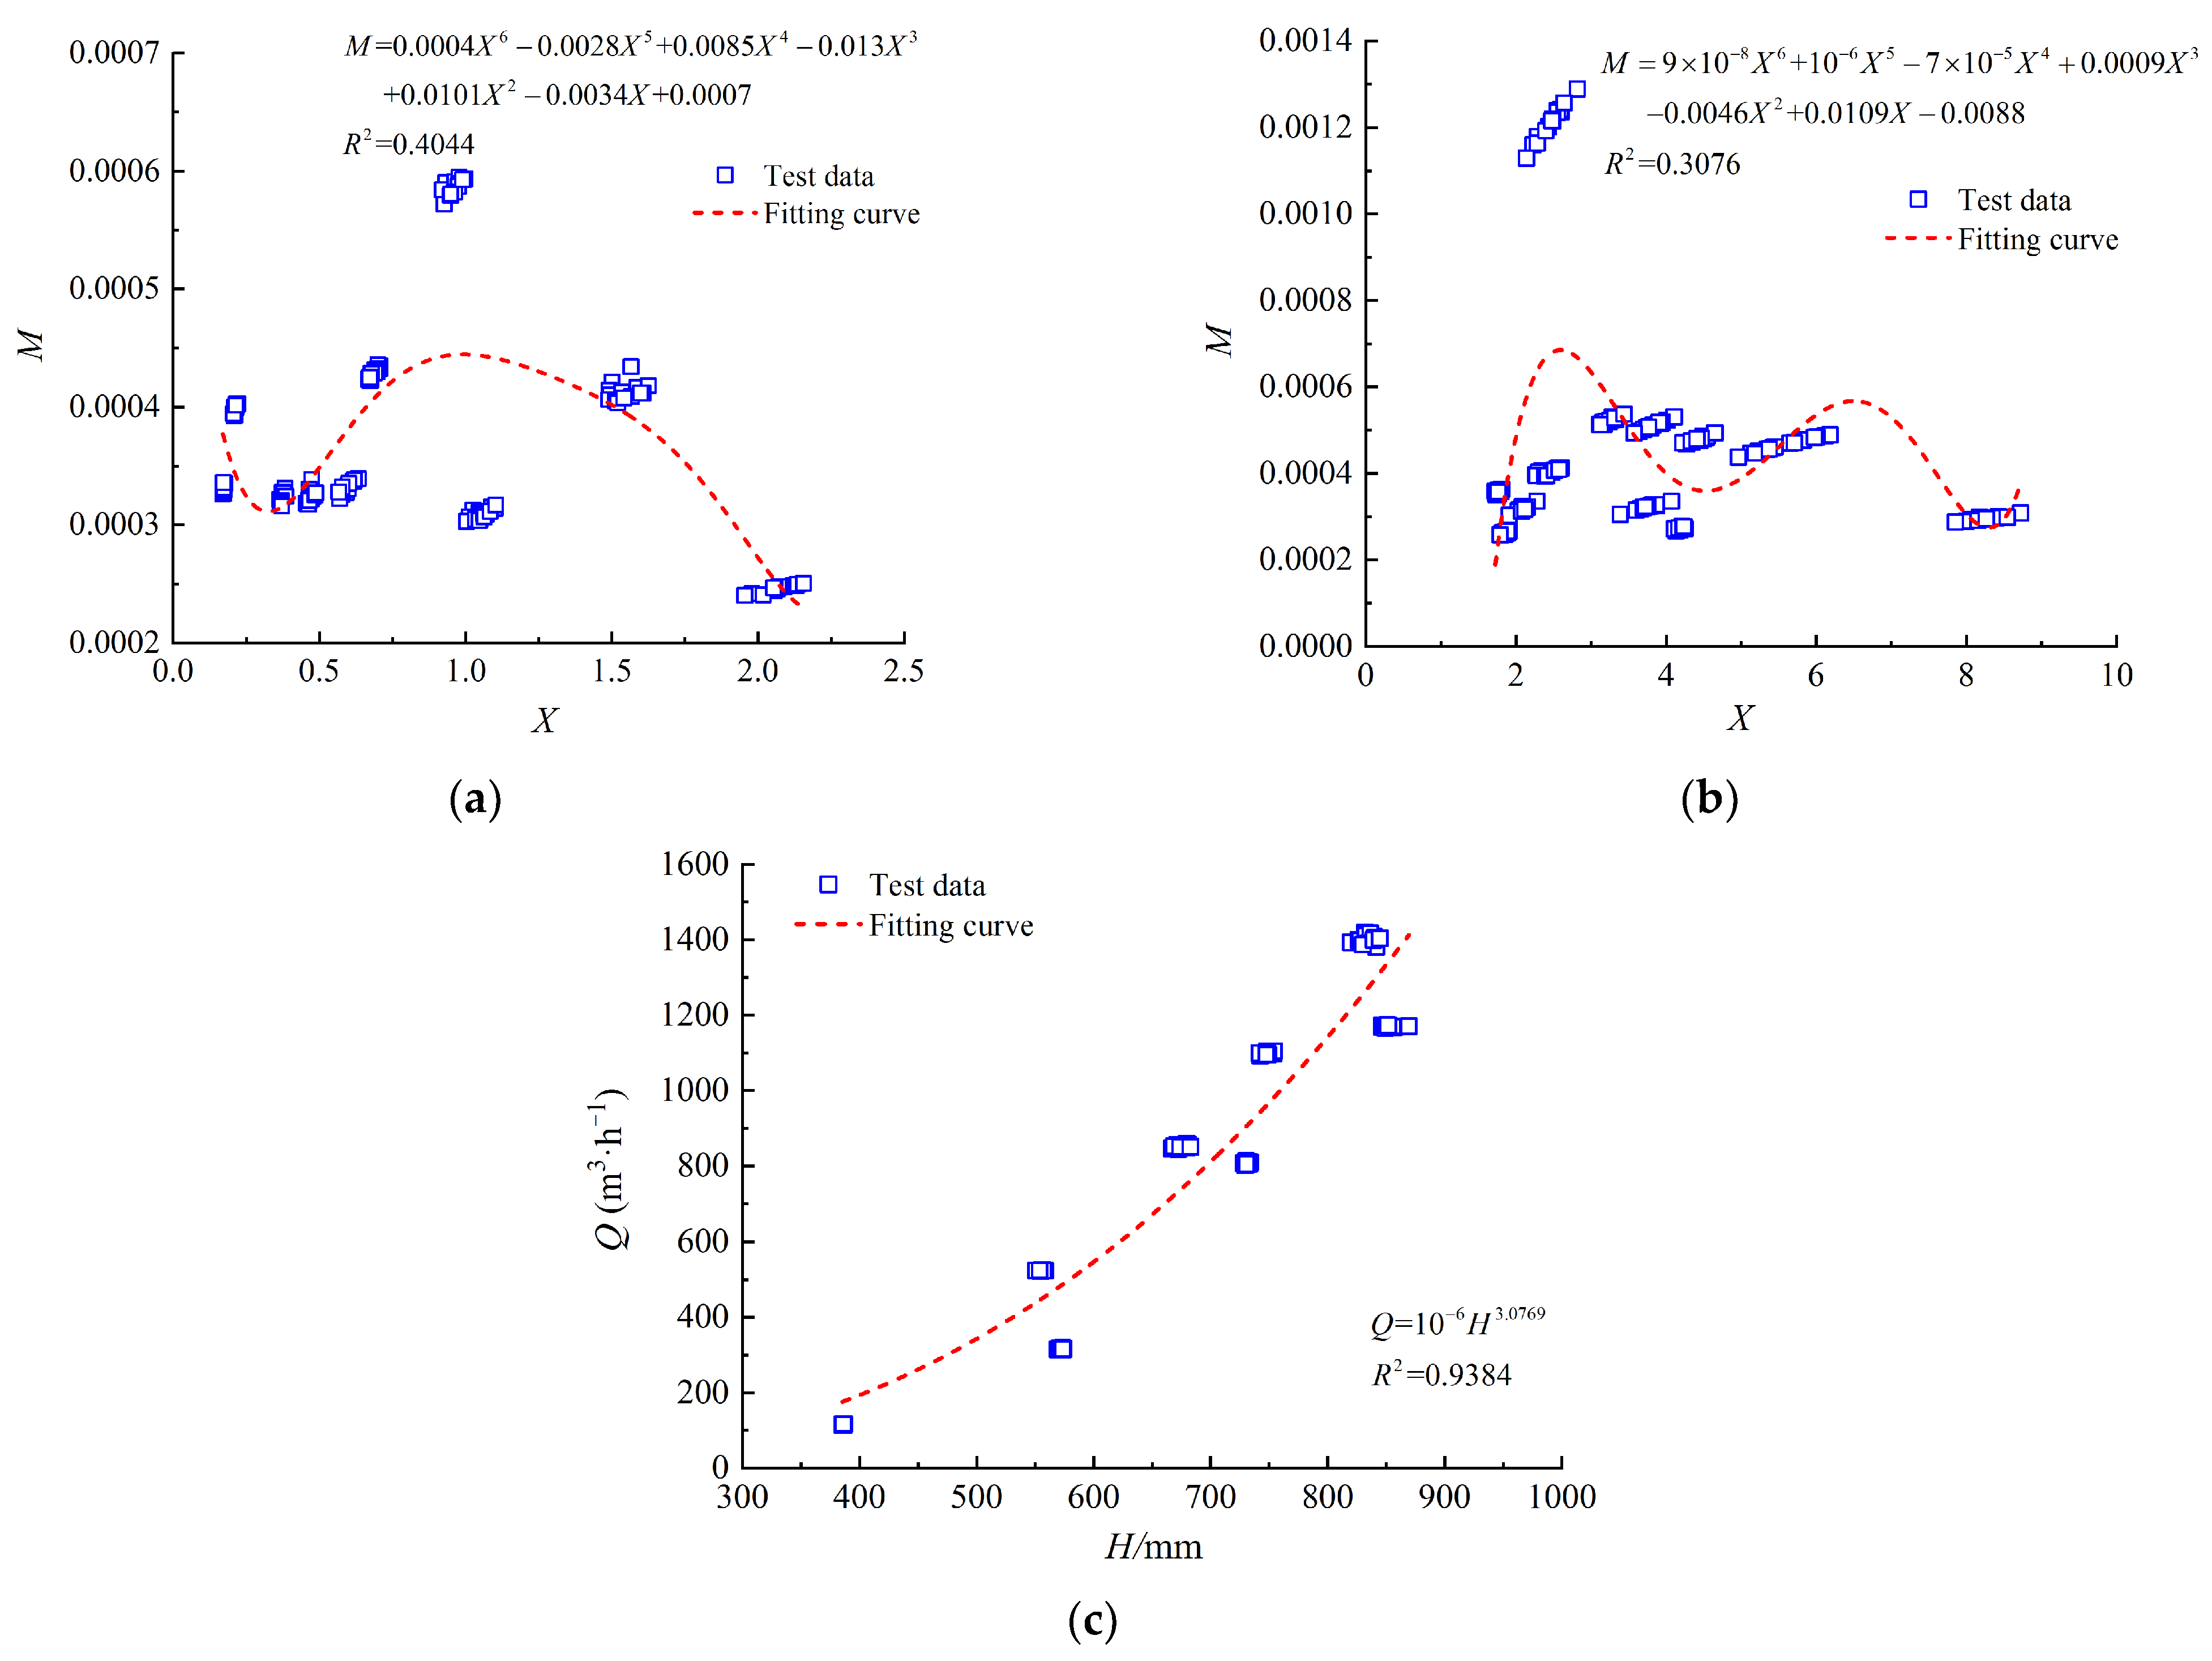
The flow prediction results of the traditional water measurement method, the BP neural network model, the GA-BP neural network model, and the PSO-BP neural network model under different flow patterns are shown in
Figure 5. Under the condition of free outflow with gate control, the traditional water measurement method has a large deviation from the predicted samples 16 to 30, and the rest of the sample points are closer to the measured flow. This is due to the large deviation between the fitted flow coefficient curve and the given
M value at
X = 1.0. The predicted flows of the BP model, GA-BP model, and PSO-BP model are all near the measured flow under this flow pattern. Under the condition of submerged outflow with gate control, due to the fact that some of the given
M values are in a discrete state, the fitting accuracy of the flow coefficient curve is poor. Therefore, the predicted flows of the traditional water measurement method seriously deviated from the measured flows. The predicted flows of the three neural network models are all close to the measured flows under this flow pattern. Under the weir flow condition, although the fitting degree of the flow coefficient curve is good, the predicted flows of the traditional water measurement method are still significantly smaller than the measured flows. The predicted flows of the three neural network models show fluctuating changes in the prediction samples from 1 to 15 and leveling off from 16 to 30. Overall, the predicted flows of the three neural network models have a small deviation from the measured flows under this flow pattern.
Figure 5d shows the flow prediction results of the BP model, GA-BP model, and PSO-BP model in the case of a combination of the three flow patterns. It can be seen that the predicted flows of the three neural network models can well fit the trend of the measured flows and have good self-adaptability. In addition, the predicted flows of the three neural network models vary near the measured flows, and there are no obvious discrete predicted sample points. In summary, the neural network prediction model has a much higher predictive ability for the flows under different flow patterns than the traditional water measurement method and has a self-adaptive ability for different flow patterns.
The relative error can reflect the credibility of the predicted results, which can be calculated by the following equation:
where
Qi is the measured flow and
is the predicted flow.
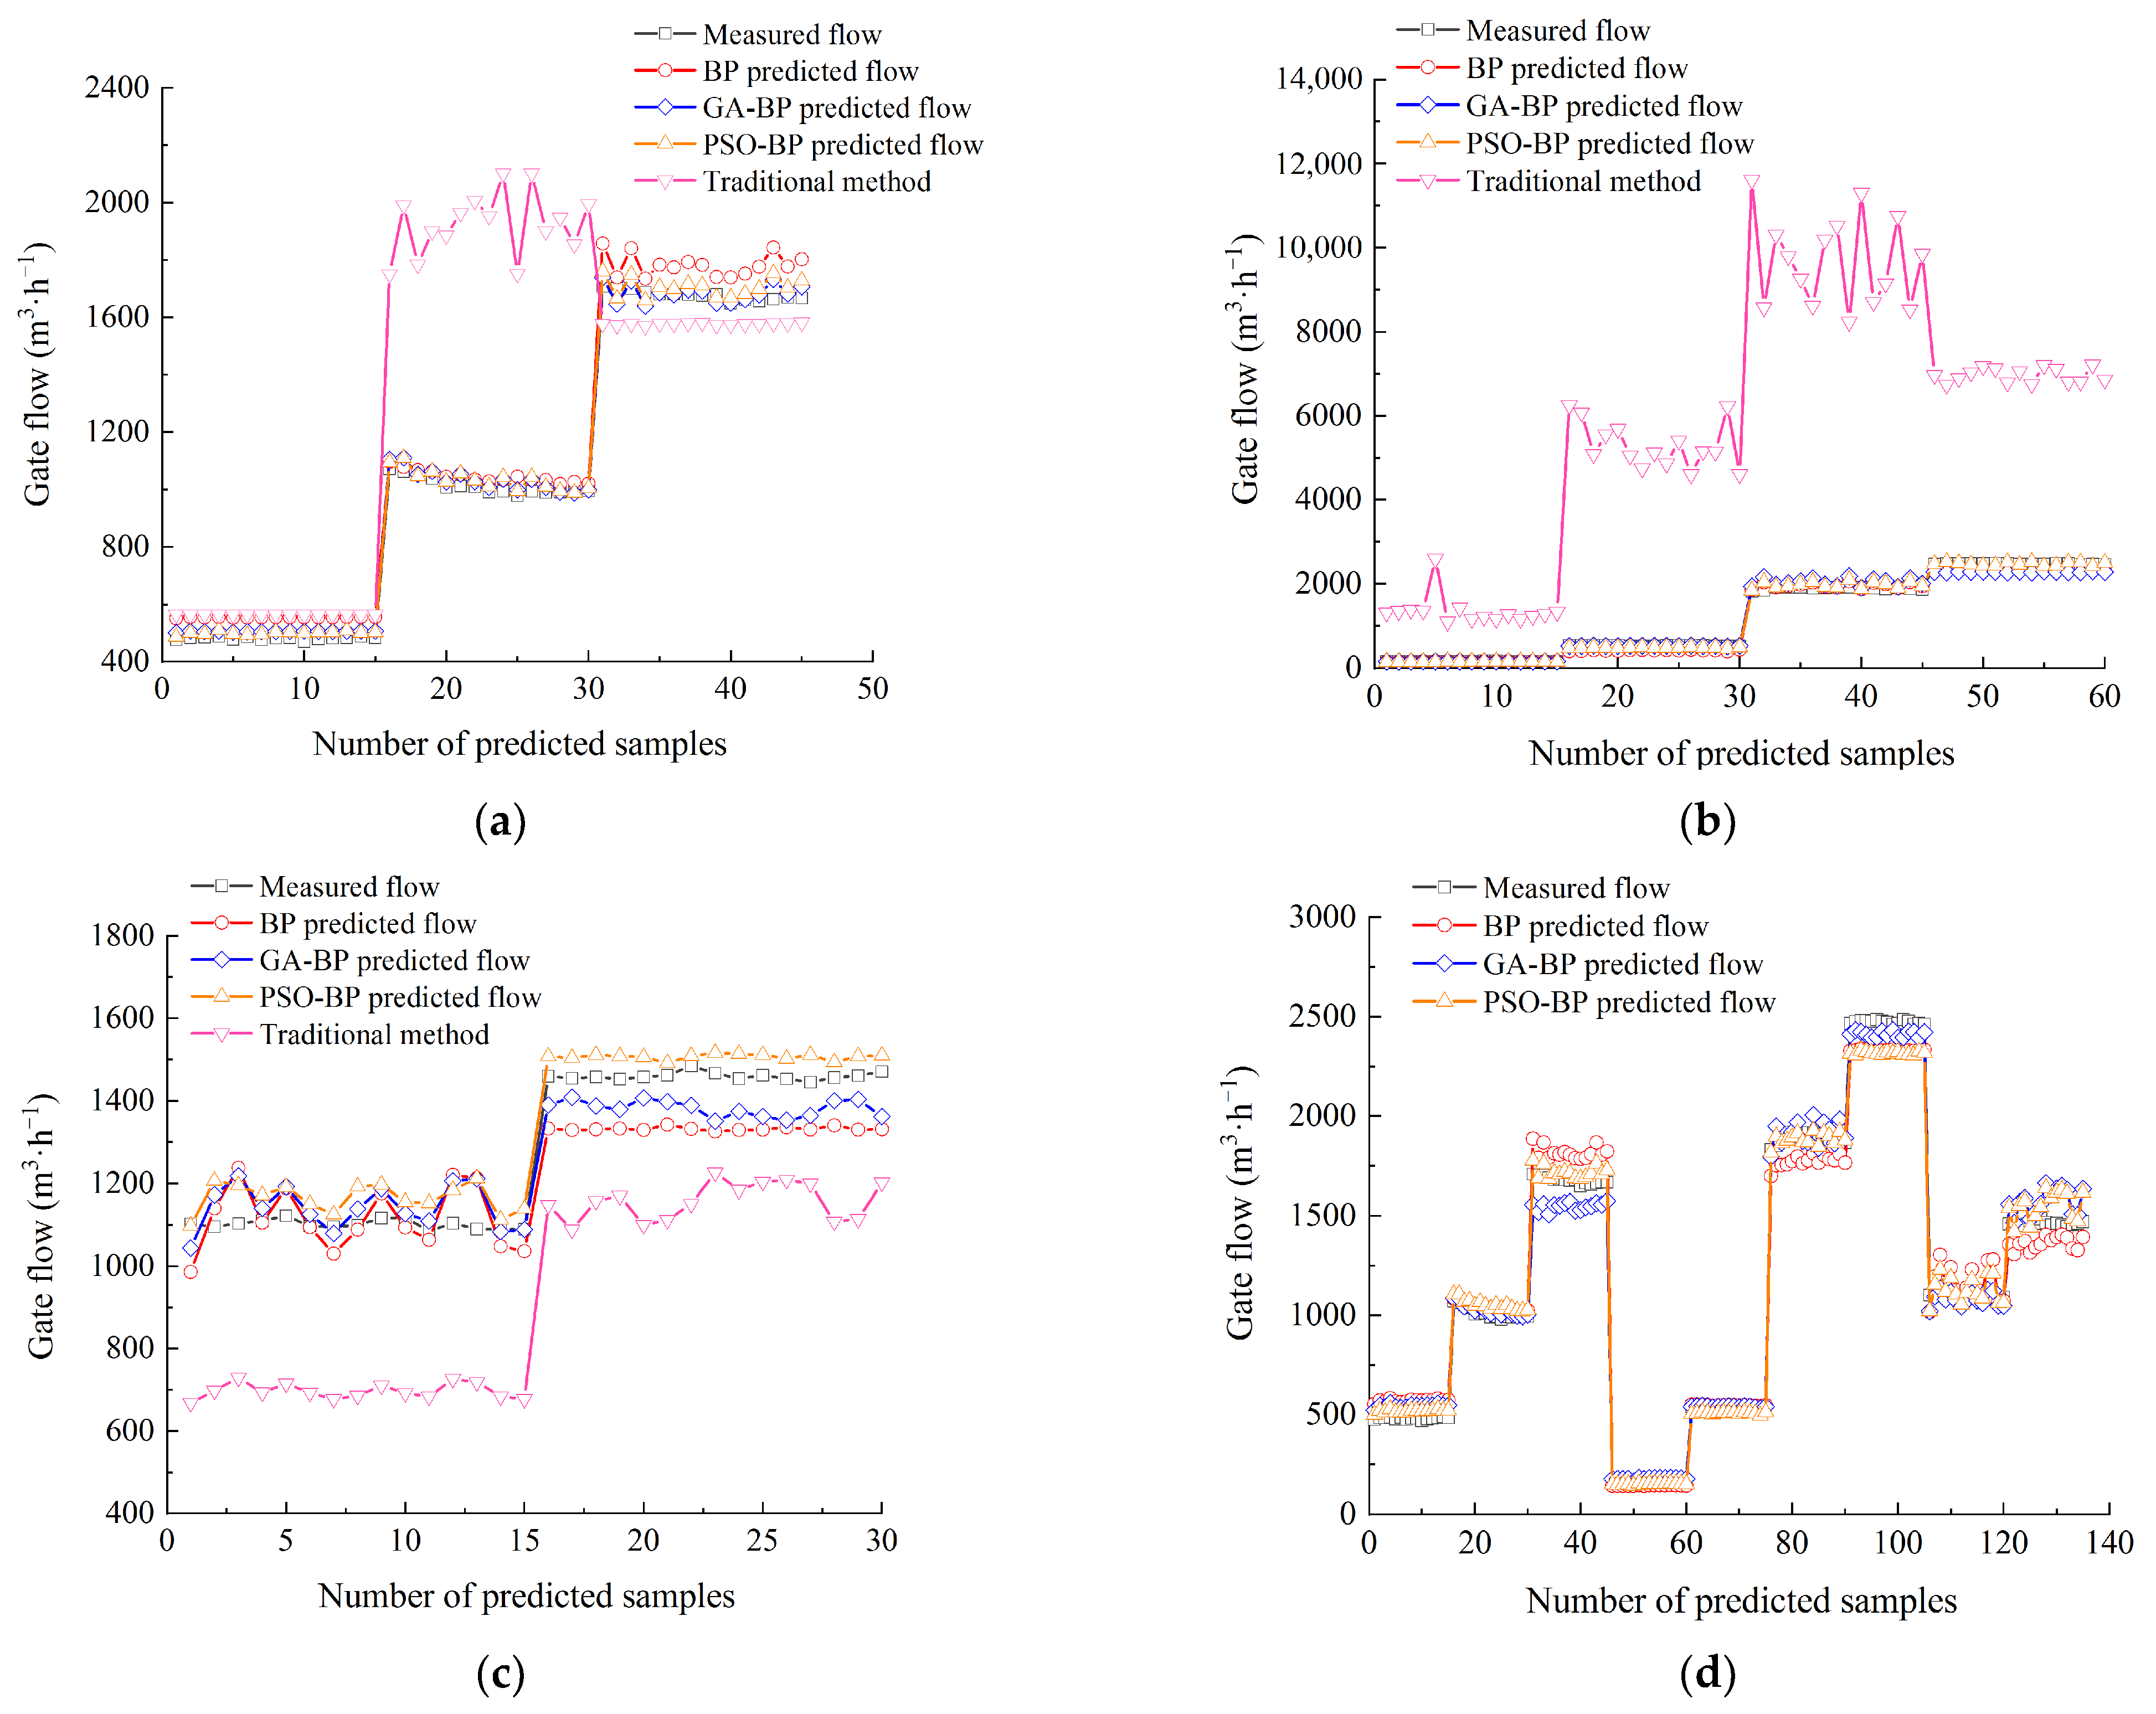
The changes in the relative errors between the predicted results of the BP, GA-BP, and PSO-BP models and the measured results are shown in
Figure 6. In
Figure 6, the relative error range of the traditional method is too large compared to the neural network prediction method, so we labeled the curve as an orange dash, and we show its axes on the right side. As shown in
Figure 6, the prediction accuracy of the traditional methods is too low and cannot be used for flow prediction under combined flow patterns. The maximum error reaches 111.36%, 1492.74%, and 39.43% for FOG, SOG, and WF flow patterns, respectively. Therefore, we focused on analyzing the prediction accuracy of three neural network models. Under the condition of the free outflow with gate control, the relative errors of the GA-BP and PSO-BP models fluctuate within the ±5% range, and the relative error of the BP model fluctuates within the range of 1.46% to 18.22%. Under the condition of submerged outflow with gate control, the relative errors of the GA-BP and PSO-BP models become larger. The error range of the GA-BP model is −8.5~16.5%, the error range of the PSO-BP model is −12.4~10.1%, and the error range of the BP model is −25~10%. Under the weir flow condition, the error ranges of the BP, GA-BP, and PSO-BP models are −10.6~12.1%, −7.9~11.1%, and −0.4~11.2%, respectively. In the case of a combination of the three flow patterns, the error ranges of the GA-BP model and the PSO-BP model are relatively close to each other, ranging from −10.7% to 15.7% and −11.4% to 12.2%, respectively. The error range of the BP model is relatively large, ranging from −13.9% to 21.4%. In summary, both the GA-BP model and the PSO-BP model have higher prediction accuracy than the BP model. Both genetic algorithms and particle swarm algorithms can be used to optimize the initial weights and thresholds of a BP neural network model.
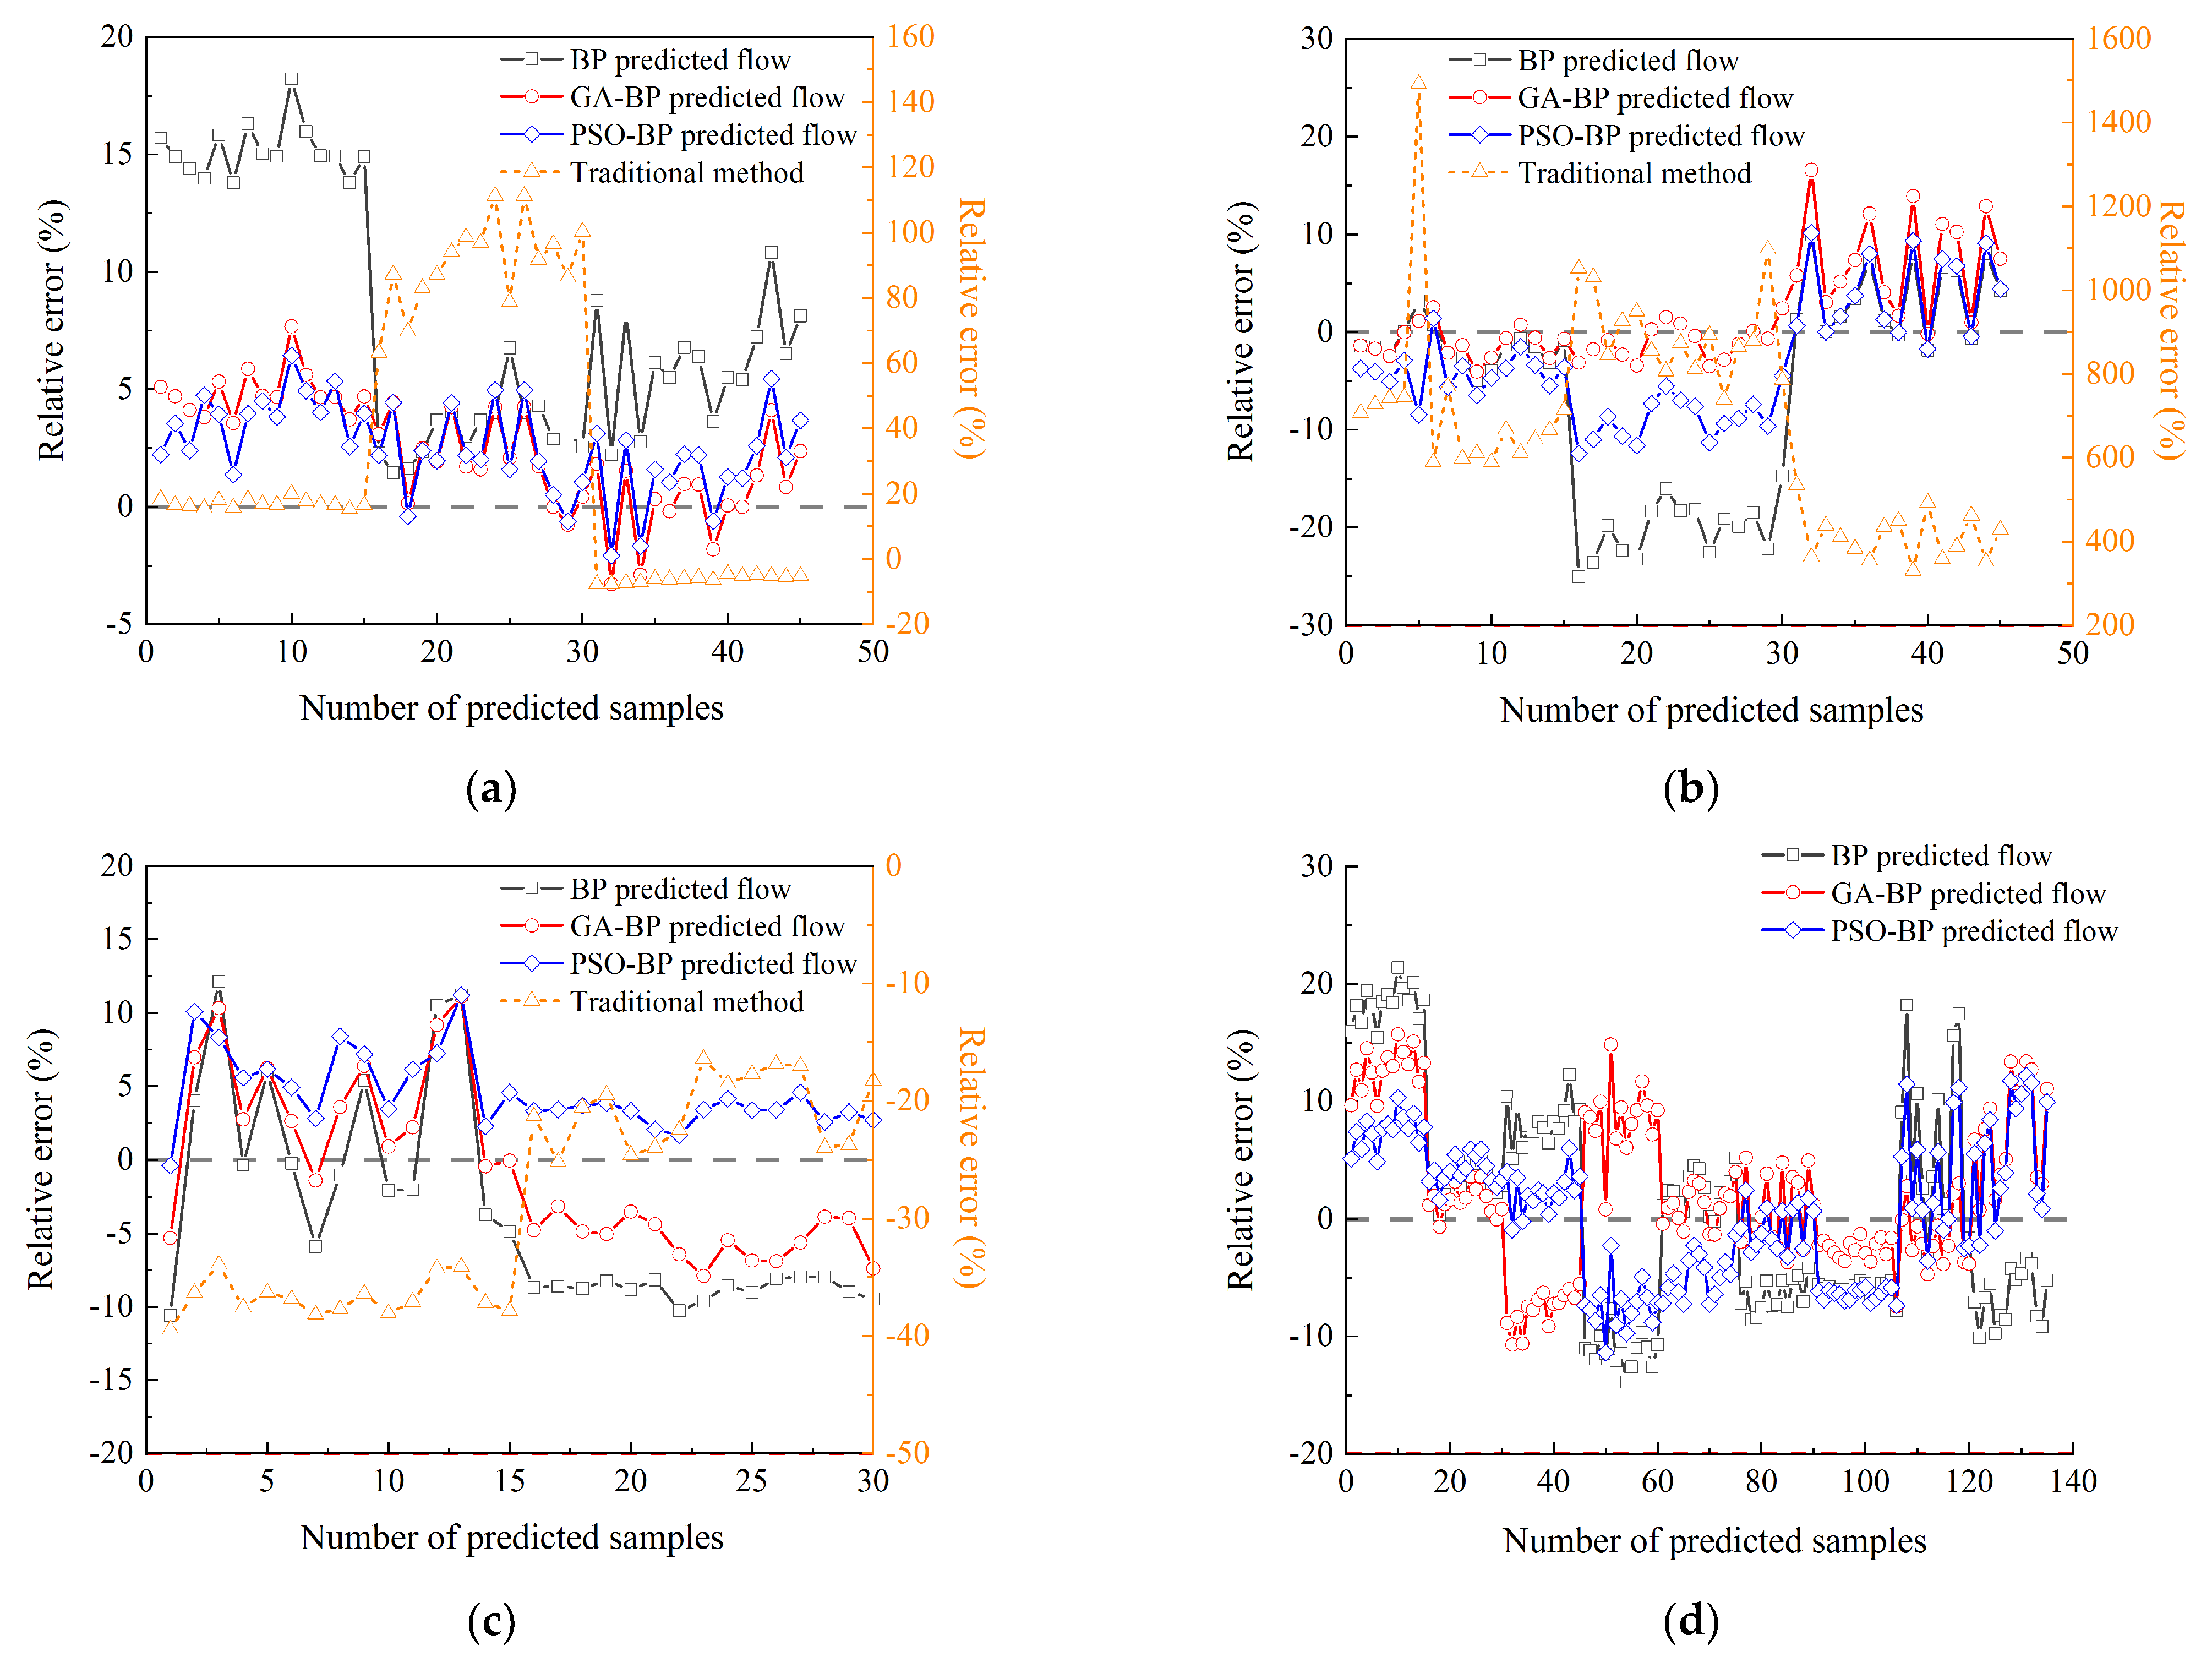
To further understand the error distributions of the three models under different flow patterns, the error distribution statistics of the three models are given in
Figure 7. Under conditions of free outflow with gate control and submerged outflow with gate control, the error distributions of the GA-BP and PSO-BP models are characterized by an approximately normal distribution, while the BP model has more outliers with relative errors of 15% and above. Under the weir flow condition, the BP model has 14 samples distributed at 10% and above. The GA-BP and PSO-BP models do not have outliers with large relative errors, but the PSO-BP model has a more concentrated distribution of errors. In the case of a combination of the three flow patterns, when the relative error is within −10~10%, the number of samples predicted by the GA-BP and PSO-BP models is significantly greater than that of the BP model. The BP model has more outliers with relative errors of 15% and above. In summary, the GA algorithm and PSO algorithm improve the error distribution of the BP model, narrow the error distribution range of the BP model, and stabilize more samples within an acceptable range. The PSO algorithm has a better optimization effect on the error distribution of the BP model than the GA algorithm, making the error distribution more concentrated.
For the flow predicted by different neural network models, the coefficient of determination
R2 and the mean absolute percentage error (MAPE) were used to evaluate the flow prediction accuracy, which can be expressed as in Equations (8) and (9). A higher
R2 indicates a better regression of the model and a smaller value of MAPE indicates a higher prediction accuracy [
21]. The evaluation indicators for the prediction results of the three methods are shown in
Table 2.
where
n is the number of test samples and
is the average value of the measured flow.
From the perspective of the regression effect, the
R2 of the GA-BP and PSO-BP models is higher than that of the BP model under different flow patterns. The
R2 of the GA-BP and the PSO-BP models is relatively close under the conditions of free flow with gate control and the combined flow patterns. The
R2 of the PSO-BP model is higher than that of the GA-BP model under the conditions of submerged outflow with gate control and weir flow. From the perspective of prediction accuracy, overall, the MAPE and maximum relative error of the PSO-BP model are lower than those of the GA-BP model, and the BP model has the largest MAPE and maximum relative error. In summary, the particle swarm algorithm is slightly better than the genetic algorithm in optimizing the BP neural network for gate flow prediction. However, since the prediction results of the GA-BP and PSO-BP models are affected by their respective parameter settings, which are quite different, it is impossible to accurately evaluate the optimization effects of the particle swarm optimization and genetic algorithm on the BP neural network. From the evaluation indicators of the prediction results, the GA-BP and PSO-BP models significantly improve the prediction accuracy of the BP model and enhance the generalization ability of the BP model, which can be used for the flow prediction of dry and branch canals in the irrigation areas. From
Table 2, it can be seen that the relevant statistical indicators of traditional methods are significantly inferior to those of neural network models, which reflects the superiority of the model proposed in this paper.
The optimization effect of particle swarm optimization is better than that of the genetic algorithm. The main reason is that the two algorithms have different principles: (1) the crossover probability and mutation probability in the GA-BP model are fixed. The genetic algorithm requires different search capabilities in the early global search stage and the later local search stage. Fixed parameter settings cannot self-adaptively meet the search capability requirements of genetic algorithms at different times; (2) the crossover and mutation operations of genetic algorithms in the population evolution process will randomly introduce new individuals. The quality of new individuals will directly affect the convergence speed of the algorithm, and this process is blind. Excellent individuals will accelerate the population’s movement towards the optimal position during the evolutionary process, while undesirable individuals will slow down their movement speed; and (3) the particle swarm of the particle swarm algorithm will follow the optimal particle movement under global conditions. The entire population of the genetic algorithm moves towards the optimal position during the evolution process. Therefore, the PSO algorithm has a faster convergence speed than the GA algorithm.
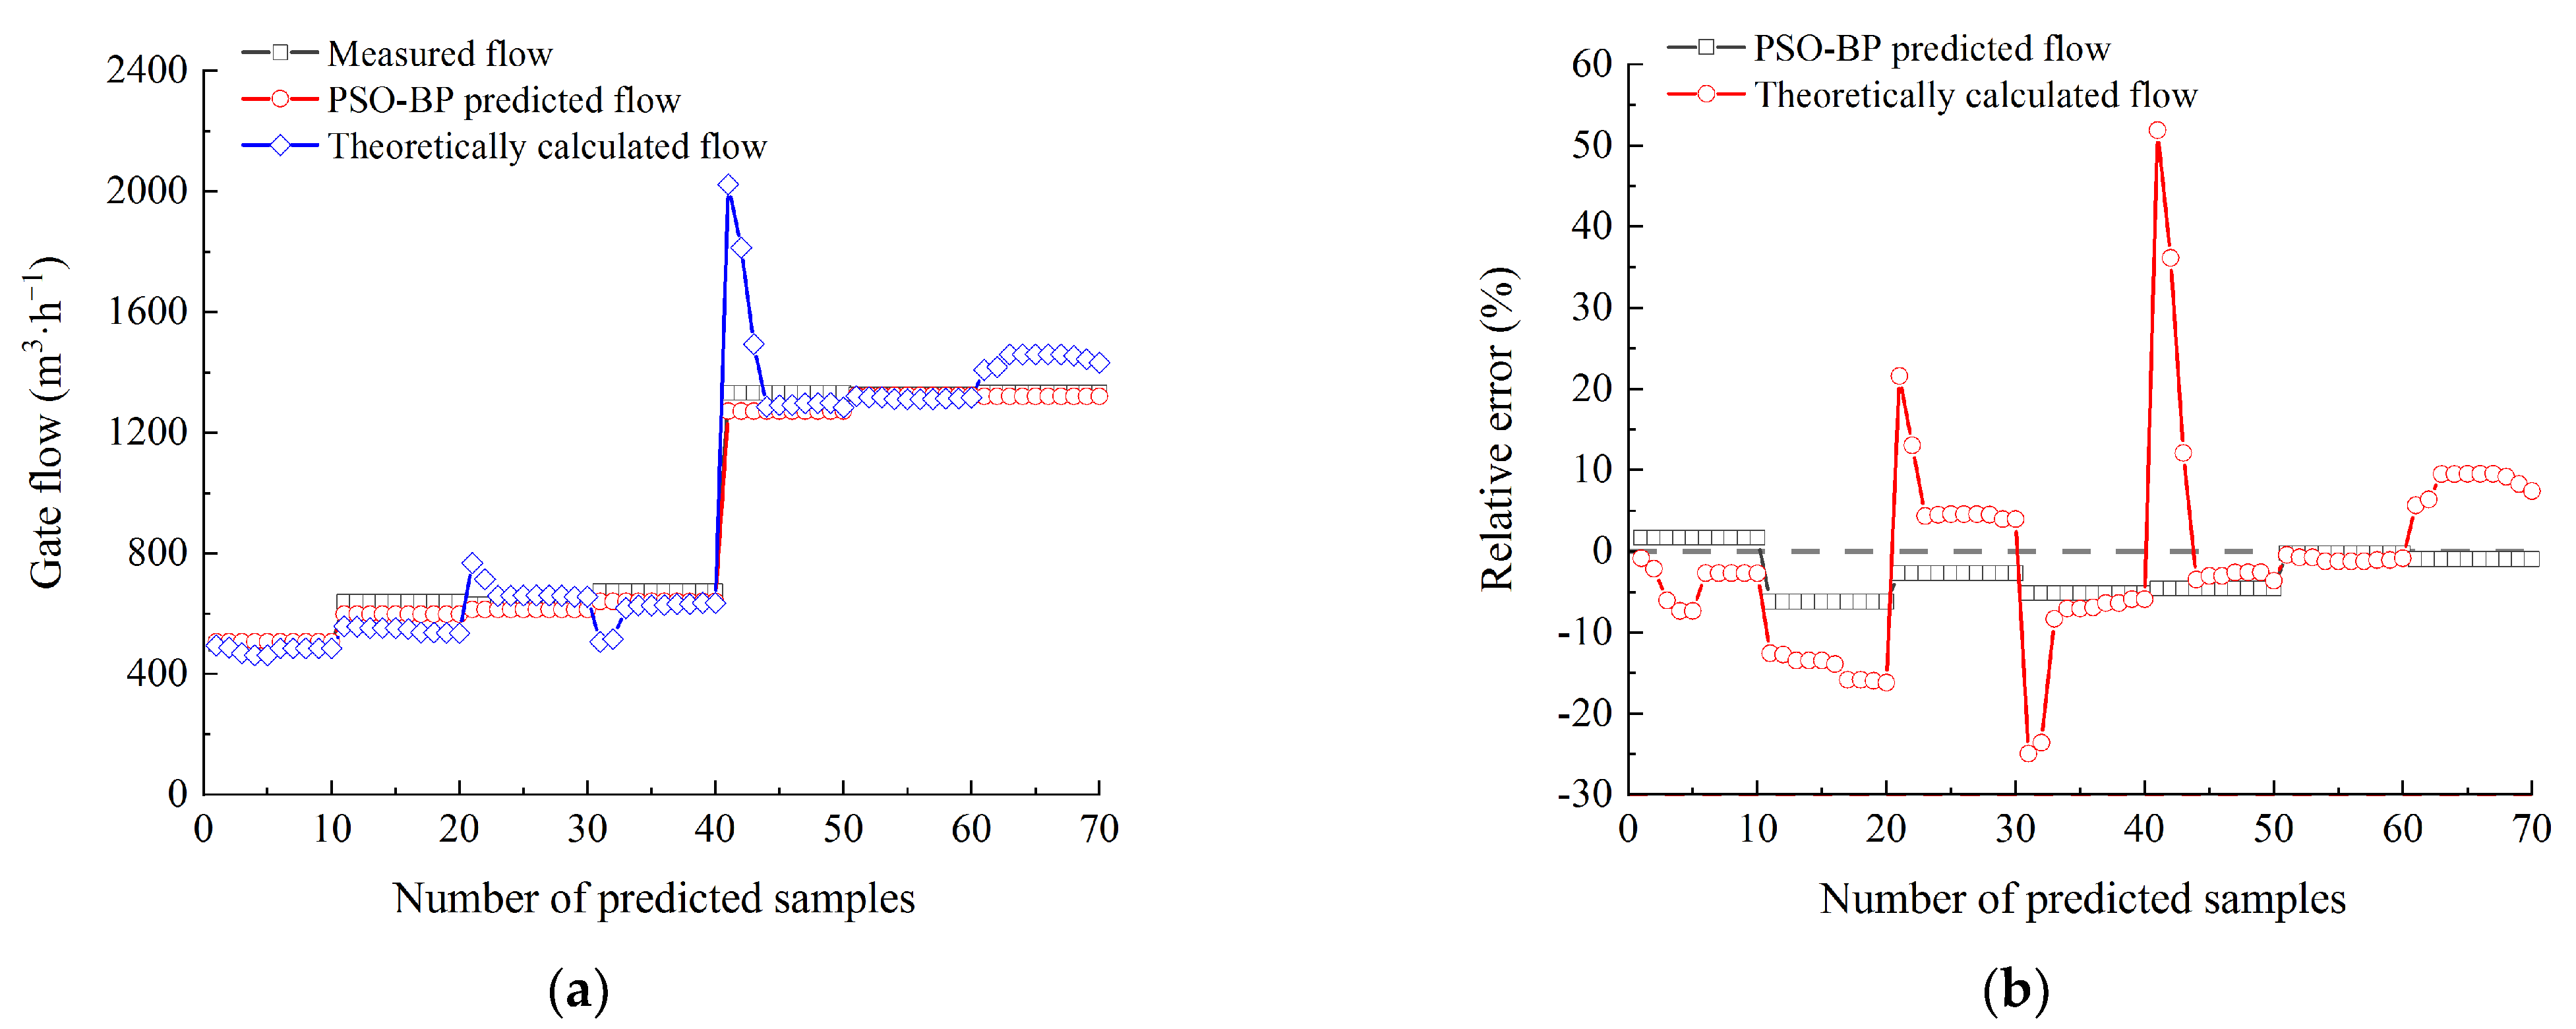
5. Application Analysis of the Prediction Model
To verify the calibration effect of the neural network model on the layer velocity of the measurement box of the integrated measurement and control gate, the flow measurement device was used to conduct gate flow measurement tests again under seven working conditions. The variation range of flow is 400~1500 m
3/h, and the variation range of gate opening change is 100~400 mm. The 10 sets of data were continuously obtained for each working condition, and a total of 70 sets of data were obtained as prediction samples. The flow of the measurement box was predicted using a trained PSO-BP neural network model. The PSO-BP model predicted the flow, the theoretically calculated flow from the flow velocity of each layer in the measurement box, and the measured flow were compared, and their relative errors with the measured flow rate were calculated, as shown in
Figure 8. There are a total of 10 layers of flow velocity inside the measurement box. Based on the size of the measurement box, the flow calculation formula inside the measurement box can be described as:
where
Qc is the theoretically calculated flow from the flow velocity of each layer in the measurement box and
v1~
v10 are the flow velocities of the first to tenth layers in the measurement box, respectively.
It can be seen that the PSO-BP model’s predicted flow is in good agreement with the measured flow. The relative error of the PSO-BP model is less than 10%, and there are no abnormal points with large relative errors. The theoretically calculated flow is generally consistent with the measured flow, but there are a few outliers with large deviation values, the maximum relative error reaches 50%. This may be due to the measurement error caused by the inability of individual probes in the measurement box to accurately obtain the path flow velocity during the transition of the water flow pattern. The outliers should be eliminated or corrected in the background when performing flow calculations for the entire measurement box.
6. Discussion
The measurement and control gate, as a new type of measurement and control equipment, calculates the flow rate through ultrasonic probes arranged in layers inside the measurement box. However, when the flow pattern is turbulent or the flow pattern is rapidly changing, the individual probe will not be able to accurately obtain the path flow velocity, and the flow velocity area method will produce large errors when used for flow calculation. Due to the lack of a professional platform for the detection and testing of measurement and control gates, few studies have been carried out to investigate the calibration method for flow in the measurement box of the measurement and control gate [
22,
23]. It is very important to calibrate the accuracy of the path flow velocity measured by the probe inside the measurement box during the development and debugging process of the measurement and control gate. The research in this paper indicates that using neural network models to predict flow and thus calibrate the path flow velocity inside the measurement box is a feasible solution.
Neural network models have been widely used in radial gates and slice gates in channels [
24,
25], but no studies have reported the application of neural network models in measurement and control gates. Since the BP, GA-BP, and PSO-BP models are more widely used neural network models, these three models were chosen in this study to carry out an exploratory preliminary study, and other neural network models will be chosen in the subsequent study for the application of measurement and control gates. The robustness and reliability of the optimized neural network prediction models are assured by comparing them with a large amount of measured data. Both PSO and GA algorithms have good applicability and acceptable computational efficiency. However, the parameter settings of the two algorithms have a significant impact on the optimization effect. The parameters used in this article are all conventional settings, which have shown good performance in other fields, but there is still significant room for improvement in gate flow prediction.
The neural network prediction model established in this paper also has some shortcomings. The flow measurement tests were conducted under undisturbed conditions, without considering working conditions such as obstruction, disturbance in front of the gate, and the addition of diversion channels. In the later stage, flow measurement experiments will be conducted under the influence of different external factors. The increases in the input variables of the neural network can improve the generalization ability, prediction accuracy, and applicability of the prediction model. Further efforts are also needed on the system reliability evaluations of measurement and control gates produced by different manufacturers, which can more realistically evaluate the real situation in the management of agricultural irrigation.


