
Experimental Study on Shear Creep and Long-Term Strength of Clay-Type Muddy Interlayer

Abstract
:1. Introduction
2. Methodology
2.1. Materials
2.2. Methods
2.2.1. Preparation of Samples
- (1)
- The samples were crushed indoors and passed through a sieve with a 2 mm mesh to separate the finer particles below 2 mm, which were used for the remolded samples.
- (2)
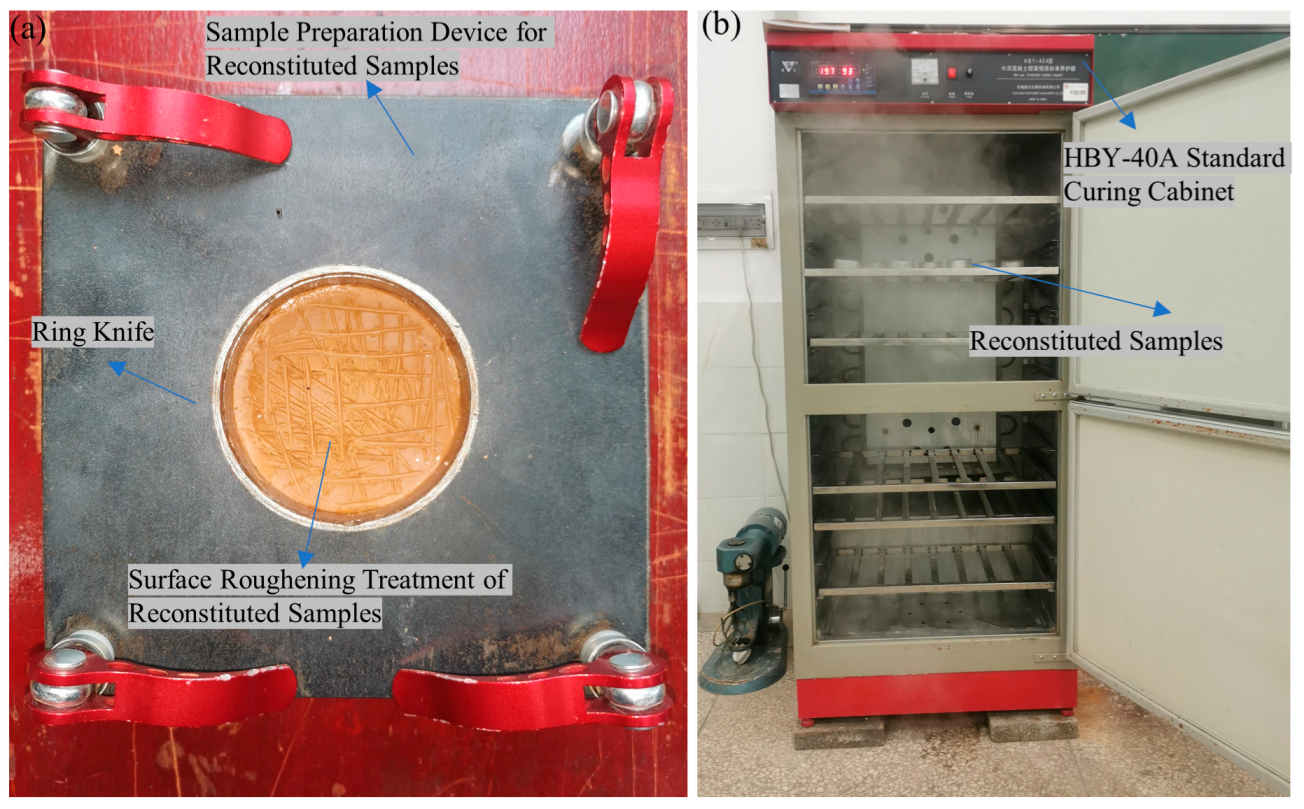
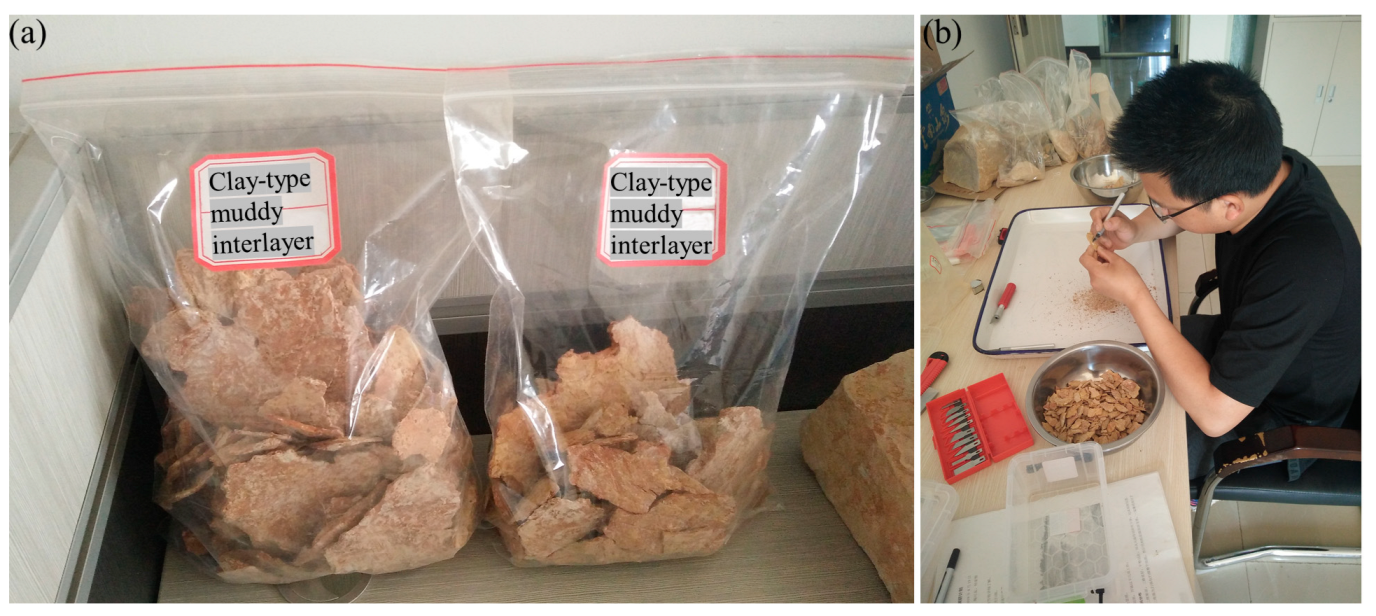
- The finer particles were repeatedly mixed and air-dried to achieve the target moisture content. Based on the specified moisture content and dry density, a certain mass of moist soil was weighed and evenly distributed in 3 layers, which were then compacted into sample molds with roughened layer interfaces (as shown in Figure 3a).
- (3)
- The resulting samples were solid cylindrical specimens with a diameter of 61.8 mm and a height of 20 mm. The moisture content was determined to be 20.39% using the “oven-drying method,” and the dry density was measured as 1.93 g/cm3 using the “ring knife method.”
- (4)
- The samples were wrapped with multiple layers of plastic film and tape, then allowed to stand in the HBY-40A Standard Curing Cabinet for 72 h (as depicted in Figure 3b). A total of 10 samples were prepared, including 2 backup samples.
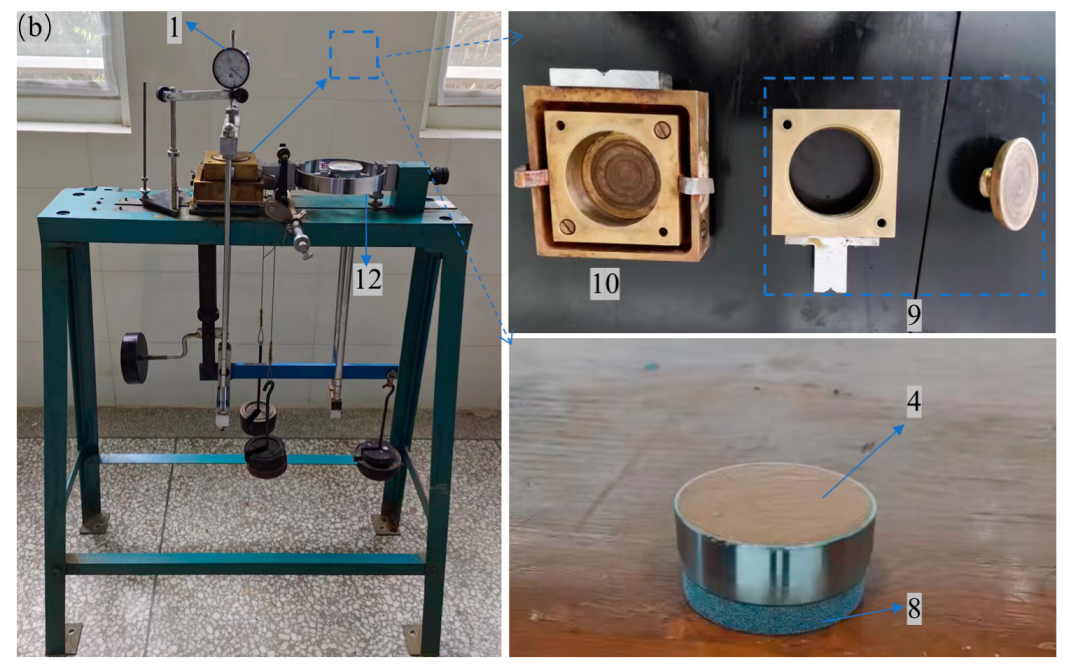
2.2.2. Test Equipment
2.2.3. Test Procedure and Test Plan
- (1)
- The fast shear test was carried out on the samples, and at different consolidation pressures (100 kPa, 200 kPa, 300 kPa, 400 kPa), shear at a speed of 0.8 mm/min (12 rpm) and measure the shear strength () of the muddy interlayer under all levels of consolidation pressure.
- (2)
- In the direct shear-creep test, the application of normal stress (100 kPa, 200 kPa, 300 kPa, 400 kPa) is carried out first, followed by consolidation for 24 h. Vertical deformation is then monitored during this period.
- (3)
- Based on the formula = /n (where n is the loading series, which is taken as 5~7, and is the shear strength under different consolidation pressures), the shear stress at each level of the direct shear-creep test is determined, combined with the weight of the shear stress weight. The shear stress of each stage is properly adjusted, and creep failure of the rock is ensured when the last level of shear stress is applied, and the loading scheme of this direct shear-creep test is obtained (Table 1).
- (4)
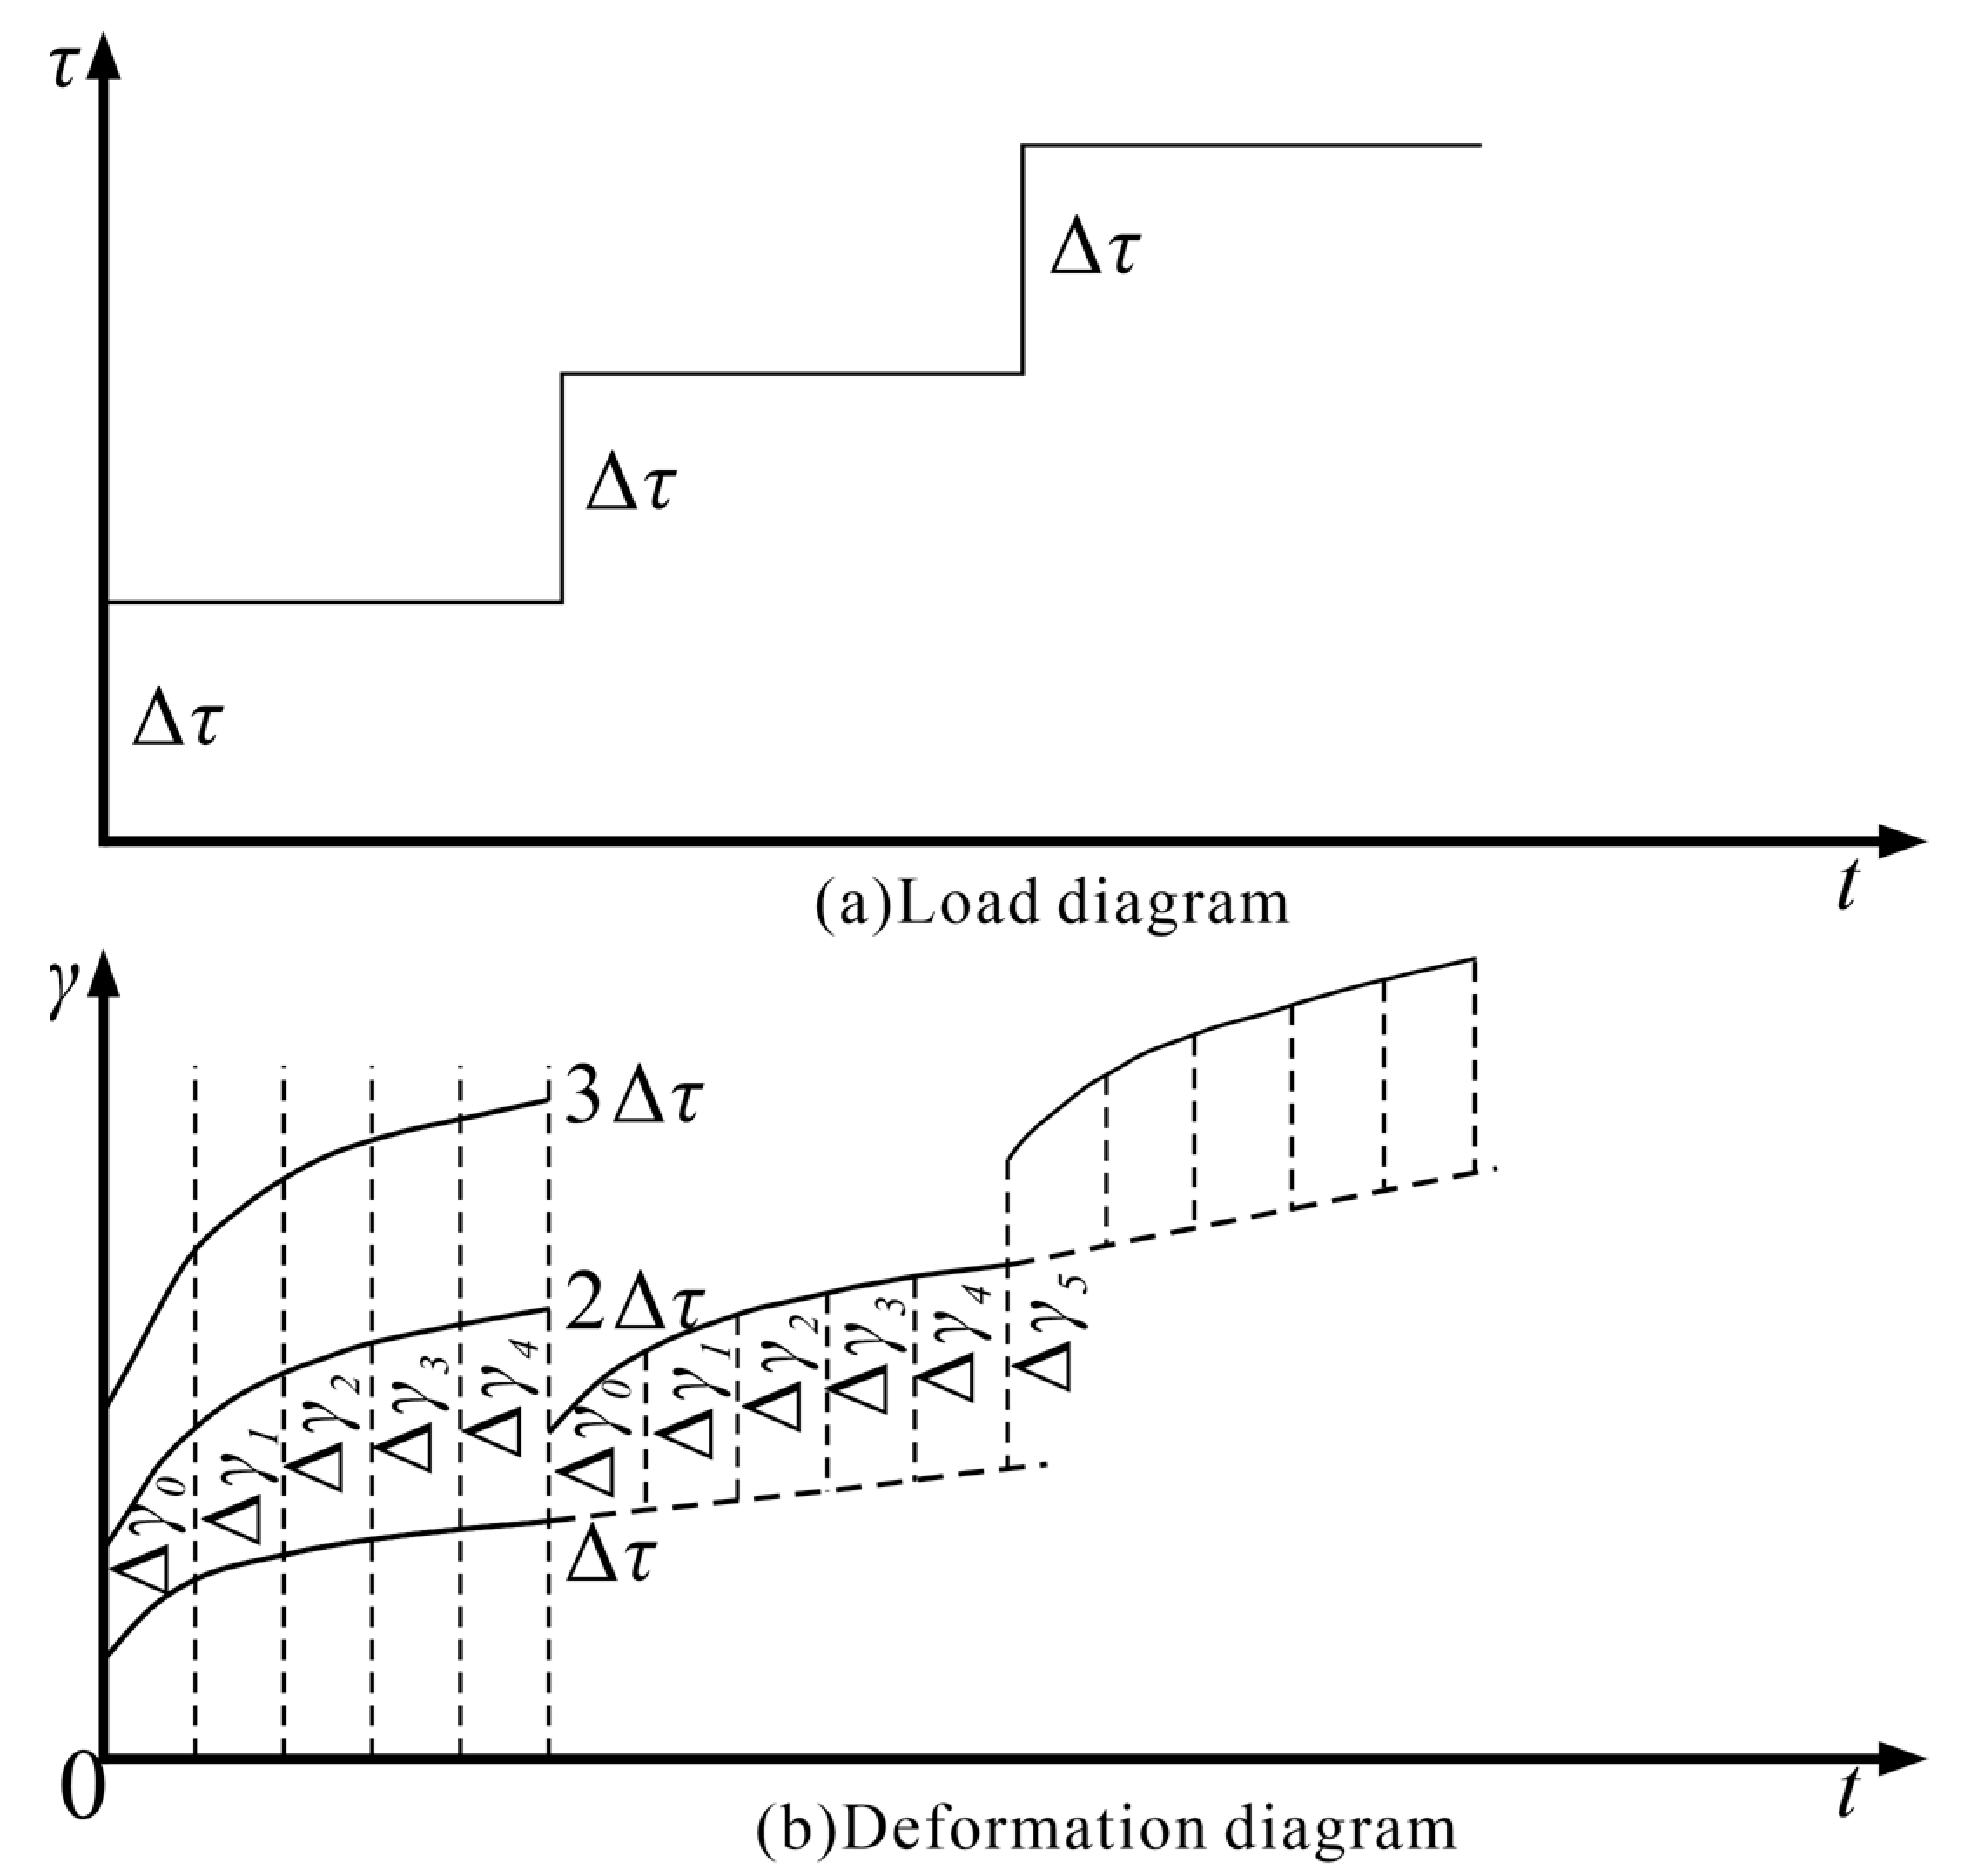
- The instantaneous shear displacement is measured immediately when the first-order shear load is applied, the read shear creep value is tested within a certain time interval, the observation times are encrypted at the early phase of deformation, the number of data-reading decreases after the deformation tends to be basically stable and the shear load of each stage is maintained for 7 days.
- (5)
- When the final level of shear load is applied, if it is found that the shear creep displacement has a tendency to increase rapidly with time, the number of observations should be increased to reflect the final creep failure stage.

| Sample Number | Consolidation Pressure/kPa | Shearing Stress/kPa |
|---|---|---|
| CD-1 | 100 | 7–14–18–21–35–42 |
| CD-2 | 200 | 9–18–27–36–45–54–63–72–81–90–99 |
| CD-3 | 300 | 10–20–30–40–50–60–70–80–90–100 |
| CD-4 | 400 | 12–24–36–48–60–72–84–96–108–120–132–144–156–168 |
2.2.4. Horizontal Shear Load Loading Method
2.2.5. Creep Data Processing
3. Results and Discussion
3.1. Shear Creep Curve of Clay-Type Muddy Interlayer
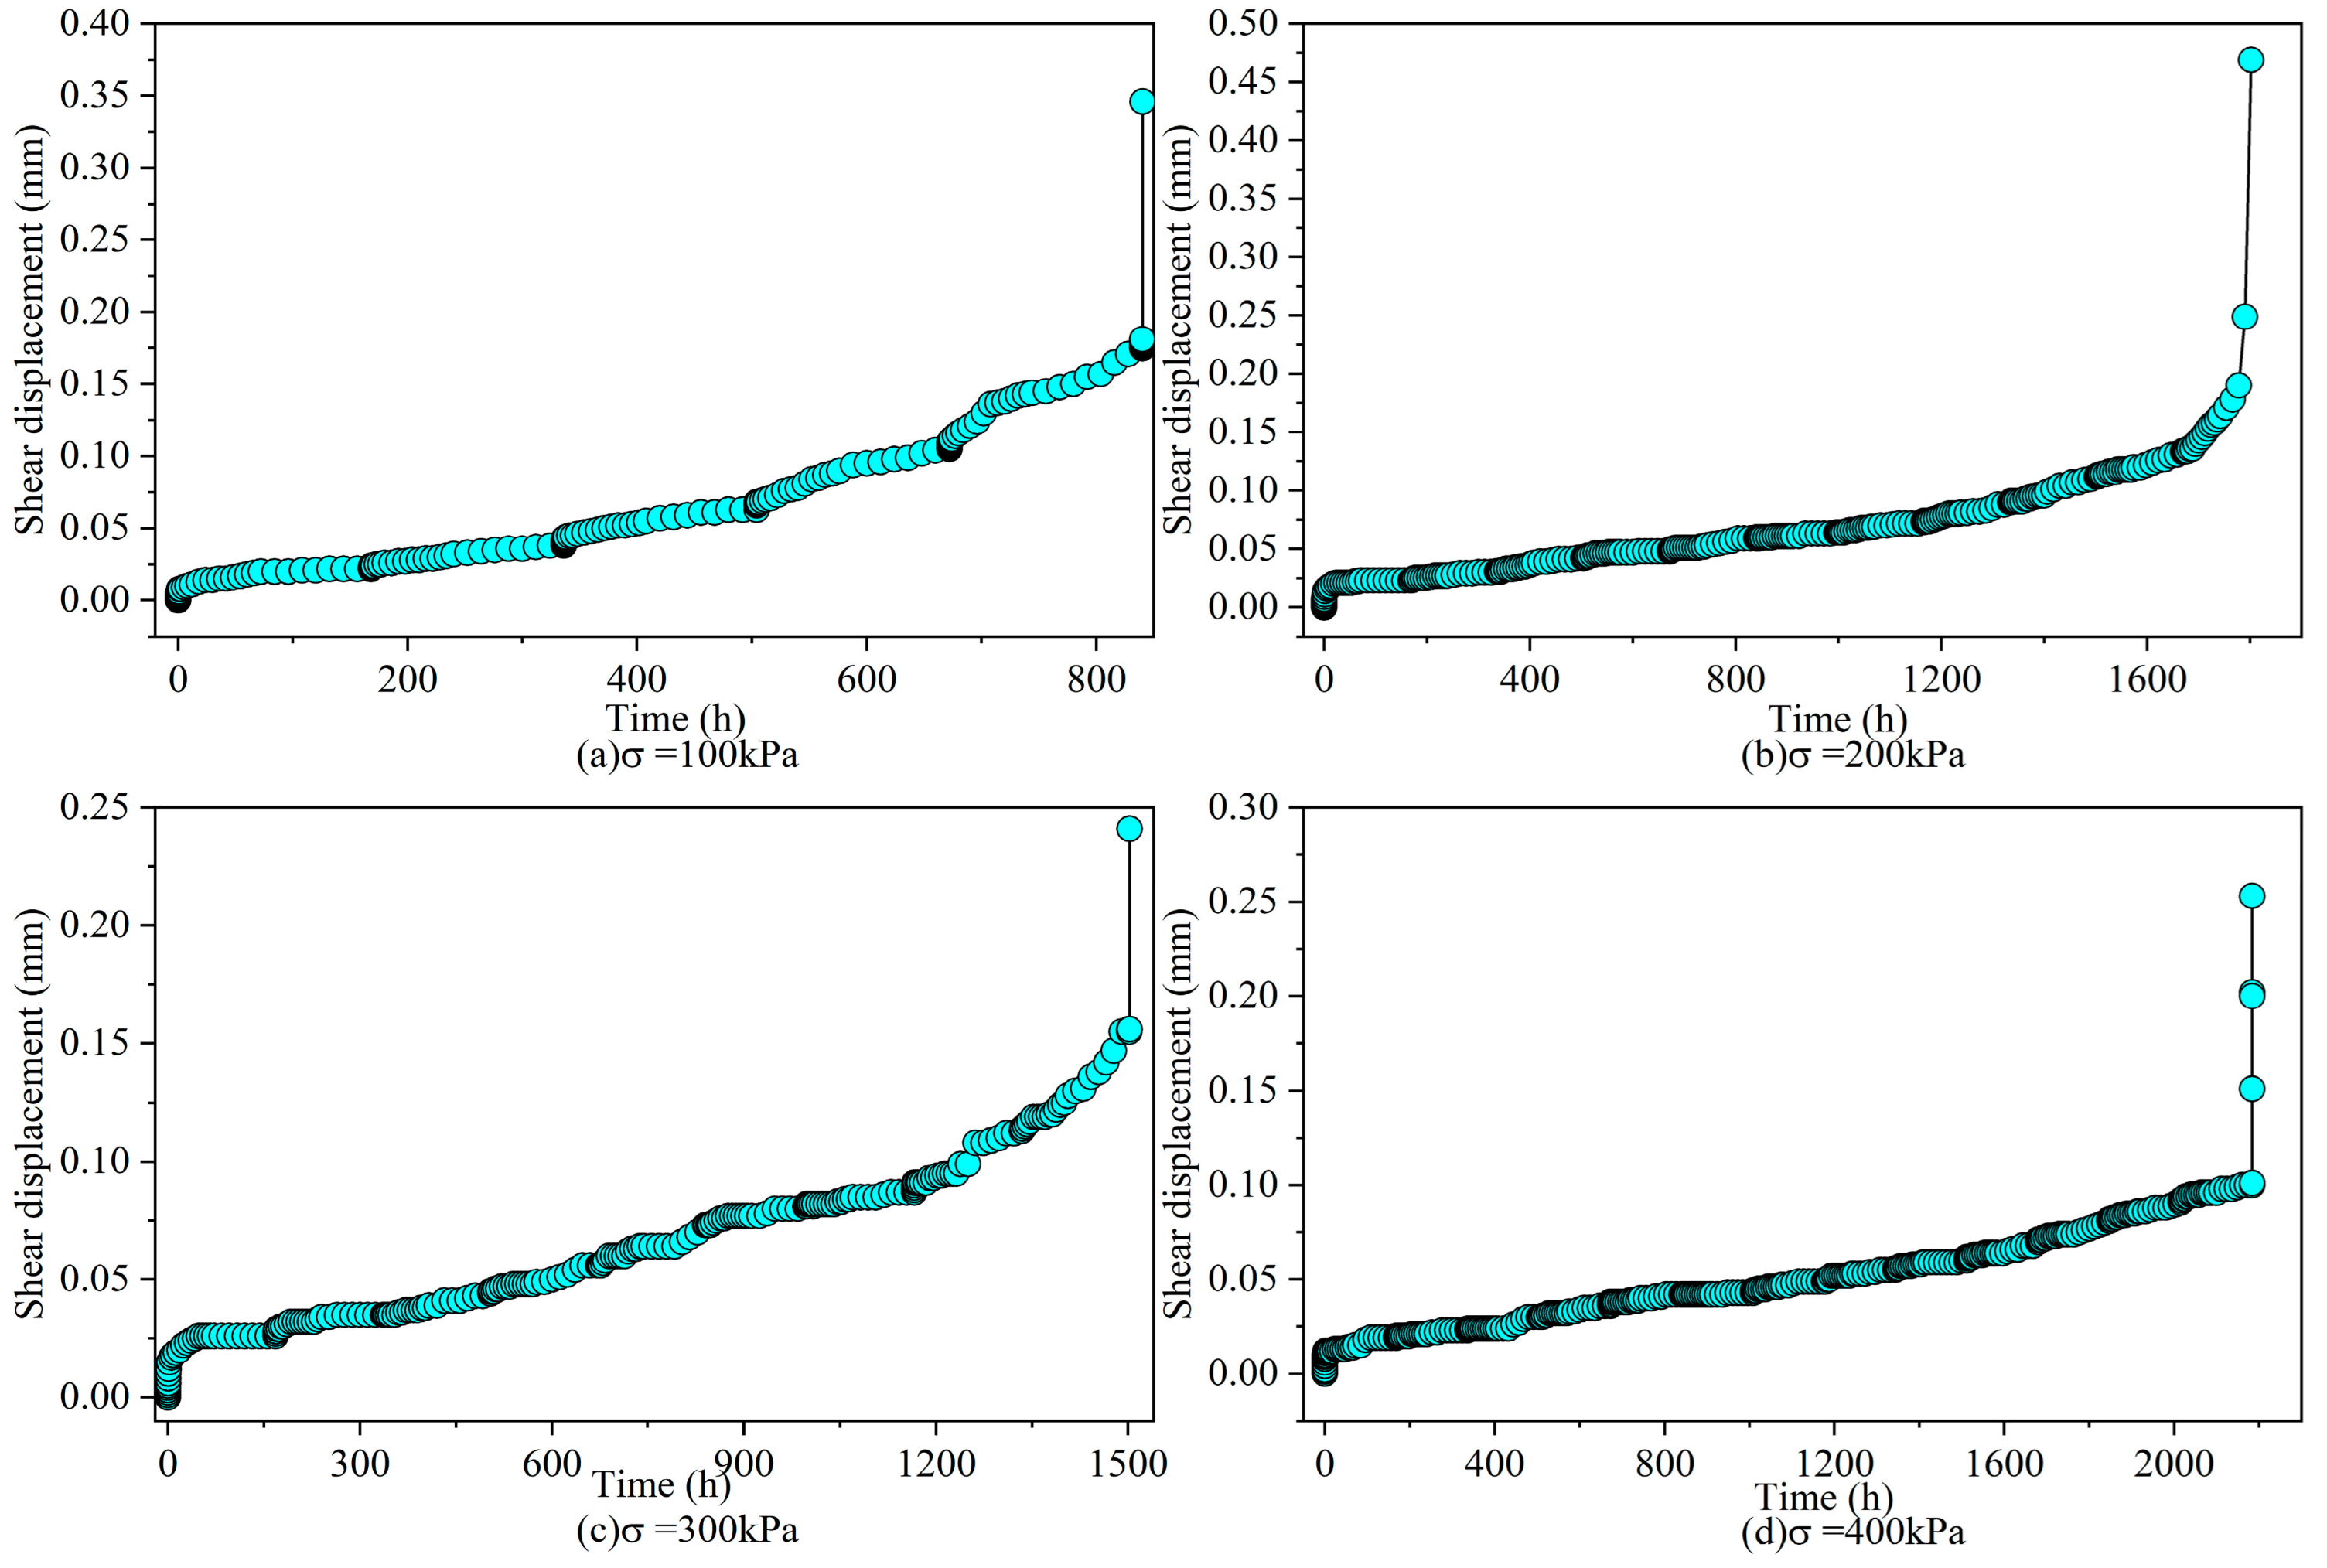
- (1)
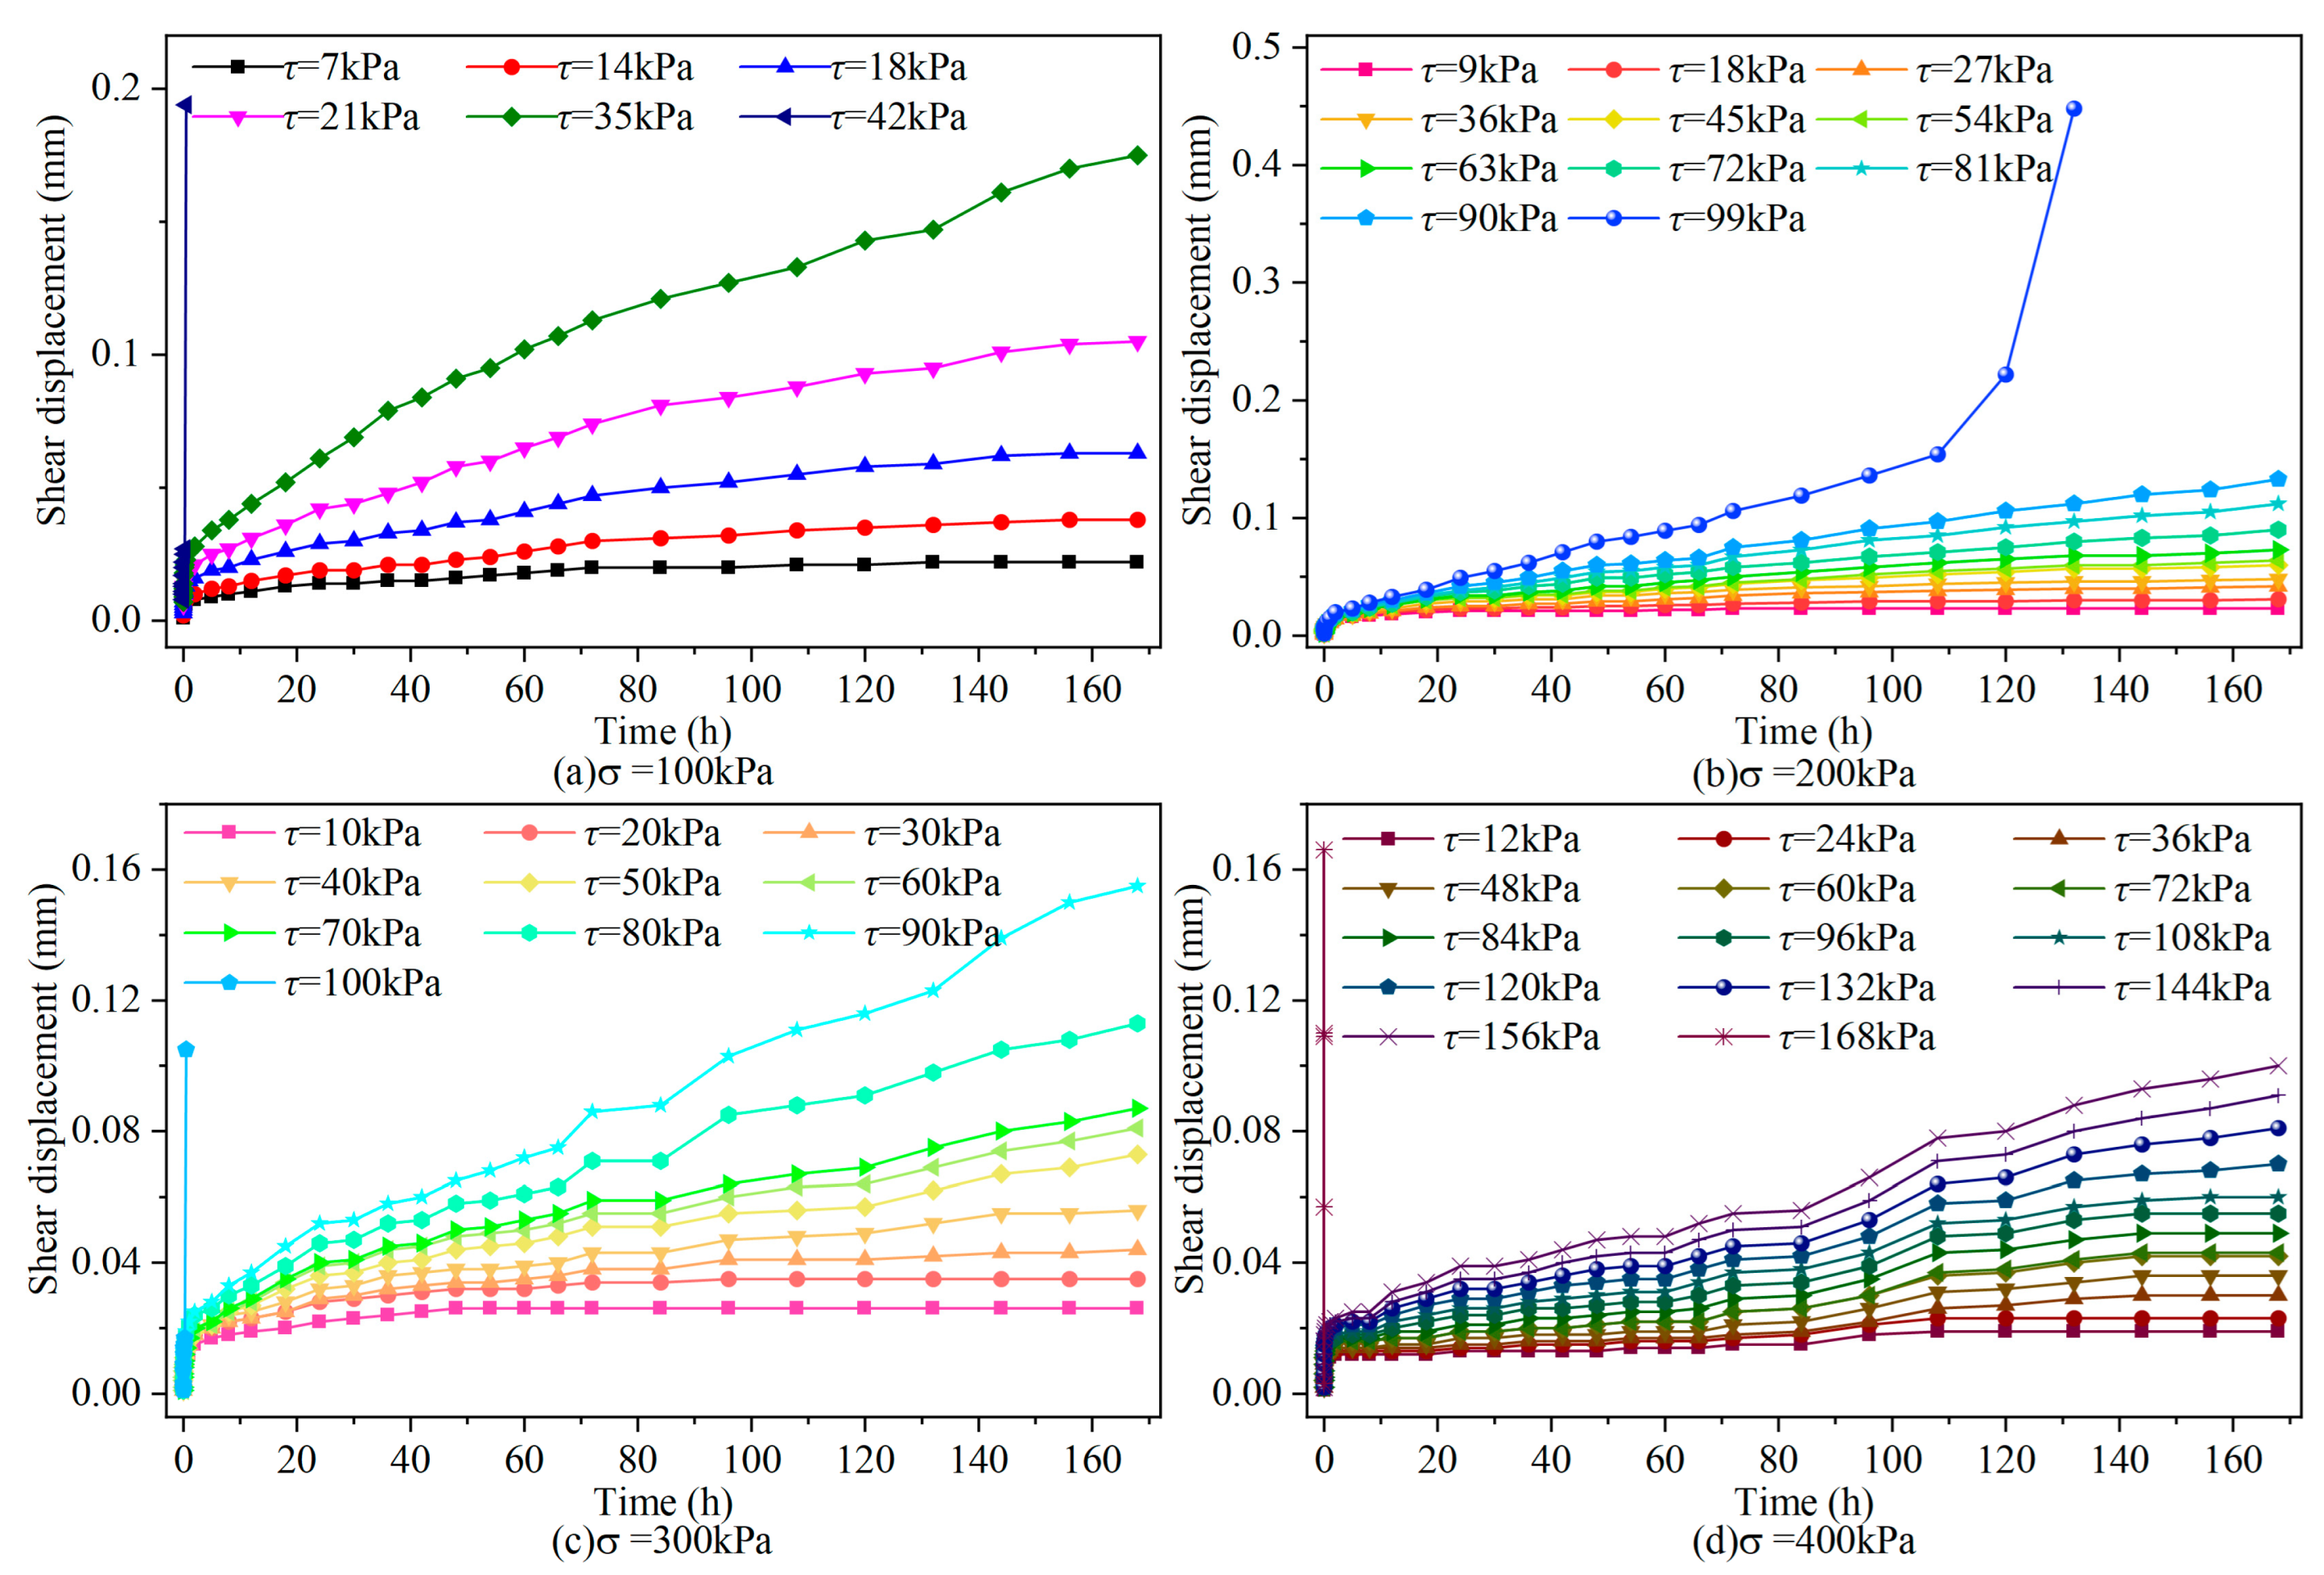
- Under the constant normal stress level, the muddy interlayer sample has transient deformation and initial creep stage after all the levels of shear stress are loaded, and the initial creep stage lasts for a short time. At lower stress levels, the samples exhibited a stable creep stage, characterized by a creep curve that approximates a straight line. When the shear stress is relatively low, the shear displacement basically remains unchanged (the creep rate is approximately 0), and when the shear stress is slightly higher, the shear displacement slowly increases (the creep rate is a small constant value). This suggests that shear stress affects the creep behavior of the mud stratification, a feature noted by some researchers in the shear creep curves of muddy interlayer [38,39]. The accelerated creep stage usually occurs after the application of the last Shear stress, because the shear stress is greater than the critical strength of the impedance capacity of the specimen, during which the shear displacement increases rapidly with time until the specimen is destroyed.
- (2)
- The shear displacement in the initial creep stage increases rapidly with time, while the creep rate decreases rapidly with time, and the creep rate in the stable creep stage increases with the increase in shear stress, indicating that the creep of the muddy interlayer is very strong, and the creep is enhanced with the increase in shear stress.
- (3)
- After the last shear stress is applied, there are three obvious stages of creep (Figure 7b), which shows a typical ductile failure form, while in Figure 7a,c,d, it directly enters the accelerated creep stage and occurs, showing a brittle failure form. It shows that when σ = 200 kPa, the last shear stress is just within the range where three stages of creep can occur, while when σ = 100, 300 and 400 kPa, the last shear stress is outside this range.
- (4)
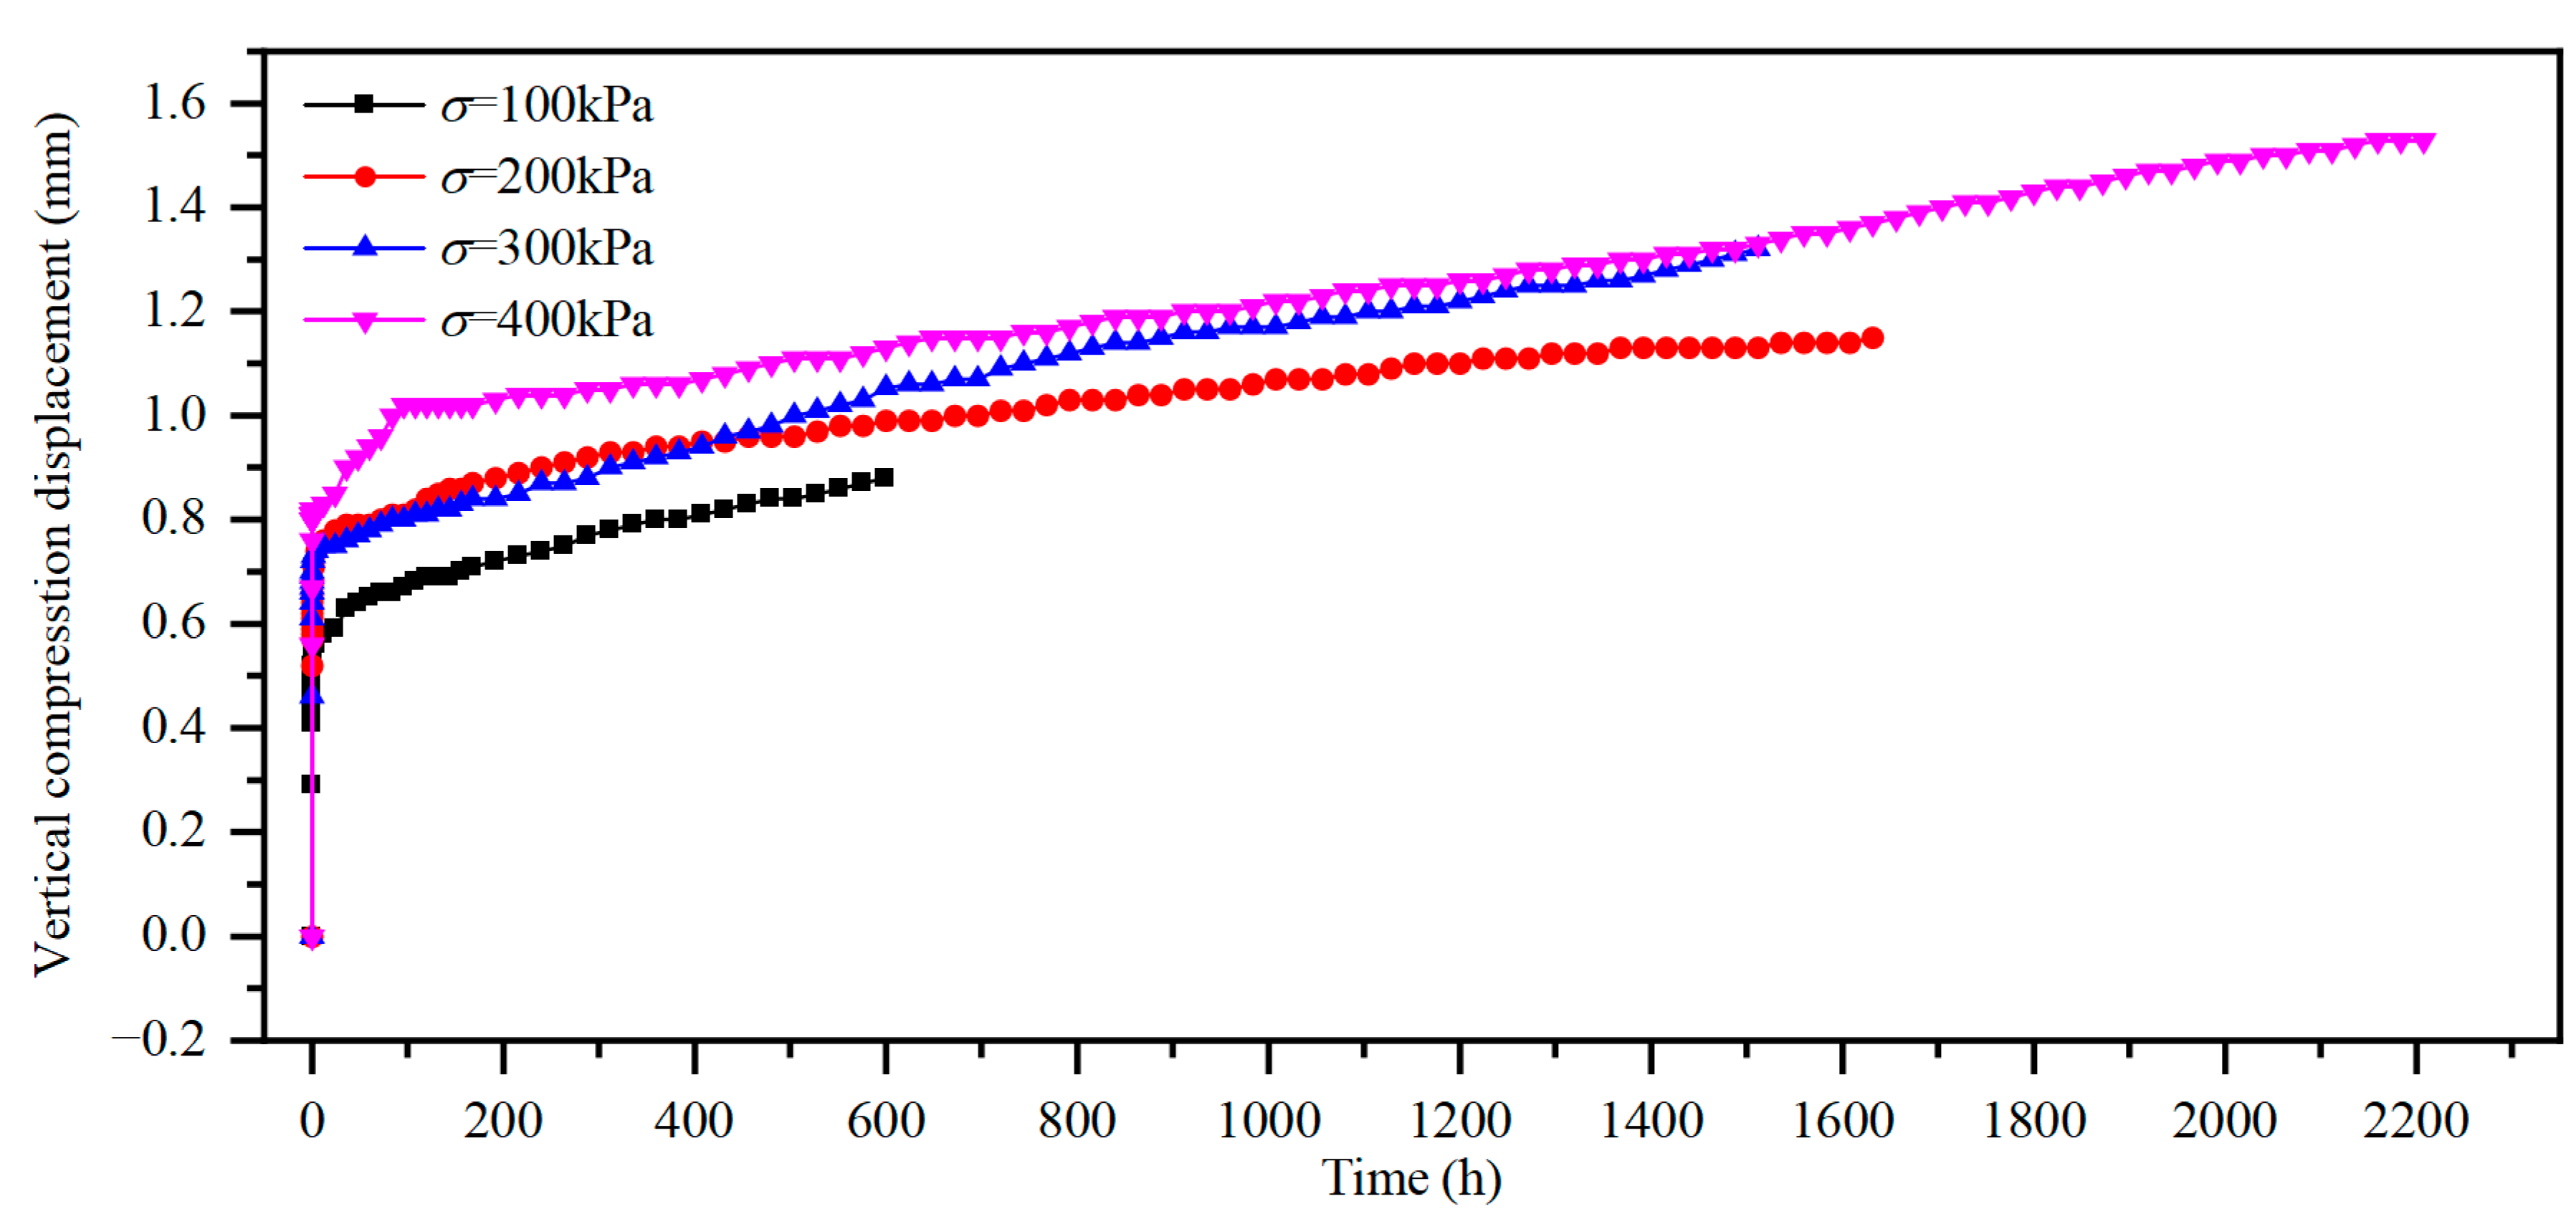
- According to the curve of test results, it can be seen that the shear failure value of muddy interlayer increases with the increase in normal stress level. This is mainly because the increase in the normal stress level enhances the compaction effect on the interlayer particles and increases the shear friction resistance of the sample, so the shear stress required for shear failure increases accordingly. As shown in Figure 8, even though the vertical compression displacement under σ = 200 kPa is slightly greater than under σ = 300 kPa during the 12 to 408-h period, the difference is quite small, falling within the range of 0.01 to 0.04 mm. In summary, the overall trend in the shear-creep test process shows that the vertical compression displacement of the specimens increases with the rise in normal stress and gradually grows over time.
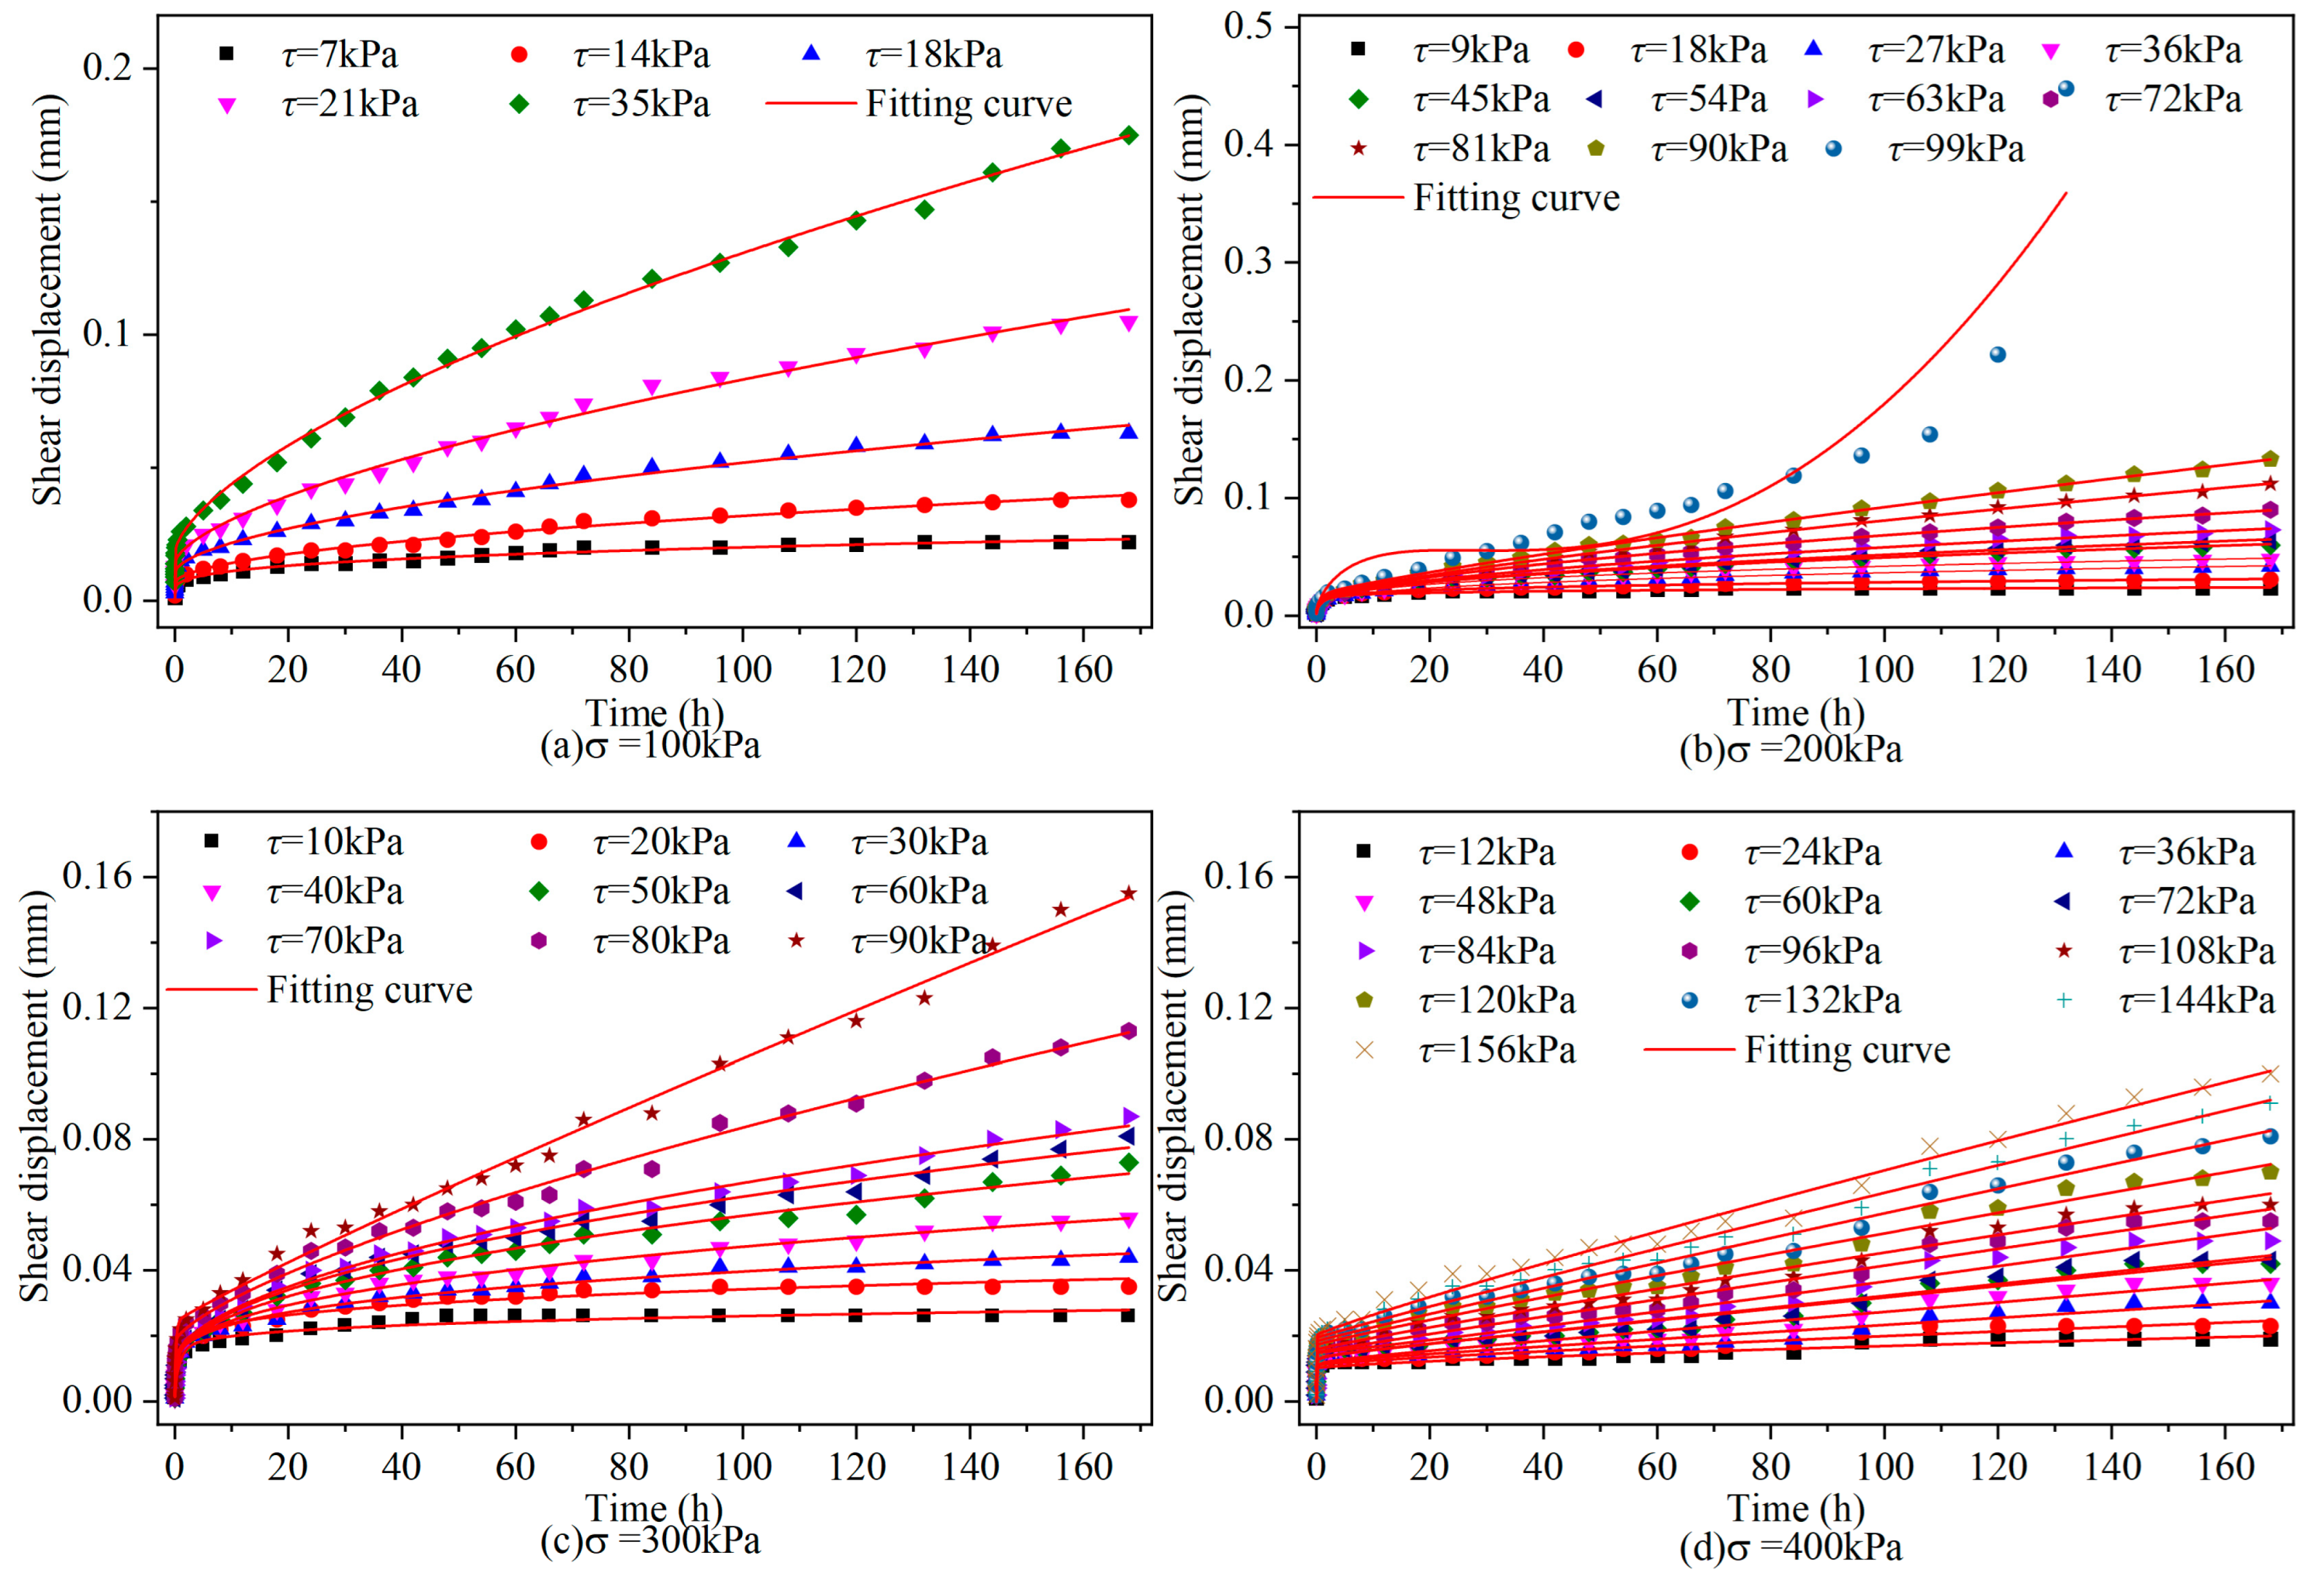
3.2. Empirical Formula of Shear Creep
3.3. Variation Law of Shear Creep Rate
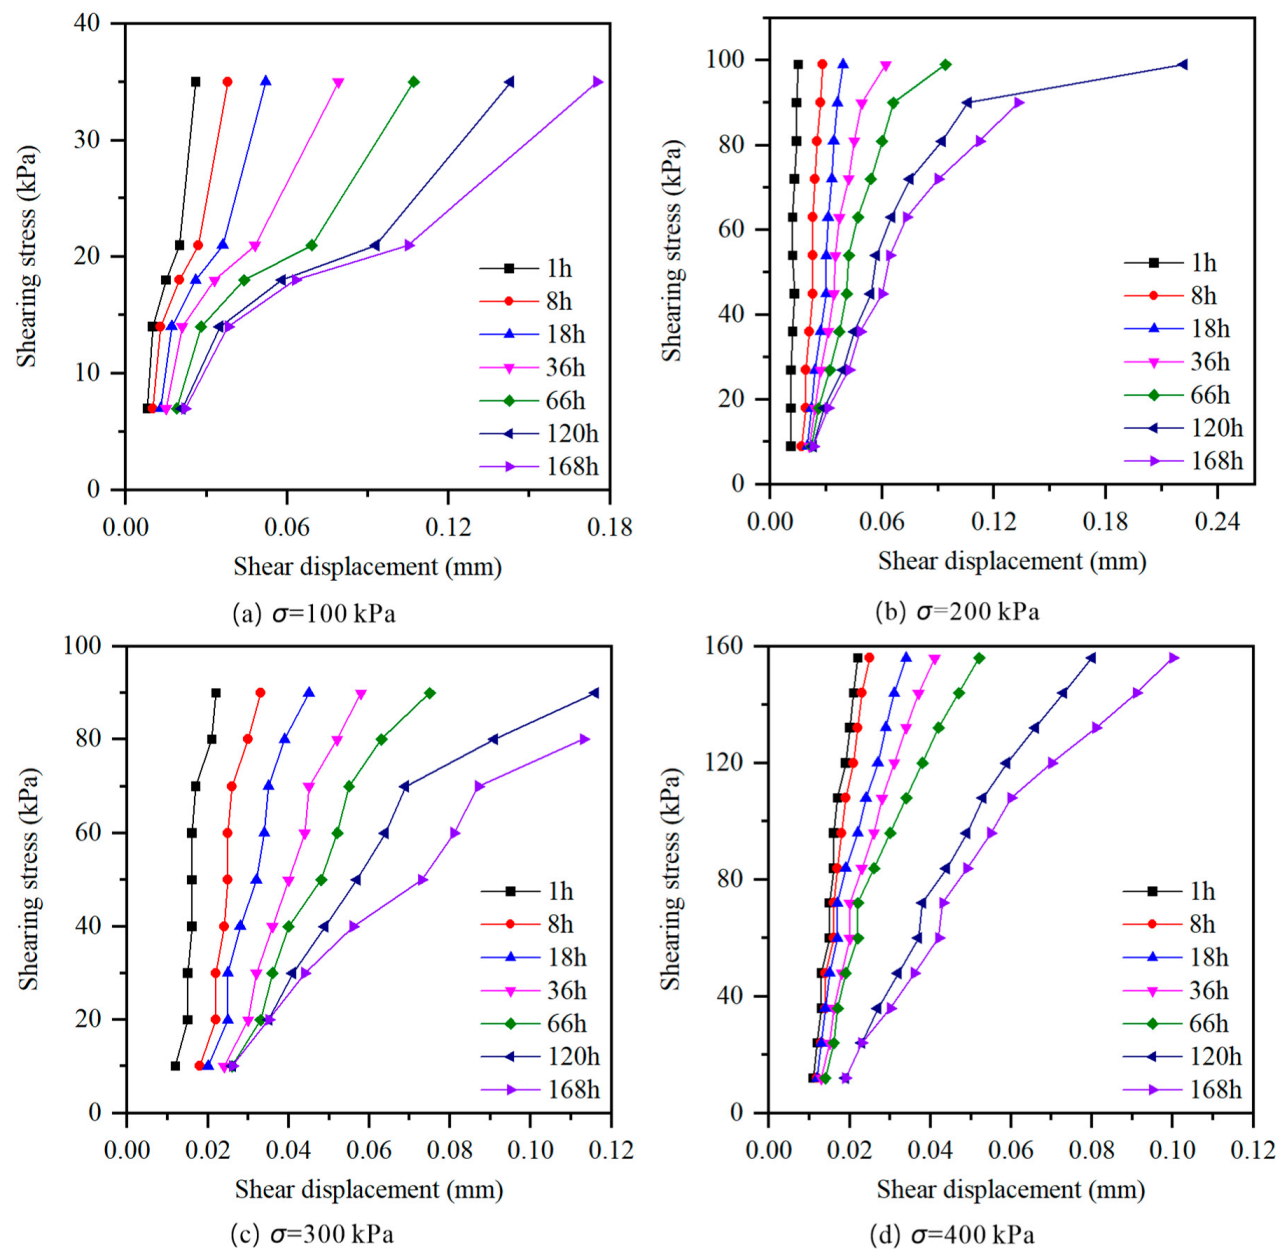
3.4. Study on Long-Term Strength of Muddy Interlayer
4. Conclusions
- (1)
- The shear creep deformation of the clay-type muddy interlayer is obvious. At the same normal stress level, the specimen has instantaneous deformation, initial creep and stable creep at the lower shear stress level. There are two cases at the level of rupture shear stress: the creep curve includes three stages of typical initial creep, stable creep and accelerated creep failure or directly enters the accelerated creep stage until the specimen failure. The empirical formula of shear creep proposed, u = u0 + A [1 − e(−Bt)] + Ctn, can well reflect the instantaneous deformation, initial creep and stable creep of shearing interlayer, but the fitting effect of accelerated creep is not good. The coefficient of determination (R2) for the fitting of the shear creep empirical formulas is consistently above 0.9.
- (2)
- Under the constant normal stress level, the shear creep increases with the increase in the shear stress level, while at the same shear stress level, the shear creep decreases with the increase in the normal stress level. At all levels of stress, the initial attenuated creep stage of the specimen has smaller deformation, shorter duration, longer stable creep duration and the steady creep rate at lower shear stress level is a constant greater than 0, which shows that the creep of the clay-type muddy interlayer is very strong.
- (3)
- Under the same normal stress level, the average and steady creep rate of the clay-type muddy interlayer can be characterized by the exponential function of , and the average creep rate of the clay-type muddy interlayer specimens is generally one- to three-times the stable creep rate.
- (4)
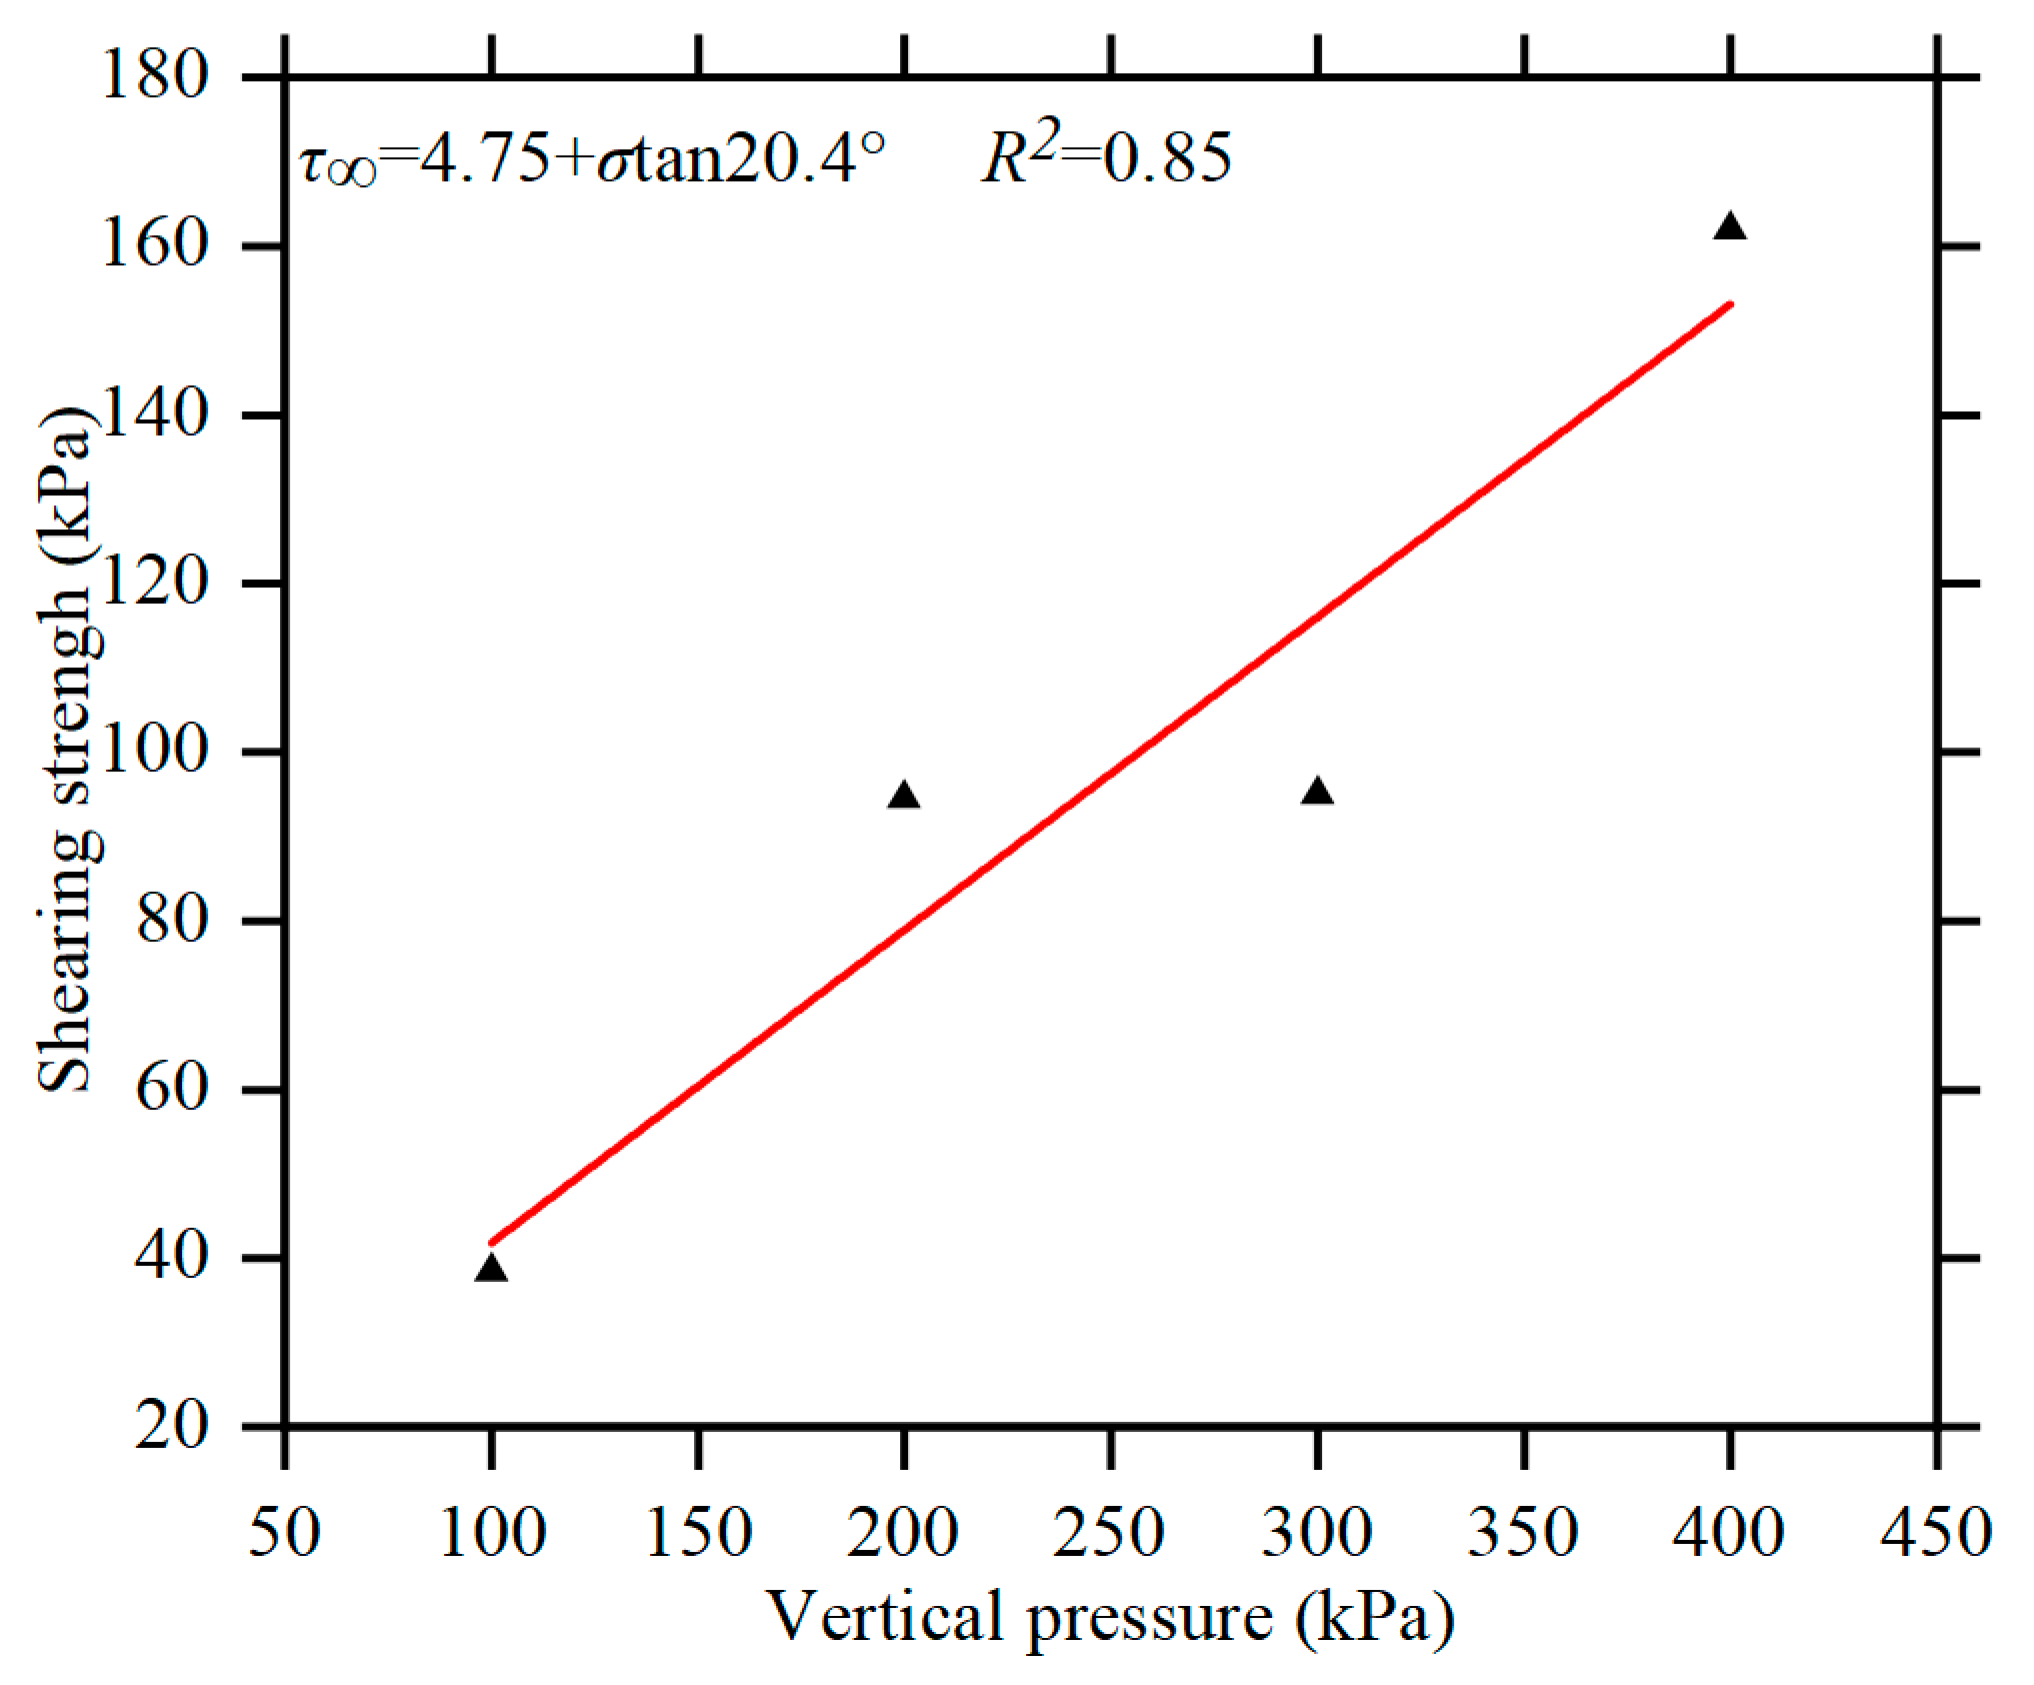
- In comparison to previous studies on no-clay-type muddy interlayer, the long-term strength of clay-type muddy interlayer is notably low. A method was proposed to determine long-term shear strength indicators based on the long-term strength limit. By curve fitting, was determined to be 20.4° and was 4.75 kPa. The relationship between the shear strength limit (τ∞) and normal stress (σ) was formulated as τ∞ = 4.75 + σ tan20.4°.
Author Contributions
Funding
Institutional Review Board Statement
Informed Consent Statement
Data Availability Statement
Conflicts of Interest
References
- Wang, X.; Liu, W.; Nai, L. Fabric types and microstructure of clay partings. J. Jilin Univ. 1983, 28, 73–82+133–134, (In Chinese with English Abstract). Available online: https://kns.cnki.net/kcms2/article/abstract?v=3uoqIhG8C44YLTlOAiTRKth5mPLKqXjbyzE23kHsboOHJaCyyuzqfd5NMADEpWqjvV9j9W02ZbUZpzyGJ2sxitHkBB_S5_Hv&uniplatform=NZKPT (accessed on 3 May 1983).
- Xiao, S. The creep model of intercalated clay layers and change of their microstructure during creep. Chin. J. Rock Mech. Eng. 1987, 6, 113–124, (In Chinese with English Abstract). Available online: https://kns.cnki.net/kcms2/article/abstract?v=3uoqIhG8C44YLTlOAiTRKqd0WnNPv0wTDjtDUwHroNx-oi0hV0oZNa9sRf3vquNzlU_KZjhqW-migptnk8iR9jy-KLfMypSu&uniplatform=NZKPT (accessed on 19 June 1985).
- Yi, J.; Sun, J.; Xian, J. The research of the microscopic characteristics of the argillation intercalation’evolution process in southwest red bed area. Sci. Technol. Eng. 2016, 16, 123–126+145, (In Chinese with English Abstract). Available online: https://kns.cnki.net/kcms2/article/abstract?v=3uoqIhG8C44YLTlOAiTRKibYlV5Vjs7ijP0rjQD-AVm8oHBO0FTadp8CR-pyvgMkjPir9eSjoyAmDnu-4n1xKmMcNHt9PJ0W&uniplatform=NZKPT (accessed on 29 December 2015).
- Li, A.; Deng, H.; Zhang, H.; Liu, H.; Jiang, M. The Shear-Creep Behavior of the Weak Interlayer Mudstone in a Red-Bed Soft Rock in Acidic Environments and Its Modeling with an Improved Burgers Model. Mech. Time-Depend. Mater. 2023, 27, 1–18. [Google Scholar] [CrossRef]
- Wang, Z.; Zhang, L.; He, J. Influence of mudded intercalation on slope stability and its controlling. J. Qingdao Inst. Archit. Eng. 2004, 25, 1–4+11, (In Chinese with English Abstract). Available online: https://kns.cnki.net/kcms2/article/abstract?v=3uoqIhG8C44YLTlOAiTRKgchrJ08w1e7eeyE9jLkqq_srXG7yXobLTtm_mWMMExX7X70tIjkTM9Q_66QwdvnjhFWRIZr7Mkv&uniplatform=NZKPT (accessed on 18 October 2004).
- Gong, J.; Jing, F.; Zhang, K.; Zhou, B. Influence on slope stability of physical-mechanical property of clayer thin interlayer in red sandstone. J. Chongqing Jiaotong Univ. (Nat. Sci.) 2010, 29, 220–223, (In Chinese with English Abstract). Available online: https://kns.cnki.net/kcms2/article/abstract?v=3uoqIhG8C44YLTlOAiTRKgchrJ08w1e7_IFawAif0mwOIHgfNHDSrp6on16RFgZ-eQNRiAYNODSALsT0DfgFHqJTSx2VPAyn&uniplatform=NZKPT (accessed on 28 September 2009).
- Bai, Y.; Wang, Y.; Ge, H.; Ni, H. Formation evolution and genetic mechanism of baisheng landslide in the deep-incised valley of jinsha river. J. Jilin Univ. (Earth Sci. Ed.) 2019, 49, 1680–1688, (In Chinese with English Abstract). [Google Scholar] [CrossRef]
- Jaiswal, A.; Verma, A.K.; Singh, T.N. Evaluation of Slope Stability through Rock Mass Classification and Kinematic Analysis of Some Major Slopes along NH-1A from Ramban to Banihal, North Western Himalayas. J. Rock Mech. Geotech. Eng. 2023, in press. [Google Scholar] [CrossRef]
- Dahal, R.K.; Hasegawa, S.; Yamanaka, M.; Dhakal, S.; Bhandary, N.P.; Yatabe, R. Comparative analysis of contributing parameters for rainfall-triggered landslides in the Lesser Himalaya of Nepal. Environ. Geol. 2008, 58, 567–586. [Google Scholar] [CrossRef]
- Tan, X.; Ren, Y.; Li, T.; Zhou, S.; Zhang, J.; Zhou, S. In-Situ Direct Shear Test and Numerical Simulation of Slate Structural Planes with Thick Muddy Interlayer along Bedding Slope. Int. J. Rock Mech. Min. Sci. 2021, 143, 104791. [Google Scholar] [CrossRef]
- Han, G.; Zhang, C.; Zhou, H.; Zhang, C.; Gao, Y.; Singh, H.K. A New Predictive Method for the Shear Strength of Interlayer Shear Weakness Zone at Field Scales. Eng. Geol. 2021, 295, 106449. [Google Scholar] [CrossRef]
- Xu, G. Study of the Argillaceous Interlayer at the Dam Site of the Qikou Key Water Project. Yellow River 1994, 46, 33–35+62, (In Chinese with English Abstract). Available online: https://kns.cnki.net/kcms2/article/abstract?v=3uoqIhG8C44YLTlOAiTRKjkpgKvIT9NkGsvn6cq9Bo1u7azdm2rZne3hzgD4OFVAFIezcmEJCM1HmqDlDvhSTYRaNOv0m7TC&uniplatform=NZKPT (accessed on 1 November 2023).
- Qi, S.; Shi, S.; Tan, J. Engineering Geological Research on the Siltized Intercalation of Flood-relief Stilling Pool of Xiaolangdi Project. J. Yellow River Conserv. Tech. Inst. 1999, 11, 4–8. (In Chinese) [Google Scholar] [CrossRef]
- Chen, R. Study on Geological characteristics and Countermeasures of muddy interlayer in Foundation. Resour. Environ. Eng. 2008, 22, 55–58, (In Chinese with English Abstract). [Google Scholar] [CrossRef]
- Hu, Q.; He, S.; Ye, T.; He, L.; Cai, Q. Microsfabric parameters’s quantitative method of the mudded weak interlayer. Chin. J. Geol. Hazard Control 2017, 28, 137–146, (In Chinese with English Abstract). [Google Scholar] [CrossRef]
- Qu, Y.; Shan, S.; Xu, X.; Shi, M. Occurrence of argillitization interbeds and the trend of its changes in a certain construction project. Chin. J. Geol. 1977, 20, 363–371, (In Chinese with English Abstract). [Google Scholar] [CrossRef]
- Liu, H. Preliminary Study on the Distribution of Clay Interactions at the Longmen Dam Site. Yellow River 1987, 39, 59–64, (In Chinese with English Abstract). Available online: https://kns.cnki.net/kcms2/article/abstract?v=Mw9W0jY1lXC8YClYcDjS7Ghcj3PHBxLrBuBqo-xbp5BdRmTY_pw5zkEcWrnBSCWPs_VqZU5uh7OYy8NOufoRLv6xENMHTwI3TSIbCTVS6dXRRqxZn3LoQ4H1azXqenTzuBSuwJNxjLo=&uniplatform=NZKPT&language=CHS (accessed on 1 November 2023).
- Zhang, J. Advances in the Engineering Geological Properties of Weak Intercalation. J. Geol. Hazards Environ. Preserv. 2020, 31, 104–112. [Google Scholar] [CrossRef]
- Zhao, D.; Xia, Y.; Zhang, C.; Tang, C.; Zhou, H.; Liu, N.; Singh, H.K.; Zhao, Z.; Chen, J.; Mu, C. Failure Modes and Excavation Stability of Large-Scale Columnar Jointed Rock Masses Containing Interlayer Shear Weakness Zones. Int. J. Rock Mech. Min. Sci. 2022, 159, 105222. [Google Scholar] [CrossRef]
- Han, G.; Zhang, C.; Singh, H.K.; Huang, S.; Zhou, H.; Gao, Y. A Comprehensive Investigation of Engineering Geological Characteristics of Interlayer Shear Weakness Zones Embedded within Baihetan Hydropower Station. Tunn. Undergr. Space Technol. 2023, 132, 104891. [Google Scholar] [CrossRef]
- Zhou, X.; Sun, J.; Liu, G.; Li, Z.; Yi, B. Experimental study of direct shear creep on long-term strength of slope rock mass mudded intercalation based on power function. Saf. Environ. Eng. 2018, 25, 6–11, (In Chinese with English Abstract). [Google Scholar] [CrossRef]
- Han, G.; Hou, J.; Zhou, H.; Zhang, C.; Gao, Y.; Yang, L.; Chen, P. Shear creep experimental study on constitutive model of interlayer shear weakness zones. Chin. J. Rock Mech. Eng. 2021, 40, 958–971, (In Chinese with English Abstract). [Google Scholar] [CrossRef]
- Tang, L.; Zhao, Y.; Liao, J.; Liu, Q. Creep Experimental Study of Rocks Containing Weak Interlayer Under Multilevel Loading and Unloading Cycles. Front. Earth Sci. 2020, 8, 519461. [Google Scholar] [CrossRef]
- Zuo, J.; Wang, Z.; Zhou, H.; Pei, J.; Liu, J. Failure behavior of a rock-coal-rock combined body with a weak coal interlayer. Int. J. Min. Sci. Technol. 2013, 23, 907–912. [Google Scholar] [CrossRef]
- Chen, Q.; Zhang, C.; Yang, C.; Ma, C.; Pan, Z.; Daemen, J.J.K. Strength and Deformation of Tailings with Fine-Grained Interlayers. Eng. Geol. 2019, 256, 110–120. [Google Scholar] [CrossRef]
- Ren, M.; Zhang, Q.; Chen, S.; Zhang, L.; Jiao, Y.; Xiang, W. Experimental Study on Mechanical Properties of Anchored Rock-Like Material with Weak Interlayer Under Uniaxial Compression. Geotech. Geol. Eng. 2020, 38, 4545–4556. [Google Scholar] [CrossRef]
- Miao, H.; Wang, G. Effects of Clay Content on the Shear Behaviors of Sliding Zone Soil Originating from Muddy Interlayers in the Three Gorges Reservoir, China. Eng. Geol. 2021, 294, 106380. [Google Scholar] [CrossRef]
- Chen, Z.; Jia, C.; Lei, M. Experimental investigation on shear creep properties of natural structural plane. J. Railw. Sci. Eng. 2021, 18, 1817–1827, (In Chinese with English Abstract). [Google Scholar] [CrossRef]
- Chen, X.; Li, J.; Chai, J.; Bai, J. Shear creep characteristics and constitutive model for interlayer shear belt of high abutment slopes. Chin. J. Geotech. Eng. 2013, 35, 1675–1682, (In Chinese with English Abstract). Available online: https://kns.cnki.net/kcms2/article/abstract?v=3uoqIhG8C44YLTlOAiTRKgchrJ08w1e7xAZywCwkEELDQ9z-af4ggJVnwfPVCpvc2o4dnpFptal-YctWiVg3wPh-17q0Gkh9&uniplatform=NZKPT (accessed on 10 April 2013).
- Namazi, E.; Mohamad, H.; Jorat, M.E.; Hajihassani, M. Investigation on the Effects of Twin Tunnel Excavations Beneath a Road Underpass. Electron. J. Geotech. Eng. 2011, 16, 441–450. [Google Scholar]
- Jusoh, S.N.; Mohamad, H.; Marto, A.; Mohd Yunus, N.Z.; Kasim, F. Segment’s joint in precast tunnel lining design. J. Teknol. 2015, 77, 91–98. [Google Scholar] [CrossRef]
- Han, Y.; Liu, X.; Li, D.; Tu, Y.; Deng, Z.; Liu, D.; Wu, X. Model Test on the Bearing Behaviors of the Tunnel-Type Anchorage in Soft Rock with Underlying Weak Interlayers. Bull. Eng. Geol. Environ. 2020, 79, 1023–1040. [Google Scholar] [CrossRef]
- Ma, C.; Zhan, H.; Zhang, T.; Yao, W. Investigation on Shear Behavior of Soft Interlayers by Ring Shear Tests. Eng. Geol. 2019, 254, 34–42. (In Chinese) [Google Scholar] [CrossRef]
- Zhao, Z.; Liu, W.; Wang, Z. Investigation Report on Side (Slip) Slope Management Project for Yuxi City Domestic Waste Incineration Power Generation Project; Kunming Prospecting Design Institute of China Nonferrous Metals Industry Co., Ltd.: Kunming, China, 2019. (In Chinese) [Google Scholar]
- Zhang, X.; Wang, C.; Zhang, S. Comparative analysis of soft clay creep data processing method. J. Jilin Univ. (Earth Sci. Ed.) 2010, 40, 1401–1408, (In Chinese with English Abstract). [Google Scholar] [CrossRef]
- Sun, J. Rock rheological mechanics and its advance in engineering applications. Chin. J. Rock Mech. Eng. 2007, 26, 1081–1106, (In Chinese with English Abstract). Available online: https://kns.cnki.net/kcms2/article/abstract?v=3uoqIhG8C44YLTlOAiTRKgchrJ08w1e7aLpFYbsPrqHSoo-GpMay_95KlUErlN6X5ExWvotyiXn0sx1czE6yO2tZUOKhUXEw&uniplatform=NZKPT. (accessed on 15 January 2007).
- Liu, X. Introduction to Rock Rheology, 1st ed.; Geological Publishing House: Beijing, China, 1994; pp. 139–143. [Google Scholar]
- Lin, W. Study on the Selection of Strength of Mudrock Intercalations in the Gezhouba Dam Foundation. J. Hydraul. Eng. 1982, 27, 68–72, (In Chinese with English Abstract). [Google Scholar] [CrossRef]
- Liu, Q.; Zhu, Z. Shear characteristics of siltized intercalation in red sandstone at different water contents. J. Shenyang Univ. Technol. 2012, 34, 220–223+235, (In Chinese with English Abstract). [Google Scholar]
- Yuan, J.; Wang, X.; Dong, J.; Yang, X. Research on the strength and deformation of shanghai clayey soils under k 0 consolidation condition. Dam Obs. Geotech. Tests 1999, 23, 31–34, (In Chinese with English Abstract). Available online: https://kns.cnki.net/kcms2/article/abstract?v=3uoqIhG8C44YLTlOAiTRKjkpgKvIT9Nkm5tS6uBYqSGn_m8p0YXqh5ZmQgYdNxs3OXuKRjVjfq9LvDrLi7x44ioPT1gsDaWn&uniplatform=NZKPT (accessed on 12 April 1998).
- Sun, D.; Yao, Y.; Yin, Z. Elasto-plastic model for soil with initially stress-induced anisotropy. Rock Soil Mech. 2000, 22, 222–226, (In Chinese with English Abstract). [Google Scholar] [CrossRef]
- Liu, J.; Wang, S.; Yang, H. Method to determine the rheological tesy long-term strength for soft intercalations. Site Investig. Sci. Technol. 1996, 14, 3–7. (In Chinese) [Google Scholar]
- Wang, Y.; Li, J.; Liu, F. Experimental research on shear creep and its long-term strength of weak intercalation in dam foundation. Chin. J. Rock Mech. Eng. 2013, 32, 3378–3384, (In Chinese with English Abstract). Available online: https://kns.cnki.net/kcms2/article/abstract?v=3uoqIhG8C44YLTlOAiTRKjw8pKedNdX5_mkCYmAjR9woATR5jJrIuB6lTzqRtYl4mVxrA3cn7SqNHpb4CzoR2GVXgnlnCsYb&uniplatform=NZKPT (accessed on 29 May 2012).
- Gu, D. Foundations of Engineering Geomechanics of Rock Mass; Science Press: Beijing, China, 1979. [Google Scholar]
- Zhu, S.; Yin, Y.; Li, B. Shear creep behavior of soft interlayer in Permian carbonaceous shale. Rock Soil Mech. 2019, 40, 1377–1386, (In Chinese with English Abstract). [Google Scholar] [CrossRef]
- Chen, Q.; Zhou, D.; Feng, Z. Research on the Shear Creep Property of a Typical Weak Intercalation in Redbed Soft Rock. Chin. J. Rock Mech. Eng. 2009, 28, 3176–3180, (In Chinese with English Abstract). [Google Scholar] [CrossRef]


| Normal Stress/kPa | Shearing Stress/kPa | u0/mm | A | B | C | n | R2 |
|---|---|---|---|---|---|---|---|
| 100 | 7 | 6.5750×10⁻⁴ | 0.0026 | 17.6874 | 0.0037 | 0.3265 | 0.99 |
| 14 | 0.0022 | 0.0043 | 9.1325 | 0.0024 | 0.5170 | 0.99 | |
| 18 | 0.0040 | 0.0066 | 15.5837 | 0.0031 | 0.5658 | 0.99 | |
| 21 | 0.0066 | 0.0075 | 23.4534 | 0.0039 | 0.6226 | 0.99 | |
| 35 | 0.0086 | 0.0093 | 28.3479 | 0.0060 | 0.6357 | 0.99 | |
| 200 | 9 | 0.001 | 0.0099 | 0.8480 | 0.0047 | 0.2019 | 0.99 |
| 18 | 0.001 | 0.0078 | 0.7980 | 0.0060 | 0.2581 | 0.99 | |
| 27 | 0.001 | 0.0043 | 2.1471 | 0.0067 | 0.3353 | 0.99 | |
| 36 | 0.0015 | 0.0021 | 1.8468 | 0.009 | 0.3153 | 0.99 | |
| 45 | 0.0042 | 0.0089 | 1.4434 | 0.0032 | 0.5252 | 0.99 | |
| 54 | 0.0033 | 0.0096 | 1.2755 | 0.0029 | 0.5622 | 0.99 | |
| 63 | 0.0031 | 0.0077 | 1.8629 | 0.0036 | 0.5597 | 0.99 | |
| 72 | 0.0040 | 0.0076 | 2.4687 | 0.0034 | 0.6133 | 0.99 | |
| 81 | 0.0041 | 0.0101 | 1.9092 | 0.0022 | 0.7456 | 0.99 | |
| 90 | 0.0043 | 0.0130 | 1.2354 | 0.0016 | 0.8343 | 0.99 | |
| 99 | 0.004 | −52.2502 | 0.0016 | 0.0969 | 0.9556 | 0.91 |
| Normal Stress/kPa | Shearing Stress/kPa | Average Creep Rate/(10−2 mm·h−1) | Steady Creep Rate (10−2 mm·h−1) |
|---|---|---|---|
| 100 | 7 | 0.0125 | 0.0084 |
| 14 | 0.0214 | 0.0168 | |
| 18 | 0.0351 | 0.0287 | |
| 21 | 0.0583 | 0.0509 | |
| 35 | 0.0988 | 0.0892 | |
| 400 | 12 | 0.0107 | 0.006 |
| 24 | 0.0125 | 0.0077 | |
| 36 | 0.0167 | 0.0119 | |
| 48 | 0.0202 | 0.0155 | |
| 60 | 0.0238 | 0.0179 | |
| 72 | 0.0244 | 0.0185 | |
| 84 | 0.0268 | 0.0214 | |
| 96 | 0.0303 | 0.0250 | |
| 108 | 0.0333 | 0.0274 | |
| 120 | 0.0393 | 0.0328 | |
| 132 | 0.0452 | 0.0387 | |
| 144 | 0.0512 | 0.0441 | |
| 156 | 0.06 | 0.0488 |
| Normal Stress/kPa | a | b | R2 |
|---|---|---|---|
| 100 | 0.0125 | 0.06 | 0.91 |
| 200 | 0.0126 | 0.0199 | 0.99 |
| 300 | 0.0133 | 0.0208 | 0.97 |
| 400 | 0.0109 | 0.0108 | 0.99 |
| Normal Stress/kPa | c | d | R2 |
|---|---|---|---|
| 100 | 0.0096 | 0.0644 | 0.91 |
| 200 | 0.0068 | 0.0288 | 0.93 |
| 300 | 0.0133 | 0.0218 | 0.97 |
| 400 | 0.0077 | 0.0120 | 0.99 |
Disclaimer/Publisher’s Note: The statements, opinions and data contained in all publications are solely those of the individual author(s) and contributor(s) and not of MDPI and/or the editor(s). MDPI and/or the editor(s) disclaim responsibility for any injury to people or property resulting from any ideas, methods, instructions or products referred to in the content. |
© 2023 by the authors. Licensee MDPI, Basel, Switzerland. This article is an open access article distributed under the terms and conditions of the Creative Commons Attribution (CC BY) license (https://creativecommons.org/licenses/by/4.0/).
Share and Cite
Guo, P.; Zhang, J.; Liu, F.; Liu, W.; Wang, Z.; Chen, J. Experimental Study on Shear Creep and Long-Term Strength of Clay-Type Muddy Interlayer. Appl. Sci. 2023, 13, 12151. https://doi.org/10.3390/app132212151
Guo P, Zhang J, Liu F, Liu W, Wang Z, Chen J. Experimental Study on Shear Creep and Long-Term Strength of Clay-Type Muddy Interlayer. Applied Sciences. 2023; 13(22):12151. https://doi.org/10.3390/app132212151
Chicago/Turabian StyleGuo, Pengzheng, Jiaming Zhang, Fei Liu, Wenlian Liu, Zhiqiang Wang, and Jipu Chen. 2023. "Experimental Study on Shear Creep and Long-Term Strength of Clay-Type Muddy Interlayer" Applied Sciences 13, no. 22: 12151. https://doi.org/10.3390/app132212151
APA StyleGuo, P., Zhang, J., Liu, F., Liu, W., Wang, Z., & Chen, J. (2023). Experimental Study on Shear Creep and Long-Term Strength of Clay-Type Muddy Interlayer. Applied Sciences, 13(22), 12151. https://doi.org/10.3390/app132212151