Abstract
This study, conducted in the geological context of the Yixin coalfield, systematically performed indoor mechanical tests to analyze the impact of different stress conditions on the permeability of weakly cemented sandstone. The results were used to establish numerical simulations of permeability curves, revealing the following key findings. (1) After saturation, weakly cemented sandstone transitions from brittle to plastic failure. Numerical simulations closely matched experimental results, ensuring the accuracy of subsequent permeability simulations using the Hoek–Brown method. (2) Indoor permeability experiments identified a unique “√” shaped permeability curve for weakly cemented sandstone, differing from traditional sandstone. Numerical simulations confirmed this pattern and provided a basis for modeling weakly cemented strata under varying confining pressures. (3) The mesoscopic analysis of numerical simulation shows that that confining pressure limits the expansion of microcracks, while pore pressure causes cracks to develop from high- to low-pressure areas. Increasing pore pressure gradually raises permeability, and elevated confining pressure initially reduces, then increases permeability. (4) A damage parameter “D” was introduced to monitor fractures during compression simulations, showing that with increasing confining pressure, the damage parameter decreases and then sharply increases. Hydraulic pressure differentials directly correlated with the damage. This comprehensive study enhances our understanding of weakly cemented sandstone’s hydrological behavior under varying stress conditions and parameters.
1. Introduction
In the northwestern region of China, the widespread presence of highly water-bearing and weakly cemented sandstone layers poses significant challenges to mine construction [1]. These weakly cemented, high-water, and low-permeability sandstone formations are prone to disintegration when exposed to moisture due to their low degree of cementation and weak structural integrity. They exhibit a notable softening coefficient and are susceptible to shrinkage and cracking after dewatering [2]. These characteristics result in various issues during processes such as underground tunnel excavation, support operations, and coal mining, including significant rock deformation, rapid deformations, and pronounced rheological behavior [3,4,5]. These challenges not only jeopardize the safety of workers but also have the potential to impact the economic feasibility of mining operations. In recent times, numerical simulation methods have gained increasing prominence in the field of permeability testing for fractured rocks. Baghbanan [6], for instance, employed discrete fracture network models with varying sizes and trace lengths to investigate the influence of fracture aperture and trace length on fractured rock permeability. Li [7] developed a series of numerical models aimed at examining the permeability of concrete materials. Indraratna [8] utilized a combination of fracture network modeling and the discrete element method to analyze the coupling between seepage and stress processes, resulting in the establishment of a seepage–stress coupling model that integrates the seepage flow of rock masses. Kim and Jing [9,10] conducted a comprehensive study on the seepage–stress coupling in rock masses during excavation using a discontinuous deformation analysis approach. Geng, Wang, Chen, and Zhang [11,12,13,14] used acoustic emission and energy dissipation methods to analyze sandstones with different moisture levels. They found that the average cumulative acoustic emission energy release for dry and naturally occurring samples is significantly greater than for saturated samples. As the moisture content increases, the deformation mode of the sandstone gradually shifts from brittle to ductile. Liu [15] discovered that as the water content increases, the influence of pore water on the dissolution of mineral particles becomes more apparent, reducing the elastic storage limit of sandstone. Under the action of gradient cyclic loading, the same cyclic sandstone damage factor significantly increases.
Blessent integrated geological modeling with numerical simulations to calculate the seepage field of three-dimensional fractured rock masses. Cammarata, Cappa, and Guglielmi carried out numerical investigations into seepage–stress coupling using various techniques, including boundary element, discontinuous element, and continuous element methods [8,10,15].
Hence, gaining a comprehensive understanding of rock permeability is crucial for various aspects of mining operations, including site selection, design, planning, as well as research on rock behavior, and ground pressure control [16,17,18,19,20]. A lack of in-depth knowledge about rock permeability could increase the frequency of mining accidents.
Studying the permeability characteristics of weakly cemented strata in coal measures can deepen our understanding of rock stability under conditions involving water [21]. Analyzing the permeability changes of weakly cemented rock formations under different stress conditions helps identify the root causes of water seepage problems in practical scenarios [22]. This, in turn, enhances the mitigation of geological hazards in similar strata and holds significant theoretical implications for understanding the permeability characteristics and mine ground pressure behavior in weakly cemented strata in the western mining regions of China.
2. Materials and Methods
2.1. Water Softening Test of Rock
Through the study of the engineering geological conditions in the Yili mining area, it has been revealed that the coal-bearing strata in the Yili area are primarily composed of Jurassic and Early Precambrian mudstones, sandstones, and sandy mudstones. Due to their relatively young diagenetic age and low degree of cementation, these rock formations are considered typical weakly cemented strata [19,20,21].
The main mechanical parameters of weakly cemented sandstone specimens in their natural and saturated states were determined. The specimens were 100 mm in height and 50 mm in diameter. Uniaxial compression tests were conducted using displacement-controlled loading at a loading rate of 0.1 mm/min, and axial deformation of the specimen was monitored throughout the loading process. Tensile strength was determined using the Brazilian splitting method. Multiple measurements were performed for both saturated and natural rock states to obtain the average values. The measured mechanical parameters are listed in Table 1.

Table 1.
Main physical and mechanical parameters of rock and soil mass.
To study the effect of water on the failure mode and strength degradation of weakly cemented sandstone, it was found that the mechanical parameters of weakly cemented sandstone in its natural state are relatively lower compared to conventional rock types [22,23,24].
The stress–strain curves of weakly cemented sandstone in its natural and saturated states are shown in Figure 1. In its natural state, the stress–strain curve exhibits different stages of compaction, elasticity, yielding, and post-peak deformation. It can be observed that with the increase in axial stress, the specimen in its natural state rapidly loses strength after reaching the peak, displaying distinct brittle characteristics. The failure modes of the two rock types are different. From the stress–strain curve, it can be seen that during the pore compaction stage, the curve is convex, and the convex part of the rock significantly reduces before and after water saturation. After water treatment, the internal friction angle and cohesion of the rock noticeably decrease, leading to a different rock failure mode. Figure 1 also depicts the failure mode of weakly cemented sandstone, characterized by a single inclined shear failure plane. The uniaxial compressive strength decreases by 63.5% after saturation. Under saturated conditions, the maximum uniaxial compressive peak strength of weakly cemented sandstone is 4.5 MPa. It is evident that water has a significant weakening effect on the strength of weakly cemented sandstone.
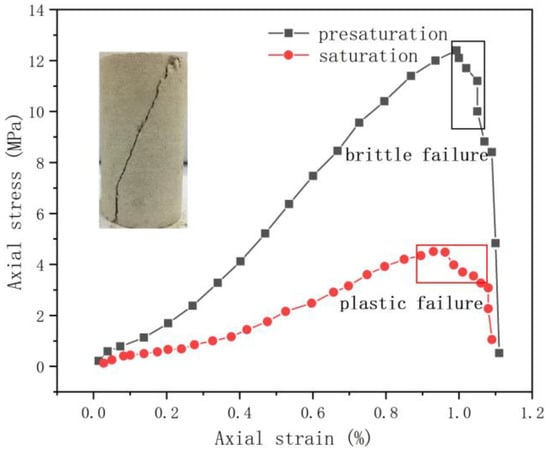
Figure 1.
Stress–strain curves and failure modes of sandstone.
To construct the numerical computational model, this research employed the UDEC 7.0 (Universal Distinct Element Code) software [25], which is founded upon the Discrete Element Method (DEM). UDEC possesses the capacity to simulate the mechanical behavior of rock masses under both static and dynamic loading conditions, encompassing phenomena such as block separation and rotation. The use of DEM allows for an effective analysis of the propagation patterns of internal fractures, and UDEC relies on these internal fractures to form predominant fluid pathways [26]. If finite element simulation is employed, it will be unable to accurately represent the fluid migration resulting from the presence of large-scale fractures. The sample is composed of numerous individual blocks and joints, with fluid percolating through these joints. [27], and the pore pressure difference is used as the basis for fluid migration”.
Based on the experimental data for the fundamental mechanical parameters, a UDEC numerical model was established. The model dimensions were set to 100 mm × 50 mm. Subsequently, the model was subjected to displacement-controlled loading at a rate of 0.1 mm/min from the top while the bottom boundary was fixed. Stress–strain curves were plotted using the monitoring points arranged in the model.
By integrating the mechanical parameters of weakly cemented sandstone obtained from experiments under natural conditions into the numerical model, the rock failure and stress–strain are compared. The trend of rock failure mode and stress–strain curve obtained by numerical simulation is basically consistent with the experimental results. The parameters used for UDEC simulation are shown in Table 2. Therefore, the deformation parameters of rock in natural state can be derived reliably. The consistency between numerical simulation and physical experiment lays a foundation for the numerical simulation of subsequent permeability experiments. The sandstone was subjected to uniaxial compression numerical simulations with boundary conditions set as a fixed bottom in the y-direction and a velocity boundary applied at the top for loading. Upon completion of the cycles, it was evident that the predominant fracture mode of the sandstone was a distinct single inclined shear failure. Figure 2 illustrates the stress–strain curves obtained from both experiments and numerical simulations. The numerical model was calibrated based on the mechanical test results from experiments.
Table 2.
Estimates of mechanical parameters of weakly consolidated sandstone.
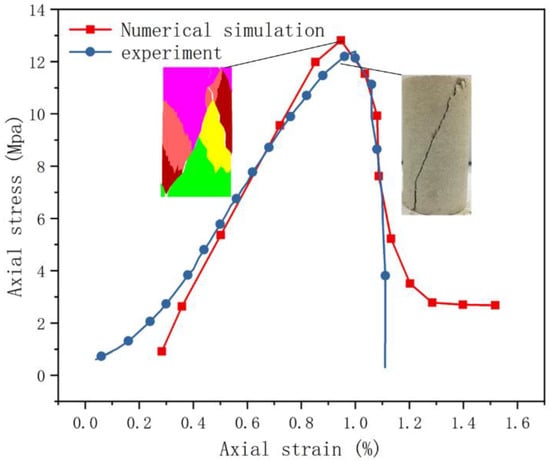
Figure 2.
Comparison between numerical model and experiment of sandstone.
The stress–strain curve from the numerical simulation may not completely capture the subtle differences during the compaction phase, as the curve is predominantly linear before reaching peak strength. From Figure 2, it can be observed that the sandstone has relatively low strength, with a maximum uniaxial compressive strength of 12.3 MPa. The peak uniaxial compressive strength obtained from numerical simulation is 13 MPa, with an error rate of 5.7%. The close alignment of the curve shapes indicates that the mechanical parameters of weakly cemented sandstone obtained from uniaxial tests can be effectively applied to permeability experiments, ensuring the accuracy of the test results.
2.2. Permeability Measuring Instrument
To study the permeability behavior of weakly cemented sandstone, quasi-triaxial permeability tests were conducted using the high-temperature and high-pressure rock triaxial testing system RTR-1000 (as shown in Figure 3). This system offers various functions, including: 1. rock mechanics testing system; 2. acoustic testing system; 3. rapid pulse decay permeability system; and 4. data acquisition software and modules.
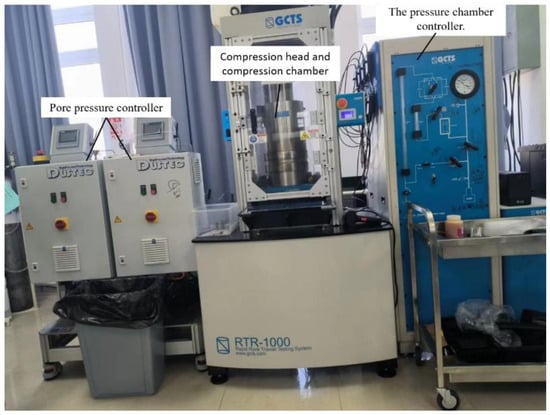
Figure 3.
Electro-hydraulic servo rock triaxial experimental system.
By combining these four methods, it is possible to simulate the changes in geological conditions for core samples (containing fluid) under different loads, confining pressures, and temperature environments, simulating in situ conditions of coal seams and surrounding rock [28]. The quasi-triaxial compression seepage tests were performed on the weakly cemented sandstone. The left section of the figure shows the pore pressure control chamber, which can change the pore pressure. The middle section houses the main testing machine, pressure chamber, and pressure heads. The right section contains the pressure chamber controller, which controls the filling and draining of the pressure chamber. The axial loading method used is displacement control with a confining pressure of 5 MPa. The steady-state method was used for the seepage tests to measure the changes in permeability of the weakly cemented sandstone under the influence of load, as shown in Figure 4.
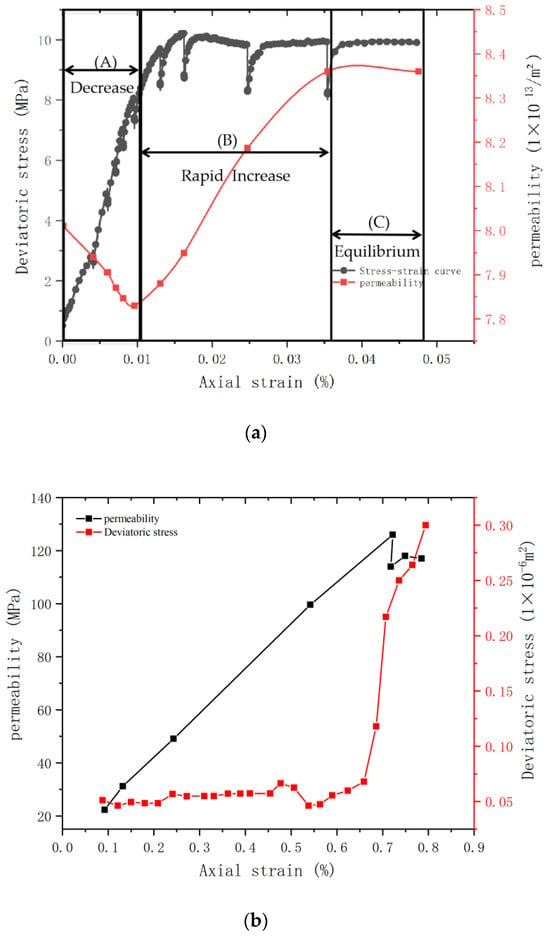
Figure 4.
Test results of mechanical properties and permeability of sandstone. (a) Weakly consolidated sandstone. (b) Conventional sandstone [2].
2.3. Estimation of Rock Deformation Parameters
At the end of last century, Hoek and Brown et al. modified the geological strength index GSI, summarized the stored rock mechanics test data, and summarized the narrow Hoek–Brown strength criterion [29,30]. After that, Hoek introduced rock mass disturbance coefficient D (the value range is 0–1 according to the disturbance degree) and proposed the generalized Hoek–Brown strength criterion through the comprehensive analysis of biaxial test data and the internal structure of rock mass.
where σ1 is the maximum effective principal stress (MPa) at the time of rock failure; σ3 is the minimum effective principal stress (MPa) of rock failure. σci is the uniaxial compressive strength of rock (MPa). mb, s, and a are Hoek–Brown constants. mb is the rock material constant, which can be obtained by experiment [31].
The internal friction Angle and equivalent cohesion c of rock mass can be obtained by the formula.
where , is the upper limit of minimum principal stress of rock mass.
The rock deformation modulus Et is calculated using the following formula. Where Ee is the elastic modulus (GPa) of the intact rock in the laboratory.
where D is the disturbance coefficient and GSI is the geological intensity index.
The elastic modulus Et in the above formula can be used to calculate the parameters required in the numerical simulation, namely, the rock mass shear modulus G and the bulk modulus K.
In this section, the Hoek–Brown criterion is used to estimate rock deformation parameters, which is intended to prepare for the establishment of the seepage numerical simulation model in the next chapter. The obtained rock mass mechanical parameters are shown in Table 2.
3. Test Results and Analysis
3.1. Seepage Result of Weakly Consolidated Sandstone
The variation in permeability is depicted in Figure 4a, which can be divided into three distinct stages.
- (a)
- Stage of Steady Permeability Decrease: During the initial loading phase, as the deviatoric stress increases, permeability gradually decreases. In this stage, the internal rock pores are compacted, pore sizes reduce, and the fluid’s ability to flow weakens, resulting in reduced permeability. The fundamental reason for the early decrease in permeability is the compaction of weakly cemented rock’s internal porosity and the reduction in pore size during triaxial compression.
- (b)
- Stage of Rapid Permeability Increase: In this stage, the rock undergoes stress-induced failure, reaching its peak strength. Primary cracks widen, secondary cracks significantly extend, and they become interconnected, leading to a substantial increase in permeability.
- (c)
- Stage of Equilibrium Permeability: When the axial stress on the rock specimen reaches a certain level, the changes in internal cracks become less pronounced, and permeability tends to stabilize. The evolution of permeability in weakly cemented sandstone samples exhibits distinct stages, which are crucial for understanding the rock’s response to stress and its impact on fluid flow behavior.
When deviatoric stress increases from 1 MPa to 5 MPa, the permeability of weakly cemented sandstone decreases from 8.01 × 10⁻¹³ m2 to 7.85 × 10⁻¹³ m2, representing a 2% decrease. Subsequently, as deviatoric stress continues to rise from 5 MPa to 9 MPa, permeability increases from 7.85 × 10⁻¹³ m2 to 8.34 × 10⁻¹³ m2, marking a significant 7.6% increase. Beyond 9 MPa, as deviatoric stress further increases, permeability remains nearly constant at 8.35 × 10⁻¹³ m2, showing no significant changes. The trend of the permeability curve can be approximated as a “√” shape.
It is important to note that permeability experiments for weakly cemented sandstone require prior saturation, which differs from conventional sandstone. In conventional sandstone, permeability gradually decreases during the compression process, sharply increasing after rock failure, as shown in Figure 4b.
For weakly cemented sandstone, the two inflection points in permeability occur during the plastic deformation and failure stages. A significant difference is the absence of a stress decrease stage after peak strength, which may be attributed to the expansive nature of weakly cemented sandstone having a more substantial impact on the stress–strain curve’s descent. This behavior is consistent with prior findings in this study, indicating that weakly cemented sandstone undergoes a transition from brittle to ductile behavior after saturation, resulting in a gradual increase in permeability before reaching peak strength. The results suggest that deviatoric stress significantly influences permeability, gradually decreasing in the early stages, followed by a sharp increase and eventual stabilization of permeability.
3.2. Seepage Model Building Scheme
To investigate the fluid flow characteristics of weakly cemented sandstone under various confining pressures, pore pressures, and deviatoric stresses, numerical simulations were performed using the UDEC 7.0 software, and the physical mechanical parameters obtained from laboratory tests were incorporated into the model.
The numerical simulations utilized the steady-state flow method provided by the software. Pressure differentials were applied at the upper and lower boundaries of the rock sample, while monitoring the average flow rate, Q.
The numerical simulation model employed displacement loading with a velocity of 0.1 mm/s. The bottom boundary was fixed in the y-direction, and the left and right boundaries were impermeable, while the top and bottom boundaries were permeable. Different pore pressure differentials, confining pressures, and deviatoric stress conditions for weakly cemented sandstone were recorded by altering the top boundary pore pressure, As shown in Figure 5.
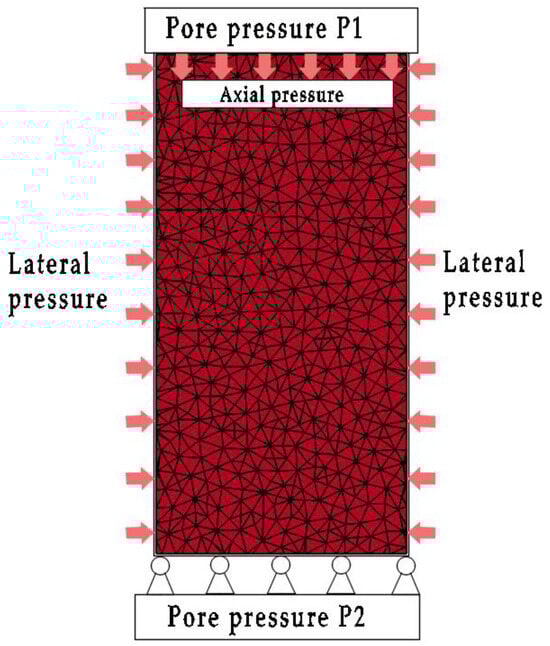
Figure 5.
Schematic diagram of seepage model.
The initial parameters of the model are shown in Table 3, with some mechanical parameters already optimized based on previous research [32].
Table 3.
Joint surface mechanical parameters of the numerical model.
Permeability Calculation Method
Numerous factors influence permeability, including rock properties, particle size, composition, particle arrangement, filling status, crack characteristics, and development degree. Pore size plays a predominant role [25], with data obtained from permeability experiments being valid only when flow reaches a steady state. In physical experiments, the steady state of flow conditions is determined based on the equilibrium of pore pressure at the top and bottom of the rock specimen, ensuring that no changes occur. Additionally, the flow rates at the top and bottom of the specimen should be equal, meaning that the inflow equals the outflow. At this point, flow conditions have reached equilibrium, allowing for accurate permeability calculations [33,34,35,36,37].
In numerical simulations, it is possible to monitor pore pressure, flow velocity, and other data using code inputs to assess whether flow has reached a steady state [29]. The simulation in this experiment focuses on changes in permeability in the final equilibrium state and does not provide a detailed study of permeability throughout the entire loading process.
Darcy’s law is used to calculate liquid permeability, and the formula is as follows:
where K is permeability; μ is the dynamic viscosity coefficient of the liquid, taking μ = 1.005 × 10⁻³ Pa·s; L is the height of the rock 0.1 m; Q is the flow rate of fluid through the rock per unit time; A is the cross-sectional area of the rock; and ∆P is the difference in pore-pressure at both ends of the rock.
In UDEC, the model block is impervious to water, and fluid can only migrate in the joint, as shown in Figure 6. The inter-plane fluid flow in the model is calculated by the following formula:
kj is the permeability factor of the joint, the theoretical value is 1/12 μ. μ is the fluid viscosity coefficient = 83.3. a is the joint aperture a = a0 + un; a0 is the joint aperture under no pressure; un is the normal displacement between the joints. L is the length of the joint between regions; ∆P is the difference in pore-pressure at both ends of the rock.
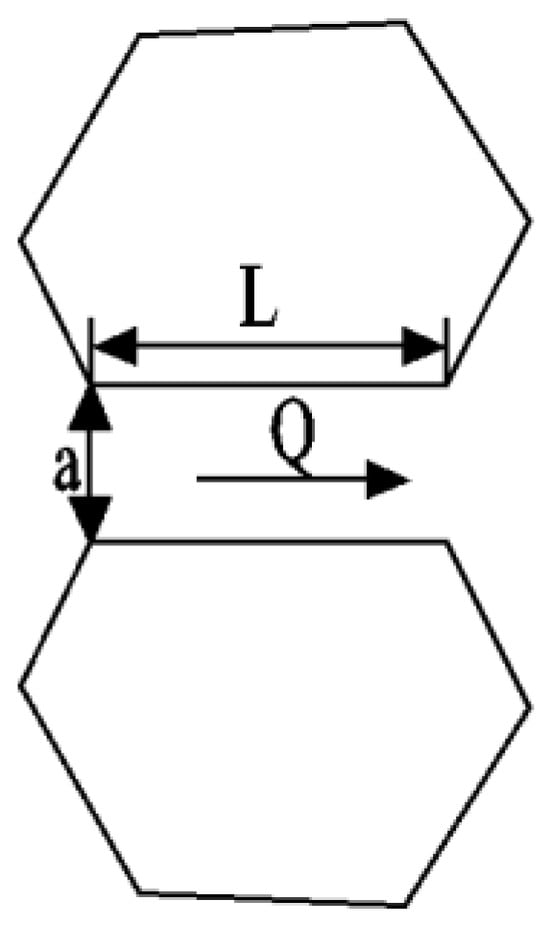
Figure 6.
Diagrammatic Representation of Joint Interstitial Flow.
3.3. Comparative Analysis of Experiment and Numerical Simulation
During the experimental process, we applied a confining pressure of 5 MPa to weakly cemented sandstone samples and measured their permeability under various stress conditions using a permeability testing instrument. Concurrently, numerical simulations were conducted under the same stress conditions to fit the permeability of the samples.
In the initial phase, as the confining pressure was applied, the permeability of weakly cemented sandstone exhibited a certain degree of reduction. This decrease occurred because, under the influence of the confining pressure, the pores within the rock were compressed, leading to a decrease in the effective cross-sectional area of pore channels, resulting in decreased permeability. The reduction in this stage is primarily influenced by pore structure and cementation degree.
With further increases in stress, when a certain critical threshold is reached, the permeability of weakly cemented sandstone sharply increases. This sudden increase is attributed to the destruction of cementitious material at high stress levels, which causes pore channels to reopen, thereby increasing the effective cross-sectional area and rapidly elevating the permeability. The permeability increase during this stage is mainly influenced by rock fracturing and damage behavior.
Subsequently, as stress levels continue to rise, the permeability of weakly cemented sandstone tends to stabilize. In high-stress conditions, the internal pore channels of the rock have essentially reopened, and the changes in permeability reach a stable state. At this point, the rock’s permeability is jointly influenced by cementitious material and pore structure.
By comparing the experimental results under 5 MPa (As shown in Figure 7) confining pressure with the numerical simulation results, the feasibility of numerical simulations was validated. The experimental and numerical simulation results exhibit a good fit, displaying largely similar trends. This provides crucial reference and guidance for further research and the assessment of rock permeability in engineering practice.
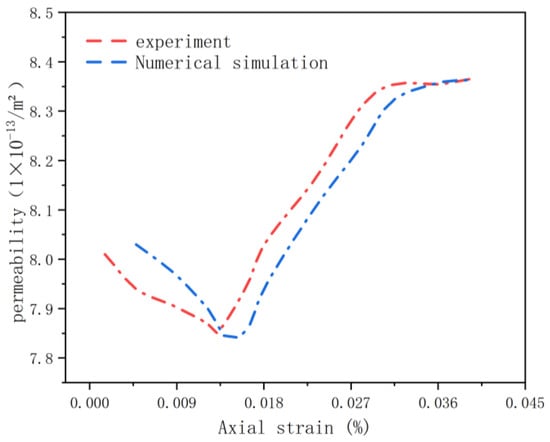
Figure 7.
Permeability contrast curve.
3.4. Permeability Variation under Different Stress States
Building upon the discussion of the triaxial permeability curve at a confining pressure of 5 MPa in the previous section, a simulation study was conducted to investigate the permeability trends under different confining pressures. Referring to the results from the previous section, we consider that the numerical simulation has produced valid outcomes, enabling us to infer the trends in permeability under varying confining pressures.
As depicted in Figure 8, with the increase in confining pressure, permeability shows an overall decreasing trend. The research findings indicate that increasing confining pressure leads to a reduction in permeability for weakly cemented sandstone.
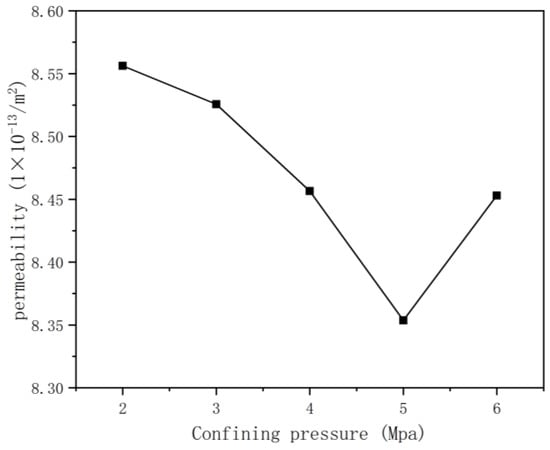
Figure 8.
Influence of confining pressure on permeability.
Furthermore, through a detailed analysis of the permeability variations under different confining pressures, it was observed that increasing confining pressure leads to a decrease in permeability for weakly cemented sandstone. Under a confining pressure of 5 MPa, a comprehensive validation of the numerical simulation results was conducted by comparing them with experimental data. This validation process confirmed the feasibility and reliability of the numerical simulations.
Figure 9 illustrates the variation in permeability of weakly cemented sandstone under increasing confining and axial pressures. The primary aim of this experiment is to investigate the behavior of permeability in weakly cemented sandstone as deviatoric stress increases and analyze the trend of permeability within the range from 0 to 35 MPa deviatoric stress.
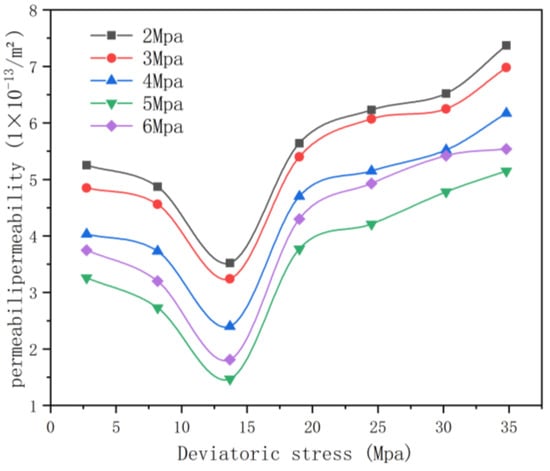
Figure 9.
Permeability changes under different confining pressures.
From Figure 9, it is evident that within the deviatoric stress range from 0 to 10 MPa, the permeability curve shows an overall decreasing trend. In other words, as deviatoric stress increases, permeability gradually decreases. However, an intriguing phenomenon occurs when deviatoric stress rises from 10 MPa to 15 MPa—the permeability significantly increases. This specific behavior can be attributed to the specimen reaching its peak strength, initiating crack propagation and internal interconnection, leading to severe damage and a rapid increase in permeability. Subsequently, with the increase in axial pressure, permeability gradually rises moderately.
In summary, Figure 9’s permeability curve exhibits a trend of initially decreasing and then increasing with rising confining pressure. These findings hold significant practical implications for mining and geological engineering, providing valuable reference points for applications in related fields.
4. Discussion
4.1. Joint and Pore Size Development Characteristics
To provide a more comprehensive analysis of the permeability variations in weakly cemented sandstone, this study further conducted numerical simulations to analyze the influence of internal jointing and apertures within the rock. In this section, we will analyze the internal jointing and apertures of weakly cemented sandstone under varying confining pressures.
By analyzing the impact of internal jointing and apertures on permeability, we can gain further insights into the permeability changes in weakly cemented sandstone. Combined with the earlier findings related to confining pressure changes and the results under 5 MPa confining pressure, we can assess the relative significance of different factors in permeability variations. This will provide more accurate guidance for rock engineering design and practice. Through this comprehensive analysis, a better understanding of the permeability characteristics of weakly cemented sandstone can be achieved, offering a more reliable basis for permeability assessment and prediction in rock engineering. In UDEC numerical simulations, the influence of the pressure difference on jointing and apertures is manifested in several aspects. (1) Joint Opening and Closure: the pressure difference causes joints or fractures to open or close. When fluid flows from a high-pressure area to a low-pressure area, if the fluid pressure exceeds the stress on both sides of the joint, the joint may further open. Conversely, if the fluid pressure is lower than the stress on both sides of the joint, the joint may close. This phenomenon is especially evident in joint systems. (2) Aperture Changes: apertures change due to the pressure difference. If the fluid pressure in the pore exceeds the stress of the surrounding rock, it can lead to aperture enlargement. Conversely, if the pressure is lower than the surrounding rock stress, it may result in aperture contraction. (3) Permeability Changes: joint opening and aperture changes further impact the material’s permeability. If joints open or apertures expand, permeability may increase; conversely, if joints close or apertures shrink, permeability may decrease.
The rock’s interior contains various pores and fractures of varying sizes. These pores and fractures can change under different stresses and varying pore pressure conditions, leading to rock softening, deformation, and failure, thereby compromising the stability of the rock [25]. The development of fractures under pore pressure difference differs from the development of joints in conventional specimens under compressive conditions. In the conventional state, fractures within the specimen tend to develop more uniformly, predominantly from the upper and lower ends toward the middle, resulting in connected through-going fractures. In contrast, under pore pressure conditions, as shown in Figure 10, the pressure difference gradually spreads from the top to the bottom. This leads to higher stress conditions at the top, with less influence at the bottom. Consequently, the pattern of fracture development primarily focuses on the upper half of the model and then extends downward. Moreover, most of the joints are in a shear failure state, indicating that when fluid pressure exceeds the stress on both sides of the joint, the joint may further open.
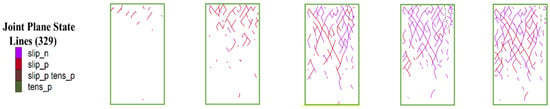
Figure 10.
Joint development law in the process of pore-compression.
In UDEC, fluid flows through joint surfaces, and the orientation and characteristics of these surfaces can have a significant impact on permeability [29]. In particular, the extent of joint opening can change due to the application of mechanical conditions, and fluid pressure within the joints can affect the mechanical calculations. When the internal joint apertures reach their minimum size, changes in mechanical conditions will no longer affect the variation in permeability.
Figure 11 illustrates the pattern of changes in apertures as the pore pressure difference increases. As seen in the figure, with an increase in pore pressure, the contact aperture gradually enlarges. When the pore pressure increases from 0 MPa to 1 MPa, some vertical contact apertures within the model expand, and due to the application of stresses on both sides, the lateral contact apertures within the model almost entirely close. As the pore pressure increases from 1 MPa to 2 MPa, the connectivity of the contact apertures expands, resulting in more apertures that traverse the entire model. When the pore pressure increases from 2 MPa to 3 MPa, most of the joint contact apertures reach their maximum size. These observations indicate that there is a certain regularity in the changes in apertures as the pore pressure difference increases. Especially when the pore pressure difference reaches a certain value, the connectivity of the apertures significantly improves.
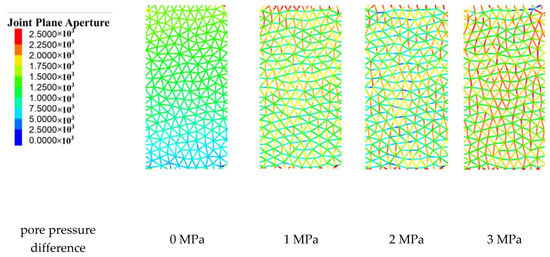
Figure 11.
Changes of pore size under different pore-pressure.
As the normal stiffness is a critical factor influencing the stress response of rocks, we conducted an in-depth analysis of its effects. When rocks possess a higher normal stiffness, their response to stress becomes stiffer, meaning they deform less under pressure. This high level of stiffness response results in more noticeable closure of the internal rock pores, consequently reducing permeability. By varying the normal stiffness parameter, our study revealed its varying impact on permeability. Specifically, as shown in Figure 12, when the normal stiffness increases from 100 GPa to 500 GPa, the permeability rapidly decreases. Subsequently, as the normal stiffness increases from 500 GPa to 1000 GPa, the rate of permeability reduction slows down. Finally, increasing the normal stiffness from 1000 GPa to 2000 GPa results in a slight decrease in permeability, but with minimal further change. Therefore, we recommend selecting a normal stiffness value of 1000 GPa or higher for model studies to minimize its impact on the overall model properties, which is more in line with real-world conditions.
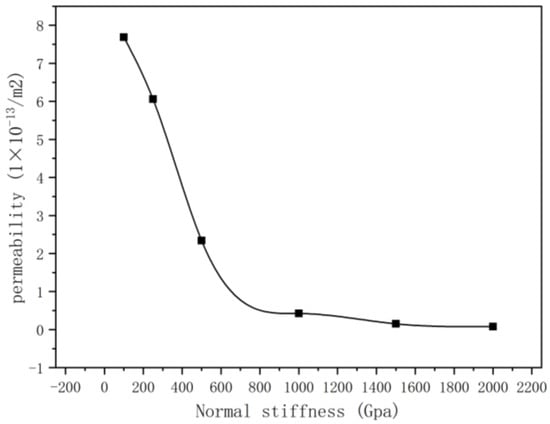
Figure 12.
Influence of normal stiffness on permeability.
4.2. Effect of Stress State on Hydraulic Openness and Permeability
Hydraulic opening refers to the extent of internal joint openings within a rock subjected to pressure. In this section, percolation tests were conducted on models under confining pressures of 2 MPa, 4 MPa, and 6 MPa (As shown in Figure 13), with the average hydraulic opening recorded for deviatoric stresses ranging from 0 to 30 MPa. The test results reveal a negative correlation between the hydraulic opening and confining pressure, with the hydraulic opening decreasing as confining pressure increases. Simultaneously, the joint hydraulic opening diminishes as the deviatoric stress rises.
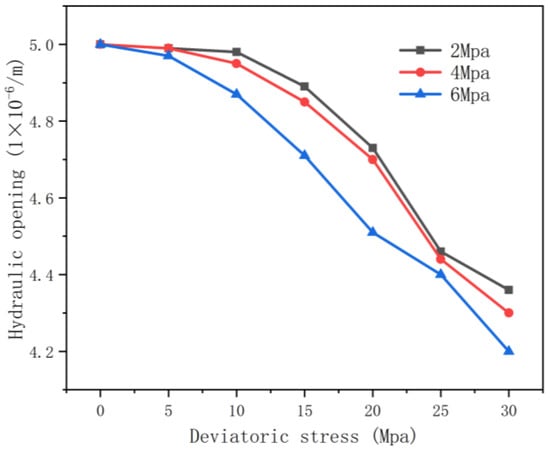
Figure 13.
Variation in hydraulic opening under stress.
Increasing the confining pressure renders the model more sensitive to the influence of deviating stress, resulting in a more pronounced decrease. Under a deviatoric stress of 0, the average hydraulic openness of the rocks at the three confining pressures remains roughly equal, indicating an undamaged state. As deviating stress increases, hydraulic opening gradually decreases, following a parabolic curve, with the most significant decrease occurring in the range of 20–25 MPa.
Numerical models of weakly cemented sandstone were tested under various pore pressure conditions. Permeability was calculated by measuring the average flow velocity of each model once they reached pore pressure equilibrium. The relationship between the pore pressure difference and permeability is depicted in Figure 14. At pore pressure differences of 1 MPa and 6 MPa, the permeability values are 1.52 × 10⁻¹⁶ m2 and 5.26 × 10⁻¹⁶ m2, respectively. The results indicate that the permeability curve generally increases with an increase in the pore pressure difference. As the pore pressure difference escalates from 1 MPa to 6 MPa, the model’s permeability increases by a factor of 2.46, signifying a significant impact of pore pressure on permeability.
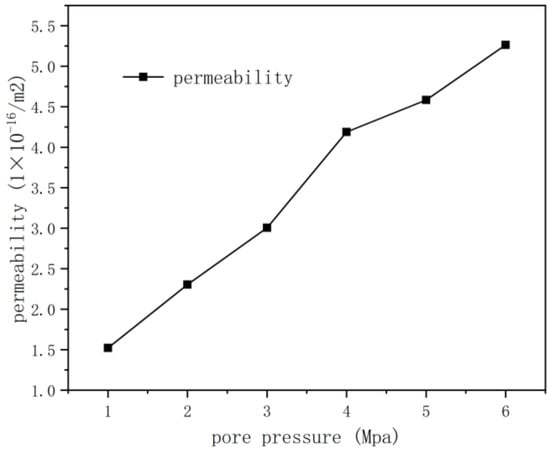
Figure 14.
Permeability variation rule under pore-pressure difference.
4.3. Study on Damage Regularity of Weakly Consolidated Sandstone
The previous chapters provided an in-depth examination of the permeability characteristics of weakly cemented sandstone under various stress conditions. These studies have revealed a close relationship between rock permeability and stress states, offering valuable insights for rock engineering design and practice. However, changes in permeability are just one aspect of understanding rock behavior.
To gain a comprehensive understanding of how weakly cemented sandstone behaves under stress, it is essential to further investigate its damage patterns. As rocks experience stress, they undergo internal damage and fracture, significantly impacting their mechanical properties and permeability. Therefore, studying the influence of stress states on the damage evolution of weakly cemented sandstone becomes imperative.
The subsequent chapters will delve into the influence of stress states on the damage patterns of weakly cemented sandstone. This paper employs a combined approach of experiments and numerical simulations to systematically study features like crack propagation and alterations in rock strength under different stress conditions. Through a deeper understanding of damage evolution patterns, it will be possible to uncover the intrinsic behavior of weakly cemented sandstone under stress states, offering a more reliable foundation for reliability assessment and prediction in rock engineering.
Through this study, a valuable contribution is made to the advancement of rock mechanics and rock engineering, providing a scientific basis and guidance for practical engineering applications to ensure safety, reliability, and sustainable development of engineering projects.
In UDEC, the definition of the damage variable typically depends on the specific damage model and the research context. For instance, in certain models, the damage variable can be defined as a parameter associated with factors like fracturing, micro-cracks, and porosity, reflecting a reduction in the damage zone elements or a decrease in the material stiffness. This variable’s value changes as new cracks appear during the simulation process. In this paper, damage variable D is defined, and its value increases with the occurrence of new cracks during the simulation. The extent of material damage can be measured by comparing D values at the beginning and the end of the simulation. D is defined as the total number of new cracks that occur during the simulation. To track and record new cracks during the simulation process, a custom FISH function (FISH being a built-in programming language in UDEC) needs to be developed to monitor crack generation, and then these functions are used to calculate the value of D.
During the uniaxial compression of weakly cemented sandstone under different confining pressures, the expansion of micro-crack numbers in the specimen is illustrated in Figure 15. Throughout the compression process, shear cracks predominate while tensile cracks play a secondary role. It is evident that the development of micro-cracks in weakly cemented sandstone is closely related to variations in confining pressure.
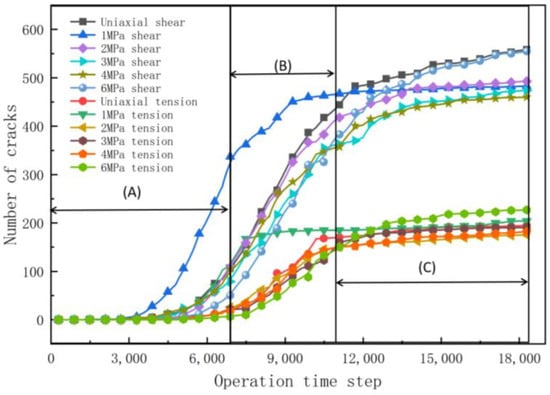
Figure 15.
Number of cracks under different confining pressures.
It can be seen from Figure 15 that the number of fractures in the weakly consolidated sandstones with different confining pressures during uniaxial compression can be roughly divided into three stages as the calculation steps increase: slow increase stage, rapid increase stage, and stable development stage after failure. The three stages correspond to the microfracture development stage of microfracture change, the fracture instability development stage, and the post-failure stage, respectively.
Figure 16 illustrates the total number of cracks formed under various confining pressures. Within the range from 0 MPa to 4 MPa confining pressure, there is a gradual decrease in the total number of cracks as the confining pressure increases. However, with a 6 MPa increase in the confining pressure, the total number of cracks surpasses that observed under 0–5 MPa confining pressures. This could be attributed to specimen crushing under the excessive confining pressure and the subsequent development of new transverse cracks.
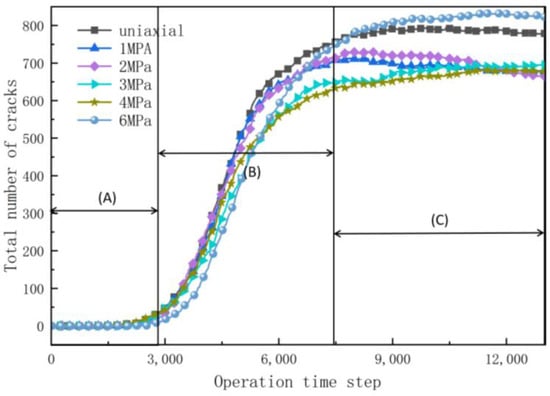
Figure 16.
Fracture development statistics under different confining pressures.
The findings of the abovementioned studies indicate that rocks may experience both tensile and shear failures under triaxial compression. In the UDEC model, the failure strength parameter for shear cracks is often higher than that for tension cracks. This leads to differing conditions and challenges for tensile and shear crack failures. Consequently, this paper enhances the expression of the damage variable, considering it as a combination of tensile and shear damage, as follows:
In the equation, Ns and Nt represent the numbers of tensile and shear cracks in the rock under different confining pressures, where Ns stands for the total potential tensile cracks and Nt represents the total potential shear cracks. γ is the modification coefficient for the damage variable.
In the definition of the damage variable under different confining pressures, setting the damage variable at the maximum confining pressure (6 MPa) to 1 allows for a more effective comparison of the extent of damage under various confining pressures. However, it is crucial to emphasize that this normalization operation does not alter the actual degree of damage but merely scales the data for the sake of analysis and comprehension.
As shown in Figure 17, variations in rock damage under different confining pressure conditions can be observed. Within the confining pressure range from 1 to 4 MPa, the damage variable of weakly cemented sandstone exhibits a decreasing trend, indicating better rock stability and compressive strength within this pressure range. However, as the confining pressure increases from 4 MPa to 5 MPa, the damage variable slightly increases, suggesting that the rock begins to exhibit more noticeable damage under this confining pressure. It is of particular note that, when the confining pressure increases to 6 MPa, the rock’s damage variable sharply rises. This may imply that at this pressure level, the structural stability and compressive strength of weakly cemented sandstone significantly decrease, leading to a significantly increased likelihood of rock damage. This change reflects the rock’s damage and failure patterns under varying confining pressure conditions.
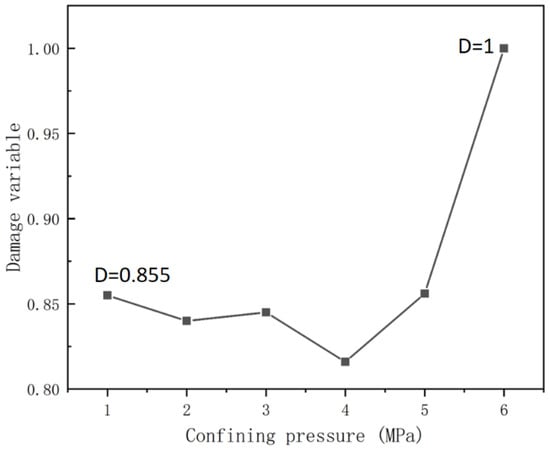
Figure 17.
Changes in rock damage variable D under different confining pressures.
Figure 18 illustrates the variation in rock damage parameter “D” under different hydraulic pressure differentials. Through numerical simulations using the UDEC framework, several insights into the relationship between the damage parameter and permeability amplification in weakly cemented sandstone under the influence of hydraulic pressure differentials have been gained. The following patterns have emerged. At lower permeability levels, the simulation results may exhibit relatively modest values for the rock’s damage parameter, aligning with theoretical models as expected. As the simulated hydraulic pressure gradually increases, the damage parameter may start to rise. With further increments in permeability during the simulation, there is a significant surge in the rock’s damage parameter. This surge is driven by internal hydraulic pressures that initiate the extension and interconnection of fissures, thereby exacerbating the rock’s state of deterioration.
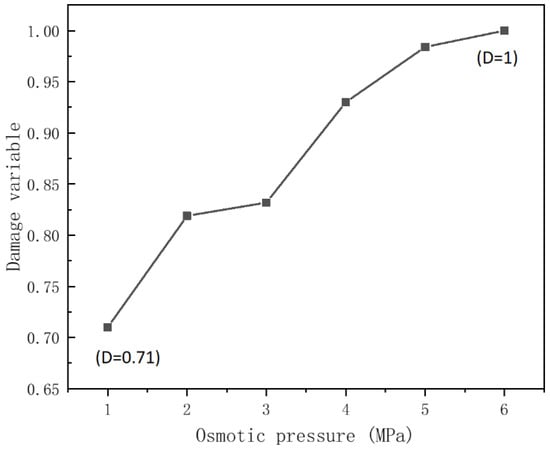
Figure 18.
Changes of rock damage variable D under pore- pressure difference.
Upon reaching elevated levels of permeability, simulations may demonstrate the pinnacle of the rock’s damage parameter, subsequently stabilizing. This occurrence signifies that the rock has undergone profound fragmentation and disintegration, potentially leading to fundamental reconfigurations in its internal structure and physical properties.
By investigating the permeability characteristics of weakly cemented sandstone, we gain insights into water infiltration dynamics within rock formations, providing a scientific foundation for the exploration and exploitation of subsurface water reservoirs. The research findings mentioned in the paper, including the patterns of permeability changes, features of joint and pore evolution, and the interplay between hydraulic apertures and permeability, offer practical guidance for water resource development and management. This insight can be valuable in designating protected water source zones and optimizing well placement strategies.
5. Conclusions
This study involved mechanical testing of weakly cemented sandstone under both saturated and unsaturated conditions. It utilized experimentally derived mechanical parameters to establish a numerical simulation model, which was employed to analyze changes in the physical and mechanical properties of weakly cemented sandstone when exposed to water. Additionally, numerical simulations were used to fit and the compare permeability curves with indoor permeability experiments. The study aimed to analyze the reasons for changes in permeability under different stress conditions and explore the associated flow characteristics. The main conclusions are as follows:
- (1)
- After being saturated with water, weakly cemented sandstone experiences a significant reduction in uniaxial compressive strength, accompanied by a transition from brittle to plastic failure. The stress–strain curves from numerical simulations closely matched the experimental results. The use of the Hoek—Brown method for estimating rock deformation parameters ensured the accuracy of subsequent permeability simulations.
- (2)
- Indoor permeability experiments revealed a distinctive pattern in the permeability curve of weakly cemented sandstone, which differed from conventional sandstone. The permeability curve exhibited a trend resembling a “√,” characterized by an initial gradual reduction, followed by an increase, and eventual stabilization. The stress–strain curve did not exhibit a stress-drop phase after reaching peak strength. The numerical simulation results showed excellent agreement with the experimental outcomes. Subsequently, simulations of permeability curves under varying confining pressures were conducted, revealing a trend of initial reduction followed by an increase, providing a foundational basis for the development and analysis of numerical models related to weakly cemented strata.
- (3)
- An analysis of the causes of changes in permeability from a pore perspective indicated that confining pressure restricted the expansion of micro-cracks in the rock. Pore pressure prompted the development of fractures, starting in high-pressure areas and extending to low-pressure areas. Permeability gradually increased with rising pore pressure, while increased confining pressure led to a decrease and subsequent increase in permeability for weakly cemented sandstone. Axial compression initially reduced permeability before gradually increasing it. In numerical simulations, the value of normal stiffness showed a negative correlation with permeability before stabilizing.
- (4)
- Using programming to monitor the quantity of fissures during the compression numerical simulation, a damage parameter ‘D’ was introduced, refining the expression of the damage parameter. It was observed that, with increasing confining pressure, the damage parameter initially decreased and then rapidly increased. Additionally, the magnitude of the hydraulic pressure differential exhibited a direct proportional correlation with the damage parameter.
This comprehensive exploration provides valuable insights into the complex interplay between hydraulic pressure, mechanical properties, and the dynamics of permeability in weakly cemented sandstone. In the end, we have deepened our understanding of the hydraulic characteristics under varying stress conditions..
Author Contributions
Conceptualization, W.Z., H.L. and M.C.; methodology, W.Z., H.L. and M.C.; software, W.Z. and H.L.; validation, W.Z., X.L. and Z.C.; investigation, W.Z., W.C. and Z.C.; data curation, W.Z. and H.L.; writing—original draft preparation, W.Z. and H.L.; writing—review and editing, W.Z., H.L. and Z.C. All authors have read and agreed to the published version of the manuscript.
Funding
This research was funded by the National Natural Science Foundation of China, grant numbers 51964043; sponsored by Natural Science Foundation of Xinjiang Uyghur Autonomous Region (2022D01E31); Xinjiang Uygur Autonomous Region “Tianshan Talent Training” Program (2022TSYCCX0037); Xinjiang Uygur Autonomous Region Special Program for Key R&D Tasks (2022B01034, 2022B01051). National Natural Science Foundation—Xinjiang Joint Fund Key Project, Xinjiang Large-scale Open-pit Mine Green, Safe and Efficient Mining Technology, U1903216.
Institutional Review Board Statement
Not applicable.
Informed Consent Statement
Not applicable.
Data Availability Statement
The research data used to support the findings of this study are currently under embargo while the research findings are commercialized. Requests for data, 12 months after publication of this article, will be considered by the corresponding author.
Acknowledgments
The author would like to thank H.L. for her continuous support in data and writing of the paper.
Conflicts of Interest
Author Xinyong Liu was employed by the Urumqi Juhe Chuangxing Technology Consulting Co., Ltd. The remaining authors declare that the research was conducted in the absence of any commercial or financial relationships that could be construed as a potential conflict of interest.
References
- Zhao, W.S.; Liang, W. Influence of formation water content on the stability of surrounding rock of weakly consolidated soft rock roadway: A case study of Wujianfang Xiyi Coal Mine in Inner Mongolia. China Min. Ind. 2019, 29, 154–159. [Google Scholar] [CrossRef]
- Li, T.C.; Lu, Z. Analysis of deformation and failure process of rectangular roadway in muddy weakly cemented soft rock formation. Rock Soil Mech. 2014, 35, 1077–1083. [Google Scholar] [CrossRef]
- Liang, J.; Wang, Q. Experimental study on mechanics and permeability characteristics of Jurassic red sandstone under seepage-stress coupling. Bull. Geol. Sci. Technol. 2023, 42, 52–61. [Google Scholar] [CrossRef]
- Hashemnejad, A.; Aghda, S.M.F. Introducing a new classification of soft rocks based on the main geological and engineering aspects. Bull. Eng. Geol. Environ. 2021, 80, 4235–4254. [Google Scholar] [CrossRef]
- Qin, L.; Sun, Y.J. Experimental Study on Seepage Characteristics of Jurassic Weakly Cemented Sandstone under Water-Rock Interaction. Geofluids 2020, 2020, 8543687. [Google Scholar] [CrossRef]
- Baghbanan, A.; Jing, L. Hydraulic properties of fractured rock masses with correlated fracture length and aperture. Int. J. Rock Mech. Min. 2007, 44, 704–719. [Google Scholar] [CrossRef]
- Li, X.; Xu, Q.; Chen, S. An experimental and numerical study on water permeability of concrete. Constr. Build Mater. 2016, 105, 503–510. [Google Scholar] [CrossRef]
- Indraratna, B. Hydromechanical aspects of jointed rock media. In Proceedings of the 8th ISRM Congress, Tokyo, Japan, 25 September 1995; International Society for Rock Mechanics: Lisbon, Portugal, 1995. [Google Scholar]
- Jing, L.; Ma, Y.; Fang, Z. Modeling of fluid flow and solid deformation for fractured rocks with discontinuous deformation analysis (DDA) method. Int. J. Rock Mech. Min. 2001, 38, 343–355. [Google Scholar] [CrossRef]
- Kim, Y.I.; Amadei, B.; Pan, E. Modeling the effect of water, excavation sequence and rock reinforcement with discontinuous deformation analysis. Int. J. Rock Mech. Min. 1999, 36, 949–970. [Google Scholar] [CrossRef]
- Geng, J.; Cao, L. Failure analysis of water-bearing sandstone using acoustic emission and energy dissipation. Eng. Fract. Mech. 2020, 231, 107021. [Google Scholar] [CrossRef]
- Wang, H.; Li, J.; Guo, Q.; Shi, R.; Zhao, Z.; Zhang, Y.; Zhao, F. Experimental study on the influence of water on the failure properties of sandstone. Bull. Eng. Geol. Environ. 2021, 80, 7747–7771. [Google Scholar] [CrossRef]
- Zhang, H.; Lu, K.; Zhang, W.; Zhou, Y.; Yang, G.; Li, J.; Huang, C. A comprehensive study of damage characteristics and acoustic emission response mechanism of sandstone with different water contents. Eng. Fract. Mech. 2023, 109392. [Google Scholar] [CrossRef]
- Chen, G.; Li, T.; Wang, W.; Zhu, Z.; Chen, Z.; Tang, O. Weakening effects of the presence of water on the brittleness of hard sandstone. Bull. Eng. Geol. Environ. 2019, 78, 1471–1483. [Google Scholar] [CrossRef]
- Liu, W.; Yang, K.; Zhang, S.; Zhang, Z.; Xu, R. Energy evolution and water immersion-induced weakening in sandstone roof of coal mines. Int. J. Coal Sci. Technol. 2022, 9, 53. [Google Scholar] [CrossRef]
- Wang, S.; Han, L. Water absorption/dehydration by NMR and mechanical response for weakly cemented mudstones subjected to different humidity conditions. Bull. Eng. Geol. Environ. 2020, 79, 1275–1288. [Google Scholar] [CrossRef]
- Zhang, J.F.; Cheng, S.F. Mesostructure and hydraulic characteristics of weakly cemented soft rock in western China. Coal Geol. Explor. 2020, 48, 116–121. [Google Scholar] [CrossRef]
- Liu, H.L. Study on water-retaining mining mechanism and classification of extra thick coal seam in Yili weak cementation formation. China Univ. Min. Technol. 2020. [Google Scholar] [CrossRef]
- Yang, J.H.; YE, Z.Y. Study on coupling model of single fracture seepage and normal stress of rock mass considering soft and hard body opening. Chin. J. Rock Mech. Eng. 2023, 42, 3473–3480. [Google Scholar] [CrossRef]
- Wang, H. Numerical Simulation of Fractured Rock Failure Process and Related Laws. Anhui University of Science and Technology. 2015. Available online: https://kns.cnki.net/KCMS/detail/detail.aspx?dbname=CMFD201502&filename=1015563274.nh (accessed on 6 June 2015).
- Hou, X.G. Study on Mechanical and Acoustic Emission Characteristics of Weakly Cemented Sandstone Under Uniaxial Compression. Northeastern University. 2014. Available online: https://kns.cnki.net/KCMS/detail/detail.aspx?dbname=CMFD201602&filename=1016013881.nh (accessed on 10 June 2014).
- Jia, C.; Xu, W.; Wang, H.; Wang, W.; Yu, J.; Lin, Z. Laboratory investigations of inert gas flow behaviors in compact sandstone. Environ. Earth Sci. 2018, 77, 245. [Google Scholar] [CrossRef]
- Zhang, S.Z. Evolution Law and Control Mechanism of Dynamic Water Resistance Performance of Weakly Cemented Formation in Yili Mining Area. Ph.D. Thesis, China University of Mining and Technology, Jiangsu, China. Available online: https://kns.cnki.net/KCMS/detail/detail.aspx?dbname=CDFDLAST2022&filename=1021773652.nh (accessed on 1 May 2021).
- Yang, T. Research on Permeability Properties and Coupling Effects of Rock Rupture Process and Stress. Ph.D. Thesis, Northeastern University, Liaoning, China. Available online: https://kns.cnki.net/KCMS/detail/detail.aspx?dbname=CDFD9908&filename=2006157861.nh (accessed on 11 August 2023).
- Itasca. The Universal Distinct Element Code (UDEC), Version 7.0; Itasca Consulting Group Inc.: Minneapolis, MN, USA, 2014.
- Gao, F.Q.; Stead, D. The application of a modified Voronoi logic to brittle fracture modelling at the laboratory and field scale. Int. J. Rock Mech. Min. Sci. 2014, 68, 1–14. [Google Scholar] [CrossRef]
- Min, K.-B.; Rutqvist, J.; Tsang, C.-F.; Jing, L. Stress-dependent permeability of fractured rock masses: A numerical study. Int. J. Rock Mech. Min. Sci. 2004, 41, 1191–1210. [Google Scholar] [CrossRef]
- Zhang, S.; Zhang, D.; Wang, Z.; Chen, M. Influence of Stress and Water Pressure on the Permeability of Fissured Sandstone Under Hydromechanical Coupling. Mine Water Environ. 2018, 37, 774–785. [Google Scholar] [CrossRef]
- Zhang, Y. Study on the Seepage Law and Water Penetration Mechanism of Fissure Rock Mass under Water-Force Coupling. Ph.D. Thesis, University of Science and Technology Beijing, Beijing, China. Available online: https://kns.cnki.net/KCMS/detail/detail.aspx?dbname=CDFDLAST2021&filename=1021001403.nh (accessed on 25 December 2020).
- Li, L.; Zhang, C.; Wang, W. A modified Hoek-Brown failure criterion for anisotropic rock mass. Yanshilixue Yu Gongcheng Xuebao/Chin. J. Rock Mech. Eng. 2018, 37, 3239–3246. [Google Scholar] [CrossRef]
- Saroglou, H.; Tsiambaos, G. A modified Hoek-Brown failure criterion for anisotropic intact rock. Int. J. Rock Mech. Min. Sci. 2008, 45, 223–234. [Google Scholar] [CrossRef]
- Cammarata, G.; Fidelibus, C.; Cravero, M.; Barla, G. The hydro mechanically coupled response of rock fractures. Rock Mech. Rock Eng. 2007, 40, 41–61. [Google Scholar] [CrossRef]
- Farahmand, K.; Diederichs, M.S. Calibration of coupled hydro-mechanical properties of grain-based model for simulating fracture process and associated pore pressure evolution in excavation damage zone around deep tunnels. J. Rock Mech. Geotech. Eng. 2021, 13, 60–83. [Google Scholar] [CrossRef]
- Zhang, C.; Tu, S.; Zhang, L. A Study on Effect of Seepage Direction on Permeability Stress Test. Arab. J. Sci. Eng. 2016, 41, 4583–4596. [Google Scholar] [CrossRef]
- Worthington, P.F. A diagnostic approach to quantifying the stress sensitivity of permeability. J. Pet. Sci. Eng. 2008, 61, 49–57. [Google Scholar] [CrossRef]
- Zhang, K.; Guo, J.; Teng, T. Experimental study on the characteristics of water injection softening and seepage of weakly cemented sandy mudstone—Take Shendong mining area as an example. Coal Sci. Technol. 2022, 50, 195–201. [Google Scholar] [CrossRef]
- Liu, W.; Du, Y.; Yu, J.; Yin, D.; Xu, H.; He, R.; Men, X. Experimental study on compressive seepage characteristics and acoustic emission characteristics of subsidence column skeleton sandstone. J. Rock Mech. Eng. 2021, 40, 1580–1590. [Google Scholar] [CrossRef]
Disclaimer/Publisher’s Note: The statements, opinions and data contained in all publications are solely those of the individual author(s) and contributor(s) and not of MDPI and/or the editor(s). MDPI and/or the editor(s) disclaim responsibility for any injury to people or property resulting from any ideas, methods, instructions or products referred to in the content. |
© 2023 by the authors. Licensee MDPI, Basel, Switzerland. This article is an open access article distributed under the terms and conditions of the Creative Commons Attribution (CC BY) license (https://creativecommons.org/licenses/by/4.0/).