1. Introduction
Futuristic mobility in urban areas brings about on-the-go services for constant connectivity via video streaming as a fundamental service layer of urban air mobility (UAM) infrastructures. While in the past two decades, there has been a rapid shift in electronic entertainment modalities worldwide, which has impacted various aspects of society [
1]. According to [
2], the consumption habits for music, video, and movies have significantly changed over time. Today, access to multimedia resources has increased due to the availability of information from anywhere [
3]. Streaming video-on-demand has become particularly popular. Kantar IBOPE Media reported that during the COVID-19 pandemic, 58% of Internet users said they had increased their consumption of video-on-demand with paid services [
4]. The amount of time spent watching television increased by 37 min per day, and individuals spent an average of two hours per day consuming information on streaming platforms. According to [
5], Netflix ended the first quarter of 2020 with 15.77 million new members. Other companies, such as YouTube, Amazon Prime Video, HBO MAX, and the newcomer Disney+, also operate in this multi-million-dollar industry, which is expected to continue growing in the future.
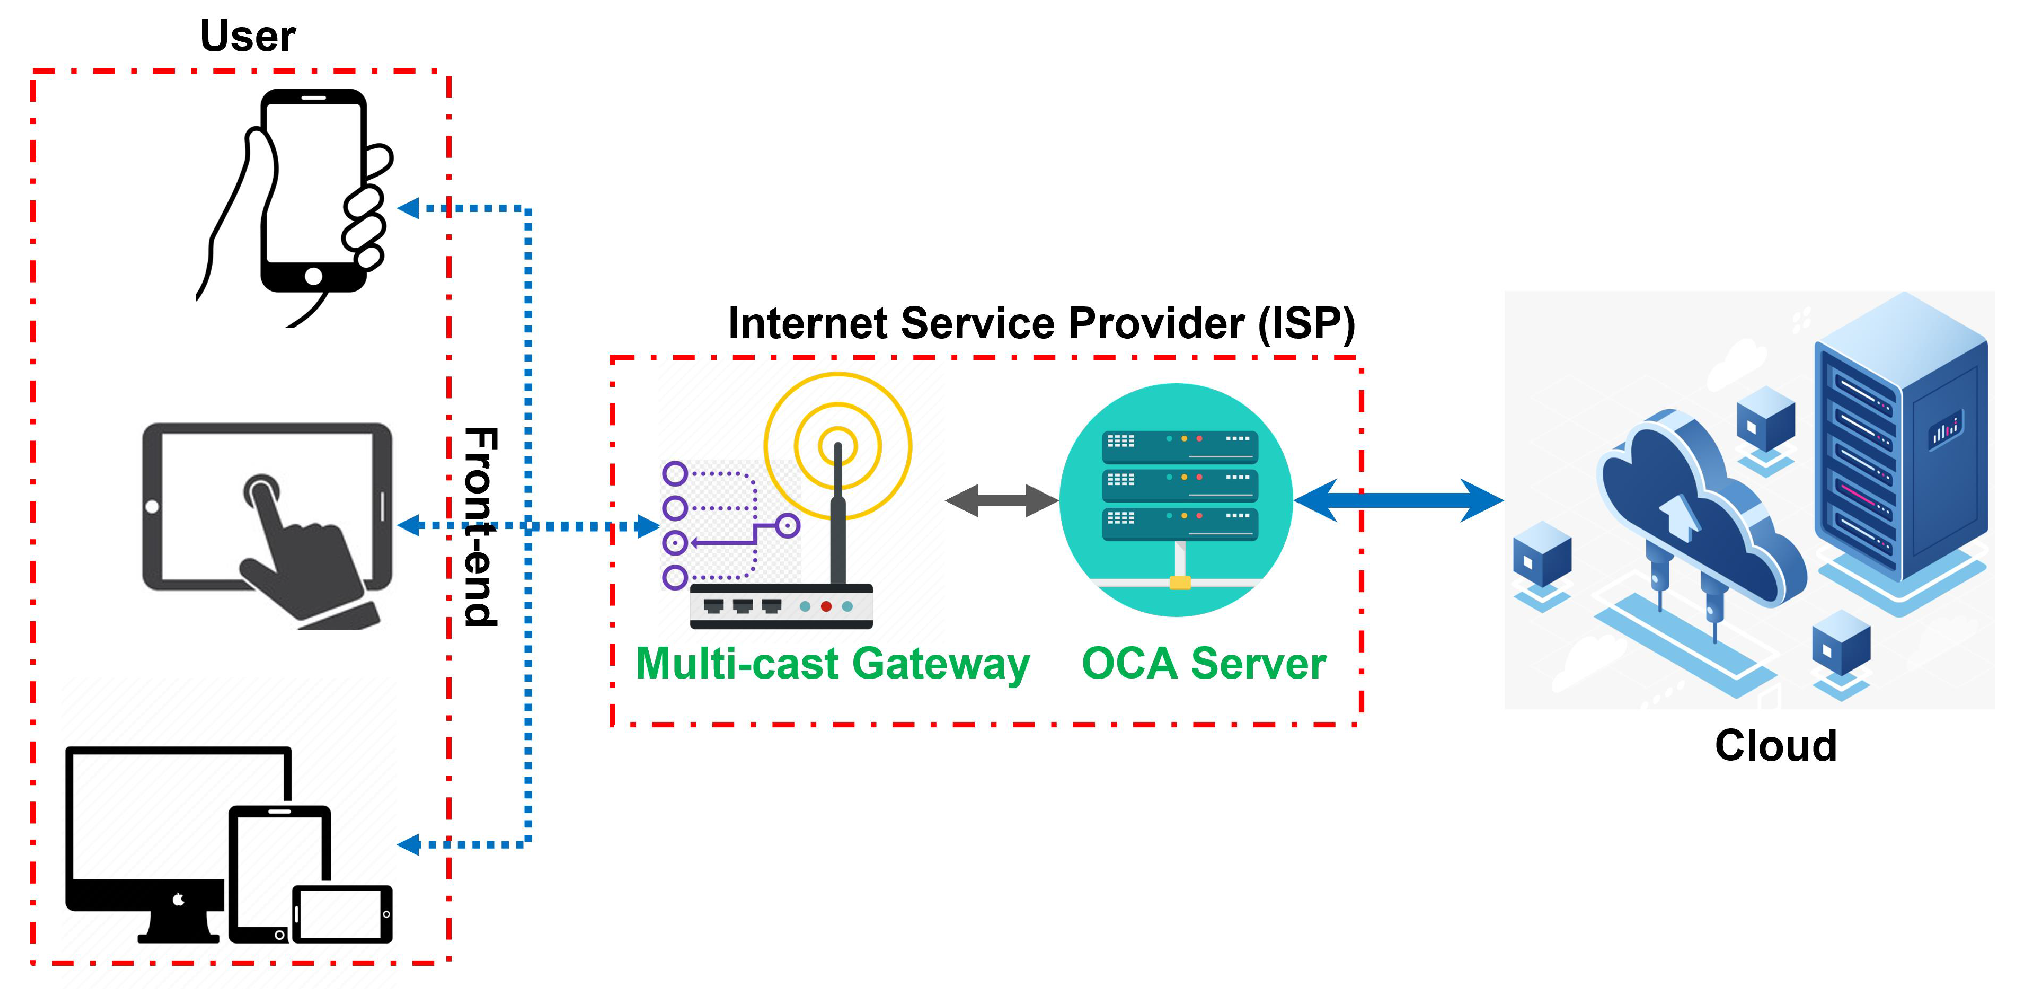
Netflix videos often pass through Internet Service Provider (ISP) data centers before reaching consumers’ homes. This type of Netflix service is known as the Open Connect program (
https://openconnect.netflix.com/en/, accessed on 20 October 2022). The Netflix Open Connect program is a content delivery network (CDN) created by Netflix in 2011 that has continued to grow over the years. This CDN allows physical servers located near users to improve the user experience by reducing delivery times and by causing minimal additional Internet traffic. These networks are called ISPs (Internet Service Providers) and are responsible for approximately 90% of Netflix’s total traffic. The initiative is divided into two parts: Open Connect Appliances (OCAs) and Settlement-free connections (SFIs). Both components were designed in collaboration with ISPs to maximize the benefits in each situation. Open Connect Appliances can be integrated into the ISP network, increasing the speed of data flow in the provider’s service areas. Multiple physical installations can be dispersed or aggregated geographically or network-wide to maximize local capacity.
Although promising, ISPs are not always ready to accept Open Connect Appliances (OCAs). ISPs must assess the specialized infrastructure needed to meet their customers’ expectations with the help of Netflix infrastructure. The poor construction of this infrastructure can result in poor service, with crashes and delays. Platforms that integrate with certain streaming services must provide users with high availability and low latency for browsing and consuming multimedia content. The combination of availability and performance issues is referred to as performability. Evaluating the performance of such an architecture is important for aiding in the early design implementation, thereby reducing potential future issues. However, assessing the performance of this type of architecture is a complex task that involves multiple elements. In addition to being costly, such evaluations can be time-consuming, depending on the complexity of the system. As a result, the purpose of this paper is to assist ISPs in planning their infrastructure to adopt designs using various strategies to improve the performance and performability of OCA servers.
Internet Service Providers (ISPs) typically have several key performance indicators (KPIs) that they use to measure the performance of their network and services. These KPIs may vary, depending on the specific goals and priorities of the ISP, as well as the characteristics of the network and the types of services being provided. Some common KPIs that ISPs may be interested in include:
Network availability: This refers to the percentage of time that the network is up and running, without any interruptions or outages [
6,
7]. ISPs typically aim for high network availability, as it ensures that their customers can access the services that they need without disruption.
Network latency: This refers to the time it takes for data to be transmitted from one point to another within the network. Low latency is important for real-time applications such as online gaming and video conferencing, as it ensures that there is minimal delay in communication.
Network throughput: This refers to the amount of data that can be transmitted through the network in a given period of time. High throughput is important for applications that require large amounts of data to be transmitted, such as streaming video or downloading large files.
Customer satisfaction: This refers to the extent to which customers are satisfied with the quality and reliability of the ISP’s services. ISPs may use various methods to measure customer satisfaction, such as surveys or customer service interactions.
Stochastic Petri nets (SPNs) are a type of mathematical model that can be used to represent and analyze the behaviors of complex systems, including networks such as those used by Internet Service Providers (ISPs). In general, ISPs may be interested in using SPN models to accurately predict and analyze various aspects of their network, such as traffic patterns, network utilization, and performance. In terms of the specific characteristics of the modeled system, ISPs may be interested in modeling various aspects of their network, including the numbers and types of devices connected to the network, the patterns of traffic flow, and the capacity and utilization of different network resources. The accuracy of the model will depend on the quality and quantity of data available, as well as the complexity of the system being modeled. As for the granularity of the model, this will depend on the specific goals and needs of the ISP. For example, an ISP may be interested in modeling traffic patterns at a high level of detail in order to identify bottlenecks or to optimize network resources, or they may be interested in modeling traffic patterns at a more aggregated level in order to identify trends and patterns over time. In terms of specific KPIs, ISPs may be interested in using SPN models to predict and to analyze various metrics such as network availability, latency, throughput, and customer satisfaction. These metrics are typically used to measure the performance of the network and the services provided by the ISP, and they can help the ISP to identify areas for improvement and optimize their operations.
SPNs are a subclass of Petri nets that can be used to model and analyze systems with concurrent and asynchronous events, such as video streaming services. They are particularly useful for analyzing systems with probabilistic transitions between states, as they can capture the uncertainties and randomness that are often present in real-world systems. SPNs can be used to model the flow of packets or requests through a video streaming service, as well as the dependencies between different events. For example, an SPN model of a video streaming service might include transitions for requesting a video, buffering the video, and playing the video, as well as places to represent the state of the system at each stage of the process. The SPN model can then be used to analyze the performance of the video streaming service under different operating conditions, such as varying traffic patterns and network conditions. There are several techniques that can be used to evaluate the performance of a video streaming service using an SPN model. One common technique is to compute the throughput and response time of the system, which can be used to measure the efficiency and effectiveness of the service. Another technique is to compute the reliability and availability of the service, which can be used to assess the robustness and dependability of the service. In addition to these techniques, SPN models can also be used to analyze the impacts of different hardware configurations and network conditions on the performance of a video streaming service. For example, an SPN model can be used to evaluate the impact of different server configurations or network architectures on the reliability and availability of the service. This can be useful for identifying bottlenecks and optimizing the design of the service. Overall, SPN models are a powerful tool for the performability modeling and analysis of video streaming services. They allow researchers to capture the complexity and uncertainty of real-world systems and to evaluate the performance of the service under different operating conditions.
SPNs are a type of Petri net that allows for the modeling of probabilistic, concurrent, and discrete systems. They are used for modeling and for analyzing the behaviors of systems that exhibit random or probabilistic behavior, and for predicting the performances of such systems. One advantage of SPNs is that they can represent the probabilistic behavior of systems more accurately than other models, such as deterministic Petri nets or finite state automata. This is because SPNs allow for the specification of probabilities or rates that are associated with transitions between states, which can be used to model the inherent randomness or uncertainty present in many real-world systems. SPNs also have the advantage of being able to model concurrent systems, in which multiple processes or activities can occur simultaneously. This is in contrast to models such as finite state automata, which can only model sequential systems. In terms of a comparison with other models, dataflow models such as SDF, SRDF, and SADF are primarily used for modeling and for analyzing the behaviors of digital systems, such as computer hardware and software.
In the context of dataflow models, SDF, SRDF, and SADF are all formalisms used to describe the behaviors of concurrent systems. Here is a brief overview of each of these dataflow model formalisms: (i) SDF: SDF stands for Synchronous Dataflow. It is a model of computation that is used to describe systems in which the execution of tasks is synchronized by the exchange of data through channels. In an SDF system, tasks are executed in a fixed sequence, and each task consumes and produces a fixed number of tokens from and to its input and output channels, respectively. (ii) SRDF: SRDF stands for Static Dataflow. It is a variant of the SDF model that allows for the creation of feedback loops, which are not possible in SDF. In SRDF, tasks can consume tokens from their own output channels, allowing them to execute in an iterative manner. (iii) SADF: SADF stands for Stochastic Activity Dataflow. It is a dataflow model used to describe systems in which the execution of tasks is probabilistic, rather than deterministic, as in SDF and SRDF. In an SADF system, each task has a probability distribution associated with it, which determines the likelihood of the task being executed in a given iteration. All three of these dataflow models can be used to model concurrent systems, and they are often used in the design and analysis of real-time systems, such as control systems and communication networks.
Dataflow models, such as SDF, SRDF, and SADF, and stochastic Petri nets (SPNs) are both formalisms used to model concurrent systems. Both types of models have their own advantages and disadvantages, depending on the specific context in which they are used. Here are a few potential disadvantages of dataflow models compared to SPN. (i) Dataflow models may be less expressive than SPN: Dataflow models are designed to describe systems in which data is exchanged between tasks through channels. They are primarily used to model systems with a fixed, predetermined order of execution, and do not explicitly represent the state of the system. In contrast, SPN can model systems with more complex behavior, including the ability to change state and to perform probabilistic transitions. (ii) Dataflow models may be less flexible than SPN: Because dataflow models are designed to model systems with a fixed order of execution, they may be less flexible than SPN when it comes to modeling systems that exhibit more complex or dynamic behavior. For example, it may be more difficult to model systems with feedback loops or systems that exhibit non-deterministic behavior using dataflow models. (iii) Dataflow models may be more difficult to analyze than SPN: Dataflow models may be more difficult to analyze than SPN because they do not explicitly represent the state of the system. This can make it more challenging to understand the behavior of the system and to identify potential problems or bottlenecks. In contrast, the SPN can be analyzed using a variety of techniques, such as reachability analysis and model checking, which can provide more detailed information about the behavior of the system.
It is important to note that these are just a few of the potential disadvantages of dataflow models compared to SPN, and that the relative usefulness of each type of model will depend on the specific requirements of the system being modeled.
Real-time calculus is a mathematical framework for analyzing and predicting the behaviors of real-time systems, which are systems that operate in real-time, with strict timing constraints. Real-time calculus is more suitable for analyzing systems with strict timing constraints, whereas SPNs are more general and can be used to model a wider range of systems. Thus, the choice of which modeling technique to use depends on the specific characteristics and requirements of the system being modeled. SPNs are a useful tool for modeling and analyzing probabilistic and concurrent systems, but they may not be the best choice for all situations.
This paper depicts the streaming service’s context and focuses on availability analysis. Melo et al. [
8] is the only study connected to this that does a sensitivity analysis and suggests in its paper the use of Reliability Block Diagram (RBD) models to reach the findings. Unlike our research, Juluri et al. [
9], Staelens et al. [
10], and Ebrahimidinaki et al. [
11], evaluate the quality of service of a streaming service through the variation of the capacity. Unlike the others, Hoque et al. [
12] chose to work not only in video-on-demand, but in the general context of streaming. As a result, as far as we are aware, our study is unique in the way that it investigates availability and dependability in the context of streaming video-on-demand using Petri nets and a sensitivity analysis.
Stochastic Petri nets (SPNs) are a widely used approach for modeling complex systems with various features, including parallelism and concurrency. SPN models have been applied to represent and to evaluate various types of systems, such as VANETs, hospital networks, cloud data processing, mobile devices, and more [
13,
14,
15,
16,
17,
18]. SPN models can be used to evaluate the performance and availability of computer systems, which is referred to as performability. In this article, we introduce SPN models for evaluating the performance of an architecture that provides video-on-demand to a specific group of users. Four models with different redundancy techniques were proposed, and a sensitivity analysis was conducted to identify the parameters with the greatest impacts on the system.
The main contributions of this work are:
Base model using SPN. A base SPN model was developed using components from a video streaming architecture for the analysis. This model is used to predict the system’s response time and availability.
A sensitivity analysis of the base model. A sensitivity analysis of the base model revealed which components have the greatest impact on the availability of the video streaming system. The Front-End, for example, had the greatest influence on the system’s response time, while the Back-End had the greatest influence on the availability metric.
Three extended SPN models to assess the availability capability of a video streaming system. Three extended SPN models were developed to assess the availability capability of a video streaming system. These models can be used to build a video-on-demand streaming business, and are based on the base model. The first model is the Cold-Standby model, the second is the Warm-Standby model, and the third is the Hot-Standby model. These models are designed to enhance and to increase the uptime of the service by incorporating redundancy in the components with the greatest impact.
The rest of this paper is organized as follows.
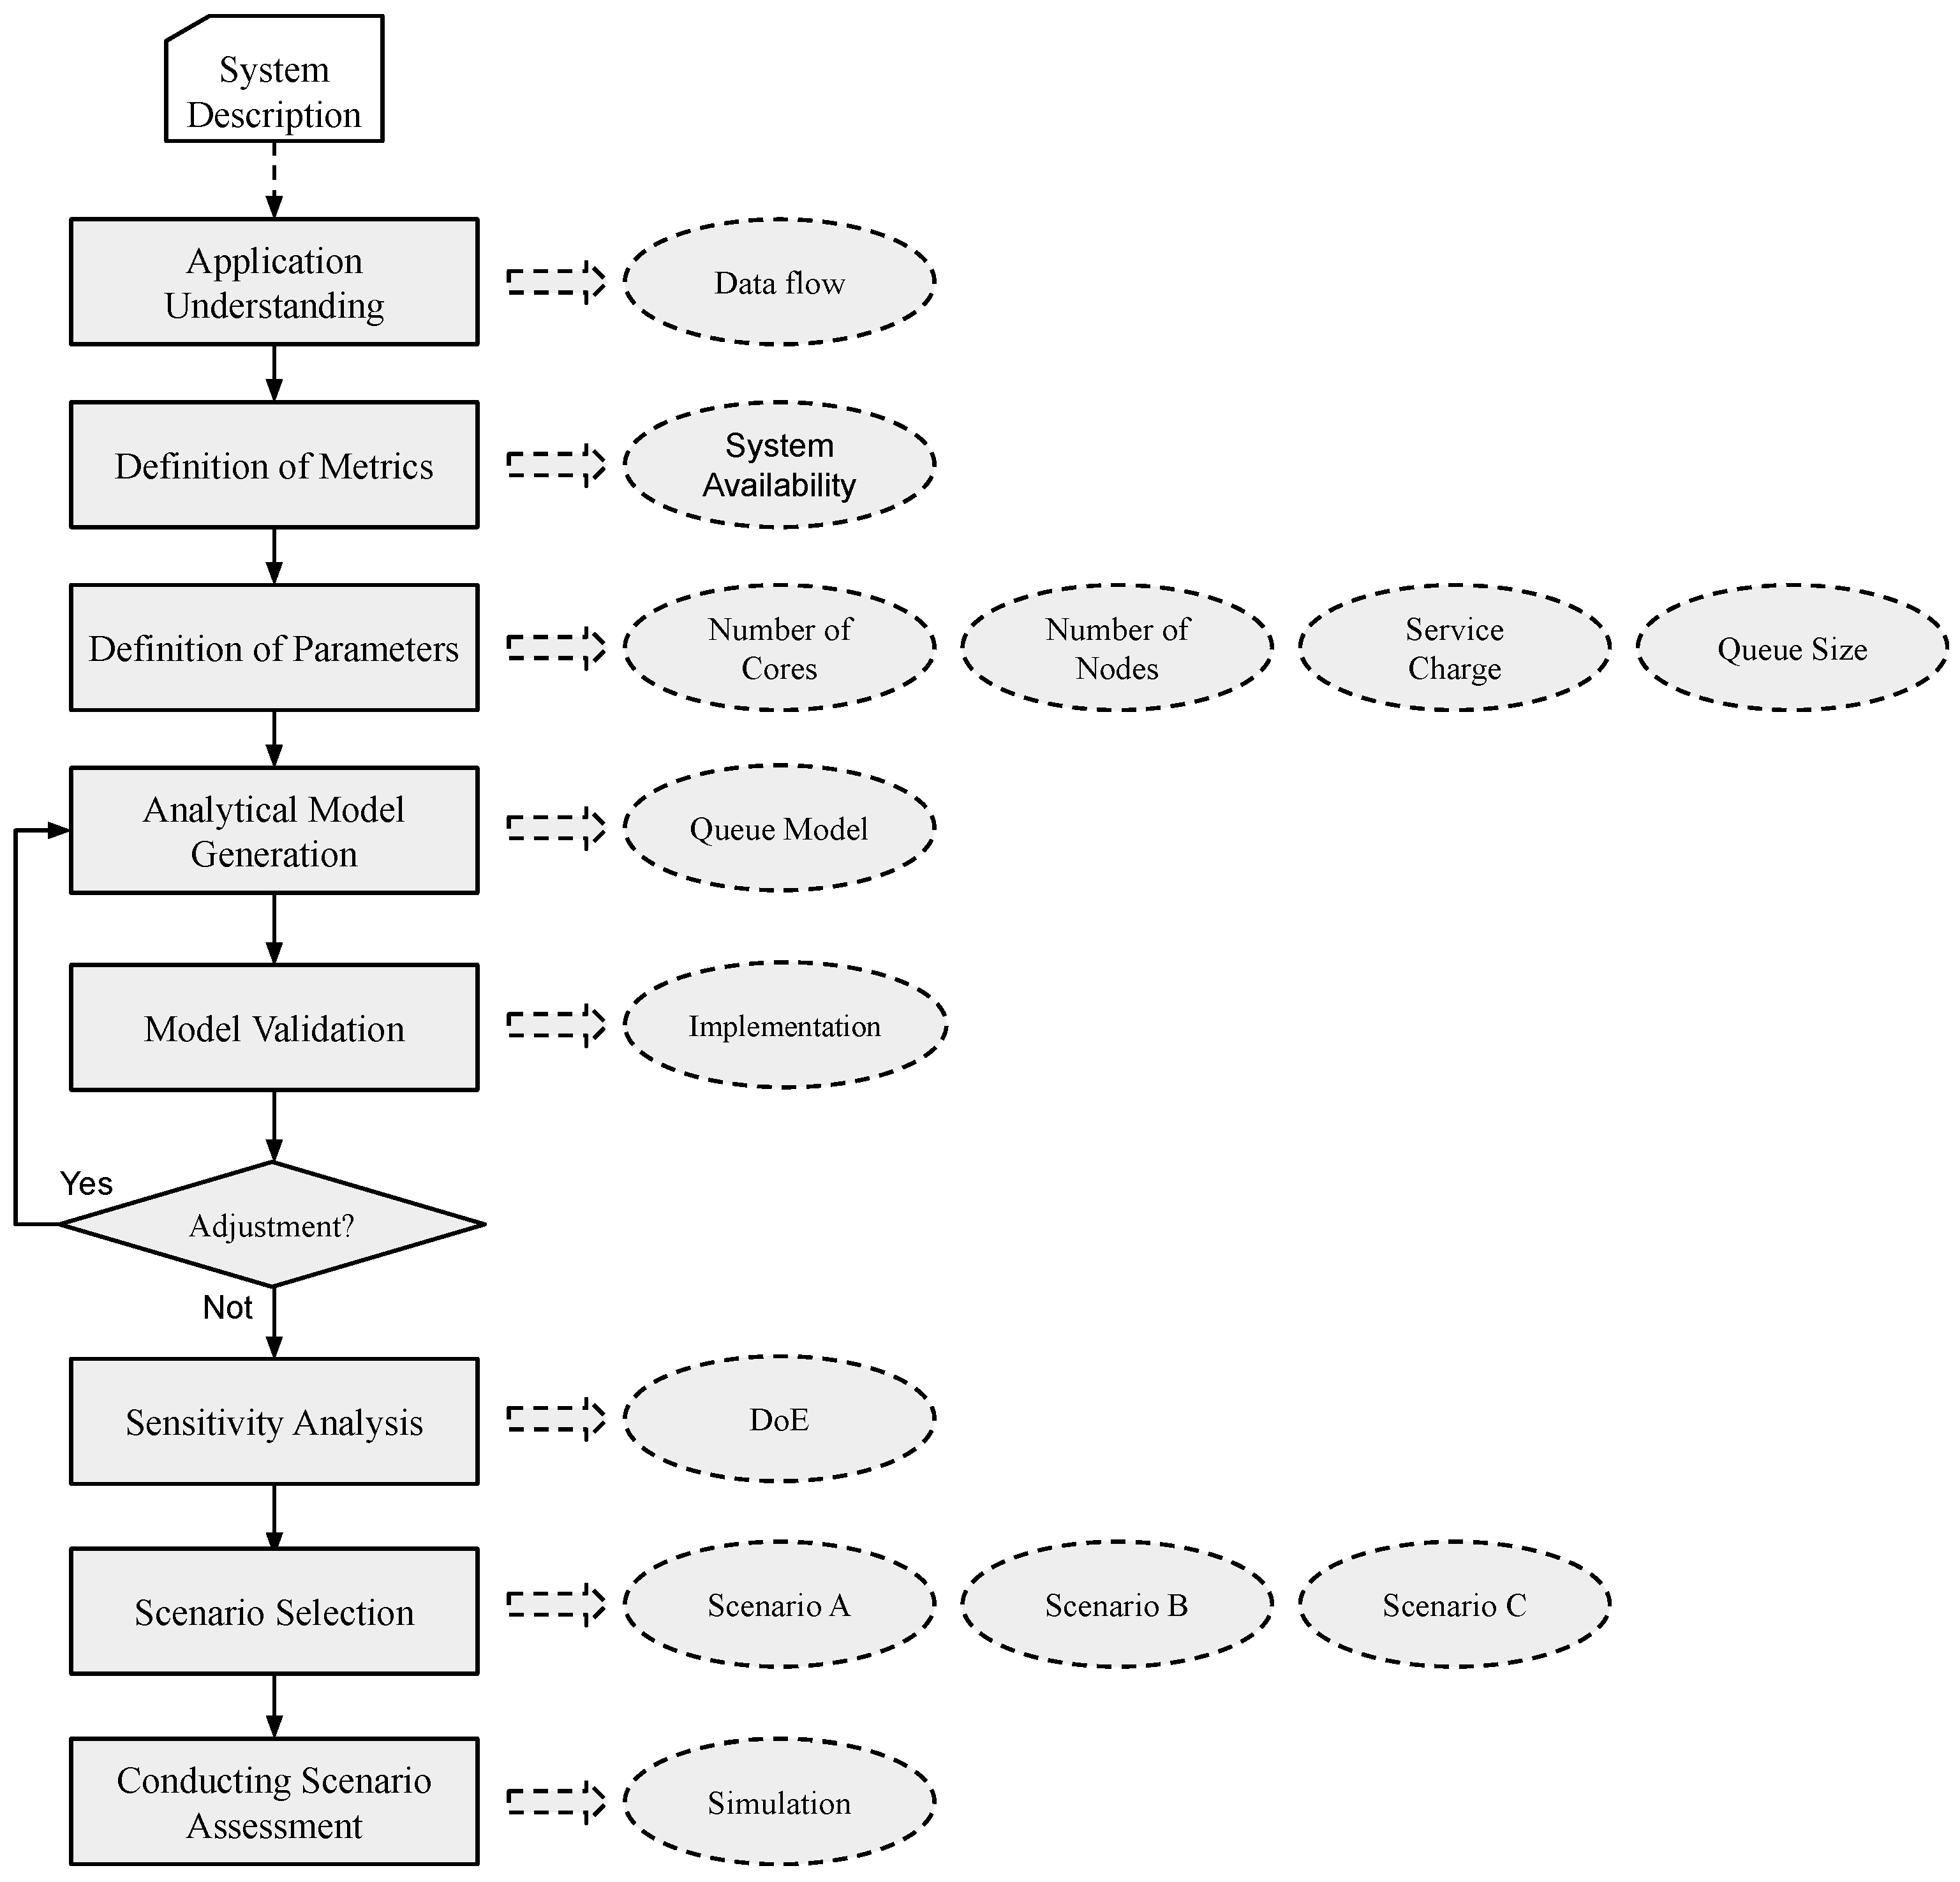
Section 2 describes the methodology of the work, outlining the main stages of its development.
Section 3 presents the evaluated architecture and describes the main components of its structure.
Section 4 presents the SPN models.
Section 5 presents the results obtained from the models.
Section 6 presents related works. Finally, in
Section 7, we present the conclusion of the work and the final remarks.
4. SPN Models
4.1. Preliminaries
A stochastic Petri net (SPN) is a mathematical modeling tool that is used to represent and to analyze the behaviors of systems that exhibit randomness or uncertainty. It is a type of Petri net, which is a graphical notation for representing the behaviors of distributed systems. An SPN consists of a directed graph with two types of nodes: places and transitions. Places represent states or conditions in the system, and transitions represent events or actions that can occur. Edges between the places and transitions represent the flow of control, or the dependencies between the states and events. In an SPN, the behavior of the system is represented by the flow of tokens through the graph. Tokens are represented by dots and are placed in the places. When a transition is enabled, it can consume a certain number of tokens from its input places and produce a certain number of tokens in its output places, according to a set of rules that are defined by the user. The number of tokens consumed and produced by a transition is determined by the transition’s firing rate, which can be either deterministic or stochastic. One of the main advantages of using an SPN is that it allows the user to model systems with complex, dynamic behavior, and to analyze the behavior of the system under different scenarios. SPNs can be used to model systems in a variety of domains, including computer science, engineering, biology, and economics. To create an SPN, the user must first define the places and transitions of the system, and the rules that govern the flow of tokens between them. The user can then simulate the behavior of the system by executing the SPN and observing the flow of tokens through the graph. This can be achieved using specialized software tools, such as the Stochastic Petri Net Editor (SPNEd) or the GreatSPN tool. There are several types of analysis that can be performed on an SPN, including steady-state analysis, which determines the long-term behavior of the system, and transient analysis, which determines the behavior of the system over a shorter time period. Other types of analysis include probabilistic analysis, which determines the likelihood of different events occurring in the system, and performance analysis, which determines the efficiency and effectiveness of the system. An SPN is a powerful modeling tool that can be used to represent and analyze the behaviors of systems that exhibit randomness or uncertainty.
Performability modeling is a technique that is used to analyze the reliability, availability, and maintainability of a system. It is used to evaluate the system’s ability to perform its intended function under different operating conditions, and to identify potential bottlenecks or vulnerabilities that could affect its performance. One way to perform performability modeling is by using a stochastic Petri net (SPN). An SPN is a graphical modeling tool that can be used to represent the behavior of a system and to analyze its performance under different scenarios. To use an SPN for performability modeling, the user must first define the places and transitions of the system, and the rules that govern the flow of tokens between them. The places represent the states or conditions of the system, and the transitions represent the events or actions that can occur. Next, the user must define the performance measures of interest, such as the reliability, availability, and maintainability of the system. These measures can be represented by the number of tokens in certain places or the rate at which tokens flow through the SPN. The user can then simulate the behavior of the system by executing the SPN and by observing the flow of tokens through the graph. This allows the user to identify potential bottlenecks or vulnerabilities that could affect the system’s performance, and to evaluate the system’s performance under different operating conditions. In summary, an SPN can be a useful tool for performability modeling because it allows the user to represent and analyze the behavior of a system in a graphical, intuitive way, and to evaluate the system’s performance under different scenarios.
The Petri Net is a modeling technique that allows for the representation of systems, using as a foundation a strong mathematical base [
19]. This means of dealing with demands via statistical methods has the particularity of allowing for the modeling of parallel, concurrent, asynchronous, and non-deterministic [
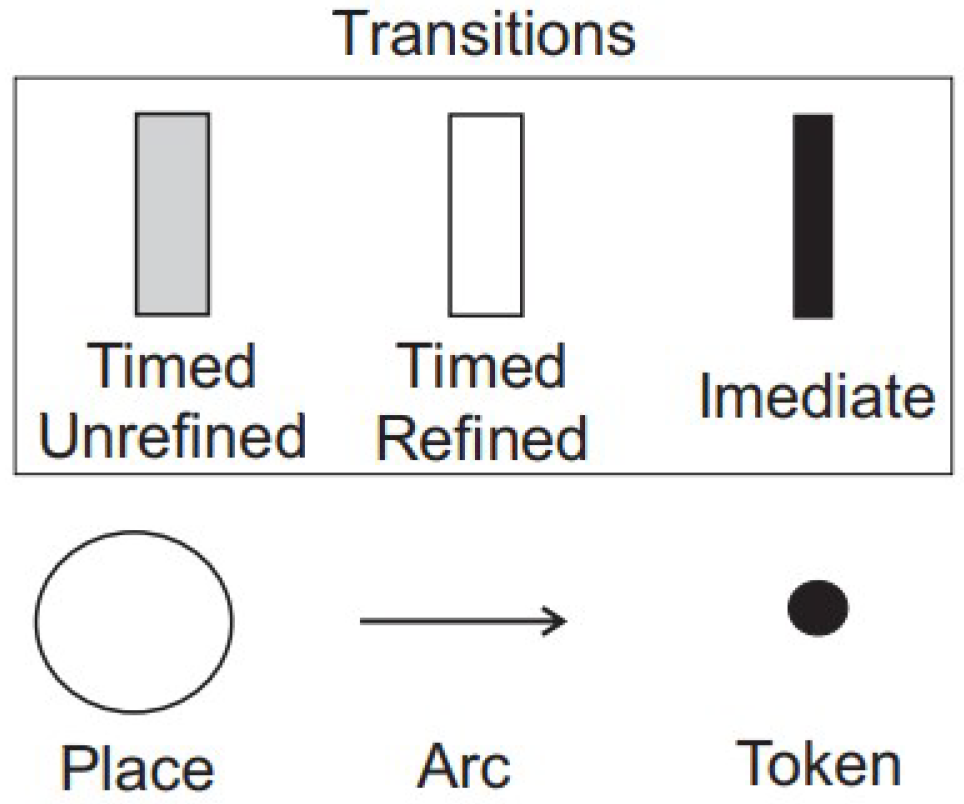
20]. In
Figure 3, components used in SPN models are illustrated [
21]. Displaying the Transitions, namely Timed Undefined, Timed Refined, and Immediate. In addition, we have the Place, where the Token may be stored, and the Arc that will carry out this Token transposition.
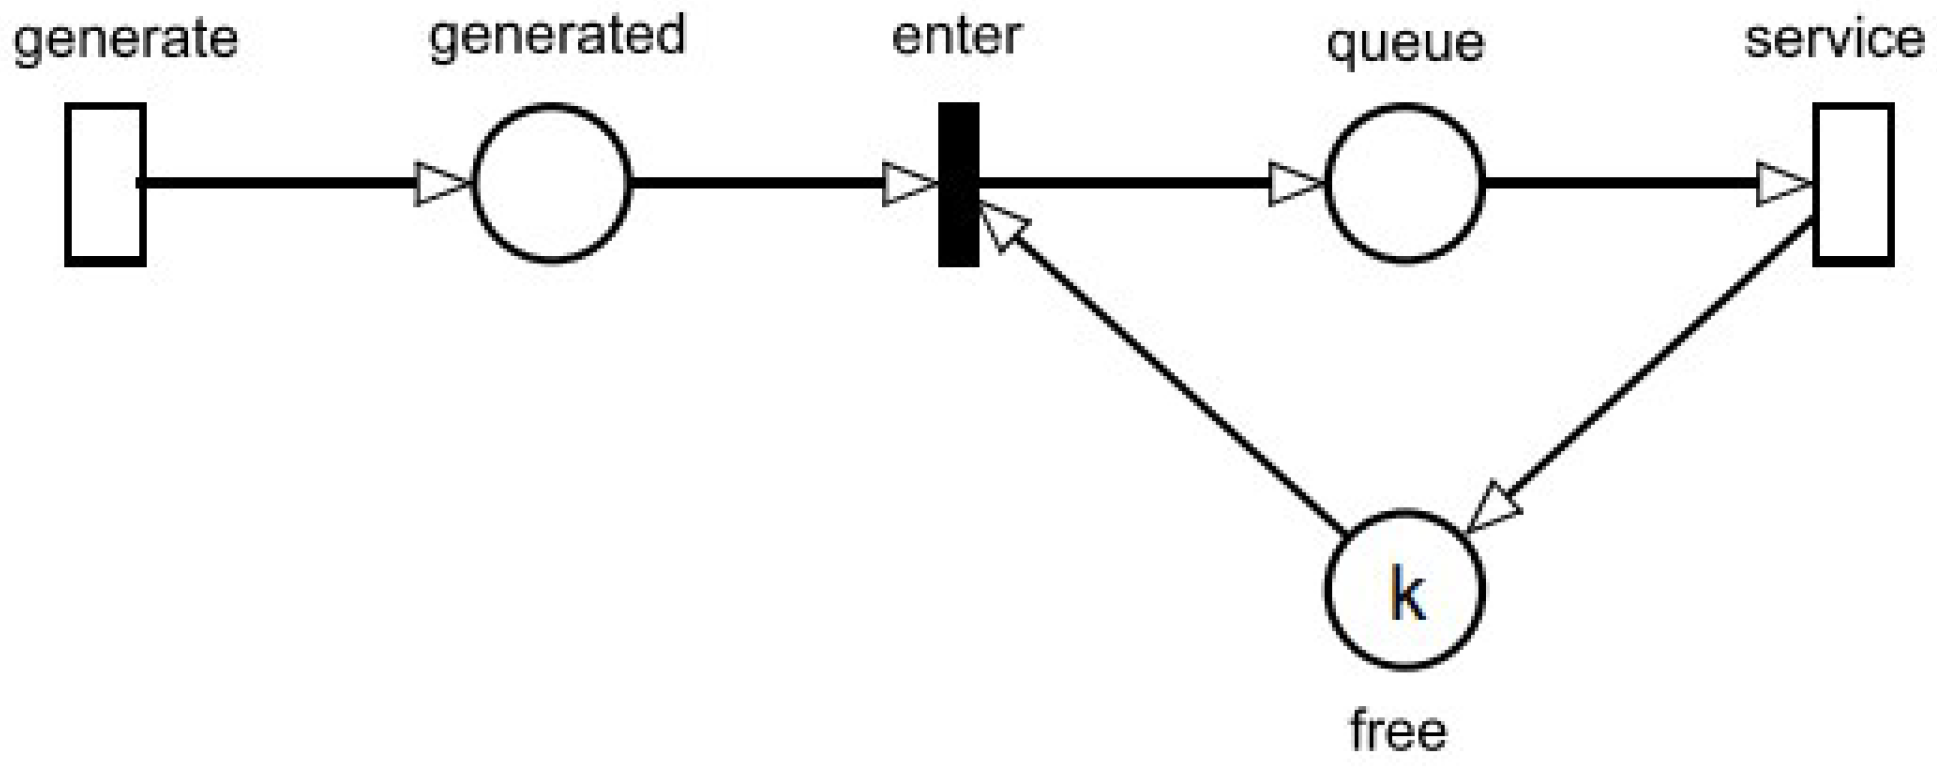
In
Figure 4, it is possible to abstract how components are used in a basic Petri net. Observing the figure from left to right, we see that the transition named “generate” will create tokens that correspond to service requests in the system. For each Token placed in the “Generated” place, a choice must be made. if there is a free position in the queue, the token can be queued to be processed by the server, and the token is placed in the “queue” place. However, if the queue is full, the Token is discarded. The place called “Free” corresponds to to the number of available resources (service nodes). More specifically, the number of available resources is given by the k marking. The “service” transition represents the processing queued requests by the server.
First, we provide a foundation model that is devoid of redundancy. Following that, we provide extended models that employ three strategies: Cold-, Warm-, and Hot-Standby [
15]. The redundancy was included in the Front-End component, since, according to our study, it is the most influential aspect of the system.
4.2. Base Model
The SPN performance model described in this section is designed to replicate the behavior of the architecture presented in the previous section.
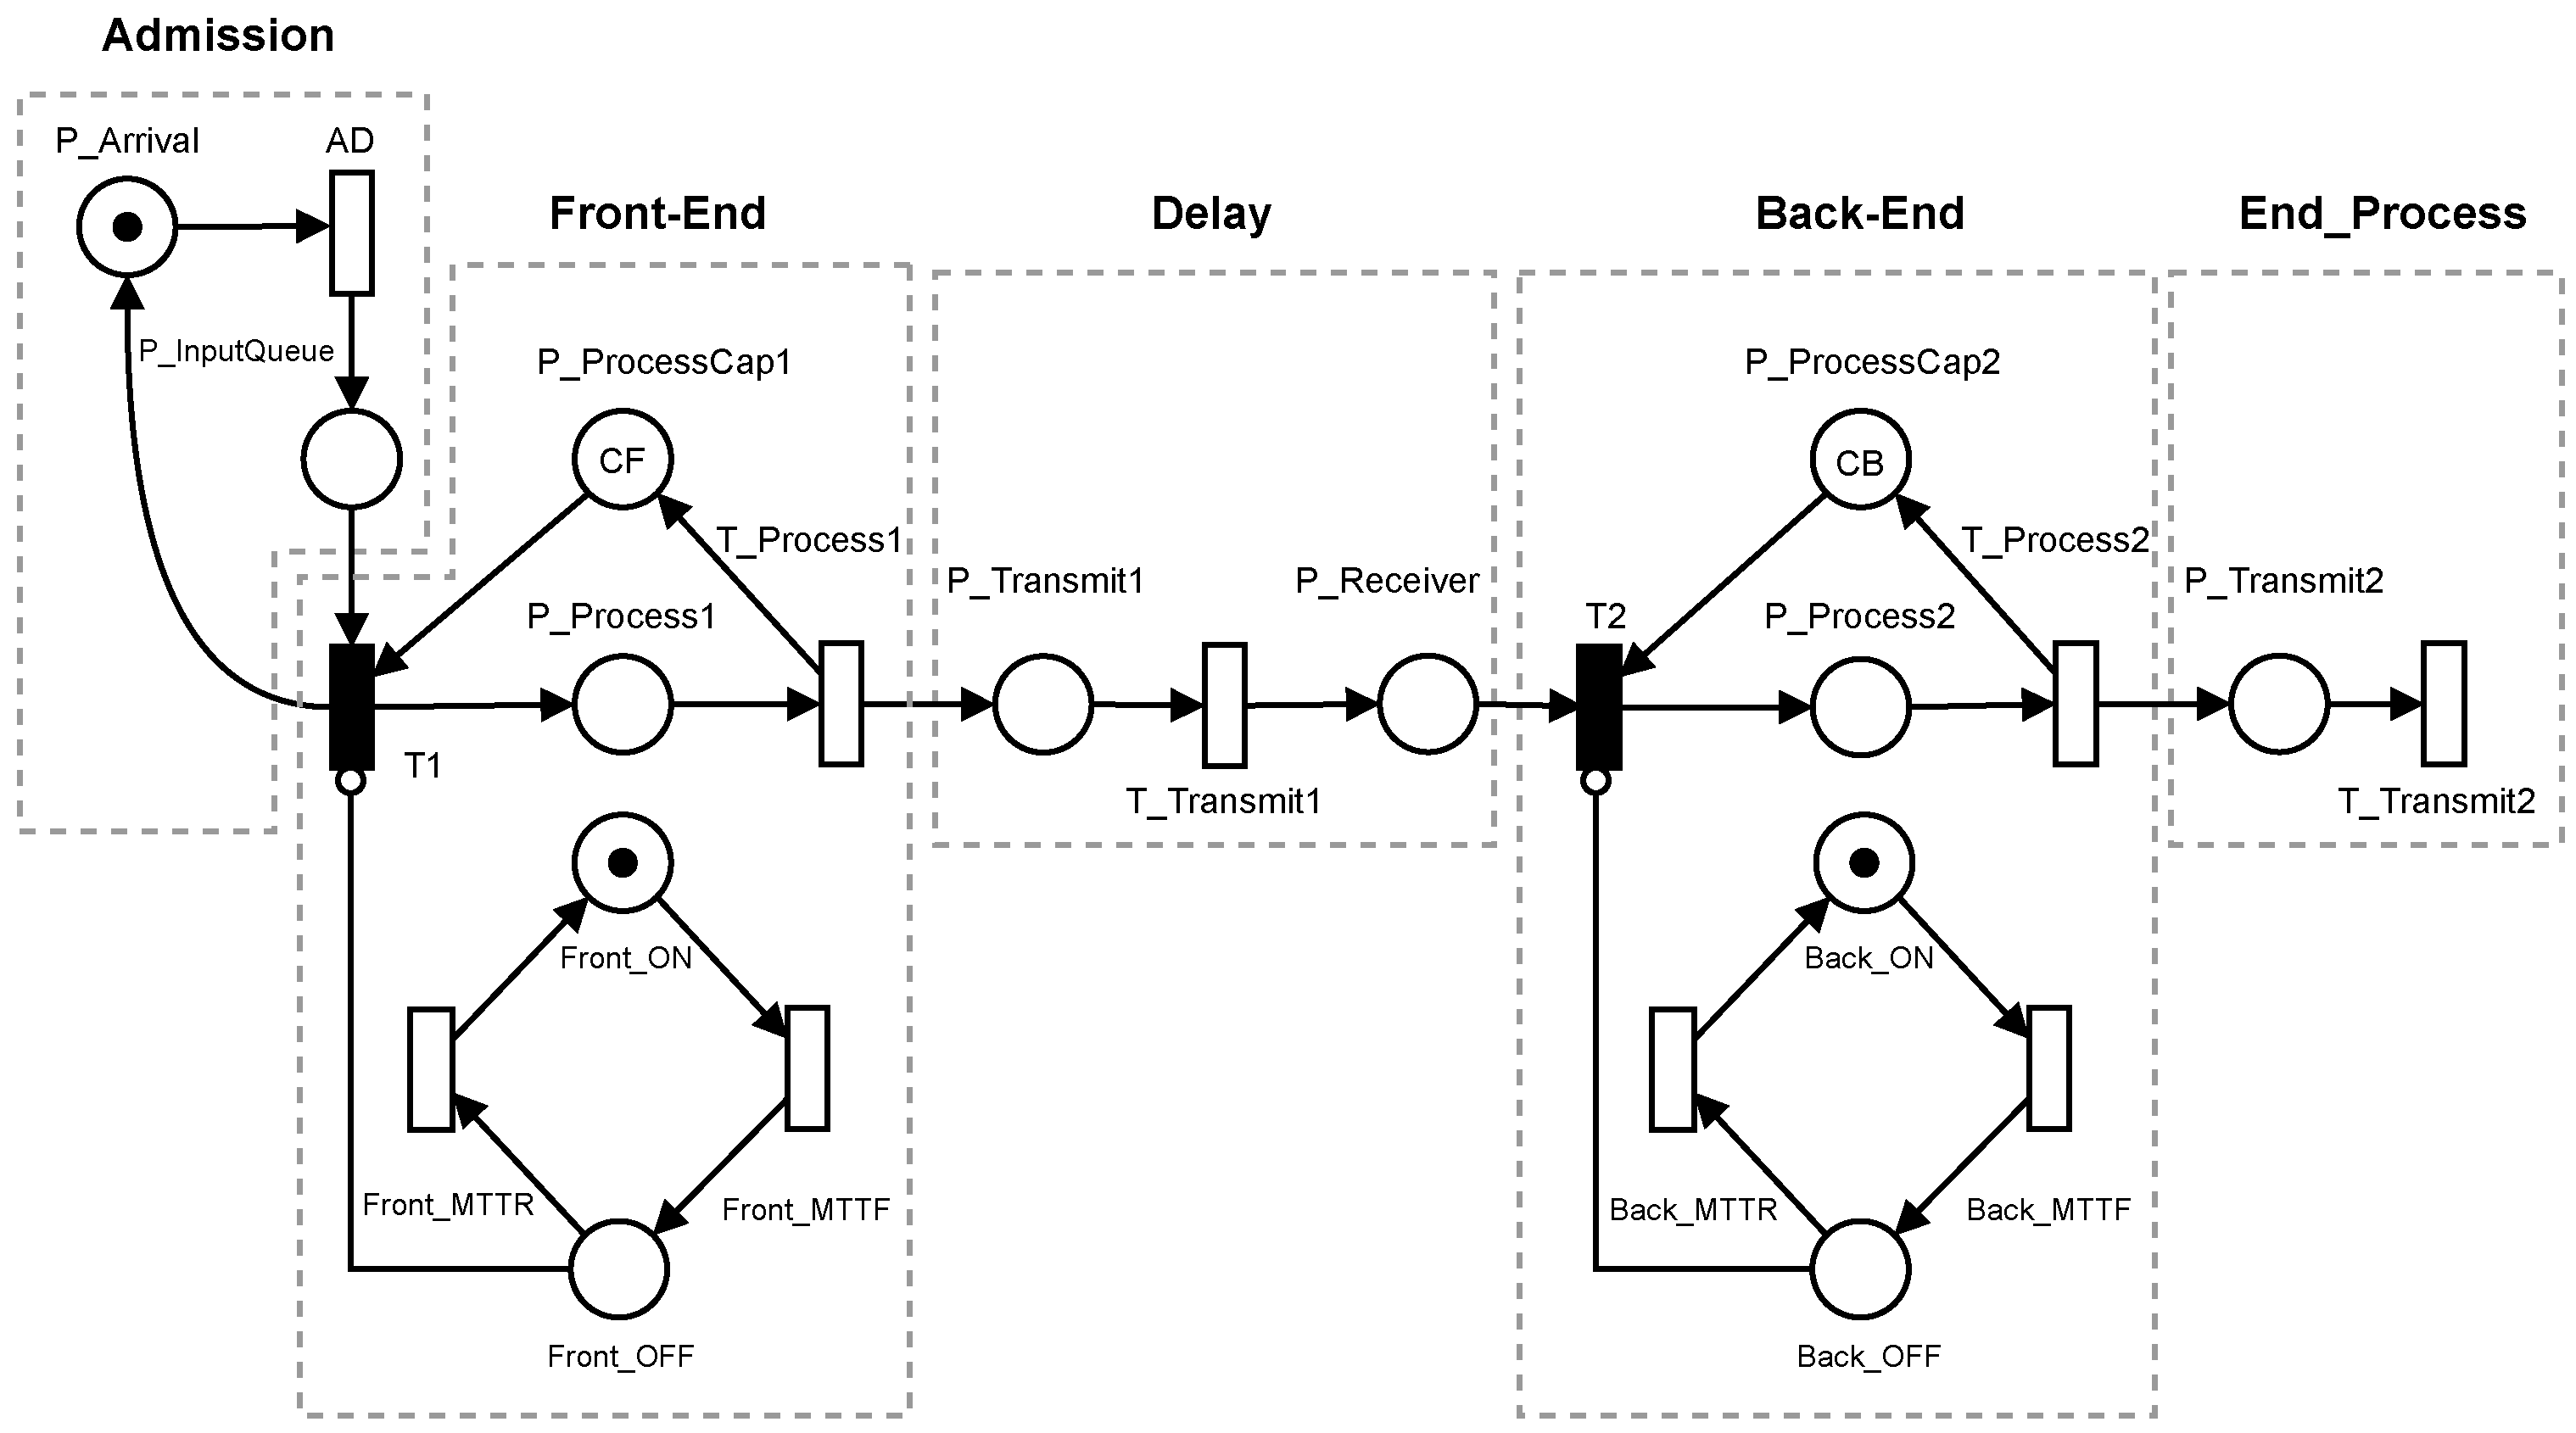
Figure 5 shows the Petri Net model divided into five parts: Admission, Front-End, Delay, Back-End, and End_Process. Admission is responsible for generating the requests that will be processed in the Back-End. The Front-End subnet represents the processing of requests before they are sent to the Back-End. The Delay is the link between the Front-End and the Back-End. The Back-End is responsible for the processing of all requests and it will be the focus of the performance investigation. End_Process is the subnet where requests are discarded after processing.
Table 1 provides a description of all the components in the system, and
Table 2 lists the model’s input parameters.
Based on the model’s overview, it is possible to provide further detail about its components and their functions. The Admission subnet consists of two places: P_Arrival and P_InputQueue. P_Arrival represents the system’s state when it is waiting for new requests to be generated. P_InputQueue represents the system’s state when requests are generated and are waiting to be distributed by the model. Requests are represented by tokens in P_Arrival. The AD transition (or Arrival Delay) represents the time between arrivals, or the time required for each message to be generated and transmitted to P_InputQueue.
The Front-End subnet consists of two places: P_Process1 and P_ProcessCap1. P_Process1 represents the state in which the request is being executed. P_ProcessCap1 represents the Front-End component’s processing capability through markup. When T_Process1 is triggered, a token is taken from P_Process1 and sent to the next subnet. Then, another token in P_InputQueue begins to be executed in the Front-End. The Delay subnet consists of two locations and a transition that describes the time it takes for the message to be transferred from the Front-End to the Back-End. When the token arrives at P_Transmit2, it has already been processed by the Back-End.
The Front-End and Back-End subnets can be enabled or disabled to analyze the system’s availability from different perspectives. A component with two positions and two timed transitions was introduced to perform this control. The Front_ON and Front_OFF places indicate whether the Front-End is on or off. Front_OFF is connected to T1 through an inhibitor arc. When there is a token in Front_OFF, transition T1 cannot be activated, causing the system to shut down completely. The Front_MTTR and Front_MTTF transitions represent the repair and failure times, respectively. The values for these transitions were taken from [
12], with 3.0 h for the MTTR and 22,869.0 h for the MTTF. When the MTTF is reached, the token changes from Front_ON to Front_OFF, making it impossible for the machine to activate until its MTTR is reached.
4.3. Extended Model A: Cold-Standby
The extended model in
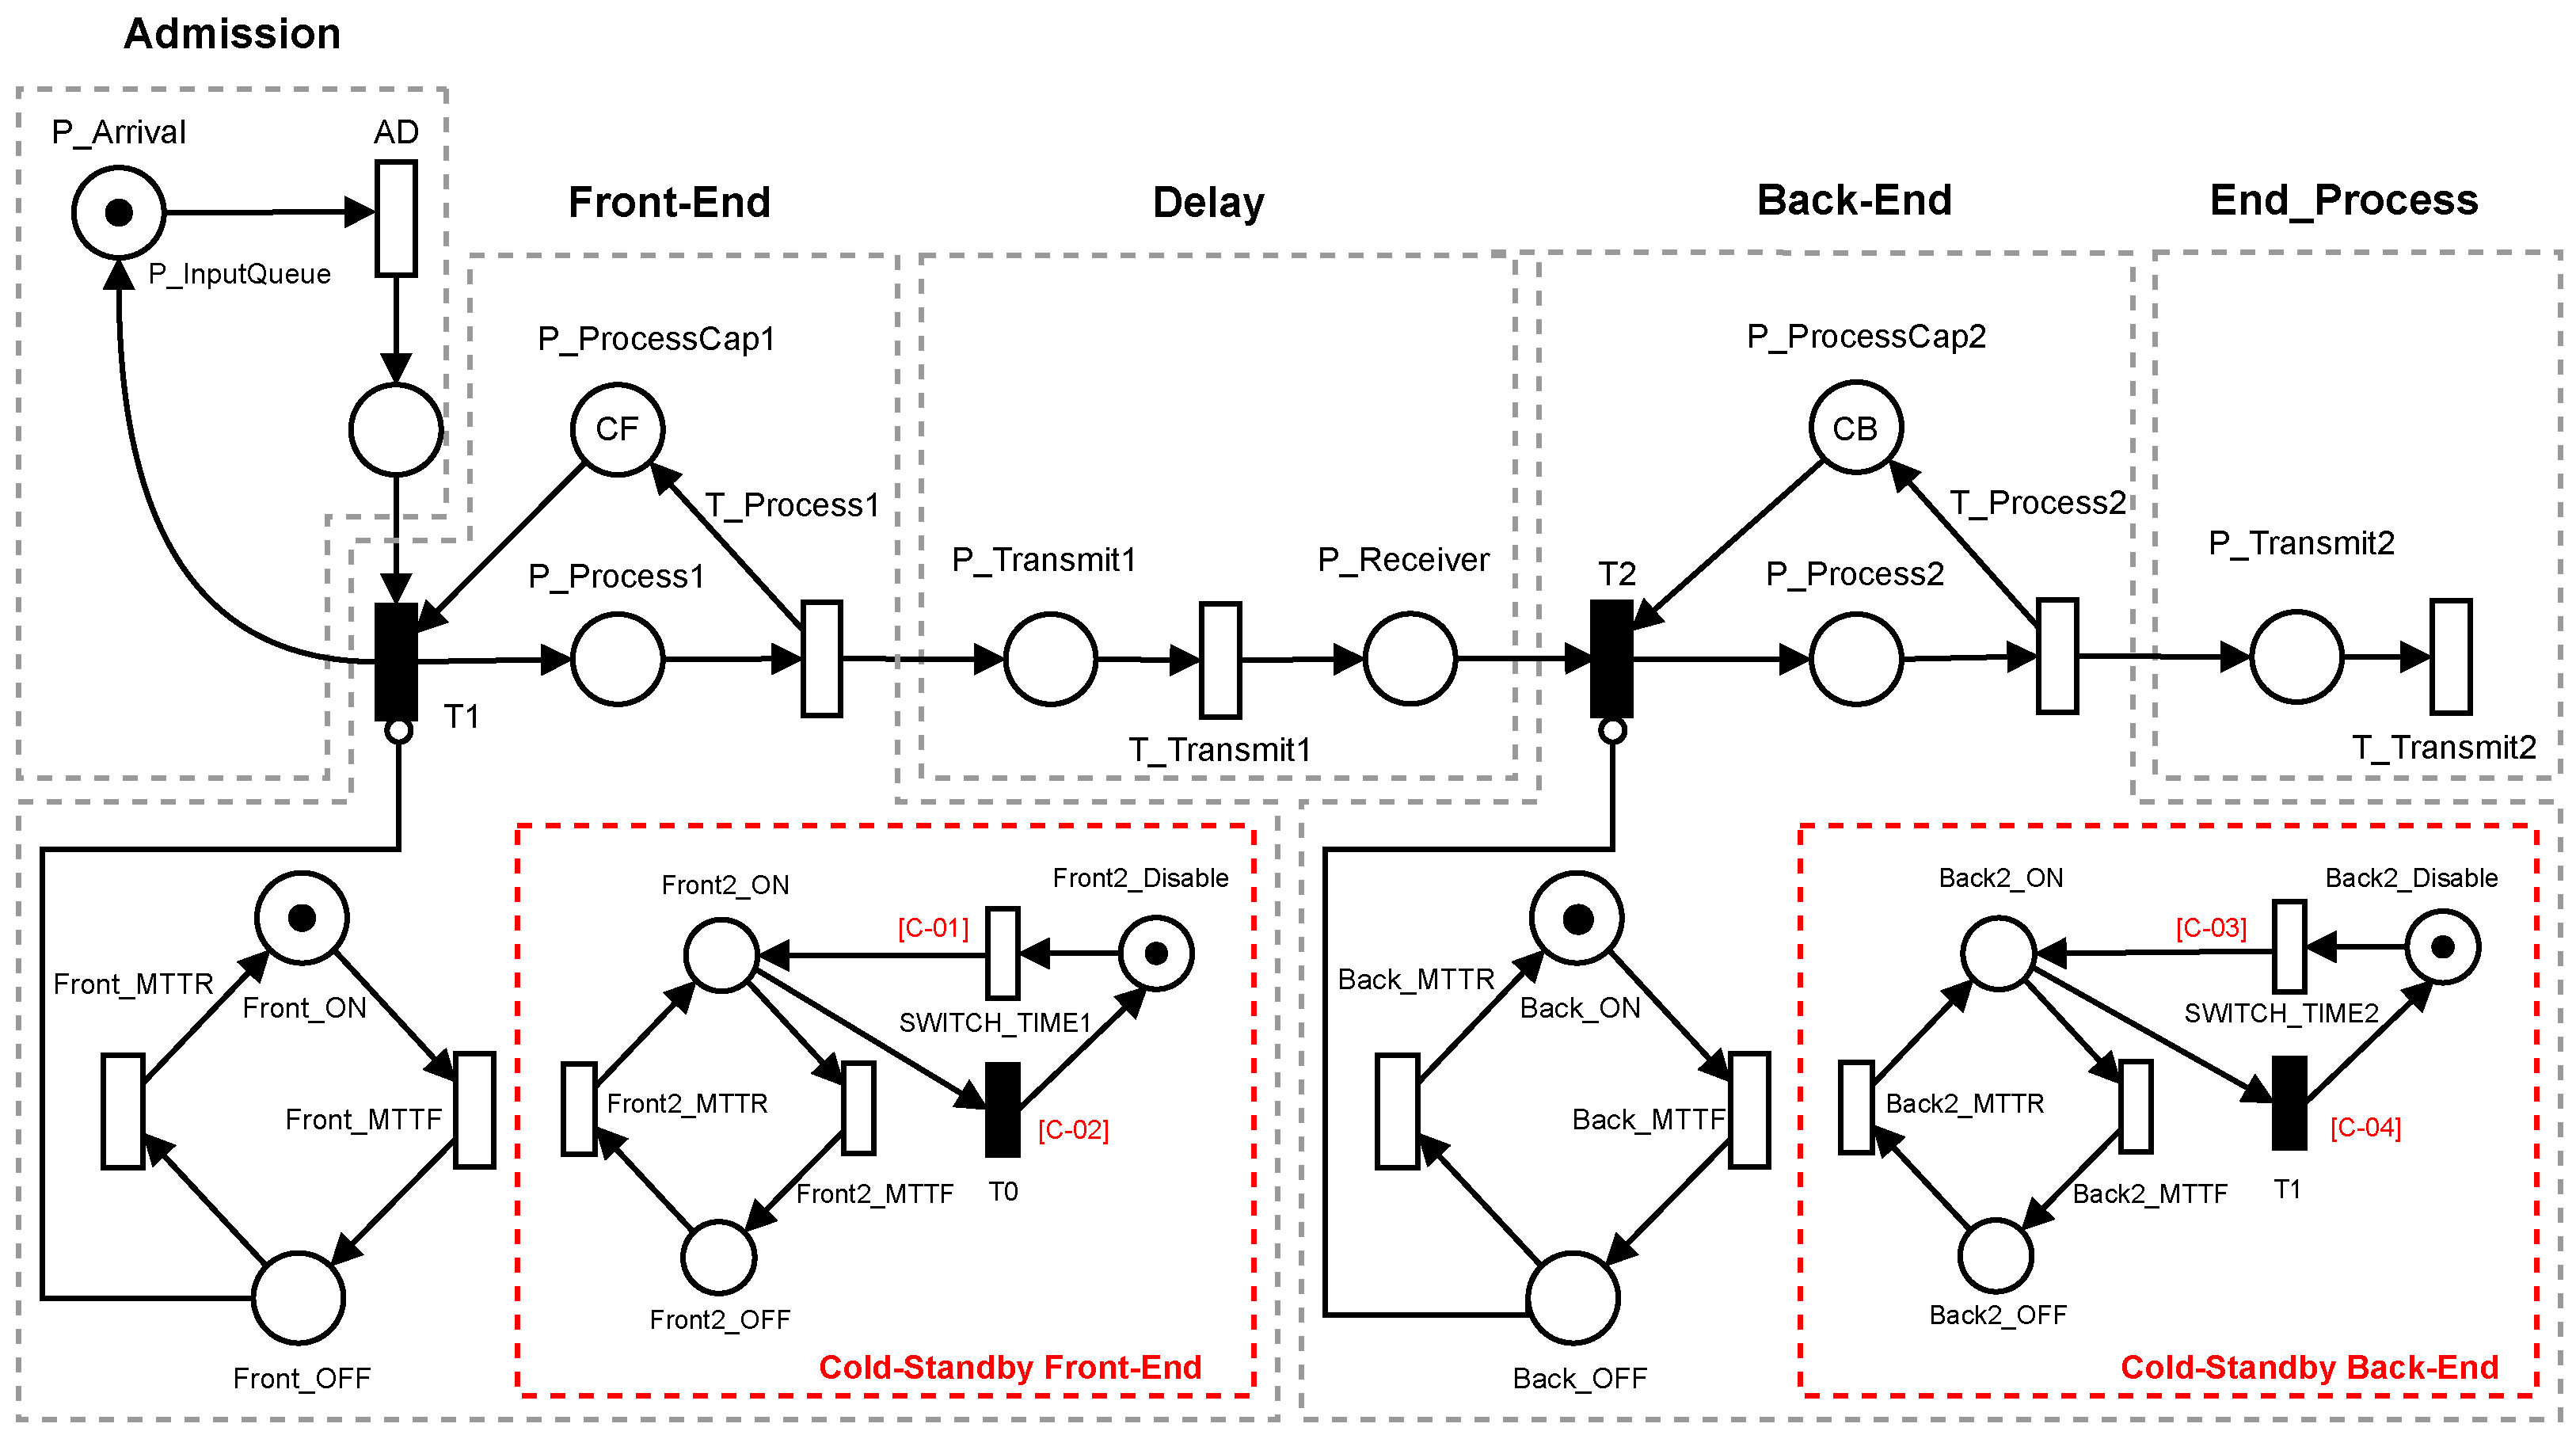
Figure 6 employs Cold-Standby redundancy, in which a secondary computer is included in the design and remains mostly inactive. In the event of a primary machine failure, the secondary machine takes over to maintain system functionality. This redundancy was applied to both the Front-End and Back-End components of the evaluated structure.
The token Front_ON signifies that the main machine is operational. If a failure occurs on the main machine, the Front_MTTF transition is activated and the token is transferred to Front_OFF, indicating that the main machine has been shut down. While the main machine is offline, the token for the secondary machine is transferred to the activation module of the secondary machine, Front2_ON, activating the secondary machine. When the primary machine’s token returns to Front_ON, the token for the secondary machine will be transferred back to its default location via an immediate transition (T0) and then to Front2_Disable, indicating that the secondary machine has been turned off. The system is not available if the tokens for both machines are in Front_OFF and Front2_OFF.
The process described in the previous paragraph pertains to Cold-Standby, with the exception of modifying the component terminology and insertion values in MTTR and MTTF. Transitions include guard conditions to ensure proper system function, as outlined in
Table 3. When the ON component of the main machine is equal to zero, the SWITCH_TIME transition is activated, enabling the transfer of the token. Upon the primary machine returning to its starting state, the immediate transition T is activated, allowing the secondary machine to perform the same.
The availability was calculated using the formula below in the Cold-Standby redundancy model. Tokens provide availability in UP mode on the primary or secondary computer.
4.4. Extended Model B: Warm-Standby
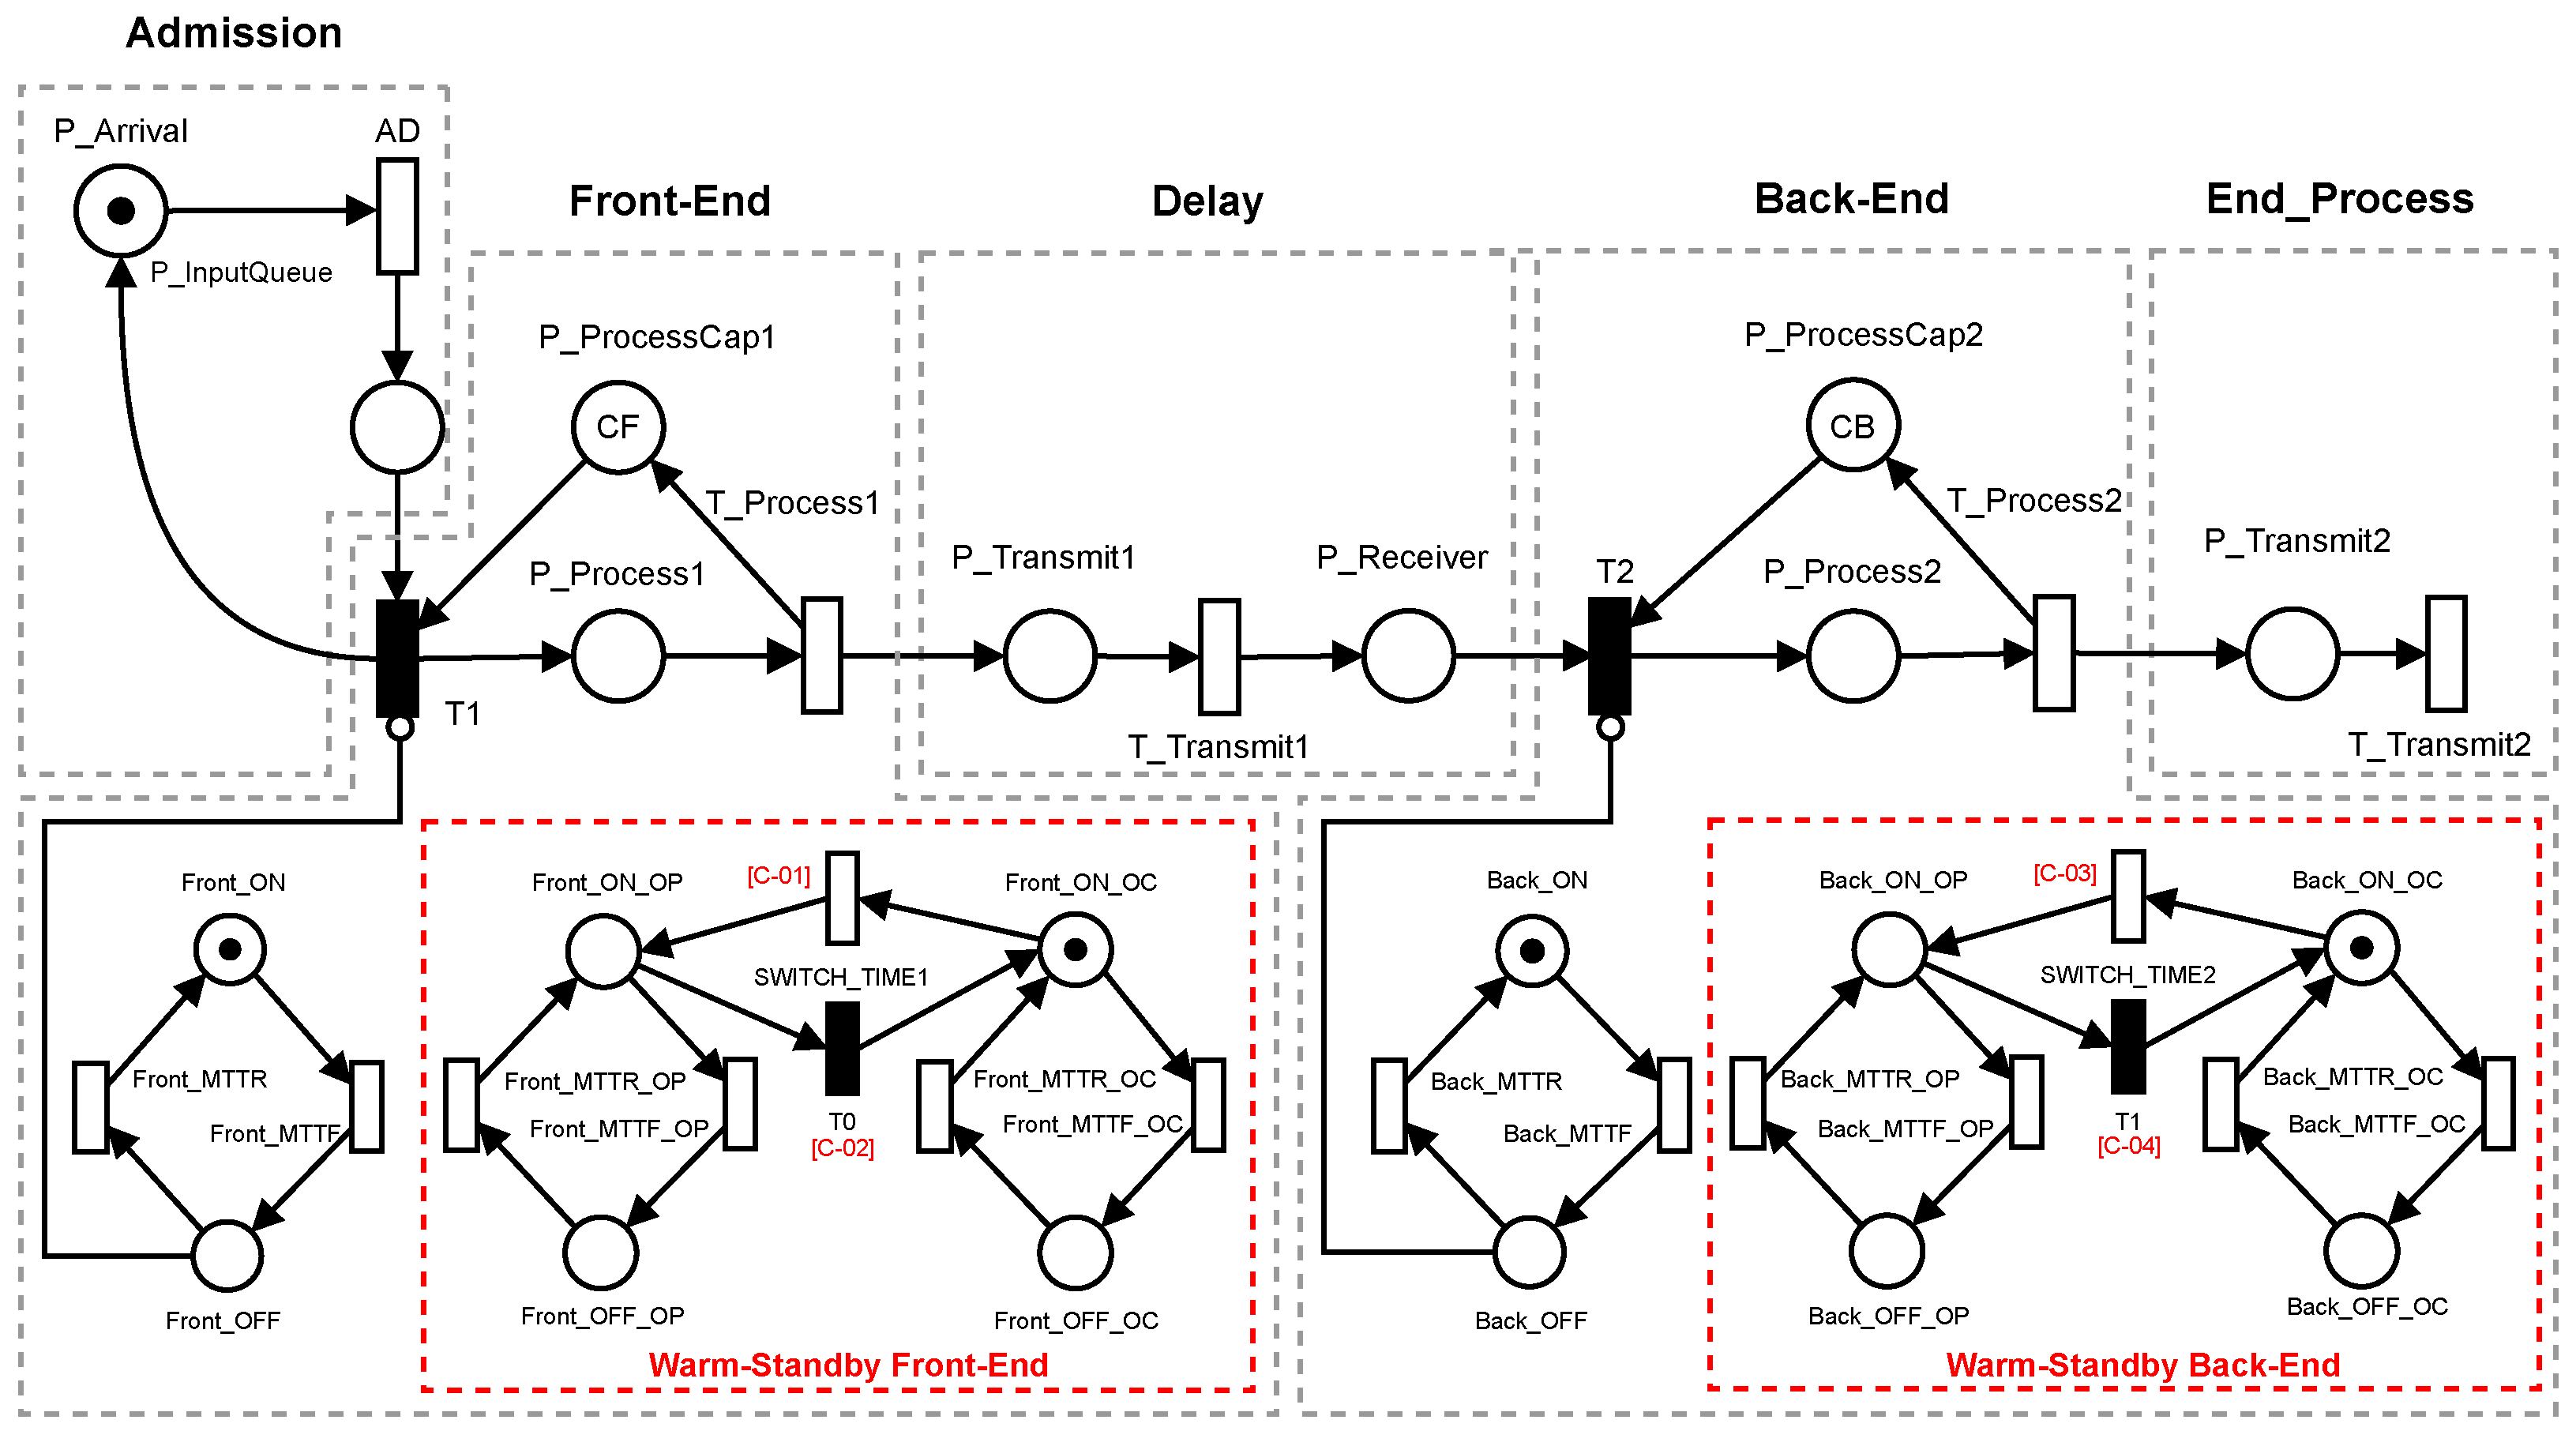
Figure 7 depicts the SPN Base model with some additional modifications. This paradigm utilizes warm-standby redundancy, in which the primary computer is continuously operational and a secondary machine remains idle in the background (OC). If the main machine fails, the secondary machine is activated and returns to an operational state (OP).
The presence of the token Front_ON indicates that the machine is active. In the event of a system failure, the token is transferred to Front_OFF. The token for the secondary machine, which was previously in Front_ON_OC in its idle state, is transferred to Front_ON_OP, indicating that the secondary machine has transitioned from standby to active mode. When the primary machine is restored and operational, it returns to its idle state (secondary token in Front_ON_OC). This technique also applies to the Back-End, with only the component terminology and values being modified.
Unlike Cold-Standby, the construction of the secondary machine in Warm-Standby involves both machines being constantly turned on. However, because the secondary machine is not fully functioning, it consumes fewer resources. The values for MTTR and MTTF insertion for the secondary machine in Warm-Standby are shown in
Table 4, which are based on the values for the main machine in the base model of the project, with some modifications. Due to the secondary machine being in an idle state (OC), it has a longer time to failure, approximately 50% longer compared to other machines according to [
23].
Table 5 shows the guard conditions for the model with warm standby. Similar to cold standby, when the ON component of the main machine is equal to zero, and the SWITCH_TIME function is activated, allowing the token to be transferred from OC mode to OP mode. When the ON component of the main machine returns to its initial value, the immediate transition T is activated. Warm standby is a more structured paradigm, and the time between transitions is typically eight times shorter than in cold standby.
4.5. Extended Model C: Hot-Standby
Figure 8 presents the proposed extended model for the Hot-Standby architecture. In contrast to cold and warm standby redundancy, the secondary machine in the Hot model is represented by simply adding a token to the component. This enhancement improves availability because when the primary machine is shut down, the secondary machine immediately provides resources, ensuring that services are always available. Improved outcomes can be achieved because both devices are fully functioning and ready to take over in the event of a failure.
The formula for calculating availability with the Hot-standby model is shown in the equation below. In order to perform the calculation, all system components must be active, and tokens must exist in Front_ON and Back_ON.
5. Numerical Analysis
In this section, we solve the models and evaluate the impacts of parameters such as MRT (mean repair time) and availability on the base model. We also compare the proposed models in various ways. All modeling was conducted using the Mercury tool [
24].
5.1. Design of Experiments (DoE)
Design of Experiments (DoE) is a set of statistical techniques that help to increase the understanding of a product or process under study [
25]. DoE can be used to evaluate the importance and interactions of input components in a particular process. Variations in input factors can be combined at different levels to produce a metric or response variable.
Table 6 shows the factors and levels used in our approach. Two analyses were conducted, one for each metric being considered.
The MTTF and MTTR of each component collected from the base model, along with the timed transitions from the Front-End and Back-End subnets, were used as the eight factors. Level 1 uses 50% less than the normal input value, while Level 2 uses 50% more. A set of combinations is created from these factors, consisting of the result of the equation of N factors minus 1, raised to the power of N levels. The number of combinations generated for this work was approximately 128.
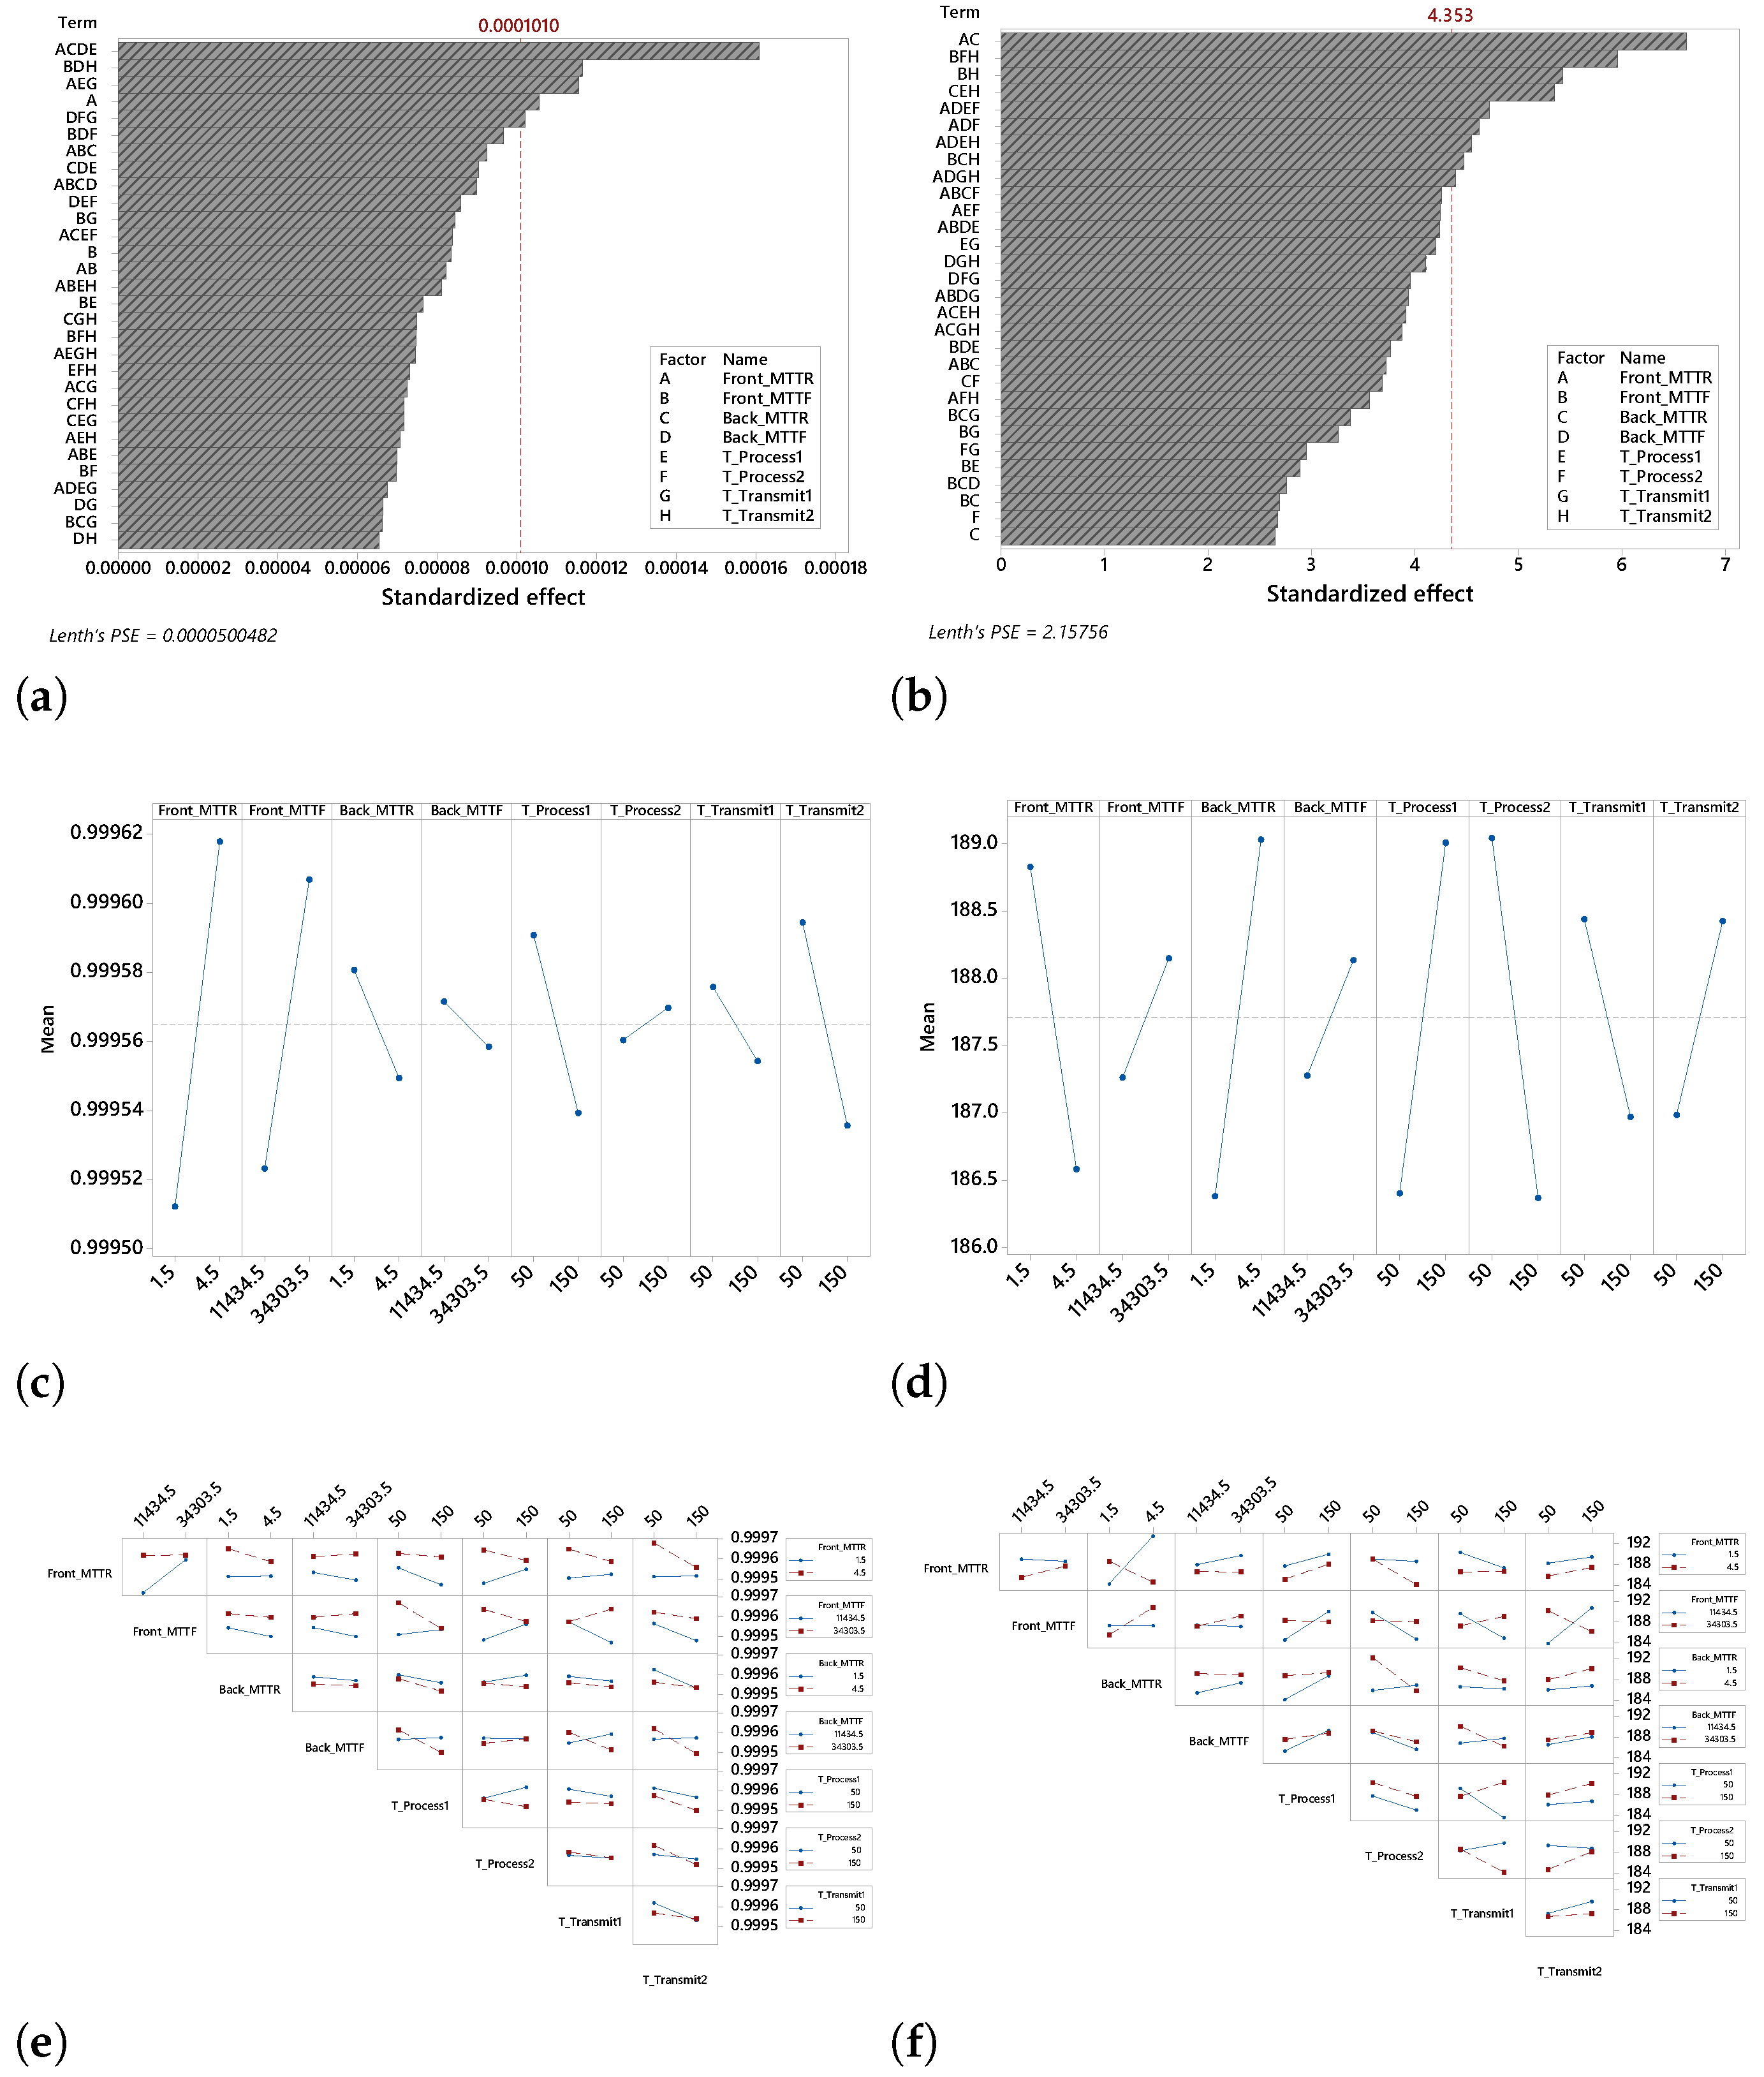
Figure 9 shows all of the DoE results.
Figure 9a presents the Pareto chart, which indicates the impact of each factor. The factors with the greatest impact on availability were: Front_MTTR, Back_MTTR, Back_MTTF, and T_Process1. The components with the least relevance were T_Transmit1 and T_Transmit2, gateways that do not directly impact system availability.
Figure 9e presents the interaction between the system factors. The average availability ranges from 0.9995 to 0.9997. When the lines are parallel, there is no interaction. The greater the interaction between the elements, the less parallel they are. As a result, we can observe that the most significant interactions occur when a component interacts with the system’s Front-End, either with its MTTR or with its MTTF.
Figure 9c shows the main effects graph. Each column presents a component. The effect of the difference in the set levels can be scaled based on the distance between the points and the slope of the line. In the Front_MTTF, T_Process1, and T_Transmit2 components, the impact of the levels was greater than the others.
Figure 9b shows the impact of the combination of components on the MRT. The factor with the AC index (composed of Front_MTTR and Back_MTTR) was the most impactful combination on the entire system. Combining Front_MTTF and T_Transmit2 has a significant impact on the entire system. In addition, the least impactful components were T_Process2 and Back_MTTR.
Figure 9f presents the interaction between the factors that impact the MRT. Some factors with a high level of interaction include: Front_MTTR x Back_MTTR and Front_MTTF x T_Transmit2. In both cases, the evaluator must carefully consider the trade-off between these factors, because the consequences would be significantly different.
Figure 9d shows the main effect for the metric MRT. In all cases, a steep slope of the lines significantly affects the MRT. The important thing here is to understand the alignment of the lines. For example, for Front_MTTR, the MRT decreases when this factor is increased.
5.2. Models Comparison
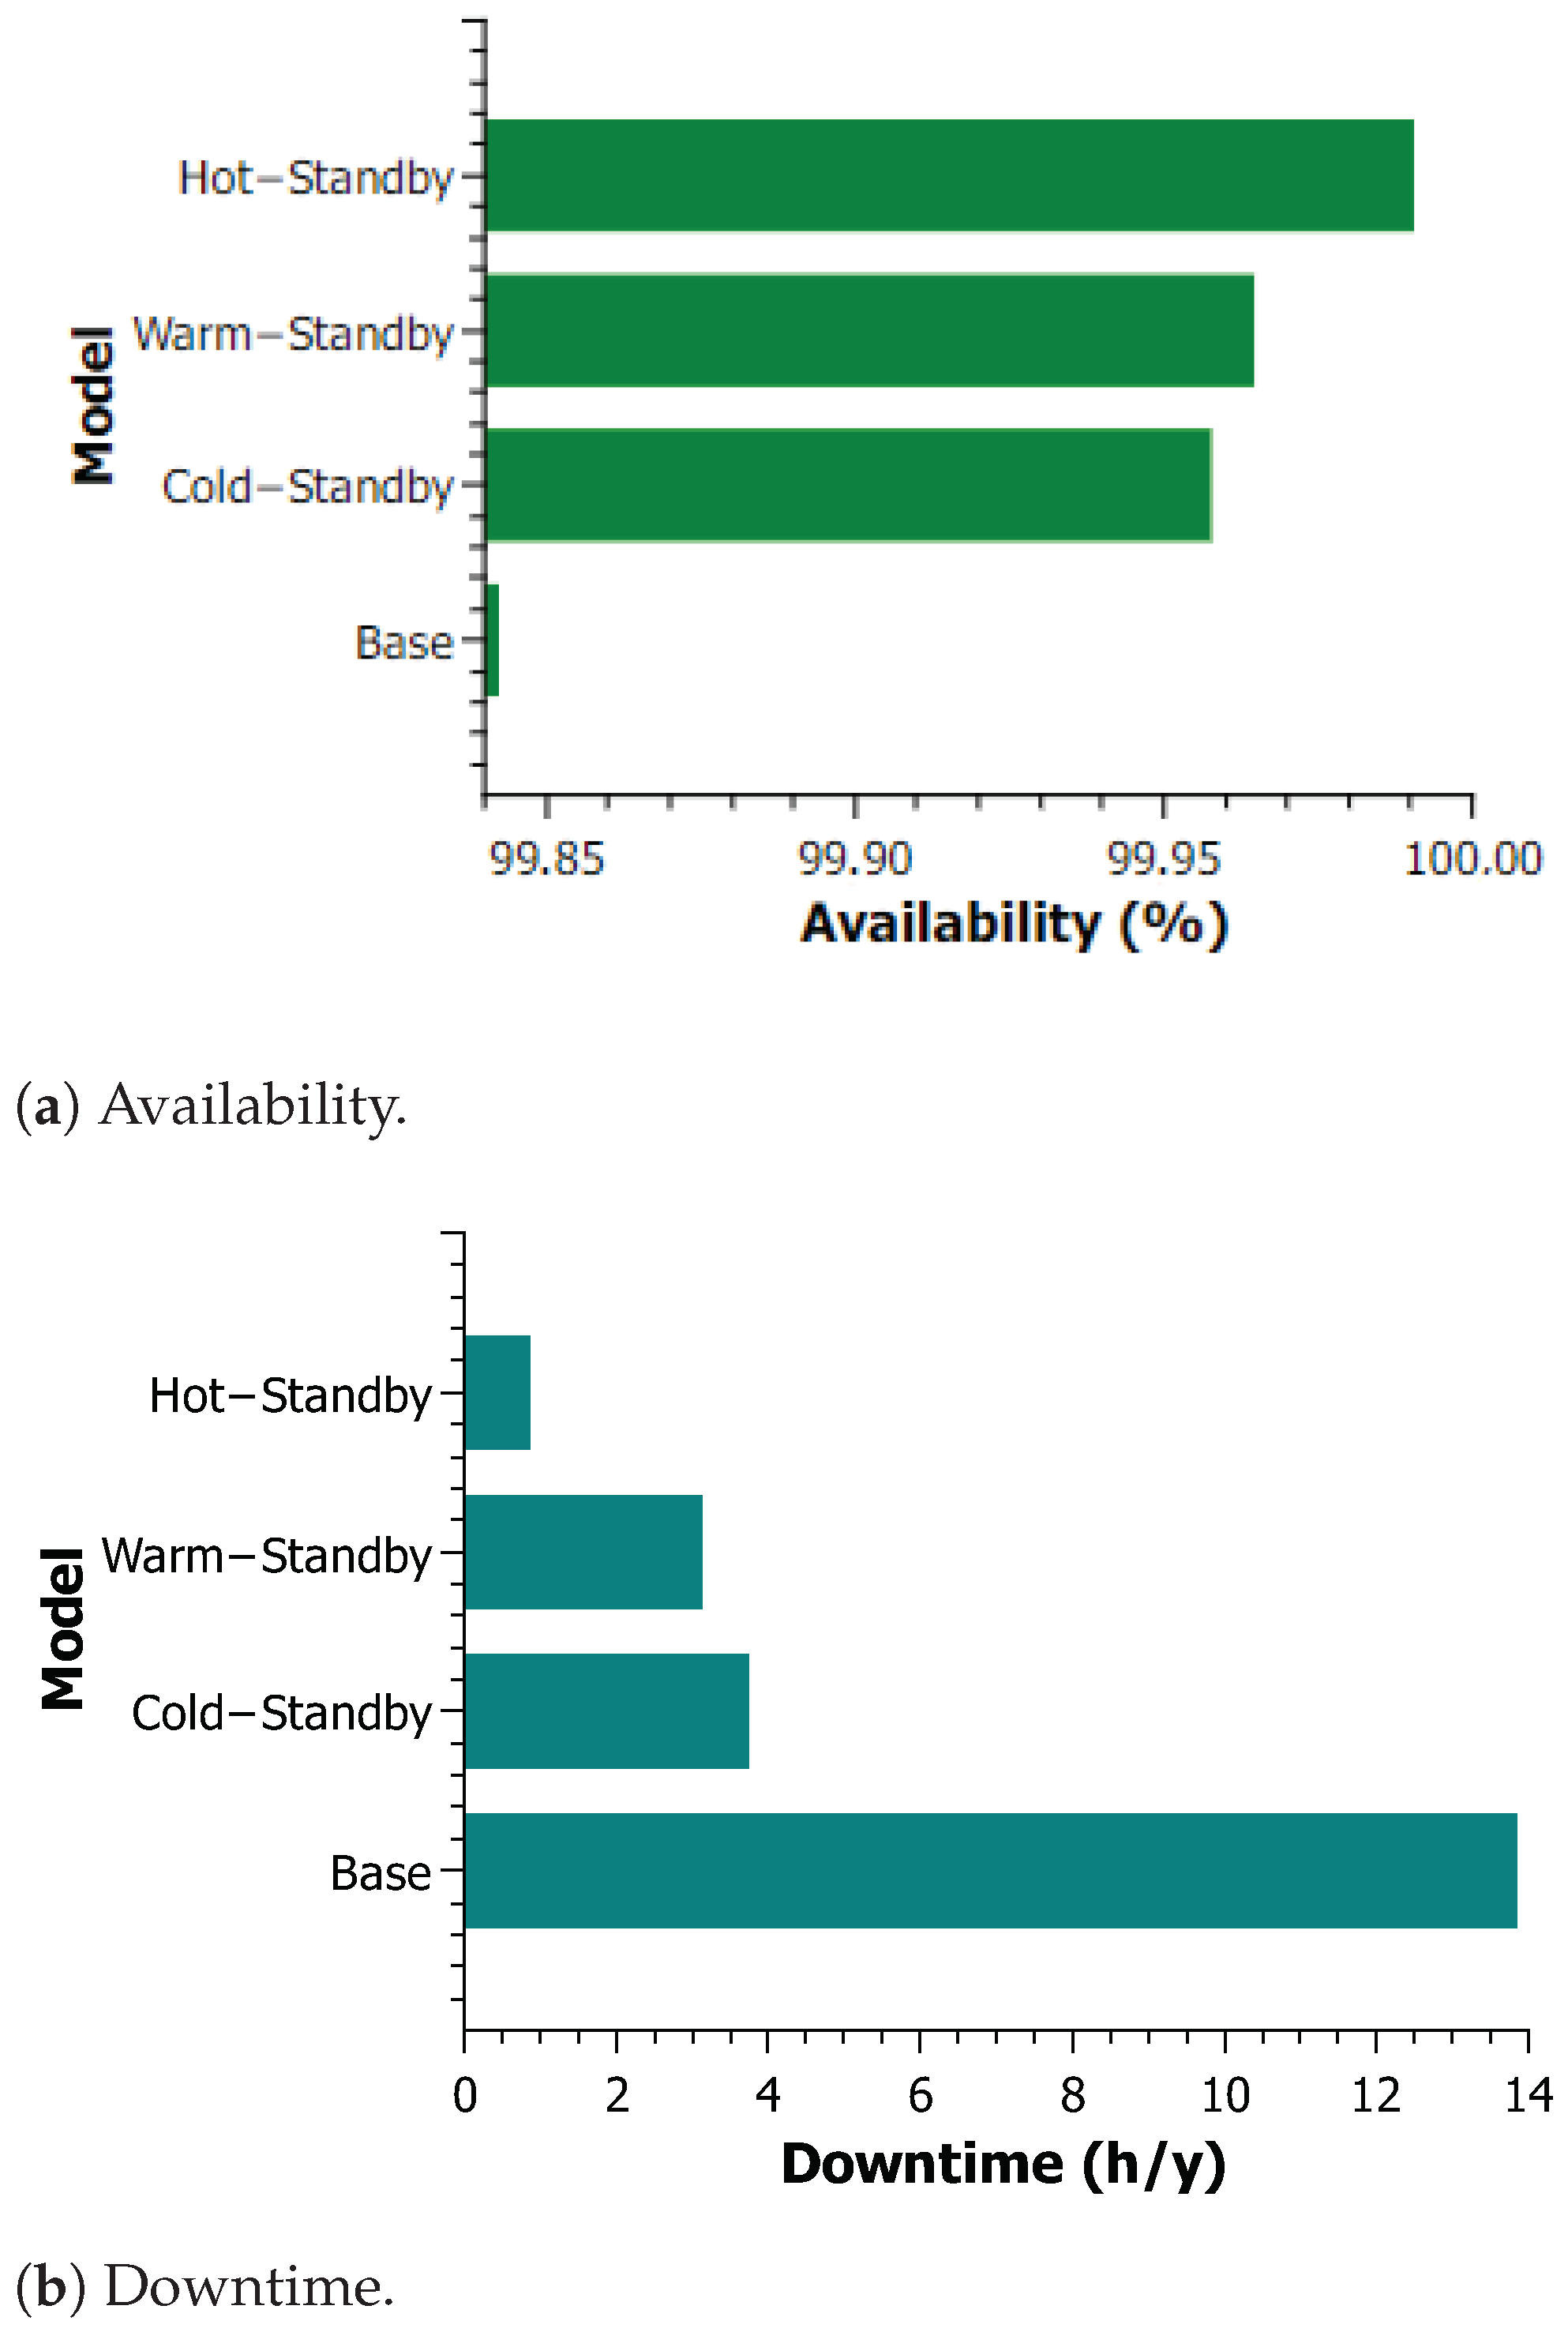
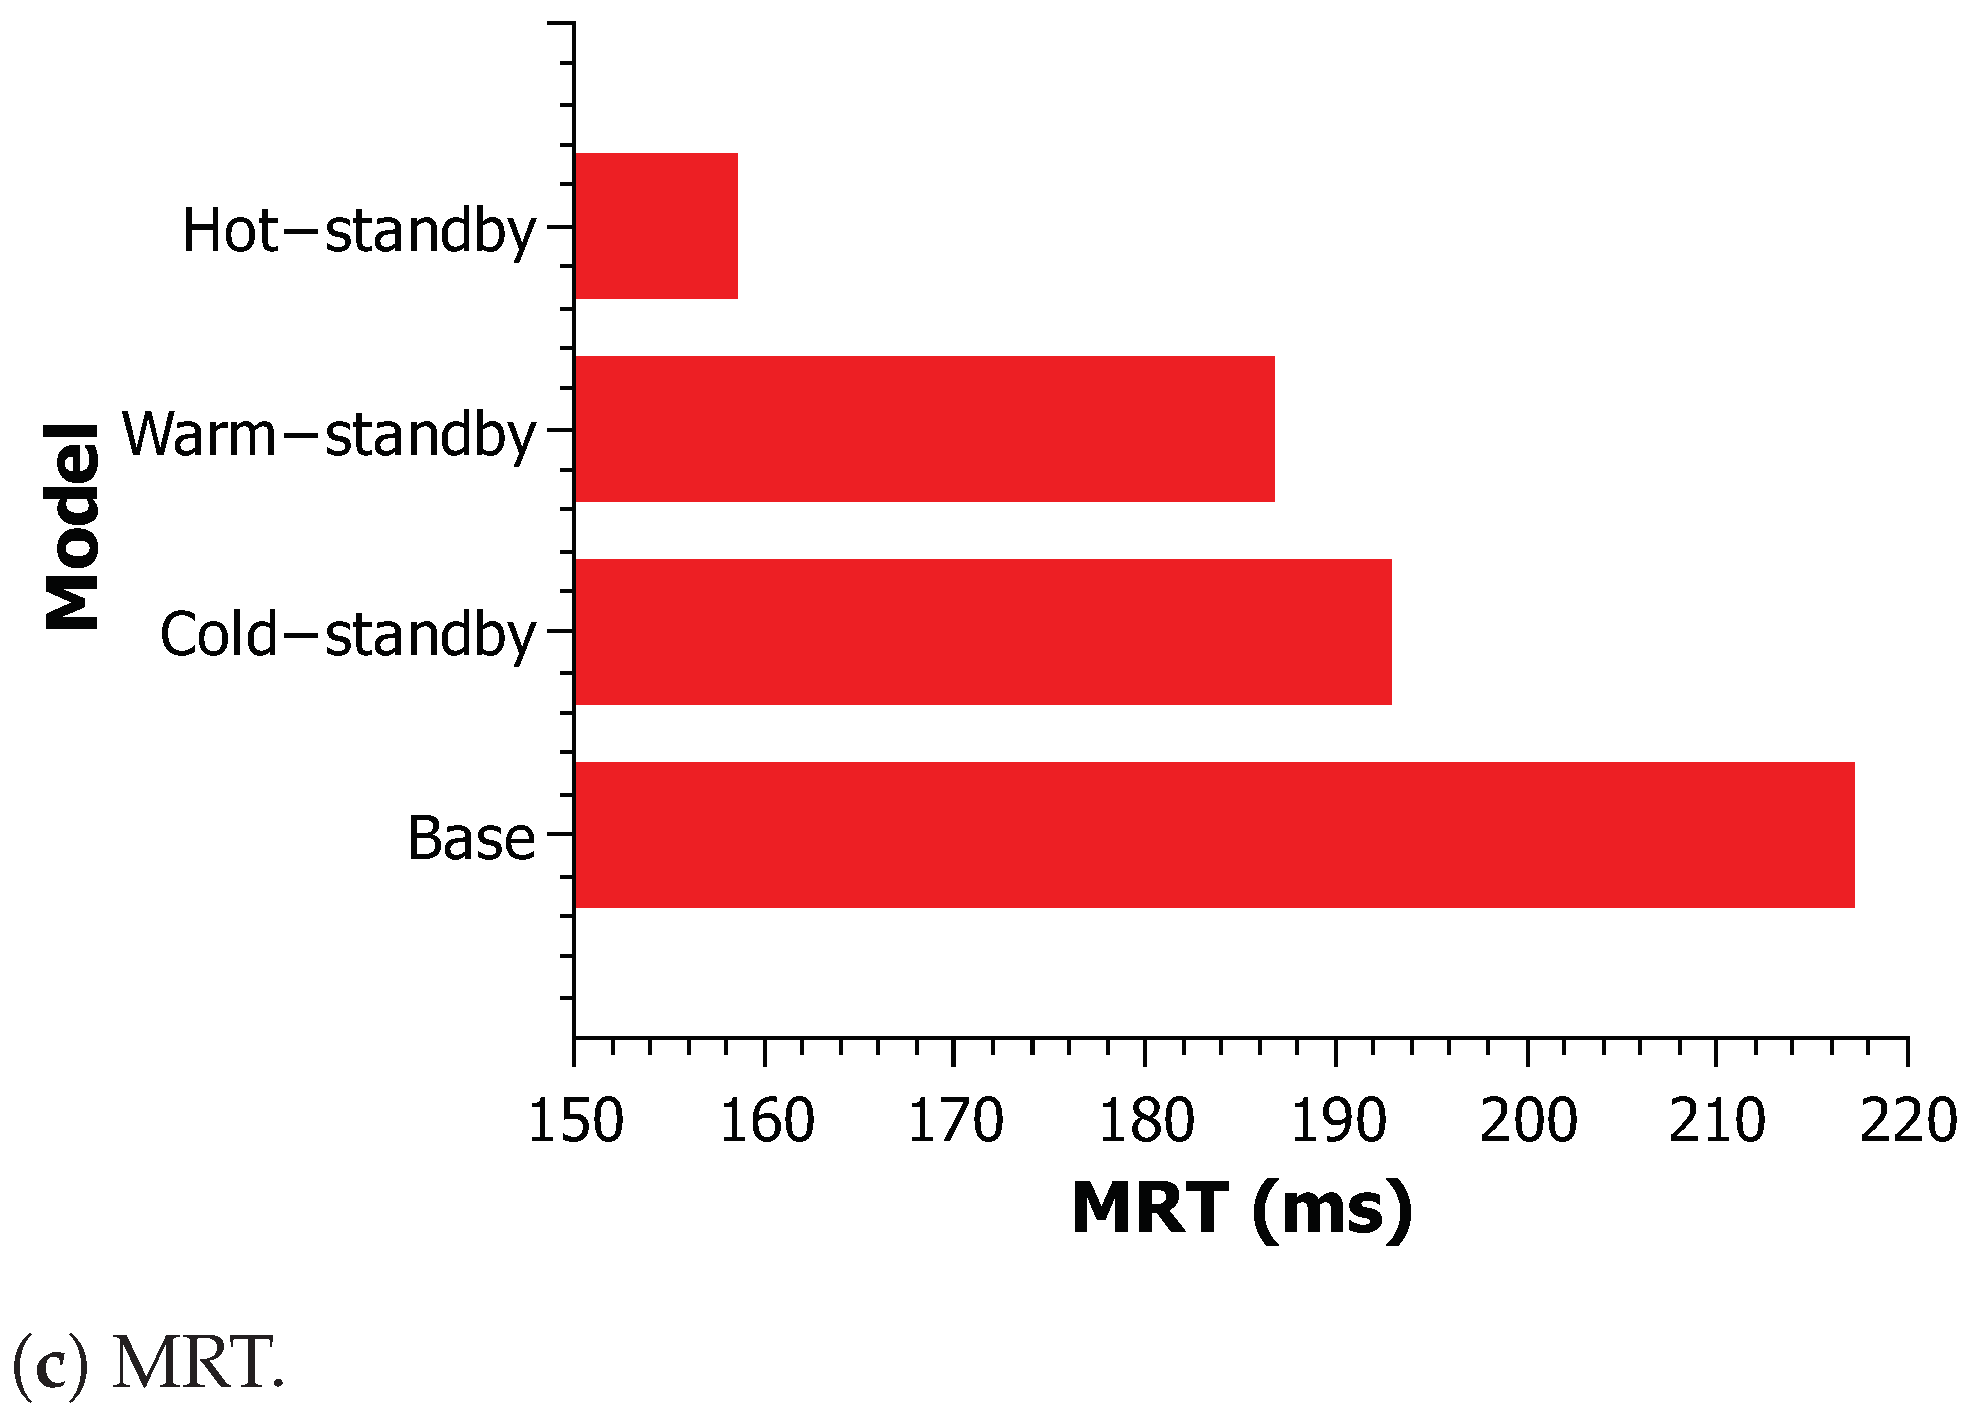
Figure 10 compares the availability (
Figure 10a), downtime (
Figure 10b), and MRT (
Figure 10) of the four models. Across all three criteria, the behavior was consistent, with the Hot-Standby model outperforming the warm standby model, which outperformed the cold standby model, and finally, the basic model. In terms of availability, the base model had 2.8 “9 s”, while the others had significantly better availability. The number of “9 s” for the cold standby model was 3.37, 3.44 for the warm standby model, and 4.0 for the Hot-Standby model. Therefore, there was a 1.2–9 difference between the base and Hot-Standby versions. However, this difference is more clearly seen when evaluating the downtime. The base model’s downtime was 13.8 h per year, which is considered excessive for this type of service [
8]. The values for downtime for the Cold-Standby, Warm-Standby, and Hot-Standby models were 3.7, 3.1, and 0.8, respectively. The downtime for the Hot-Standby model was less than one hour, which is a very acceptable value.
In order to compare the models based on MRT, the processing capacity of the Back-End was varied through the CB marking at P_ProcessCap2. In this example, we considered the processing capability to be the number of cores in a computer. We configured four different capacities for each model in this scenario, resulting in the basic, cold, warm, and hot versions each having 4, 6, 8, and 12 processor cores, respectively. The base model and Hot-standby model had MRT values of 217 ms and 158 ms, respectively. While this may seem like a small difference, it is significant when it comes to video streaming. Based on the simulations in this paper, it is therefore beneficial to invest in redundancy and equipment improvements. The decision on which type of redundancy and capacity machines to use is influenced by various factors, including the specific real-world context. The models can provide guidance on these questions.
5.3. Discussions and Insights
Video-on-demand (VOD) service platforms are systems that allow users to access and view video content on demand, rather than at a predetermined time. These platforms are typically accessed through a web browser or a dedicated app, and can include a wide range of content, including movies, TV shows, documentaries, and other types of video programming. Performability modeling and analysis is a crucial aspect of the design and operation of VOD service platforms, as it involves the evaluation of the performance and reliability of the system under different operating conditions. There are several techniques that have been proposed in the literature for the performability modeling and analysis of VOD service platforms, including queueing theory, Markov models, Petri nets, and simulation. One of the key challenges in the performability modeling and analysis of VOD service platforms is the need to account for the dynamic and highly variable nature of the traffic patterns on these systems. VOD service platforms are typically accessed by large numbers of users at different times of the day, and the traffic patterns can vary significantly, depending on the popularity of the content, the time of day, and other factors. This can make it difficult to accurately model the performance of the system under different operating conditions. To address this challenge, researchers have proposed a variety of techniques for modeling and analyzing the performance of VOD service platforms. For example, some researchers have used queueing theory to model the flow of packets or requests through the system, and to evaluate the impact of different traffic patterns on the performance of the system. Others have used Markov models or Petri nets to capture the temporal dependencies and concurrency in the system, and to analyze the reliability and availability of the service. Simulation is also a powerful tool for the performability modeling and analysis of VOD service platforms. It allows researchers to create detailed models of the system and to evaluate the performance of the service under a wide range of scenarios and operating conditions. This can be useful for identifying bottlenecks and for optimizing the design of the service, as well as for anticipating and responding to changes in the operating environment. Performability modeling and analysis is a crucial aspect of the design and operation of VOD service platforms. By using techniques such as queueing theory, Markov models, Petri nets, and simulation, researchers can evaluate the performance and reliability of these systems under different operating conditions, and identify potential bottlenecks and areas for improvement.
Performability modeling and evaluation of a video-on-demand service platform using SPN models can provide valuable insights and perspectives on the performance and reliability of the service. SPN models are particularly well-suited for this purpose, as they can capture the concurrent and asynchronous nature of the service, as well as the probabilistic transitions between states that are often present in real-world systems. One of the key benefits of using SPN models for performability modeling and evaluation is that they allow researchers to explore the behavior of the service under a wide range of scenarios and operating conditions. For example, an SPN model can be used to evaluate the impacts of different traffic patterns, network conditions, and hardware configurations on the performance of the service. This can be useful for identifying bottlenecks and for optimizing the design of the service. Another benefit of using SPN models is that they can provide a detailed and accurate representation of the service, including the interactions and dependencies between different components. This can be useful for identifying potential issues and vulnerabilities in the service, and for proposing solutions to improve the reliability and availability of the service. In addition to these benefits, SPN models can also be used to analyze the impacts of various external factors on the performance of the service. For example, an SPN model can be used to evaluate the impacts of changes in the regulatory environment, market conditions, or customer demand on the performance of the service. This can be useful for planning and decision-making, as it can help service providers to anticipate and to respond to changes in the operating environment. In summary, performability modeling and evaluation using SPN models can provide valuable insights and perspectives on the performance and reliability of a video-on-demand service platform. By capturing the complexity and uncertainty of real-world systems, SPN models can help service providers to optimize the design and operation of the service, and to anticipate and respond to changes in the operating environment.
The goal of this work is to introduce new models. The case studies are not intended to provide broad insights, as each system exhibits specific behaviors. In addition, we present a set of models in the article that can be widely applied by adjusting the parameters and using the Mercury tool to calculate the relevant metrics. To achieve this, the user must modify the values of the transitions and markings. However, the model is highly customizable, with the ability to alter 11 transition time parameters and 2 capacity markings (Front-End and Back-End) in the base model alone.
6. Related Works
Performability modeling and analysis is a crucial aspect of the design and operation of video streaming services. It involves the evaluation of the performance and reliability of the system under different operating conditions, such as varying traffic patterns, network conditions, and hardware configurations. There are several techniques that have been proposed in the literature for the performability modeling and analysis of video streaming services. In this literature review, we will discuss some of the most popular and effective techniques.
Queueing Theory: Queueing theory is a mathematical approach that is widely used for the performance analysis of systems that involve the flow of customers or packets through a series of servers or channels. It is particularly useful for analyzing systems with finite capacity, such as video streaming services, where the rate of incoming traffic may exceed the capacity of the system at certain times. Queueing theory can be used to model the waiting times of packets or customers in the system, as well as the utilization of the servers or channels.
Markov models: Markov models are a class of mathematical models that are based on the assumption of memoryless transitions between states. They are widely used for the analysis of systems that exhibit temporal dependencies, such as video streaming services, where the state of the system at any given time depends on the state of the system in the previous time step. Markov models can be used to model the reliability and availability of video streaming services, as well as the time it takes for a request to be served.
Petri nets: Petri nets are a graphical modeling language that is widely used for the analysis of systems with concurrent and asynchronous events, such as video streaming services. They can be used to model the flow of packets or requests through the system, as well as the dependencies between different events. Petri nets can be used to analyze the performance of video streaming services under different operating conditions, such as varying traffic patterns and network conditions.
Simulation: Simulation is a technique that involves the creation of a mathematical model of a system and the use of computer algorithms to evaluate the performance of the system under different operating conditions. It is a powerful tool for the analysis of video streaming services, as it allows researchers to explore the behavior of the system under a wide range of scenarios. Simulation can be used to analyze the reliability and availability of video streaming services, as well as the impact of different hardware configurations and network conditions on the performance of the system.
In summary, performability modeling and analysis is a crucial aspect of the design and operation of video streaming services. There are several techniques that have been proposed in the literature for this purpose, including queueing theory, Markov models, Petri nets, and simulation. These techniques allow researchers to evaluate the performance and reliability of video streaming services under different operating conditions, and to identify potential bottlenecks and areas for improvement.
Performability evaluation is the process of assessing the performance and reliability of video streaming services. It is an important factor in ensuring a high-quality user experience and ensuring that streaming services are dependable and meet the needs of users. Previous studies have found that the performance of video streaming services is often influenced by network congestion, content delivery network (CDN) performance, and device capabilities [
26,
27]. Network congestion can occur when too many users are accessing the same network resources at the same time, leading to delays and buffering. CDN performance can also impact the performance of the video stream, as the CDN is responsible for delivering the content to the user’s device. Device capabilities, such as processing power and Internet connection speed, can also affect the performance of the video stream. Another study found that the use of adaptive bitrate streaming (ABR) can improve the performances of video streaming services. ABR is a technique that adjusts the bitrate of the video stream in real-time, based on the user’s device and network conditions. By using ABR, video streaming services can provide a more stable and consistent viewing experience for the user. A third study found that the reliability of video streaming services is also influenced by the type of content being streamed. Live events, such as sports and concerts, are more susceptible to quality issues due to the real-time nature of the content. On-demand content, such as movies and TV shows, is generally more reliable as it is pre-recorded and can be stored on the streaming service’s servers. So, the performability of video streaming services is impacted by a variety of factors, including network congestion, CDN performance, device capabilities, and the type of content being streamed. The use of techniques such as ABR can help improve the performance and reliability of these services, and enhance the user experience. Furthermore, there is no universal model that currently provides a scalable and adaptable architecture for local streaming processing. This study stands out as being noteworthy because it depicts a model of a video-stream topology that designers may employ in ISPs.
Most of the research concentrated on video streaming because it is more relevant to the topic of this article. On the other hand, Hoque et al. [
12] opted to focus on the streaming service in general, offering a seven-layer architecture made up of micro-services. The study demonstrates that the design achieves a good mix of scalability and maintenance due to the solution’s strong cohesion and minimal coupling, with asynchronous communication across layers. Melo et al. [
8] calculate the availability of streaming video services in a lab-based test environment. The authors conducted a sensitivity analysis to identify the system’s crucial points in terms of availability so that they may be addressed, and to increase the system’s availability. Among the selected research, this was the only one that performed a sensitivity analysis. As previously stated, there is no standard for this analysis.
Some metrics are comparable to those used in our article, in that they analyze the quality of service (QoS) results using queuing networks. Irawan et al. [
28] have a great advantage in presenting MRT metrics, utilization, number of requests, discard rate, and availability. However, Irawan et al. [
28] did not explore multiple redundancy proposals to increase system availability. On the other hand, only two works presented capacity evaluation in the proposed architectures ([
9,
28]). Juluri et al. [
9] use the evaluation of the quality of experience (QoE), but different from our research, it evaluated the variation in the capacity of the service provided. Staelens et al. [
10] use a different approach, with a subjective assessment of video quality involving human observers. This technique allows for evaluating audiovisual quality in the same places and situations in which viewers often watch television.
Much is debated in the scientific community about QoE; one example is the obtaining of data from an industrial video streaming test bench to utilize in an experiment. Ebrahimidinaki et al. [
11] use this methodology in their work, where a method to predict QoE is proposed. Mari et al. [
29] focus on video encoding standards, diversified bitrate adaptation techniques, and parameters such as bandwidth, throughput, packet loss, delay, or jitter. The demand streaming approach must handle asynchronous peer arrivals quickly and enable strong recovery in the face of frequent peer failures. Do et al. [
30] propose an answer to this challenge with a multicast tree of applications called P2VoD (peer-to-peer for streaming video-on-demand). P2VoD presents a caching strategy, a generation concept, and a distributed directory service, among other things. Analytical investigation demonstrates that P2VoD is reliable and efficient. Cheng et al. [
31] bring new insights into research with the use of a caching scheme on clients and the introduction of generation for better client management. Chen et al. [
32] has as a relevant factor in its research a simple pre-search, where it works through measurement, being able to extract certain properties of user behavior. To ensure reliable and efficient operation, cloud computing architectures for video streaming services must have high availability, scalability, security, and fault tolerance. Designing these systems involves identifying weaknesses and proposing solutions through careful planning and analysis, and techniques such as sensitivity analysis, modeling hierarchies, and the study of redundancy mechanisms can improve performance. Melo et al. [
33,
34] studied the use of redundancy mechanisms to enhance the performance of cloud computing systems in video streaming services. Surveillance monitoring systems are essential for preventing various social issues in smart cities, but determining the key components and devices that influence their dependability is complex due to advanced video stream analysis, high availability, and the impact of various factors on trustworthiness. Nguyen et al. [
35] use stochastic Petri net models to analyze the reliability and availability of a surveillance monitoring system under different parameters to determine the highest level of dependability. The availability of a cloud video system (CVS) was analyzed by comparing Markovian and Semi-Markovian modeling based on the CVS architecture and component dependability [
36]. Data from cloud system research and operations were used to model the CVS, and the results informed the choice of modeling technique and the assessment of availability. It was suggested that the comparison of CVS availability models using Markovian and Semi-Markovian modeling processes should consider the architecture and component failures during different life-cycle phases, and that the results could be used to improve DevOps engineering procedures for the CVS.
As a result, all the titles mentioned below contain metrics for determining whether or not the service is suitable for a certain video.
Table 7 presents a comparison of the works according to the following criteria: metrics used for the evaluation, capacity variation, sensitivity analysis, and multiple redundancy strategies. Our paper attracts attention since it presents all of these qualities.
