Article

Modeling the Effect of Selected Microorganisms’ Exposure to Molasses’s High-Osmolality Environment

1
Faculty of Technology Novi Sad, University of Novi Sad, Bul. cara Lazara 1, 21000 Novi Sad, Serbia
2
Institute for Food Technology, University of Novi Sad, Bul. cara Lazara 1, 21000 Novi Sad, Serbia
3
Faculty of Agronomy in Čačak, University of Kragujevac, Cara Dušana 34, 32000 Čačak, Serbia
*
Author to whom correspondence should be addressed.
Appl. Sci. 2023, 13(2), 1207; https://doi.org/10.3390/app13021207
Submission received: 24 November 2022 / Revised: 12 January 2023 / Accepted: 13 January 2023 / Published: 16 January 2023
(This article belongs to the Section Applied Microbiology)

Abstract

:

Featured Application

Developed mathematical models and correlations describing the effects of the high-osmolality environment of sugar beet molasses on the viability of selected microorganisms, allowing a better understanding and management of the safety of different products during the application of molasses in food processing.

Abstract

In this research series, several sugar beet molasses of different osmolalities were inoculated with a mix of the following microorganisms, Escherichia coli, Salmonella spp. and Listeria monocytogenes, to develop mathematical models and correlations of the effect of different levels of osmolality and different exposure time to the viability of the selected microorganisms. The respective enumerations of Escherichia coli, Salmonella spp., Listeria monocytogenes, Enterobacteriaceae, and total plate count were conducted on inoculated molasses samples of different osmolalities (from 5500 to 7000 mmol/kg) and at different exposure times (from 0 to 5 h). The results showed that by increasing molasses osmolalities, all the selected microorganisms’ exposure time viability measures statistically decreased significantly. Salmonella spp. showed the highest viability of all the tested microorganisms in a high osmotic environment. In contrast, Listeria monocytogenes showed the least resilience to osmotic stress, with a reduction in the numbers below the detection limit. The developed mathematical models of microorganisms’ viability exposed to molasses’s high-osmolality environment were statistically significant, allowing for the good prediction of a number of microorganisms based on exposure time and osmolality levels. The obtained results describe molasses’s excellent microbial load-reducing capability and provide the potential for applications in the production of safe foods.

1. Introduction

Sugar beet molasses (molasses) is a common raw material used primarily in industrial fermentations, characterized by high dry matter and phenolic compound content [1,2]. Sugar beet molasses provides high osmotic pressure during osmotic drying and has been recently utilized as a cost-effective alternative medium [3,4,5] to other conventional osmotic solutions for drying meat [6,7,8], fruits [9], vegetables [10], and plants [11]. In addition, it is shown that molasses’s chemical compounds, such as polyphenols and inorganic salts, provide significant potential in reducing foodborne bacteria activities [12,13].
Osmotic pressure, by which molasses is characterized with high values, is a colligative property of the solution, while osmolality presents a solution to the osmotic concentration, the measure of osmotic pressure [14].
Microorganisms experience osmotic stress when in contact with a hyperosmotic solution, such as molasses. Osmotic pressure changes cause significant stress on bacteria cells by leading to dehydration and shrinkage in hypertonic environments [15,16].
Commission Regulation (EU) No 2073/2005 [17] identifies Salmonella, E. coli, and L. monocytogenes as the most important microorganisms according to the food safety and process hygiene criteria. From a public health perspective, these three microorganisms are important for the following reasons:
-
Salmonella is the most essential pathogen originating from poultry, owing to salmonellosis, one of the most frequent diseases in public health [18];
-
E. coli is an indirect indicator of fecal contamination and is exceptionally significant because of the highly pathogenic isolates of 0157:H7 [19,20];
-
L. monocytogenes, a significant foodborne pathogen, is sometimes correlated with poultry products and occasionally leads to clinical disease in poultry [19].
The microorganisms mentioned above possess different mechanisms to endure harsh environmental conditions. For example, Salmonella exposure to an environment characterized by high osmotic pressure leads to water loss and subsequent significant cell shrinkage, a consequent increase of all intracellular metabolites’ concentrations. In addition, instant plasmolysis can result in the inhibition of a variety of physiological processes, ranging from nutrient uptake to DNA replication [21].
E. coli possesses different mechanisms that can persevere osmotic and desiccation stress and show long-term viability in challenging environmental conditions [22], while L. monocytogenes have developed processes to withstand increased osmotic pressure via compatible solutes, intracellular accumulation, and the modification of the adaptive cell envelope and proteomes [23,24]. A number of proteins are involved in the osmotic stress response of L. monocytogenes cells [25]. These proteins include transport ones, compatible solute uptake, cell wall modification proteins, regulatory proteins, and proteins acting against general stress [21].
The possibility of applying artificial neural networks (ANNs) in diverse utilizations has caused it to become essential in modeling and optimizing food control and preservation processes [26,27]. Artificial neural networks (ANNs) are applicable for clustering data libraries, understanding distribution patterns, and recognizing internal pathways. An ANN consists of a matrix with the cells as the network neurons, while the synapses are the connections between the cells [28,29]. Synapses are specific negative or positive correlations between values in the cells. An ANN’s structure defines the number of synapses of each cell or neuron. It can be only one of or several of them. The input neuron is the cell with entered data, while the output neuron is the cell with total values. The hidden neurons contain the algorithm that calculates a specific function or activation function, and these cells connect the input and output neurons. The activation function and the synapses’ values can be randomly defined or set with selected parameters during neural network structure compiling. The parameter that affects the volume of change in synapses’ values (an increment parameter) is also defined before the network is started, and it directly influences the speed of network learning [30].
The main advantage of ANNs includes their ability to learn from pre-existing experiences and generalize solutions for the next applications. Some other advantages are their ability to retrieve details from incomplete or noisy data and their suitability for providing solutions where algorithms are difficult to establish or do not exist [31].
The goal of this research is to develop mathematical models and correlations of the effect of different levels of osmolality and different exposure times to the viability of selected microorganisms when exposed to the high osmotic pressure environment of sugar beet molasses. The developed models could be used in a practical manner in the different foods’ osmotic dehydration processes, where the information regarding food safety could be calculated and foreseen before the start of the process.

2. Materials and Methods

2.1. Preparation of Sugar Beet Molasses Solutions

Molasses, with an initial osmolality of 7370 mmol/kg, was provided by the sugar factory “Crvenka” A.D. factory, Crvenka, Serbia. For the dilution of starting molasses, distilled water was used to the preset osmolality values (5500, 5750, 6000, 6250, 6500, 6750, and 7000 mmol/kg). The osmolality of molasses and diluted molasses was measured and tested with a pressure osmometer: VaproR-Vapor, model 5600, ELITechGroup, Puteaux, France.
The initial microbiological profile for molasses was established by the standard ISO methods for the tested microorganisms, as follows: E. coli—<10 cfu/g (ISO 16649-2:2001 [32]); Salmonella spp.—negative in 25 g (ISO 6579-1:2017 [33]); L. monocytogenes—<10 cfu/g (ISO 11290-2:2017 [34]); Enterobacteriaceae—<10 cfu/g (ISO 21528-2:2017 [35]). Meanwhile, the total plate count (TPC) was 60 cfu/g (ISO 4833-1:2014 [36]). The quantification limit was <10 cfu/g for every standard ISO method used for the enumeration of the investigated microorganisms. However, in the case of Salmonella spp. the detection limit was <1 cfu in 25 g.

2.2. Contamination of Molasses Solutions

First, 100 g of prepared molasses solution samples were inoculated with referent cultures mixed together: Salmonella enteritidis ATCC 13076, typhimurium ATCC 14028, a mix of E. coli ATCC 8739 and ATCC 25922 and a mix of L. monocytogenes ATCC 13932 and 19111. Following reference, strains were used: Salmonella typhimurium ATCC 14028, enteritidis ATCC 13076, E. coli ATCC 25922 and ATCC 8739, L. monocytogenes ATCC 19111 and ATCC 13932 (Microbiologics, St Cloud, MN, USA). Used microorganisms were chosen as indicators of food safety and process hygiene criteria according to Commission Regulation (EU) No 2073/2005 [16]. Storing and maintenance of the reference cultures from commercial sources were performed according to ISO 11133:2014 [37]. Freeze-dried reference cultures were stored in the refrigerator until the activation time. After opening the package, the subculture was prepared according to the producers’ instructions. Storage was performed on slant nutrient agar (Himedia, India) at +4 °C of refrigerated temperature. Cultures were weekly refreshed by sowing to a new slant nutrient agar of the same producer, and after 28 days, cultures were safely removed. Working cultures were obtained from the related subcultures, via plating onto nutrient agar (Himedia, India) and incubation for 18 to 24 h at 37 °C. Next, 24 h old colonies (one or more of them) of the test microorganism working culture material were transferred by microbiological loop, under aseptic conditions, to the tube with sterile saline water. Then the tube was intensely shaken on the vortex. Using a densitometer (DEN-1, Biosan, Latvia), the respectively suspensions’ densities were corrected to match the values of 2 McFarland standards, representing a bacterial concentration of 6 × 10⁸ cfu/mL, for each referent culture. Using this procedure, the initial suspension was obtained. From the initial test on the microorganisms’ suspensions, a series of decimal dilutions in sterile saline water were prepared. Further, 1 mL of each dilution was transferred into a Petri dish and mixed with Tryptic Soya (TSA) agar (Himedia, India), in an effort to confirm the numbers of the inoculated test microorganisms. All samples of molasses’ solutions were inoculated with 1 mL of 102 dilution to obtain an approximative 360,000 cfu/mL of all test microorganisms.
After the contamination procedure, molasses’ solutions were homogenized, and samples were taken for the selected microorganisms’ analysis at the beginning of the process, marked as 0 h [38].

2.3. Incubation Conditions

All prepared, inoculated molasses solution samples were put into a constant temperature chamber (KMF 115 l, Binder, Germany) at 20 °C. Every 15 min, samples’ manual stirring of the same duration and intensity was conducted. After 0.5, 1, 2, 3, and 5 h of exposure time, inoculated molasses’ solutions samples were taken for the selected microorganisms’ analysis.

2.4. Methods of Analysis of Selected Microorganisms

E. coli enumeration was performed following the standard method, in ISO 16649-2:2001 [32], as follows: after initial suspension preparation in buffered peptone water, selected dilutions were prepared, and 1 mL of each dilution was transferred into a Petri dish and mixed with Tryptone Bile X-glucuronide (TBX) agar (Oxoid, UK). Then the plates were incubated at 44 ± 1 °C for 18–24 h. Typical colonies of β-glucuronidase-positive E. coli were counted, after the pass of the determined incubation time.
Salmonella spp. enumeration was performed according to the modified standard method, in ISO 6579-1:2017 [33], and modification was as follows: after initial suspension preparation in the buffered peptone water, selected dilutions were prepared. Next, 1 mL of each dilution was transferred and spread onto Xylose Lysine Deoxycholate (XLD) agar (Oxoid, UK), and then the plates were incubated at 37 ± 1 °C for 24 ± 3 h. Typical Salmonella spp. colonies were confirmed by the application of appropriate biochemical tests, after the incubation time.
L. monocytogenes enumeration was performed according to the standard method, in ISO 11290-2:2017 [34], as follows: after initial suspension preparation in buffered peptone water, selected dilutions were prepared. Next, 1 mL of each dilution was moved and spread onto Agar Listeria Ottaviani & Agosti (ALOA) (Oxoid, UK). Then the plates were incubated at 37 ± 1 °C for 24 ± 2 h and for an additional incubation for 24 ± 2 h. Presumptive L. monocytogenes colonies were confirmed by applying appropriate morphological and biochemical tests, after the pass of incubation.
Enterobacteriaceae enumeration was performed according to the standard method, in ISO 21528-2:2017 [35], as follows: after initial suspension preparation in the buffered peptone water, selected dilutions were prepared. Next, 1 mL of each dilution was transferred into a Petri dish and mixed with Violet Red Bile Glucose (VRBG) agar (Oxoid, UK). Then the plates were incubated at 37 ± 1 °C for 24 ± 2 h. Via tests for the fermentation of glucose and the presence of oxidase, typical colonies were confirmed, after incubation.
Total plate count (TPC) enumeration was conducted in accordance with the standard method, in ISO 4833-1:2014 [36], as follows: after initial suspension preparation in the buffered peptone water, selected dilutions were prepared, and 1 mL of each dilution was transferred into a Petri dish and mixed with Plate Count (PCA) agar (Oxoid, UK). The plates were incubated at 30 °C for 72 h. Colonies of TPC were counted, after incubation time.

2.5. Response Surface Methodology

Response surface methodology (RSM) was applied to develop the second-order polynomial models. Five models were developed to relate five responses (Y) to two independent variables (X), in the following form:
Y k = β k 0 + i = 1 2 β k i X i + i = 1 2 β k i i X i 2 + β k i j X i X j k = 1 5 ;
where βkij are the regression coefficients; Y are either E. coli (Y1), L. monocytogenes (Y2), Salmonella (Y3), Enterobacteriaceae (Y4), or TPC (Y5) log10 (cfu/g) values, and X represents exposure time (X1) and molasses osmolality (X2).
Analysis of variance (ANOVA) and application of post hoc Tukey HSD test were used to determine the significant effect and interaction of individual factors for every response. ANOVA, RSM, and ANN analysis were calculated by using the software package StatSoft Statistica ver. 10.0., while the parameters of the post hoc developed models’ quality were calculated using Microsoft Excel ver. 2016.

2.6. Correlation Analysis

Mean values’ color plot diagram for all independent variables (exposure time and osmolality level) and responses of microorganisms’ viability in molasses (E. coli, L. monocytogenes, Salmonella spp., Enterobacteriaceae, and TPC) were developed by R software v.4.0.3 (64-bit version). The corrplot instruction was applied, with the “circle” method, with the upper type enabled, as a graphical tool to represent the correlation between the tested responses of observed samples.

2.7. Principle Component Analysis

Principal component analysis (PCA) was applied as the pattern recognition method, by using assay descriptors, such as osmolality, exposure time, and the E. coli, L. monocytogenes, Salmonella spp., Enterobacteriaceae, and TPC of selected microorganisms, to describe and differentiate various tested samples, their responses, and independent variables.

2.8. Artificial Neural Network Modeling

In order to design the ANN model for predicting all microorganisms’ viability responses, a multilayer perceptron model was applied to normalized data, including three layers (input, hidden, and output) [39,40]. The building and the training of the ANN modeling were conducted as defined earlier by Voća et al. [41].
The neural network model, including the weight coefficients and biases, is defined with Equation (2):
Y = f 1 W 2 · f 2 W 1 · X + B 1 + B 2
where Y is the outputs matrix; f1 and f2 are the hidden and output layers transfer functions, respectively; and X is the matrix of inputs [42].
The weight coefficients W1 and W2 were calculated as described earlier by Brandić et al. [43]. The ANN model was developed to predict the number of E. coli, L. monocytogenes, Salmonella spp., Enterobacteriaceae, and TPC, according to osmolality and exposure time.

Error Analysis

The calculated ANN model was validated throughout error analysis utilizing the coefficient of determination (r2), reduced chi-square (χ2), mean bias error (MBE), root mean square error (RMSE), and mean percentage error (MPE), using Equations (3)–(6) [44]:
χ 2 = i = 1 N x e x p ,   i x p r e , i 2 N n  
R M S E = 1 N · i = 1 N x e x p ,   i x p r e , i 2 1 / 2  
M B E = 1 N · i = 1 N x e x p ,   i x p r e , i  
M P E = 100 N · i = 1 N x p r e , i x e x p ,   i x e x p ,   i  
where xexp,i marks the experimental values, xpre,i presents the value obtained by the model, and N and n are the number of observations and that of constants, respectively.

3. Results and Discussion

Osmolality, as a measure of osmotic pressure [45], was selected thanks to its straightforward methodology and quick response availability in the function of potential food processing and safety control and management. Furthermore, molasses is also characterized by high osmotic pressure [1] and the possibility to inhibit microbiological growth [46]; hence, the fast and reliable osmotic pressure method is used.

3.1. RSM Modeling

In Table 1, the average values of five microbiological parameters of the tested microorganisms exposed to molasses at different times and different osmolality levels are shown.
The presented results showed that the numbers of E. coli and L. monocytogenes instantly significantly reduced when these microorganisms were inoculated (in numbers of 5.08 log10(cfu/mL)) in molasses for all values of osmolality. Higher values of molasses’s osmolality have shown a significant instant reduction of Salmonella spp. (from 5750 mmol/kg). These results point at microorganisms’ viability reduction, as a stress response from an unfavorable high-pressure environment [47]. The values of Enterobacteriaceae and TPC at time 0 in all molasses’s osmolality values, show the same behavior as previous microorganisms when in contact with molasses, with a significant instant reduction from the inoculation numbers of 5.38 and 5.56 log10(cfu/mL) for Enterobacteriaceae and TPC, respectively.
With the prolongation of the exposure time of all tested microorganisms to any of the tested molasses osmolalities, a further statistically significant decrease in the number of microorganisms occurred. These results indicated that high-osmolality environments, such as molasses, had in addition to an instant reduction effect on microorganisms’ viability, a prolonged reduction effect that increases with the exposure time flow. Chen et al. [13] reported that the sugar beet molasses antibacterial mechanism may be due to the damaged cytoplasmic membrane and bacterial proteins caused by sugar beet molasses polyphenols, changing bacterial cells’ physiology and morphology.
The trends of the effect of the exposure time of the five tested microorganisms to the high molasses osmolality environment on their viability, expressed as the number of microorganisms, can be seen in the developed mathematical models’ graphics, shown in Figure 1a–e.
The presented graphics show that a reduction in the E. coli, Salmonella, Enterobacteriaceae, and TPC numbers was more rapid at the beginning of the exposure to the molasses. The reduction rate decreased at later time points of the exposure (the results and discussion of the developed mathematical models will describe this quadratic dependence in more detail). The trend of the number for the L. monocytogenes dependence on exposure time shows a more linear decrease with the molasses exposure time flow (Figure 1b).
The results of the effect of molasses osmolality levels on the tested microorganisms’ viability (Table 1) show that by increasing osmolality levels at the same exposure time points, there is a statistically significant decrease in all the tested microorganisms’ values. The presented results indicate that, in the same way as exposure time, molasses’ osmolality values also statistically significantly affect all the tested microorganisms’ viabilities. The trends of the effect of molasses’s osmolality levels on the five tested microorganisms’ viability, expressed as a number of microorganisms, can be seen and compared with the trends of the effects of the exposure time on the developed mathematical models’ graphics, shown in Figure 1a–e. From these graphics, it can be seen that the molasses’ osmolality had a less significant effect on the microorganisms’ viability than exposure time, which can be explained by the smaller tested experimental range of osmolality values (from 5500 to 7000 mmol/kg) compared with exposure times’ experimental range (from 0 to 5 h).
The minimal numbers of all the tested microorganisms, indicating maximal reduction, were obtained when exposed to molasses with maximal osmolality (7000 mmol/kg) at the longest exposure time (5 h). The highest minimal obtained number was for Salmonella spp. (4.30 log10(cfu/g)), pointing to the highest resilience to the osmotic stress among tested microorganisms. The minimal obtained result for E. coli was 3.19 log10(cfu/g), while the lowest minimal result was for L. monocytogenes (1.00 log10(cfu/g)—below the level of detection), indicating on total reduction in this inoculated microorganism. The high levels of reduction in the present tested microorganisms in molasses, in addition to a high osmotic pressure environment, can be explained by the molasses’ specific chemical composition. The obtained results are correlated with Chen et al. [13], where the special antimicrobic activity of molasses’ antioxidative compounds is demonstrated, especially the phenolic compounds on L. monocytogenes. Shafiqa-Atikah et al. [46] also showed molasses’ antioxidant capabilities and showed that they had high antibacterial activity toward the selected foodborne pathogens.
RSM was chosen to develop the mathematical models of the selected microorganisms’ viability exposed to the high-osmolality environment of molasses. Table 2 shows the results of the ANOVA of the RSM models. On the basis of experimental data, mathematical models were developed for the following microorganisms’ numbers for molasses: E. coli., L. monocytogenes, Salmonella spp., Enterobacteriaceae, and TPC. On the basis of these results, the statistically significant effects of independent variables (exposure time and molasses osmolality), together with their interactions on mathematical model responses, were analyzed.
A second-order polynomial (SOP) in the form of Equation (1) for five responses (numbers of E. coli., L. monocytogenes, Salmonella spp., Enterobacteriaceae, and TPC), in response surface methodology, is used.
The results of Table 2 show that the values of the numbers for all the tested microorganisms (E. coli, L. monocytogenes, Salmonella spp., Enterobacteriaceae, and TPC) were statistically significantly affected by both the independent variables, where the more influential variable was shown to be time. The SOP linear terms for exposure time and osmolality statistically significantly contributed to the formation of mathematical models for all tested microorganisms. The quadratic term for exposure time was statistically significant for all the analyzed microorganisms, except for L. monocytogenes. The cross products of exposure time and osmolality were statistically significant in cases of the following microorganisms: L. monocytogenes, Salmonella spp., Enterobacteriaceae, and TPC. Residual variance, which is used as a mathematical model from the experimental data deviation measure, was not statistically significant in the cases of all five tested microbial responses. This indicates that the applied models for the responses of all the tested microorganisms’ numbers adequately represented the viability of these microorganisms in molasses at given exposure time and osmolality parameters. The coefficient of determination (R2) value is defined as the ratio of the described variance to the total system variance [48], and it ranged from 0.96 to 0.99, also indicating a very good correlation of the SOP models with the experimental values.
Table 3 shows the regression coefficients of five second-order polynomial models for the numbers of the selected microorganisms in molasses. The statistical significance of the individual coefficients is also shown.
Regression coefficients are used to complete the mathematical models of the selected microorganisms’ viability in molasses, as quadratic equations. By solving these equations with the input values of the independent variables (exposure time and osmolality level), the values of desired responses (number of E. coli, L. monocytogenes, Salmonella spp., Enterobacteriaceae, and TPC) can be calculated. Furthermore, the level of the selected microorganisms can be predicted in the ranges of the applied values of the independent variables, the exposure time, and the osmolality level, for which mathematical models were developed.

3.2. Color Correlation Analysis

Figure 2 shows a color correlation diagram between seven parameters of independent variables and the responses of microorganisms’ viability in molasses. The values of the correlation coefficients between the two tested parameters are visually presented by color (blue for positive and red for negative correlation) and the size of the circles.
The results of the correlation analysis show a high level of positive correlation between all the responses of the microorganisms’ viability in molasses (number of: E. coli, L. monocytogenes, Salmonella spp., Enterobacteriaceae, and TPC), while there is a high level of negative correlation between the independent variable of exposure time and all the tested microorganisms’ viability responses. The effect of the osmolality level is shown to have a lower negative correlation on all the microorganisms’ viability responses, with the highest negative correlation on the Salmonella spp.’s viability response.

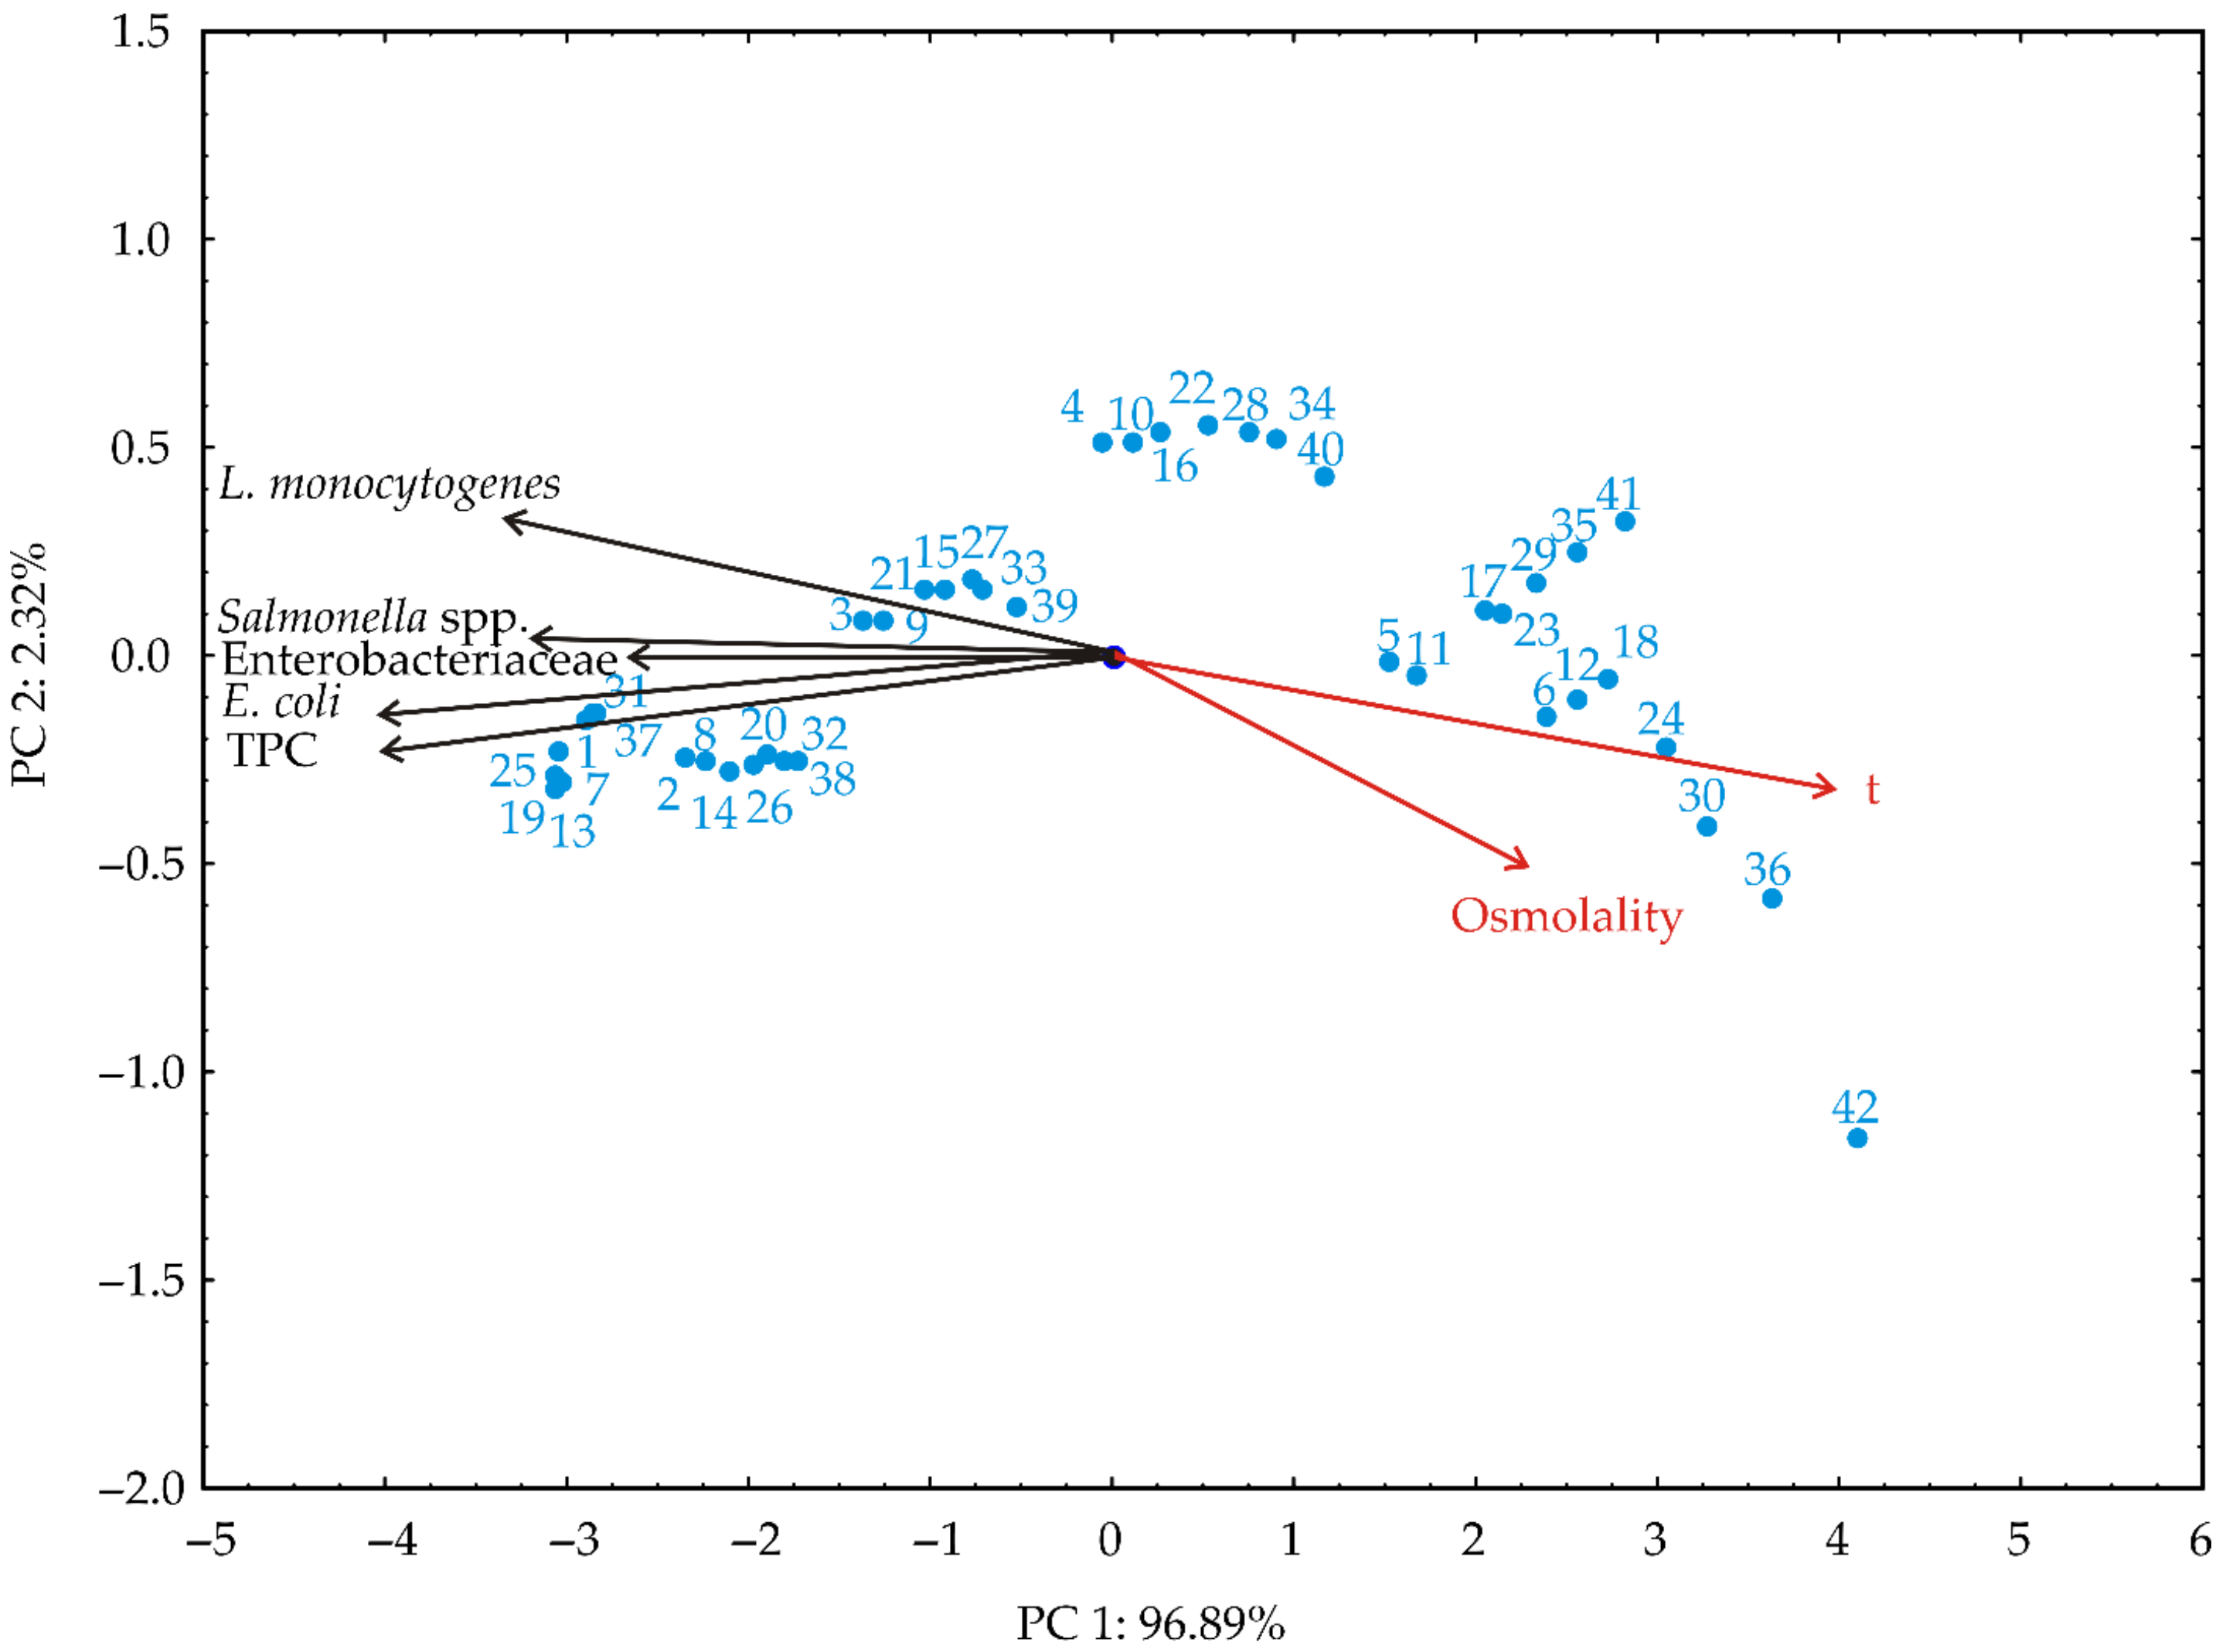
3.3. Principal Component Analysis
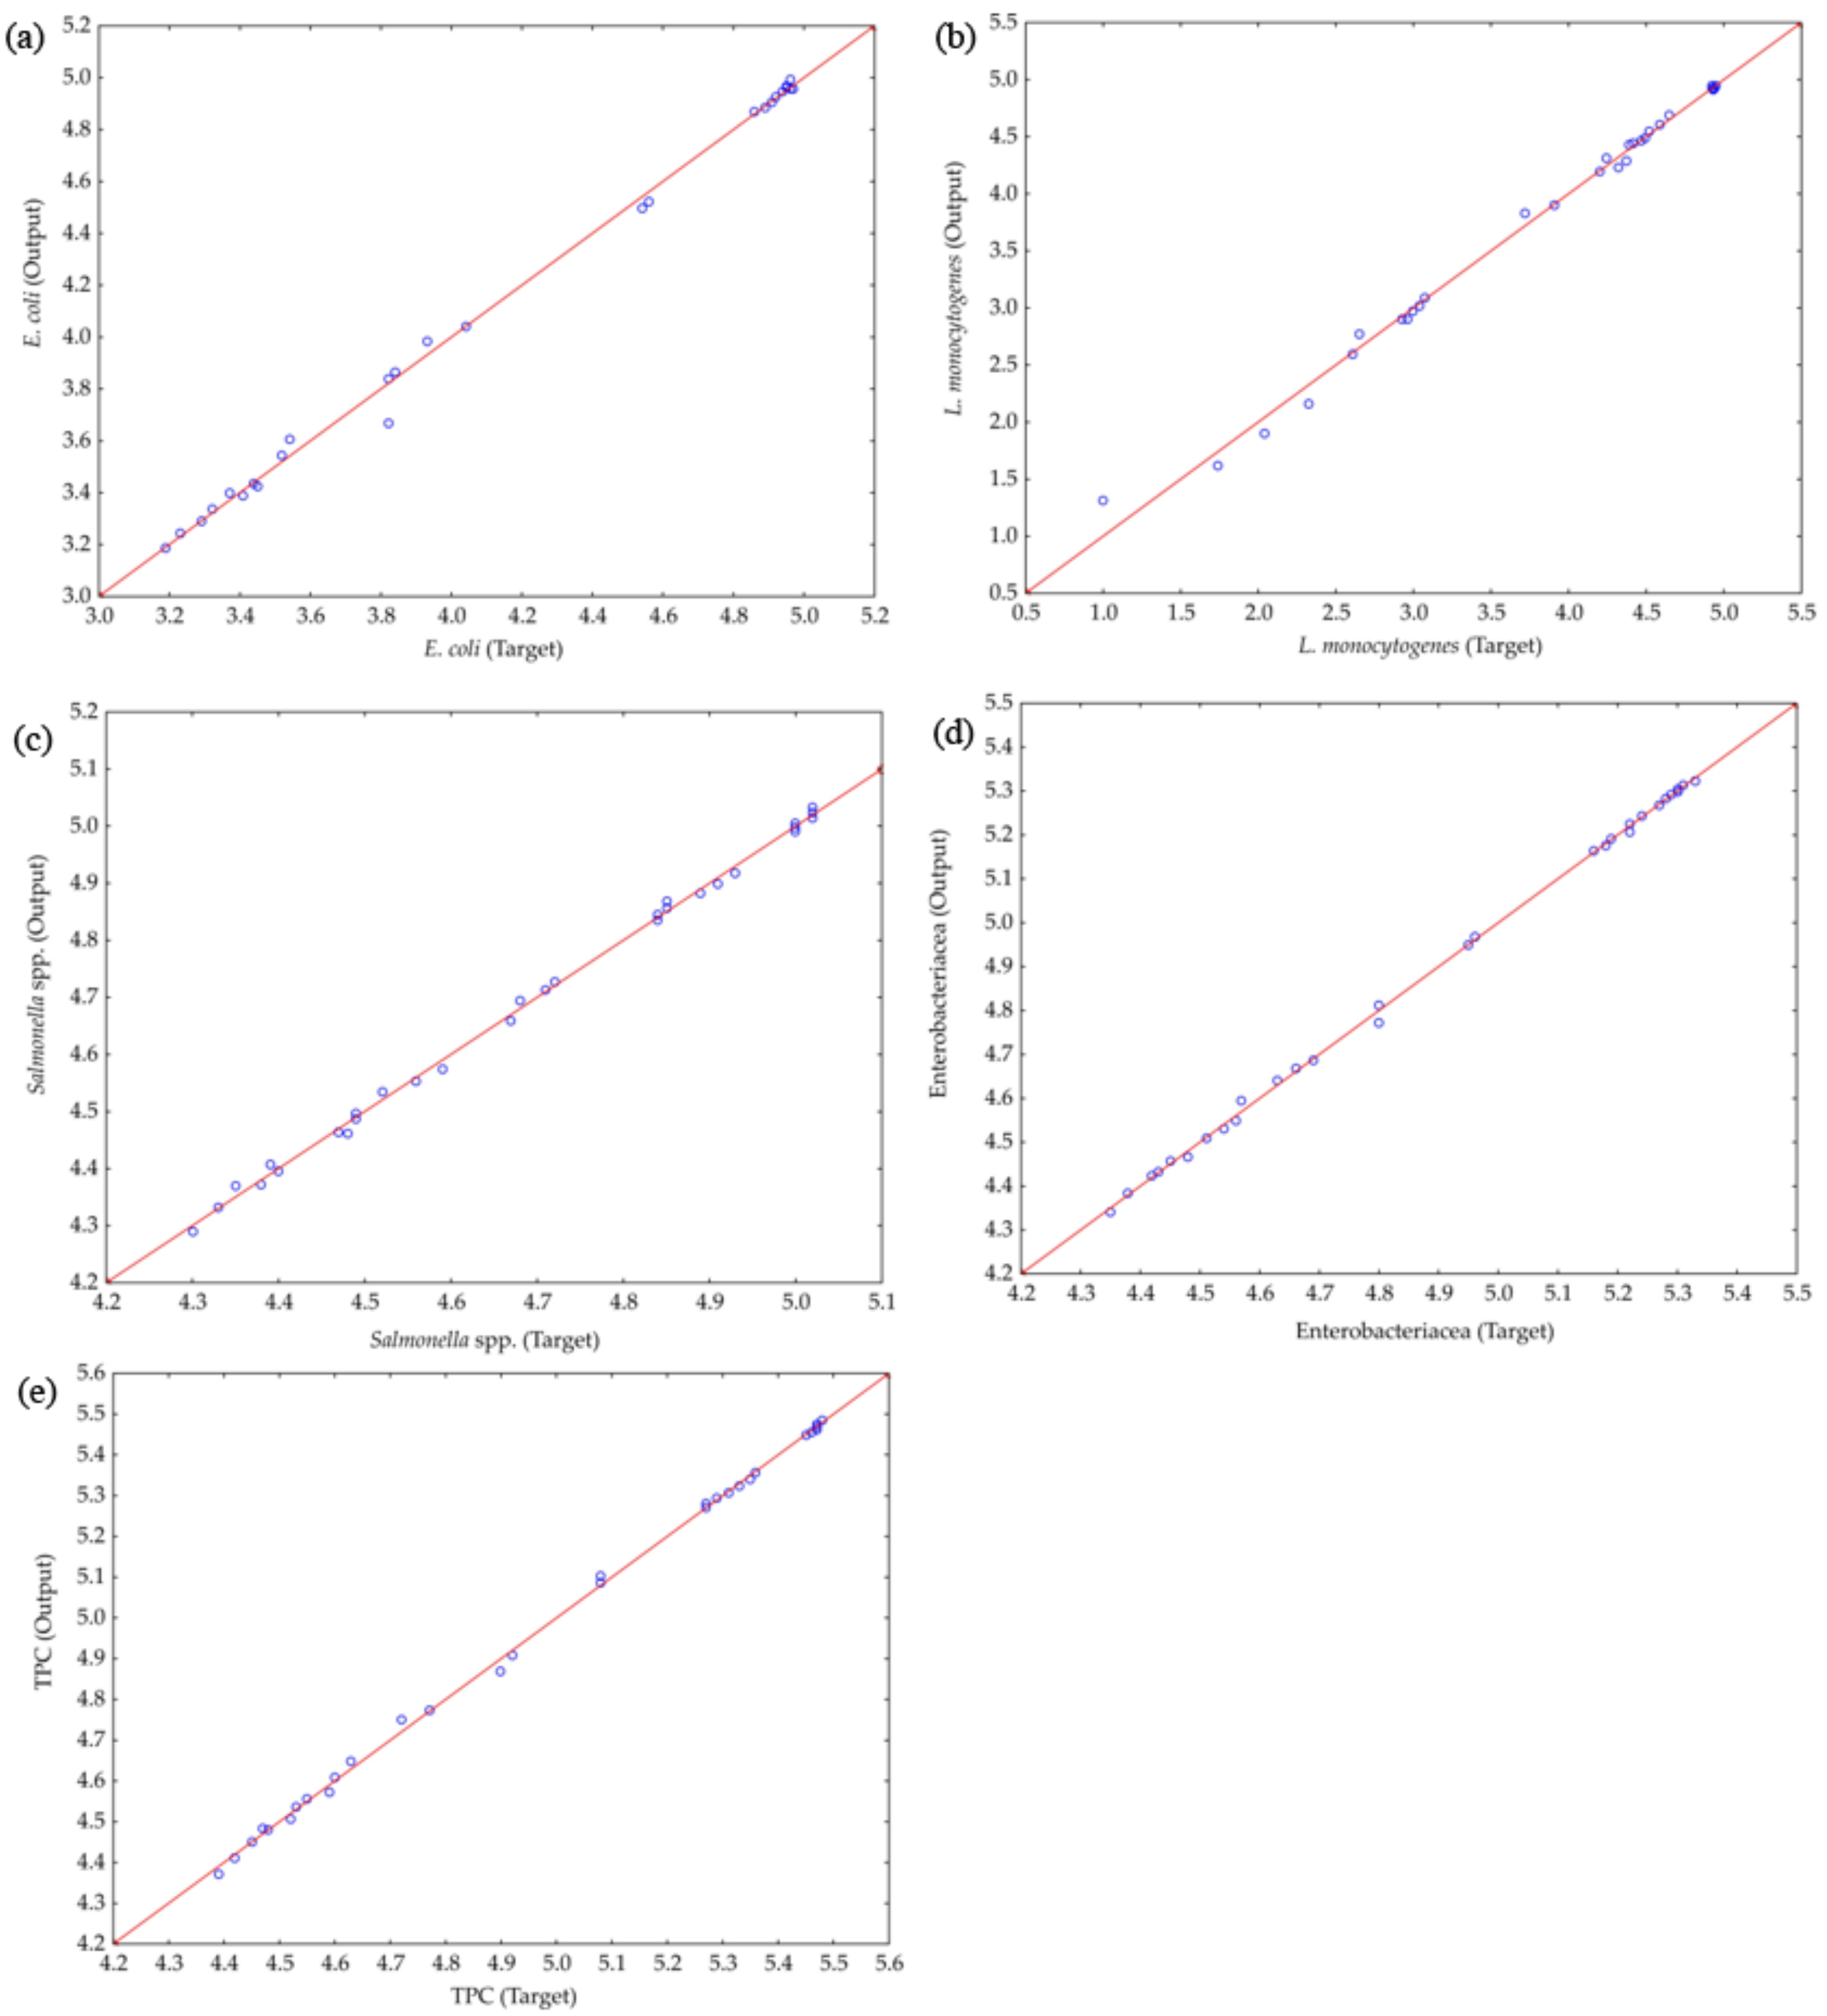
PCA was applied to detect the structure in the correlation between the independent variables’ parameters (time and osmolality) and the microorganisms’ (E. coli, L. monocytogenes, Salmonella spp., Enterobacteriaceae, and TPC) viability responses [46].
Figure 3 presents the results of PCA. The goal was to determine the trend visualization in the shown data and the discriminating efficiency of the used descriptors (time, osmolality, and the microorganisms’ viability). Therefore, a scatter plot was produced, presenting the first two principal components from the PCA of the data matrix, the first principal component at the x-axis, and the second at the y-axis.
A neat separation of 42 tested samples according to different exposure times and osmolality levels can be seen from the presented scatter plot. The position of the samples in the figure was influenced by the exposure time and osmolality level, where with the increasing exposure times and osmolality levels, the location of the samples moved from negative to positive first principal component (PC) values. The samples in the area with higher negative first principal component values were characterized by higher levels of all the tested microorganisms’ numbers and viability. Quality results showed that the first two PCs accounted for 99.21% of the total variance and could be considered more than sufficient for data representation.
The contribution of the responses to the first principal component was almost equally distributed among all the microorganisms’ viability responses. Only the contribution from the response for L. monocytogenes was slightly lower. However, in the case of the second principal component, the highest contribution was from the L. monocytogenes’ response.

3.4. ANN Modeling

The effect of different levels of osmolality and exposure times on the viability of the selected microorganisms was investigated by using the ANN model. The acquired optimal neural network model demonstrated a good generalization capability for the testing data and could accurately predict the output parameters for the observed input parameters. According to the ANN performance, the optimal number of neurons in the hidden layer for the number of E. coli, L. monocytogenes, Salmonella spp., Enterobacteriaceae, and TPC was 7 (network MLP 2-7-5), with a focus on achieving the highest value of the coefficient of determination, i.e., R2 (overall 0.999 for ANN throughout the training period), and the lower values of SOS (Table 4).
The ANN performance is defined as the goodness of fit among the experimentally measured, and the model-computed outputs (the sum of R2 from the measured and calculated number of E. coli, L. monocytogenes, Salmonella spp., Enterobacteriaceae, and TPC) throughout the training steps, the testing, and the validation steps are given in Table 5.
The obtained weights and biases obtained during ANN modeling are shown in Table 6 and Table 7, calculated according to Equation (2).
The ANN model was employed to predict the experimental variables, quite satisfactorily, for the observed parameters (as observed in Figure 4, where the experimentally estimated and ANN model–predicted values are displayed).
Figure 4 illustrates the experimentally counted and ANN model–predicted values for E. coli., L. monocytogenes, Salmonella spp., Enterobacteriaceae, and TPC, revealing that the ANN model satisfactorily predicted the experimental variables.

The Accuracy of the Models and the Residual Analysis

To numerically verify the coefficient of determination (R2) for the accuracy of the displayed model, the reduced chi-square (χ2), mean bias error (MBE), root mean square error (RMSE), and mean percentage error (MPE) were calculated, as shown Table 8. In addition, the model feature fit was examined, and the residual analysis results are presented in Table 9.
The developed ANN model had a minor lack of observed fit tests (Table 8 and Table 9), implying that the ANN model satisfactorily predicted all the responses of the microorganisms’ viability in molasses. In the past decade, ANN models have been successfully used to model osmotic pretreatment in sugar beet molasses of various food materials, including pork [47], fish [48], celery [11], cabbage [10], and appels [49]. To our knowledge, the present study is the first report on the ANN modeling of microorganisms’ viability in sugar beet molasses depending on the levels of osmolality and different exposure times.
Experimental validation for developed models in empiric systems of the osmotic dehydration of different food materials is not covered in the paper, so this research will be continued in another study, with an elaborated experimental plan of the models’ validation.

4. Conclusions

According to the presented results in this investigation, it can be concluded that the numbers of the selected microorganisms inoculated to the molasses of different osmolalities (from 5500 to 7000 mmol/kg) instantly significantly reduced. A prolonged exposure time led to a statistically significant viability decrease in all the tested microorganisms, where the rate of reduction decreased with time. Increasing molasses’ osmolality levels led to a statistically significant decrease in viability for all the tested microorganisms. From all the tested microorganisms, Salmonella spp. showed the highest viability, while L. monocytogenes showed the least resilience to osmotic stress, with a reduction down to numbers below the detection limit. The developed mathematical models were statistically significant, while the predicted and observed responses had a good correlation, allowing for a good prediction of the number of microorganisms based on the exposure time and osmolality levels. Furthermore, the correlation and principal component analysis results provided a visualization of the negative correlation effects between the independent variables (exposure time and osmolality level) and the viabilities of the selected microorganisms. The obtained results describe molasses’ excellent microbial load-reducing capability and provide the potential for applications in the production of safe foods.

Author Contributions

Conceptualization, V.F. and J. F.; methodology, M.N., V.K. and M.P.; software, B.L.; validation, V.F. and M.P.; formal analysis, M.N. and V.K., investigation, B.L. and M.P.; resources, V.F.; data curation, J.F. and B.L.; writing—original draft preparation, V.F.; writing—review and editing, J.F., B.L., M.N. and M.P.; visualization, B.L.; supervision, V.F.; project administration, V.F.; funding acquisition, V.F., B.L. and M.N. All authors have read and agreed to the published version of the manuscript.

Funding

This research was funded by the Ministry of Science Technological Development and Innovations of the Republic of Serbia, grant number 451-03-68/2022-14/200134.

Institutional Review Board Statement

Not applicable.

Informed Consent Statement

Not applicable.

Data Availability Statement

Not applicable.

Conflicts of Interest

The authors declare no conflict of interest.

References

  1. Arjeh, E.; Khodaei, S.M.; Barzegar, M.; Pirsa, S.; Karimi Sani, I.K.; Rahati, S.; Mohammadi, F. Phenolic compounds of sugar beet (Beta vulgaris L.): Separation method, chemical characterization, and biological properties. Food Sci. Nutr. 2022, 10, 4238–4246. [Google Scholar] [CrossRef] [PubMed]
  2. Kiselev, E.G.; Demidenko, A.V.; Zhila, N.O.; Shishatskaya, E.I.; Volova, T.G. Sugar Beet Molasses as a Potential C-Substrate for PHA Production by Cupriavidus necator. Bioengineering 2022, 9, 154. [Google Scholar] [CrossRef] [PubMed]
  3. Kaur, D.; Singh, M.; Zalpouri, R.; Singh, I. Osmotic dehydration of fruits using unconventional natural sweeteners and non-thermal-assisted technologies: A review. J. Food Process. Preserv. 2022, e16890. [Google Scholar] [CrossRef]
  4. Kudri, S.; Harshitha, T.; Hegde, P.; Tadkod, M.; Deasei, S.; Hemalatha, S. Effect of molasses, honey, and sugar on osmoticdehydration of muskmelon (Cucumis melo L.). Pharma Innov. 2022, 11, 162–166. Available online: https://www.thepharmajournal.com/archives/2022/vol11issue2/PartC/11-1-214-929.pdf (accessed on 12 January 2023).
  5. Bashir, N.; Sood, M.; Bandral, J. Food Preservation by Osmotic Dehydration—A Review. Chem. Sci. Rev. Lett. 2020, 9, 337–341. [Google Scholar] [CrossRef]
  6. Nićetin, M.; Pezo, L.; Lončar, B.; Filipović, V.; Šuput, D.; Zlatanović, S.; Dojčinović, B. Evaluation of water, sucrose and minerals effective diffusivities during osmotic treatment of pork in sugar beet molasses. Hem. Ind. 2015, 69, 241–251. [Google Scholar] [CrossRef] [Green Version]
  7. Filipović, I.; Ćurčić, B.; Filipović, V.; Nićetin, M.; Filipović, J.; Knežević, V. The effects of technological parameters on chicken meat osmotic dehydration process efficiency. J. Food Process. Preserv. 2016, 41, 13116. [Google Scholar] [CrossRef]
  8. Lončar, B.; Filipović, V.; Nićetin, M.; Knežević, V.; Pezo, L.; Filipčev, B.; Gubić, J. Influence of osmotic solutions on efficiency of osmotic dehydration treatment and sensorial properties of fish meat (Carassius gibelio). J. Hyg. Eng. Des. 2015, 13, 51–56. [Google Scholar]
  9. Filipović, V.; Filipović, J.; Lončar, B.; Knežević, V.; Nicetin, M.; Filipović, I. Synergetic dehydration method of osmotic treatment in molasses and successive lyophilization of peaches. J. Food Process. Preserv. 2022, 46, e16512. [Google Scholar] [CrossRef]
  10. Cvetković, B.; Pezo, L.; Šuput, D.; Lončar, B.; Šimurina, O.; Filipčev, B.; Jevtić-Mučibabić, R. Shelf-life study of osmodehydrated white cabbage packaged in modified atmosphere: Mathematical approach. J. Appl. Bot. Food Qual. 2021, 94, 47–52. [Google Scholar] [CrossRef]
  11. Nićetin, M.; Pezo, L.; Pergal, M.; Lončar, B.; Filipović, V.; Knežević, V.; Demir, H.; Filipović, J.; Manojlović, D. Celery root phenols content, antioxidant capacities and their correlations after osmotic dehydration in molasses. Foods 2022, 11, 1945. [Google Scholar] [CrossRef] [PubMed]
  12. Sjölin, M.; Thuvander, J.; Wallberg, O.; Lipnizki, F. Purification of Sucrose in Sugar Beet Molasses by Utilizing Ceramic Nanofiltration and Ultrafiltration Membranes. Membranes 2020, 10, 5. [Google Scholar] [CrossRef]
  13. Chen, M.; Zhao, Z.; Meng, H.; Yu, S. The antibiotic activity and mechanisms of sugar beet (Beta vulgaris) molasses polyphenols against selected food-borne pathogens. LWT–Food Sci. Technol. 2017, 82, 354–360. [Google Scholar] [CrossRef]
  14. Kulkarni, V.S.; Shaw, C. Miscellaneous Physical, Chemical, and Microbiological Test Methods. In Essential Chemistry for Formulators of Semisolid and Liquid Dosages; Kulkarni, V.S., Shaw, C., Eds.; Academic Press: Cambridge, MA, USA, 2016; pp. 193–221. [Google Scholar] [CrossRef]
  15. Šklubalova, Z.; Zatloukal, Z. Conversion Between Osmolality and Osmolarity of Infusion Solutions. Sci. Pharm. 2009, 77, 817–826. [Google Scholar] [CrossRef] [Green Version]
  16. Alhuthali, S.; Kotidis, P.; Kontoravdi, C. Osmolality Effects on CHO Cell Growth, Cell Volume, Antibody Productivity and Glycosylation. Int. J. Mol. Sci. 2021, 22, 3290. [Google Scholar] [CrossRef]
  17. Commission Regulation (EC). No 2073/2005 of 15 November 2005 on Microbiological Criteria for Foodstuffs. Available online: https://eur-lex.europa.eu/legal-content/EN/TXT/PDF/?uri=CELEX:02005R2073-20200308&from=EN (accessed on 12 January 2023).
  18. Ramatla, T.; Mileng, K.; Ndou, R.; Mphuti, N.; Syakalima, M.; Lekota, K.E.; Thekisoe, O.M.M. Molecular Detection of Integrons, Colistin and β-lactamase Resistant Genes in Salmonella enterica Serovars Enteritidis and Typhimurium Isolated from Chickens and Rats Inhabiting Poultry Farms. Microorganisms 2022, 10, 313. [Google Scholar] [CrossRef] [PubMed]
  19. Hargis, B.M.; Caldwell, D.J.; Byrd, J.A. Microbiological pathogens: Live poultry considerations. In Poultry Meat Processing, 2nd ed.; Sams, A., Ed.; CRC PressTaylor & Francis Group: Boca Raton, FL, USA, 2010; pp. 125–141. [Google Scholar]
  20. Park, J.Y.; Lim, M.-C.; Park, K.; Ok, G.; Chang, H.-J.; Lee, N.; Park, T.J.; Choi, S.-W. Detection of E. coli O157:H7 in Food Using Automated Immunomagnetic Separation Combined with Real-Time PCR. Processes 2020, 8, 908. [Google Scholar] [CrossRef]
  21. Guillén, S.; Nadal, L.; Álvarez, I.; Mañas, P.; Cebrián, G. Impact of the Resistance Responses to Stress Conditions Encountered in Food and Food Processing Environments on the Virulence and Growth Fitness of Non-Typhoidal Salmonellae. Foods 2021, 10, 617. [Google Scholar] [CrossRef]
  22. Dessaux, C.; Guerreiro, D.N.; Pucciarelli, M.G.; Conor, P.; O’Byrne, C.P.; García-del Portillo, G. Impact of osmotic stress on the phosphorylation and subcellular location of Listeria monocytogenes stressosome proteins. Sci Rep. 2020, 10, 20837. [Google Scholar] [CrossRef]
  23. Funes, E.; Allouche, Y.; Beltrán, G.; Jiménez, A. A review: Artificial neural networks as tool for control food industry process. J. Sens. Technol. 2015, 5, 28. [Google Scholar] [CrossRef] [Green Version]
  24. Nayak, J.; Vakula, K.; Dinesh, P.; Naik, B.; Pelusi, D. Intelligent food processing: Journey from artificial neural network to deep learning. Comput. Sci. Rev. 2020, 38, 100297. [Google Scholar] [CrossRef]
  25. Zhang, Y.; Guo, Q.; Wang, J. Big data analysis using neural networks. Adv. Eng. Sci. 2017, 49, 9–18. [Google Scholar]
  26. Guiné, R.P.F. The Use of Artificial Neural Networks (ANN) in Food Process Engineering. IJFE 2019, 5, 15–21. [Google Scholar] [CrossRef]
  27. Gorbachev, V.; Nikitina, M.; Velina, D.; Mutallibzoda, S.; Nosov, V.; Korneva, G.; Terekhova, A.; Artemova, E.; Khashir, B.; Sokolov, I.; et al. Artificial Neural Networks for Predicting Food Antiradical Potential. Appl. Sci. 2022, 12, 6290. [Google Scholar] [CrossRef]
  28. Ahmed, M.; AlQadhi, S.; Mallick, J.; Kahla, N.B.; Le, H.A.; Singh, C.K.; Hang, H.T. Artificial Neural Networks for Sustainable Development of the Construction Industry. Sustainability 2022, 14, 14738. [Google Scholar] [CrossRef]
  29. ISO 16649-2:2001; Microbiology of Food and Animal Feeding Stuffs—Horizontal Method for the Enumeration of Beta-Glucuronidase-Positive Escherichia. coli—Part 2: Colony-Count Technique at 44 Degrees C Using 5-bromo-4-chloro-3-indolyl beta-D-glucuronide. International Organization for Standardization: Geneva, Switzerland, 2001.
  30. ISO 6579-1:2017; Microbiology of the Food Chain-Horizontal Method for the Detection, Enumeration and Serotyping of Salmonella-Part 1: Horizontal Method for the Detection of Salmonella spp. International Organization for Standardization: Geneva, Switzerland, 2017.
  31. ISO 11290-2:2017; Microbiology of the food chain—Horizontal method for the detection and enumeration of Listeria monocytogenes and of Listeria spp.—Part 2: Enumeration Method. International Organization for Standardization: Geneva, Switzerland, 2017.
  32. ISO 21528-2:2017; Microbiology of the Food Chain—Horizontal Method for the DETECTION and enumeration of Enterobacteriaceae—Part 2: Colony-Count Technique. International Organization for Standardization: Geneva, Switzerland, 2017.
  33. ISO 4833-1:2014; Microbiology of the Food Chain—Horizontal Method for the Enumeration of Microorganisms Colony Count at 30 Degrees C by the Pour Plate Technique. International Organization for Standardization: Geneva, Switzerland, 2014.
  34. ISO 11133:2014; Microbiology of Food, Animal Feed and Water—Preparation, Production, Storage and Performance Testing of Culture Media. International Organization for Standardization: Geneva, Switzerland, 2014.
  35. Filipović, I.; Markov, S.; Filipović, V.; Filipović, J.; Vidaković, A.; Novković, N.; Rafajlovska, V. Modeling of factors influencing the effect of osmotic solution on reduction of selected microorganisms. J. Appl. Microbiol. 2018, 125, 843–852. [Google Scholar] [CrossRef] [PubMed]
  36. Rajković, D.; Marjanović Jeromela, A.; Pezo, L.; Lončar, B.; Zanetti, F.; Monti, A.; Kondić Špika, A. Yield and Quality Prediction of Winter Rapeseed—Artificial Neural Network and Random Forest Models. Agronomy 2021, 12, 58. [Google Scholar] [CrossRef]
  37. Vojnov, B.; Jaćimović, G.; Šeremešić, S.; Pezo, L.; Lončar, B.; Krstić, Đ.; Vujić, S.; Ćupina, B. The Effects of Winter Cover Crops on Maize Yield and Crop Performance in Semiarid Conditions—Artificial Neural Network Approach. Agronomy 2022, 12, 2670. [Google Scholar] [CrossRef]
  38. Voća, M.; Pezo, L.; Jukić, Ž.; Lončar, B.; Šuput, D.; Krička, T. Estimation of the storage properties of rapeseeds using an artificial neural network. Ind. Crops Prod. 2022, 187, 115358. [Google Scholar] [CrossRef]
  39. Pezo, L.; Lončar, B.; Šovljanski, O.; Tomić, A.; Travičić, V.; Pezo, M.; Aćimović, M. Agricultural Parameters and Essential Oil Content Composition Prediction of Aniseed. Based on Growing Year. Locality and Fertilization Type—An Artificial Neural Network Approach. Life 2022, 12, 1722. [Google Scholar] [CrossRef]
  40. Brandić, I.; Pezo, L.; Bilandžija, N.; Peter, A.; Šurić, J.; Voća, N. Artificial neural network as a tool for estimation of the higher heating value of miscanthus based on ultimate analysis. Mathematics 2022, 10, 3732. [Google Scholar] [CrossRef]
  41. Ruškić, N.; Mirović, V.; Marić, M.; Pezo, L.; Lončar, B.; Nićetin, M.; Ćurčić, Lj. Model for Determining Noise Level Depending on Traffic Volume at Intersections. Sustainability 2022, 14, 12443. [Google Scholar] [CrossRef]
  42. Zi, X.; Liu, Y.; Chen, T.; Li, M.; Zhou, H.; Tang, J. Effects of Sucrose, Glucose and Molasses on Fermentation Quality and Bacterial Community of Stylo Silage. Fermentation 2022, 8, 191. [Google Scholar] [CrossRef]
  43. Shafiqa-Atikah, M.K.; Nor-Khaizura, M.A.R.; Mahyudin, N.A.; Abas, F.; Nur-Syifa, J.; Ummul-Izzatul, Y. Evaluation of phenolic constituent, antioxidant and antibacterial activities of sugarcane molasses towards foodborne pathogens. Food Res. 2020, 4, 40–47. [Google Scholar]
  44. Wood, J.M. Bacterial responses to osmotic challenges. J. Gen. Physiol. 2015, 145, 381–388. [Google Scholar] [CrossRef]
  45. Chicco, D.; Warrens, M.J.; Jurman, G. The coefficient of determination R-squared is more informative than SMAPE, MAE, MAPE, MSE and RMSE in regression analysis evaluation. Peer J. Comput. Sci. 2021, 7, e623. [Google Scholar] [CrossRef] [PubMed]
  46. Filipović, V.; Lončar, B.; Filipović, J.; Nićetin, M.; Knežević, V.; Šeregelj, V.; Košutić, M.; Bodroža Solarov, M. Addition of Combinedly Dehydrated Peach to the Cookies—Technological Quality Testing and Optimization. Foods 2022, 11, 1258. [Google Scholar] [CrossRef]
  47. Pezo, L.L.; Ćurčić, B.L.; Filipović, V.S.; Nićetin, M.R.; Koprivica, G.B.; Mišljenović, N.M.; Lević, L.B. Artificial neural network model of pork meat cubes osmotic dehydratation. Hem. Ind. 2013, 67, 465–475. [Google Scholar] [CrossRef]
  48. Ćurčić, B.L.; Pezo, L.L.; Filipović, V.S.; Nićetin, M.R.; Knežević, V. Osmotic treatment of fish in two different solutions-artificial neural network model. J. Food Process. Preserv. 2015, 39, 671–680. [Google Scholar] [CrossRef]
  49. Lončar, B.; Pezo, L.; Filipović, V.; Nićetin, M.; Filipović, J.; Pezo, M.; Šuput, D.; Aćimović, M. Physico-Chemical, Textural and Sensory Evaluation of Spelt Muffins Supplemented with Apple Powder Enriched with Sugar Beet Molasses. Foods 2022, 11, 1750. [Google Scholar] [CrossRef]
Figure 1. Graphical presentation of mathematical modeled dependence of (a) E. coli; (b) L. monocytogenes, (c) Salmonella spp.; (d) Enterobacteriaceae, and (e) TPC numbers in molasses at different exposure time and of different osmolalities.
Applsci 13 01207 g001
Figure 2. Color correlation diagram between the parameters of the independent variables and the responses of microorganisms’ viability.
Applsci 13 01207 g002
Figure 3. PCA of independent variables and the responses of the microorganisms’ viability.
Applsci 13 01207 g003
Figure 4. Comparison between experimentally obtained and ANN model–predicted values of (a) E. coli, (b) L. monocytogenes, (c) Salmonella spp., (d) Enterobacteriaceae, and (e) TPC.
Applsci 13 01207 g004
Table 1. Average values and standard deviations of selected microorganisms’ numbers in molasses at different exposure times and of different osmolalities.
Run No.Time (h)Osmolality
(mmol/kg)
E. coli
log10(cfu/g)
L. monocytogenes
log10(cfu/g)
Salmonella spp.
log10(cfu/g)
Entero-
bacteriaceae
log10(cfu/g)
TPC log10(cfu/g)
1055004.98 ± 0.01 204.95 ± 0.01 205.06 ± 0.03 205.35 ± 0.01 235.50 ± 0.01 22
20.555004.96 ± 0.00 204.65 ± 0.01 194.93 ± 0.01 185.27 ± 0.02 19–215.36 ± 0.00 21
3155004.69 ± 0.01 174.52 ± 0.02 17,184.80 ± 0.01 15,165.06 ± 0.08 15,165.19 ± 0.02 17
4255004.11 ± 0.05 134.31 ± 0.01 13,144.71 ± 0.01 11–134.82 ± 0.00 134.93 ± 0.00 13
5355003.88 ± 0.01 9–113.16 ± 0.02 84.54 ± 0.01 6,74.64 ± 0.01 94.64 ± 0.01 9
6555003.45 ± 0.01 72.65 ± 0.07 54.49 ± 0.02 5,64.54 ± 0.01 5–74.55 ± 0.01 6,7
7057504.97 ± 0.01 204.95 ± 0.01 205.02 ± 0.03 19,205.33 ± 0.01 22,235.48 ± 0.01 22
80.557504.95 ± 0.00 19,204.59 ± 0.01 18,194.91 ± 0.01 185.24 ± 0.02 18–205.35 ± 0.01 20,21
9157504.64 ± 0.01 16,174.48 ± 0.02 16,174.79 ± 0.01 14,155.06 ± 0.03 165.16 ± 0.02 16,17
10257504.04 ± 0.06 124.24 ± 0.02 12,134.68 ± 0.01 10,114.80 ± 0.01 12,134.92 ± 0.00 13
11357503.82 ± 0.00 93.07 ± 0.10 114.52 ± 0.03 6,74.63 ± 0.01 8,94.63 ± 0.02 8,9
12557503.37 ± 0.04 4–62.61 ± 0.01 54.47 ± 0.01 4,54.51 ± 0.01 5,64.53 ± 0.02 6
13060004.97 ± 0.01 204.94 ± 0.00 205.02 ± 0.03 19,205.31 ± 0.01 21–235.47 ± 0.01 22
140.560004.94 ± 0.00 19,204.52 ± 0.01 17,184.89 ± 0.00 17,185.22 ± 0.02 17–195.33 ± 0.01 19–21
15160004.61 ± 0.01 15,164.45 ± 0.01 15–174.76 ± 0.01 13–155.00 ± 0.00 14,155.13 ± 0.02 116
16260003.93 ± 0.04 114.20 ± 0.04 11,124.67 ± 0.02 10,114.80 ± 0.00 12,134.90 ± 0.01 13
17360003.54 ± 0.01 83.04 ± 0.06 74.49 ± 0.02 5,64.57 ± 0.01 7,84.60 ± 0.02 8,9
18560003.35 ± 0.04 3–52.59 ± 0.02 54.44 ± 0.01 3,44.48 ± 0.01 4,54.50 ± 0.02 4–6
19062504.97 ± 0.01 204.93 ± 0.00 205.02 ± 0.03 19,205.30 ± 0.00 20–235.47 ± 0.01 22
200.562504.92 ± 0.00 18–204.49 ± 0.02 16–184.85 ± 0.00 16,175.22 ± 0.02 17–195.31 ± 0.01 18–20
21162504.59 ± 0.01 14–164.40 ± 0.02 14–164.74 ± 0.01 12–144.98 ± 0.00 145.11 ± 0.00 15,16
22262503.90 ± 0.02 10,114.10 ± 0.02 114.64 ± 0.01 9,104.75 ± 0.01 11,124.84 ± 0.01 12
23362503.52 ± 0.01 83.00 ± 0.06 6,74.48 ± 0.01 4–64.56 ± 0.02 6,74.59 ± 0.01 7,8
24562503.32 ± 0.03 3,42.32 ± 0.03 44.39 ± 0.01 2,34.45 ± 0.02 3,44.47 ± 0.01 2–4
25065004.96 ± 0.01 204.93 ± 0.00 205.00 ± 0.00 195.30 ± 0.00 20–235.47 ± 0.01 22
260.565004.91 ± 0.01 18–204.47 ± 0.01 15–174.85 ± 0.01 16,175.19 ± 0.02 17,185.29 ± 0.02 18,19
27165004.56 ± 0.03 14,154.37 ± 0.01 13–154.72 ± 0.01 11–134.96 ± 0.01 145.08 ± 0.00 15
28265003.87 ± 0.00 9–113.99 ± 0.02 104.61 ± 0.01 8,94.71 ± 0.01 10,114.80 ± 0.00 11,12
29365003.47 ± 0.01 7,82.98 ± 0.03 6,74.45 ± 0.02 4,54.52 ± 0.00 5–74.55 ± 0.01 6,7
30565003.29 ± 0.02 2,32.04 ± 0.06 34.38 ± 0.03 2,34.42 ± 0.01 2,34.45 ± 0.02 2,3
31067504.95 ± 0.00 19,204.92 ± 0.00 205.00 ± 0.00 195.29 ± 0.02 20–225.46 ± 0.02 22
320.567504.89 ± 0.01 18,194.42 ± 0.01 15–174.84 ± 0.01 16,175.18 ± 0.00 175.27 ± 0.02 18
33167504.54 ± 0.03 144.32 ± 0.03 13,144.71 ± 0.01 11–134.95 ± 0.01 145.08 ± 0.00 15
34267503.84 ± 0.03 9,103.91 ± 0.01 104.59 ± 0.01 7,84.69 ± 0.01 9,104.77 ± 0.01 11
35367503.44 ± 0.01 6,72.96 ± 0.05 6,74.40 ± 0.02 2,34.48 ± 0.01 4,54.52 ± 0.03 5,6
36567503.23 ± 0.04 1,21.74 ± 0.06 24.33 ± 0.04 1,24.38 ± 0.03 1,24.42 ± 0.01 1,2
37070004.95 ± 0.00 19,204.92 ± 0.01 205.00 ± 0.01 195.28 ± 0.00 20–225.45 ± 0.01 22
380.570004.86 ± 0.01 184.39 ± 0.01 14–164.84 ± 0.01 16,175.16 ± 0.02 175.27 ± 0.02 18
39170004.52 ± 0.03 144.20 ± 0.08 11,124.69 ± 0.01 11,124.94 ± 0.00 145.02 ± 0.03 14
40270003.82 ± 0.00 93.72 ± 0.03 94.56 ± 0.01 7,84.66 ± 0.01 9,104.72 ± 0.01 10
41370003.41 ± 0.01 5–72.93 ± 0.04 64.35 ± 0.01 1,24.43 ± 0.02 2–44.48 ± 0.02 3–5
42570003.19 ± 0.02 11.00 ± 0.00 14.30 ± 0.03 14.35 ± 0.01 14.39 ± 0.01 1
1–23 The superscripts’ different numbers in the same table column point to statistically significant differences between values, at level of significance of p < 0.05, based on a post hoc Tukey HSD test.
Table 2. ANOVA of TSM models of selected microorganisms in molasses.
Independent
Variables
Termdf +Sum of Squares
E. coliL. monocytogenesSalmonella
spp.
EnterobacteriaceaeTPC
Exposure TimeLinear115.88 *38.03 *1.75 *3.89 *5.10 *
Quadratic11.07 *0.010.19 *0.42 *0.53 *
OsmolalityLinear10.26 *1.67 *0.09 *0.11 *0.10 *
Quadratic10.010.060.000.000.00
Cross ProductTime × osmolality10.040.86 *0.01 *0.01 *0.01 *
ErrorResidual variance360.501.560.0240.030.03
Total sum of squares4117.7741.602.074.465.79
R20.970.960.990.990.99
+ Degrees of freedom, * statistically significant at level of p < 0.05.
Table 3. Second-order polynomial regression coefficients for five selected microorganisms in molasses.
E. coliL. monocytogenesSalmonella spp.EnterobacteriaceaeTPC
β08.103405 *−1.903085.372118 *5.768105 *5.468519 *
β1−0.450115 *0.52251 *−0.143098 *−0.276613 *−0.351648 *
β110.063844 *−0.005060.027177 *0.040088 *0.045015 *
β2−0.0008900.00219−0.000066−0.0000720.000079
β220.000000−0.000000.0000000.000000−0.000000
β12−0.000037−0.00017 *−0.000018 *−0.000017 *−0.000013 *
* Statistically significant at level of p < 0.05.
Table 4. Artificial neural network model summary (performance and errors).
Network
Name
Performance *Error **Training
Algorithm
Error
Function
Hidden
Activation
Output
Activation
Train.Test.Valid.Train.Test.Valid.
MLP 2-7-50.9990.9920.9990.0040.0070.004BFGS 222SOSLogisticIdentity
* The performance terms describe the coefficients of determination; ** The error terms show a lack of data for the ANN model.
Table 5. Coefficients of determination between experimentally measured and ANN outputs, during training, testing and validation steps.
CycleANN
E. coliL. monocytogenesSalmonella spp.EnterobacteriaceaeTPC
Train0.99980.99690.99900.99960.9995
Test0.98890.99710.98680.99360.9983
Validation0.99940.99920.99850.99940.9998
Table 6. The weight coefficients and biases: W1 and B1, respectively.
Parameter1234567
Osmolality−7.598−10.3764.913−6.278−8.156−5.626−9.446
Time1.0270.663−1.211−0.228−0.2190.019−0.431
Bias4.3546.193−2.841−1.8272.056−1.1233.374
Table 7. The weight coefficients and biases: W2 and B2, respectively.
Outputs1234567Bias
E. coli−1.9752.1840.238−3.2493.170−0.966−1.380−0.038
L. monocytogenes3.812−0.7213.187−2.314−0.7813.6720.430−2.516
Salmonella spp.−1.0502.0771.2930.4120.9561.309−0.427−0.883
Enterobacteriaceae−2.3122.6850.499−1.4113.048−0.823−1.563−0.213
TPC−0.8441.4560.758−0.3760.9570.904−0.157−0.513
Table 8. The goodness-of-fit tests for the developed ANN model.
Parameterχ2RMSEMBEMPESSEAARDr2
E. coli0.0010.037−2.5 × 10−50.5740.0410.9240.997
L. monocytogenes0.0070.0850.0002.5530.2171.8590.994
Salmonella spp.0.0000.010−3.7 × 10−50.1970.0030.5680.998
Enterobacteriaceae9.14 × 10−50.009−0.0000.1450.0030.3510.999
TPC0.0000.012−1.5 × 10−50.1960.0050.5410.999
Table 9. The residual analysis for the developed ANN model.
ParameterSkewKurtMeanStDevVar
E. coli2.2949.468−2.5 × 10−50.0370.001
L. monocytogenes−1.5095.6840.0000.0860.007
Salmonella spp.−0.278−0.906−3.7 × 10−50.0100.000
Enterobacteriaceae0.3562.2280.0000.0099.14 × 10−5
TPC0.0360.861−1.5 × 10−50.0120.000
Disclaimer/Publisher’s Note: The statements, opinions and data contained in all publications are solely those of the individual author(s) and contributor(s) and not of MDPI and/or the editor(s). MDPI and/or the editor(s) disclaim responsibility for any injury to people or property resulting from any ideas, methods, instructions or products referred to in the content.

