1. Introduction
Projections are widely used in several fields of application nowadays, such as the film industry, consumer electronics and the automotive industry. Nevertheless, all fields have specific challenges or advantages when looking at projection technologies. In the future, mobility concepts or technology automated vehicles will be dominant. No matter how long the transition phase from manually driven to automated vehicles will take, it is crucial to define and evaluate technologies for these types of mobility. Therefore, the automotive sector will play a significant role in future communications technologies such as projection- or display-based communication with other non-automated road users.
In the automotive sector, near-field projections or displays are used to show graphical or informative content around the vehicle to welcome the vehicle user with a message or design-driven pattern. Additionally, near-field projections or displays can inform the vehicle user with vehicle-based information, such as the battery status of an electric vehicle, or situation-based content, such as weather information at the trip’s destination. Both technologies are considered for communication for highly automated vehicles with other road users (RUs). However, projection-based communication has an advantage compared to display-based methods since a safety-relevant projection can be placed in the field of view of other RUs, e.g., a projected turn indicator to warn an upcoming cyclist of a turning vehicle.
In general, digital projectors are widely used in different sectors, such as consumer electronics, film and automotive industries. Every application field targets a positive experience for the user. However, environmental factors, which influence the projected content, vary depending on the application sector. For example, the various requirements in the automotive industry are diverse when projections are applied in the interior with curved projection surfaces [
1] or in the vehicle’s exterior while projecting onto the street’s surface [
2,
3,
4,
5,
6,
7,
8,
9,
10,
11,
12]. In addition, several properties depend on the application sector, which is essential for research: contrast, brightness, resolution and others. Finally, an important aspect is a necessary resolution on the projected surface to generate a sharp and high-quality image. This factor gains importance, especially when looking at pixel-based digital projection technologies, where an LCD, LCoS, DMD, or µLED is used as an imager [
13,
14,
15].
Besides decorative or design-related near-field projections next to the vehicle, another important application field is the safety-relevant projection content, which is crucial for other RUs, e.g., pedestrians and cyclists, especially in an urban environment. Current research focuses on the unambiguity, understanding and detection of the different projection content and where it will be illustrated [
4,
8,
16,
17,
18,
19]. However, the research still needs to examine the required resolution from the pedestrian’s perspective, which, on the one hand, is crucial in perceiving the illustrated projection content (symbol- or text-based message). On the other hand, the resolution is relevant for decisions on the projection technology and, therefore, the resulting use cases [
4,
8,
9,
12]. Namyslo et al. focused on the use case of cyclists, which are warned by a near-field projection (amber arrow sign) of a turning vehicle in a dusk scenario. Afterward, 19 participants provided a subjective opinion, where 86.8% of the subjects understood the intention of the turning vehicle better with the turn indicator projection compared to the situation with no illustrated projection [
4].
Additionally, several influencing factors affect the observer’s perception when interacting with a near-field projection. There are two main influence areas for the perception of near-field projections. First, the participant’s personal factors influence visual acuity [
20,
21,
22,
23]. The visual acuity influenced by age plays a significant role in general traffic. Sivak and Schoettle’s examination illustrates an increase in older drivers in eight countries worldwide: the United States, Sweden, Norway, Great Britain, Canada, Japan, South Korea and Germany [
23]. Second, Bleecker et al. provide a study on the impact of age and sex on simple visual reaction times. The results state that age significantly influences the reaction times for participants older than 70 years. Additionally, the comparison shows a sex difference [
20]. Henceforth, this indicates the importance of focusing on the older population for visual tasks in the context of future mobility concepts in urban environments.
Second are environmental factors such as adaptation luminance, the projection surface, or viewing distance [
12,
24,
25,
26,
27,
28]. In detail, the relationship between viewing distance, the resulting screen size and visual acuity has been under evaluation for several years for conventional displays or projection-based screens [
24,
26,
27,
28]. Previous research from the television or physiology sector indicates the preferred viewing distance and screen size when viewing an image or video [
26,
27,
28]. Additionally, the impact of the adaptation luminance is stated by Shlaer, as the findings illustrate that visual acuity varies with different adaptation luminance due to the interaction of cones and rods on the retina. Furthermore, the tested target shape influences visual acuity and the resulting detailed perception [
28].
Moreover, Lund discovered in his experiments in television research the correlation between viewing distance and the resulting screen size. Like Jesty, Lund had his participants set their optimal viewing distance for themselves in the various experiments [
26,
27]. Both researchers, Jetsy and Lund [
26,
27], varied the image size and/or the resolution. A point of criticism is that Lund mixes certain influencing factors without considering their effect, for example, using different screen technologies (conventional display or projection screen) or changing the ambient lighting within the experiments [
27].
Consequently, when mixing the methods and drawing a correlated conclusion, Lund’s results must be considered with caution, and are saturated at increasing viewing distances due to decreasing visual acuity [
27]. However, this outcome corresponds to the results of Jesty [
26]. Furthermore, Lund lists possible influencing factors crucial for the experimental setting, such as screen resolution, ambient lighting, video content and the participants’ mindset [
27]. Further, Viršek mentions that the various projection surfaces, like the different granularity of the asphalt, limit the image quality which an observer perceives when looking at a near-field projection [
12].
It is necessary to examine the requirements for near-field projections in the automotive sector, especially for safety-relevant projections with potential differences for either text- or symbol-based projection content and the influence on the observer’s perception of various lighting conditions. In this work, two subject studies present an experimental approach to defining an effective resolution on the street’s surface in the near-field around the vehicle under two different lighting levels. Hence, the forced-choice method is used in the subject studies to collect the necessary data for subjective opinion regarding the resolution requirements for a high-quality projection. Consequently, logistic regression is applied to the data to evaluate thresholds for the perceived resolution and, finally, to establish resolution requirements for near-field projections.
To the best knowledge of the author, the reported experiments are the first to systematically study repeatedly the impact on human perception by road-/near-field projections for either safety- or design-driven purposes. Additionally, this research determines the importance and relevance of the near-field projections projected around the vehicle in no matter which direction, since the field studies generally asked for any perception corresponding to the near-field projections. Therefore, this work is organized as follows: Chapter 2 delivers an overview of the field study, its procedure, methods and analysis relating to the used materials and methods of this field study. Further, Chapter 3 reports the results of the field study in detail, including the statistical analysis. Chapter 4 discusses and summarizes the paper in an encompassing way with its main findings. Finally, a brief conclusion with an additional outlook for further research is given in the last chapter.
2. Materials and Methods
This field study will apply the methods of constant stimuli, a standard measure in psychology, to define physical measurements. Therefore, first, the participants collectively will be described in detail. Further, the field study and its procedure are illustrated, as in
Figure 1A and the following text, with necessary theoretical background information. Finally, the analysis, which includes logistic regression, is carried out to evaluate the perceived resolution of the participants in pixels per degree (px/°) and the theoretical background for this.
2.1. Participants
The participant collective consists of two independent studies: 70 subjects (19 female, 51 male) of internal workers from different departments of BMW Group in Munich, Germany, between 21 and 59 years (M = 34.86, SD = 10.75) participated in the field test. 56% of the participants used a visual correction aid, while 77% of the subjects specified that they were short-sighted. In the second field test, 25 participants (9 female, 16 male), also internal workers of the BMW Group in Munich, Germany, ranging from 20 to 58 years (M = 35.68, SD = 11.82), participated. Additionally, 48% of the subjects used a visual correction aid to correct their shortsightedness, because 92% were short-sighted.
2.2. Subject Study Setup
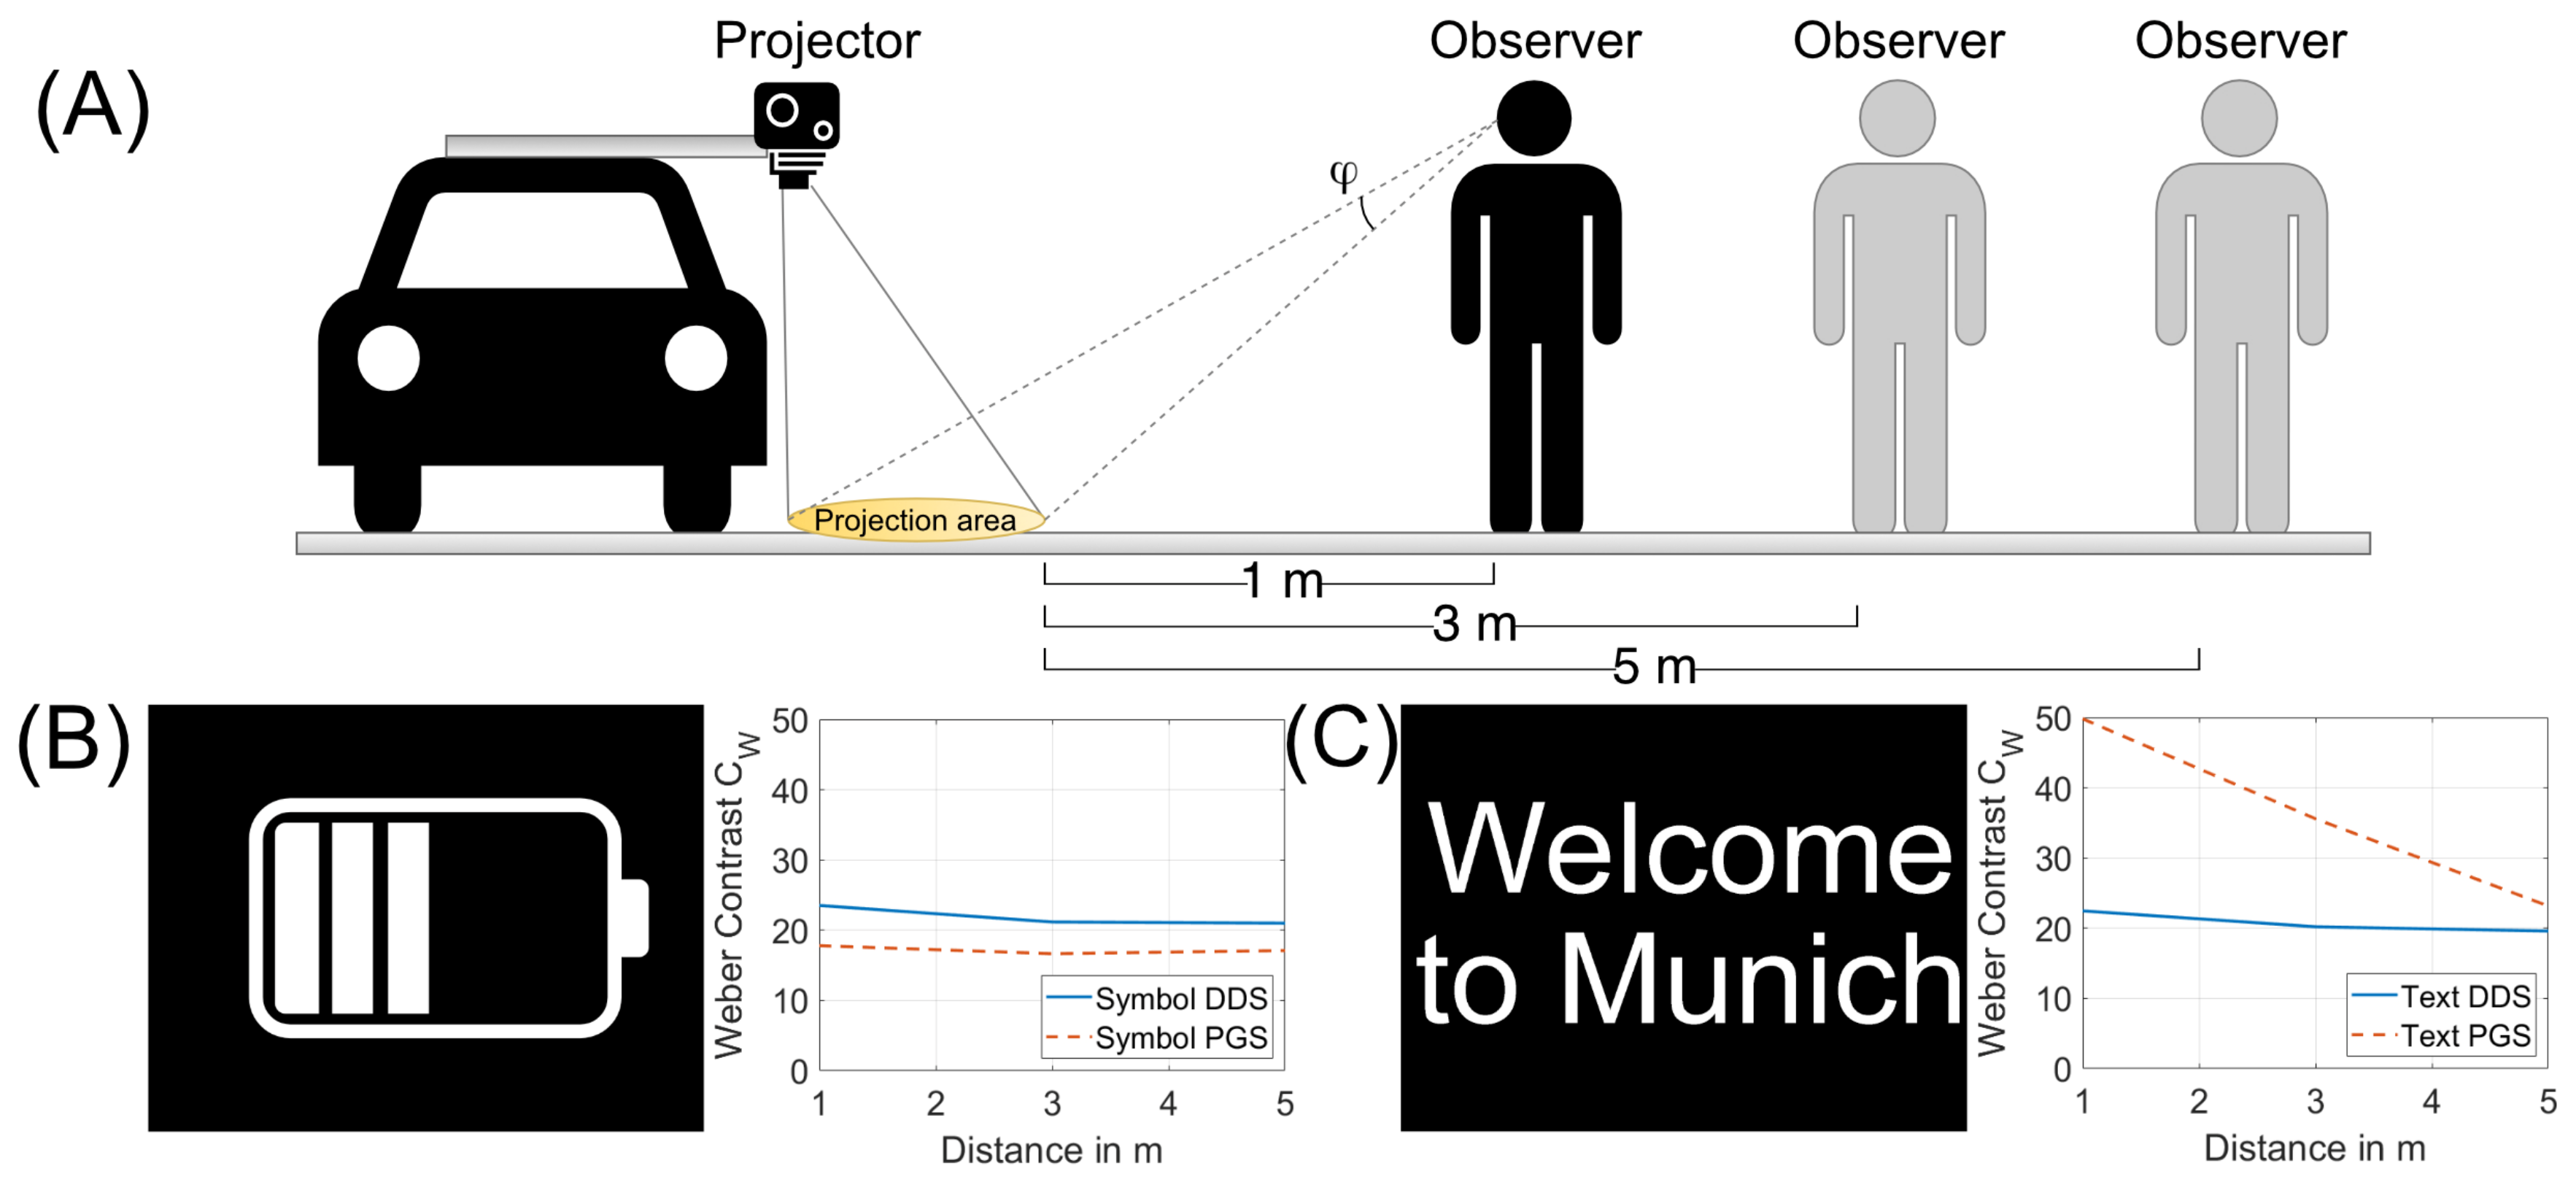
To establish an equal subject study environment for all participants, the setup in the light channel is characterized in detail. First, two projection contents were selected for the experimental design: symbol- and text-based content (
Figure 1B,C). The graphic illustrates a loading battery symbol (68.5 cm wide and 40.5 cm high) (
Figure 1B) and the text ‘Welcome to Munich’ used the front style Helvetica (93 cm wide and 37.5 cm high) (
Figure 1C). Good legibility is the main requirement for a typeface. For this purpose, DIN 1450, for example, specifies the number of criteria [
29]. These include typeface, stroke width and thickness and character spacing. However, the symbol-based content or the smallest letter of the text-based projection is designed to fulfill DIN 3864 [
30] and guarantee the text’s legibility even at a viewing distance of 5 m. Therefore, this results in the used projection sizes of the text or graphics in these tests.
Second, the adaptation luminance in the testing room was characterized at 1 m, 3 m and 5 m away from the projection area to guarantee a homogenous ambient lighting condition (
Figure 1A). Therefore, in the following work, the scenario with 191–263 lx ambient illuminance is called dusk-/dawn-scenario (DDS), which is the scenario of interest in the first study. This represents the daily usage of a vehicle when the user is leaving for work or coming back home. Of interest in the second study was a scenario with 20–25 lx ambient lighting, which matches the regulation for parking lots with high traffic volume [
31], called the parking garage scenario (PGS).
Figure 1.
Schematic illustration of the experimental setup and used projection content in both studies. (
A) The experimental setup for both studies, where a 3LCD laser projector [
32] is mounted on a vehicle, indicates the three different viewing distances of 1 m, 3 m, or 5 m. Additionally, the observer’s viewing angle to the projection area for the 1 m viewing distance is illustrated. (
B) Display of the symbol-based projection content and a graph with the contrast measurements in PGS and DDS related to the viewing distance. (
C) Picture of the text-based content and the graph for the corresponding contrast in PGS and DDS related to the viewing distance.
Further, it is crucial to ensure a constant Weber contrast, so that the participants will not be influenced by the perceived Weber contrast
, which is shown by Equation (1):
where
states the luminance of the projection and
is the background luminance of the street’s surface [
33]. Consequently, the contrast in the dusk/dawn scenario
varied slightly no matter what projection content (
Figure 1B,C). In the parking garage scenario, the contrast for the battery symbol was constant
(
Figure 1B) though the text message showed a decreasing trend for increasing viewing distance
, which is displayed in the graph in
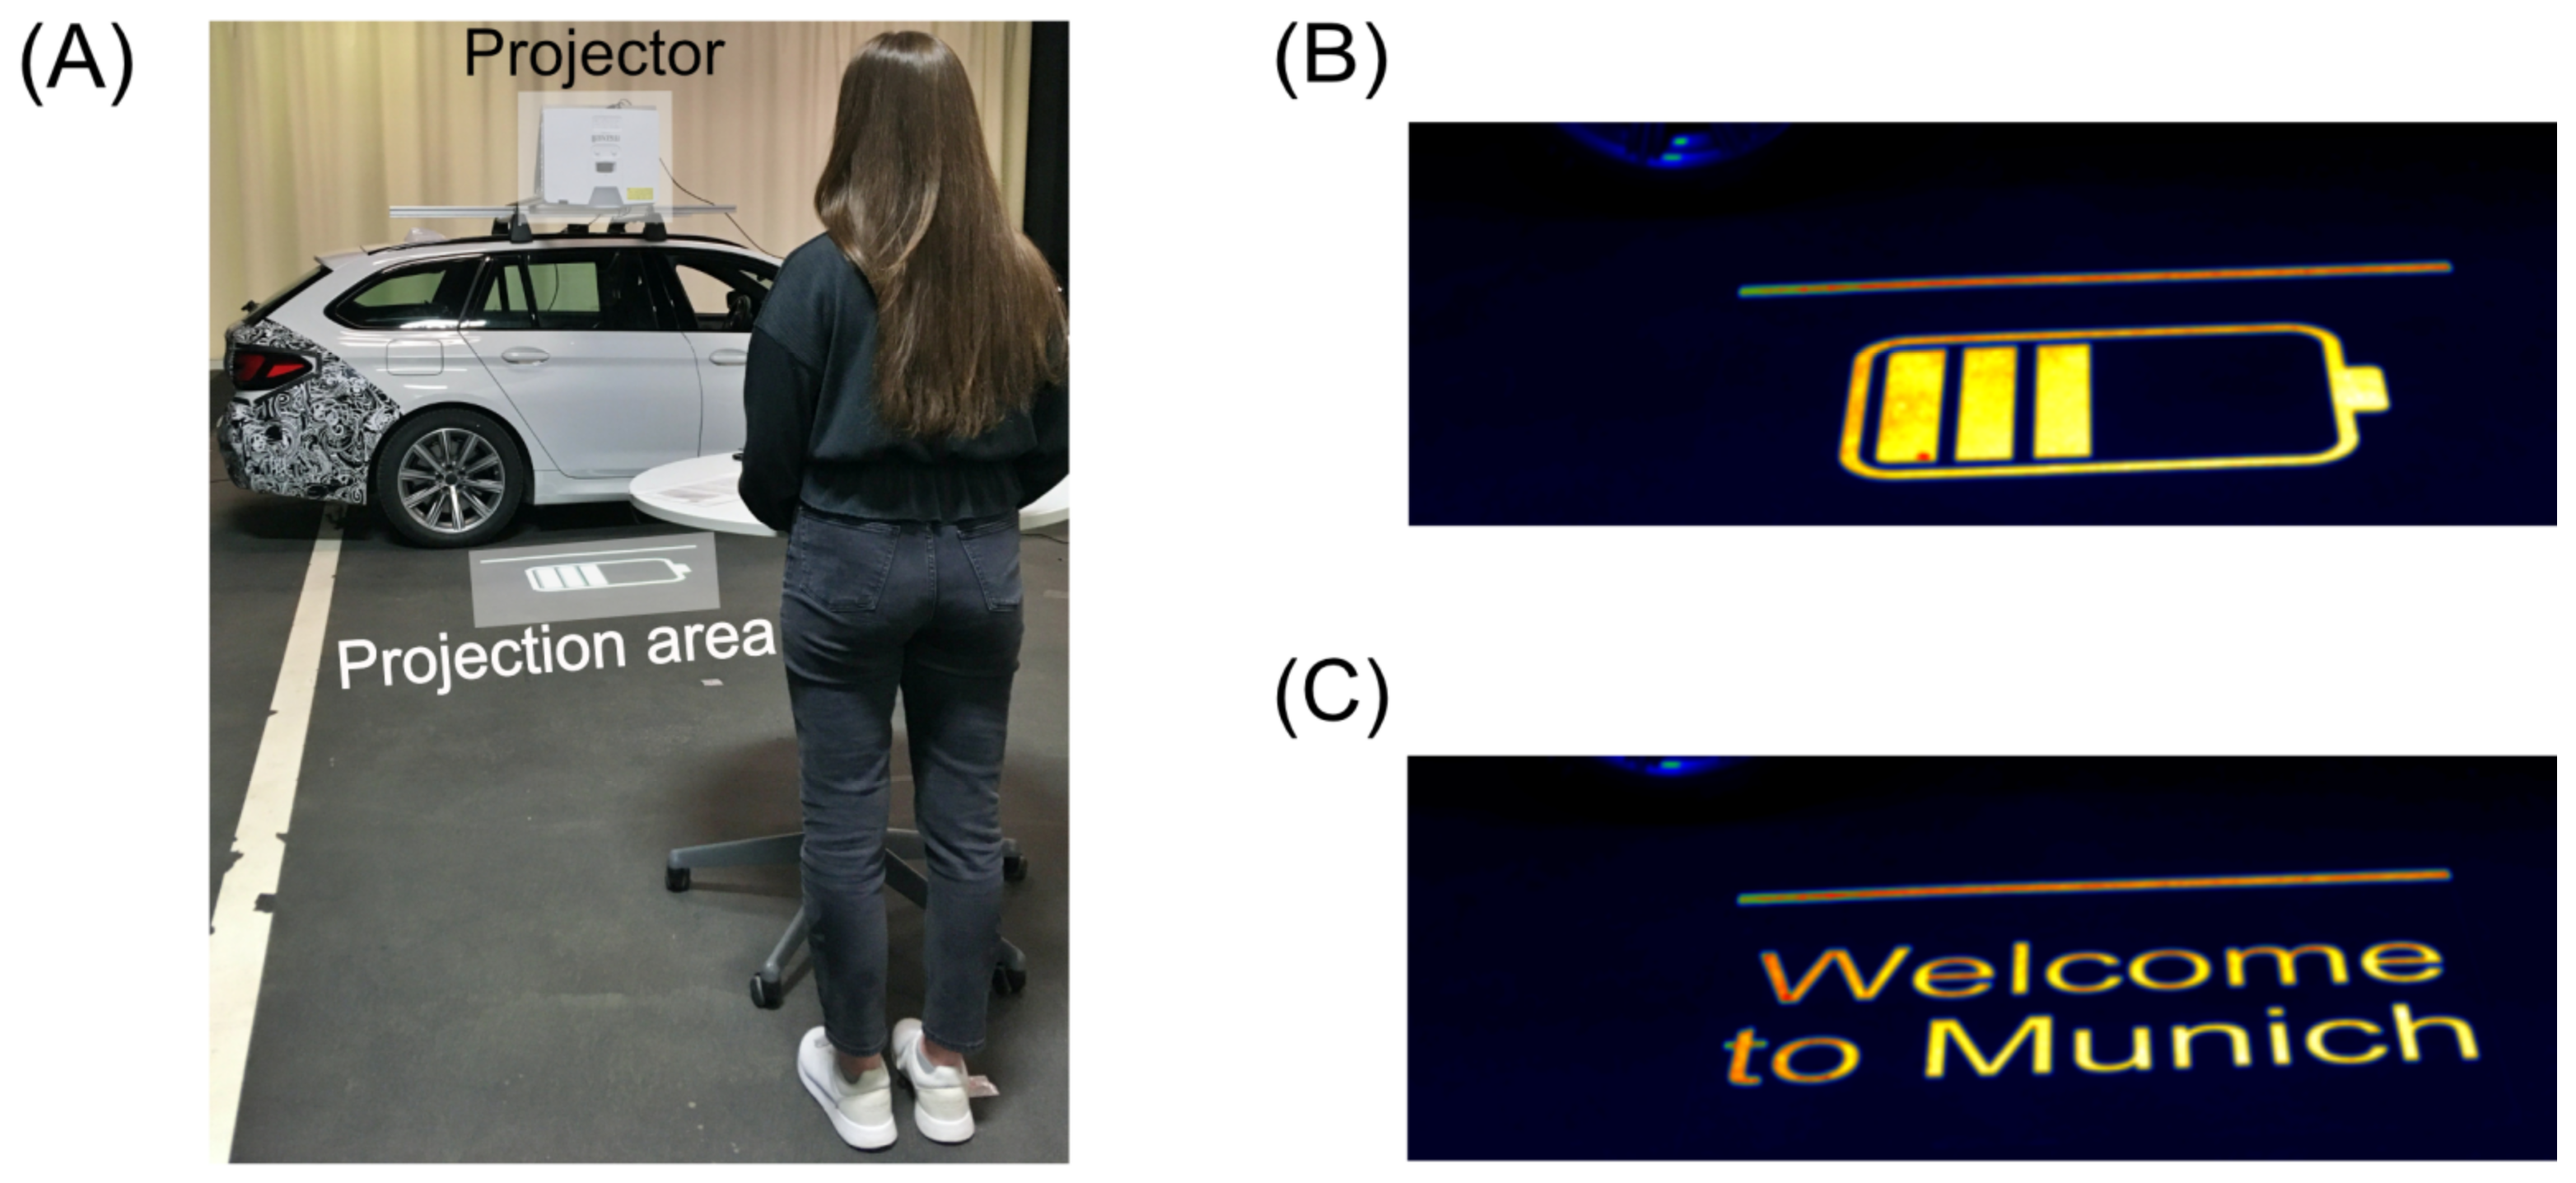
Figure 1C. All contrasts were measured from a first-person perspective with a luminance camera at the three viewing distances and with a measuring height of 1.72 m, which represents an average German person [
32], resulting in different viewing angles on the projection area in the analyzed measurements (
Figure 1A–C and
Figure 2B,C). The viewing angles range between 59.83° at 1 m (see
Figure 1A) to 18.98° at 5 m viewing distance, assuming an average German person [
34]. Therefore, the contrasts are valid for the used projection surface, which is smooth and fine-grained asphalt with a luminance coefficient of 0.03 in the light channel in PGS and DDS (
Figure 2A). Additionally, a classification of the angle-dependent reflection behavior S according to the CIE standard was made, which corresponds to a diffuse scattering surface (S < 0.4) for the PGS (S = 0.09) and DDS (S = 0.09) scenario [
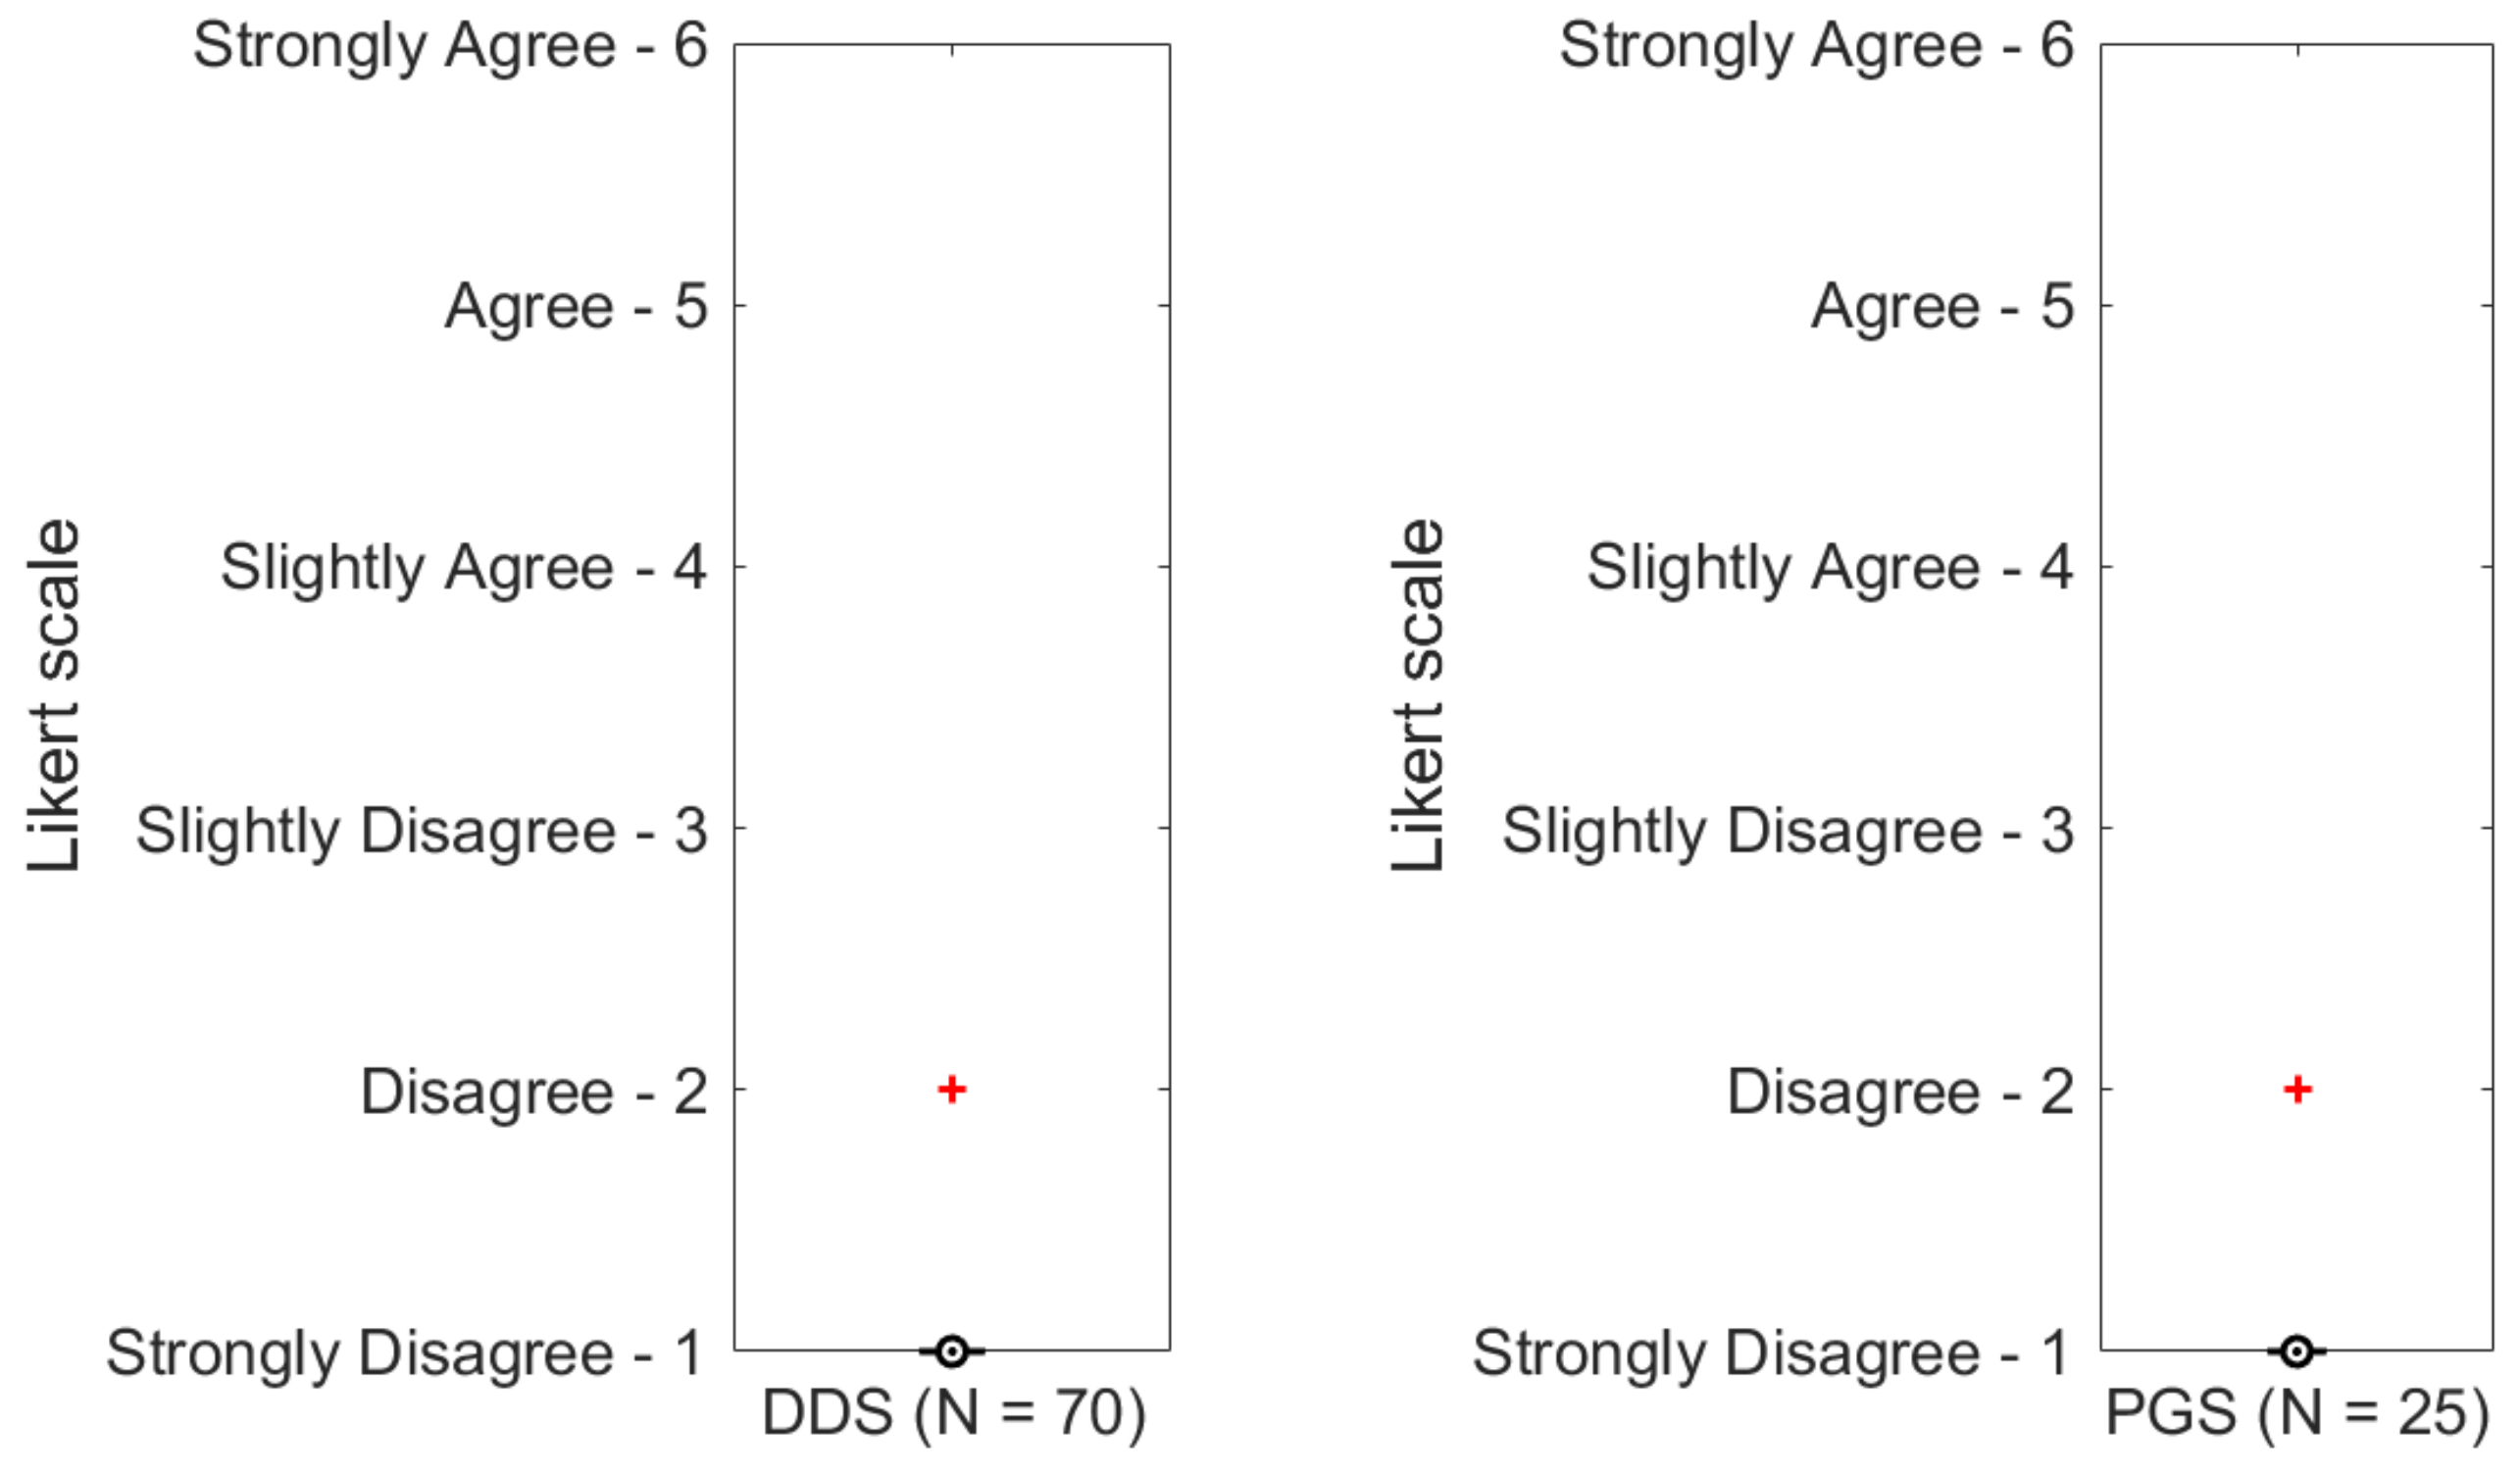
35]. A post-study questionnaire asked the participants if any glare was perceived during the testing procedure to ensure that the study environment was appropriately defined for all subjects. The results of this question for the DDS and PGS are displayed in
Figure A1. These assure that the subjects do not perceive glare, as none of the subjects stated so in the questionnaire responses.
Furthermore, to ensure that the projection surface is suitable for evaluating projection qualities, a pre-study took place to evaluate the smallest resolvable detail on the street’s surface. The subjects’ task was to confirm whether they could see one or two lines where eight different gap widths were repeated randomly three times, corresponding to the constant stimuli method. This procedure was the same for the PGS and DDS scenarios at a viewing distance of 1 m, which is the most critical viewing distance from which to evaluate the smallest resolvable detail. The smallest resolvable detail relates to a standard visual acuity test task, such as a Landolt ring task [
36]. In the subject study, the line pairs rotated 45, 90, or 180 degrees, so subjects would have a variation and thus no learning effect during the study. Eight subjects between 27 and 60 years participated in the pre-study. The resolution of the gap between the two lines was 85.73 px/° for PGS and 52.93 px/° for DDS.
Consequently, every participant had about 10 min to adapt to the ambient luminance in every scenario, which guarantees the activation of the rods in their sensitivity [
36], so the illustrated projections do not discomfort the subject. The participants used a modified keyboard, where just the keys N and Y were accessible, since the other keys were removed. Finally, after the introduction, the participants had to log in their subjective answers by pushing the key Y when perceiving a high-quality resolution and pressing the key N if the quality did not meet individual quality requirements. The keyboard is connected to a computer via a USB cord to guarantee no potential latencies. The visual stimulus presentation and data handling is implemented in Matlab R2018b with the graphical toolbox Cogent 2000 version 1.33 [
37]. All instructions, experiments and the questionnaire used the German language.
The study design was mixed between-within-design with ambient lighting being the between-subjects-factor and the projection content and viewing distance being the within-subject-factors.
2.3. Testing Procedure
The two collectives consisted of different participants. The second study was conducted three months after the first, but the testing procedure was identical. All participants participated within two weeks in a single 30-min-session.
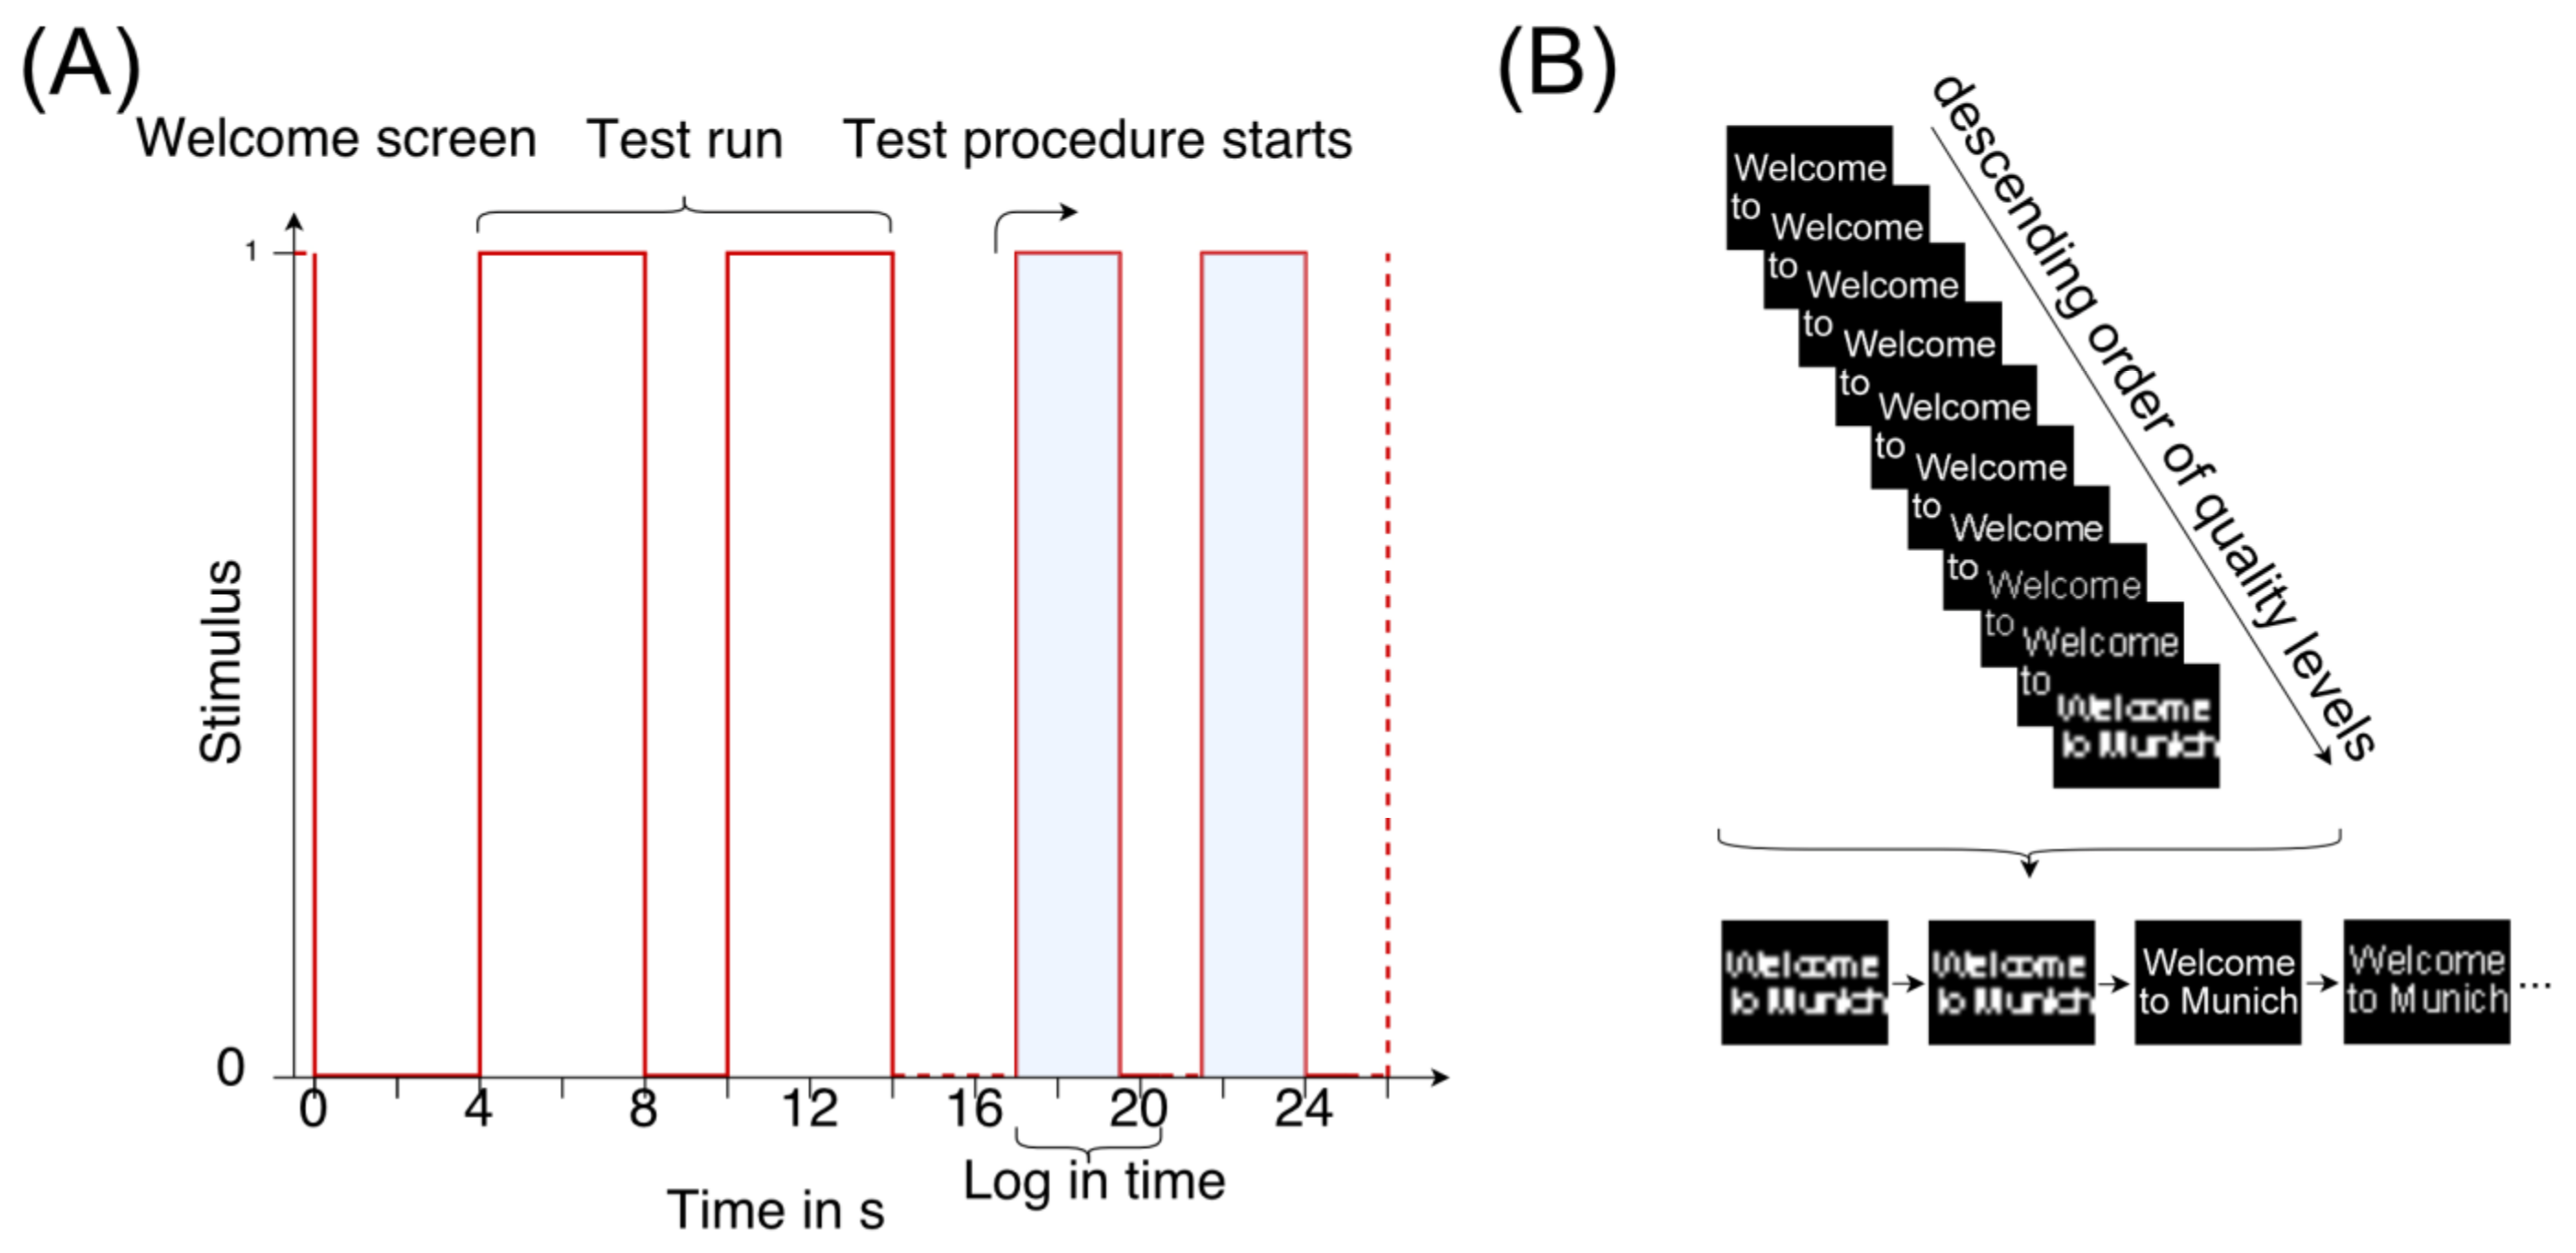
The testing procedure for both studies was identical: first, the participants read an instruction sheet while the experimenter adapted the ambient luminance of the respective scenario. Before the test started, examples of the high and low resolution of every projection content were shown to the participants, which were not included in the testing set. The examples ensured that every participant had a similar prior perceptual threshold due to different individual experiences of near-field-projections. Second, the participants got used to the test procedure with a test run (
Figure 3A). To prevent learning effects, ten different pre-set image qualities that occurred three times in the total set were presented in a random order (
Figure 3B), resulting in a total of 30 images per sequence, and participants had 2.5 s to log in their decision whether the displayed projection had a good or bad resolution in reference to the displayed examples in prior testing. The presentation time of every projection was 2.5 s (
Figure 3A). The experiment followed a forced choice procedure of constant stimuli [
33,
38,
39,
40]: while focusing on the projection area, the participants had to either press ‘Y’, if the displayed quality of the projection had a high quality, or ‘N’ if not. There was a random delay from 0.5 to 1 s between sequences to prevent learning effects. After the delay, visual feedback was displayed if the answer was logged in successfully. The participants rated the projection’s quality subsequently from one of the three testing distances, e.g., 1, 3, or 5 m. The order of distances was randomized between participants. The same procedure was repeated for both projection contents (text- or symbol-based), resulting in a total of 180 potential ratings of perceived projection quality per participant (10 qualities × 3 repetitions × 3 viewing distances × 2 projection contents) (
Figure 3B). Finally, a questionnaire was answered with general personal information and questions about near-field projections. However, the questionnaire analyses are not part of this paper [
10].
2.4. Data Analysis
The data analysis applied a logistic regression by using the function (Equation (2)) which was introduced by Harvey [
41] and Linschoten et al. [
39]:
This logistic regression function was influenced by three parameters:
α specifies the stimulus (e.g., the image quality) at the 50% probability level within the range of possible solutions (quality level), the steepness of the function was described by
β and the likelihood of correct answers by chance, such as mistyping, was considered by
γ. In both studies, the assumption of
was applied to the analysis since the study design and the type of stimuli ensured no random or false answers regarding the subjectively perceived image quality. Therefore, a simplified logistic regression Equation (3) resulted in:
This simplified logistic regression function was fitted to the collected data of the presented stimuli and the corresponding responses from the forced choice method. The presented stimuli represent the different resolution levels projected on the street’s surface and correspond to the x-data in the formula above. The P(x)-values are the related responses of the subjects to the perceived resolution levels. The values of α and β were determined by using the Matlab curve fitting toolbox independently for every specific scenario in the applied testing condition. The input for finding the values of α and β included the x and P(x) raw data to fit the logistic regression.
Statistical analysis used a chi-square-test, which were calculated to evaluate a 5% significance level by comparison with the critical values of the chi-square distribution [
42]. The chi-square-test was used to indicate and evaluate the dependencies for the perception regarding the influence of the ambient lighting, viewing distance influence and influence of displayed content.
4. Discussion
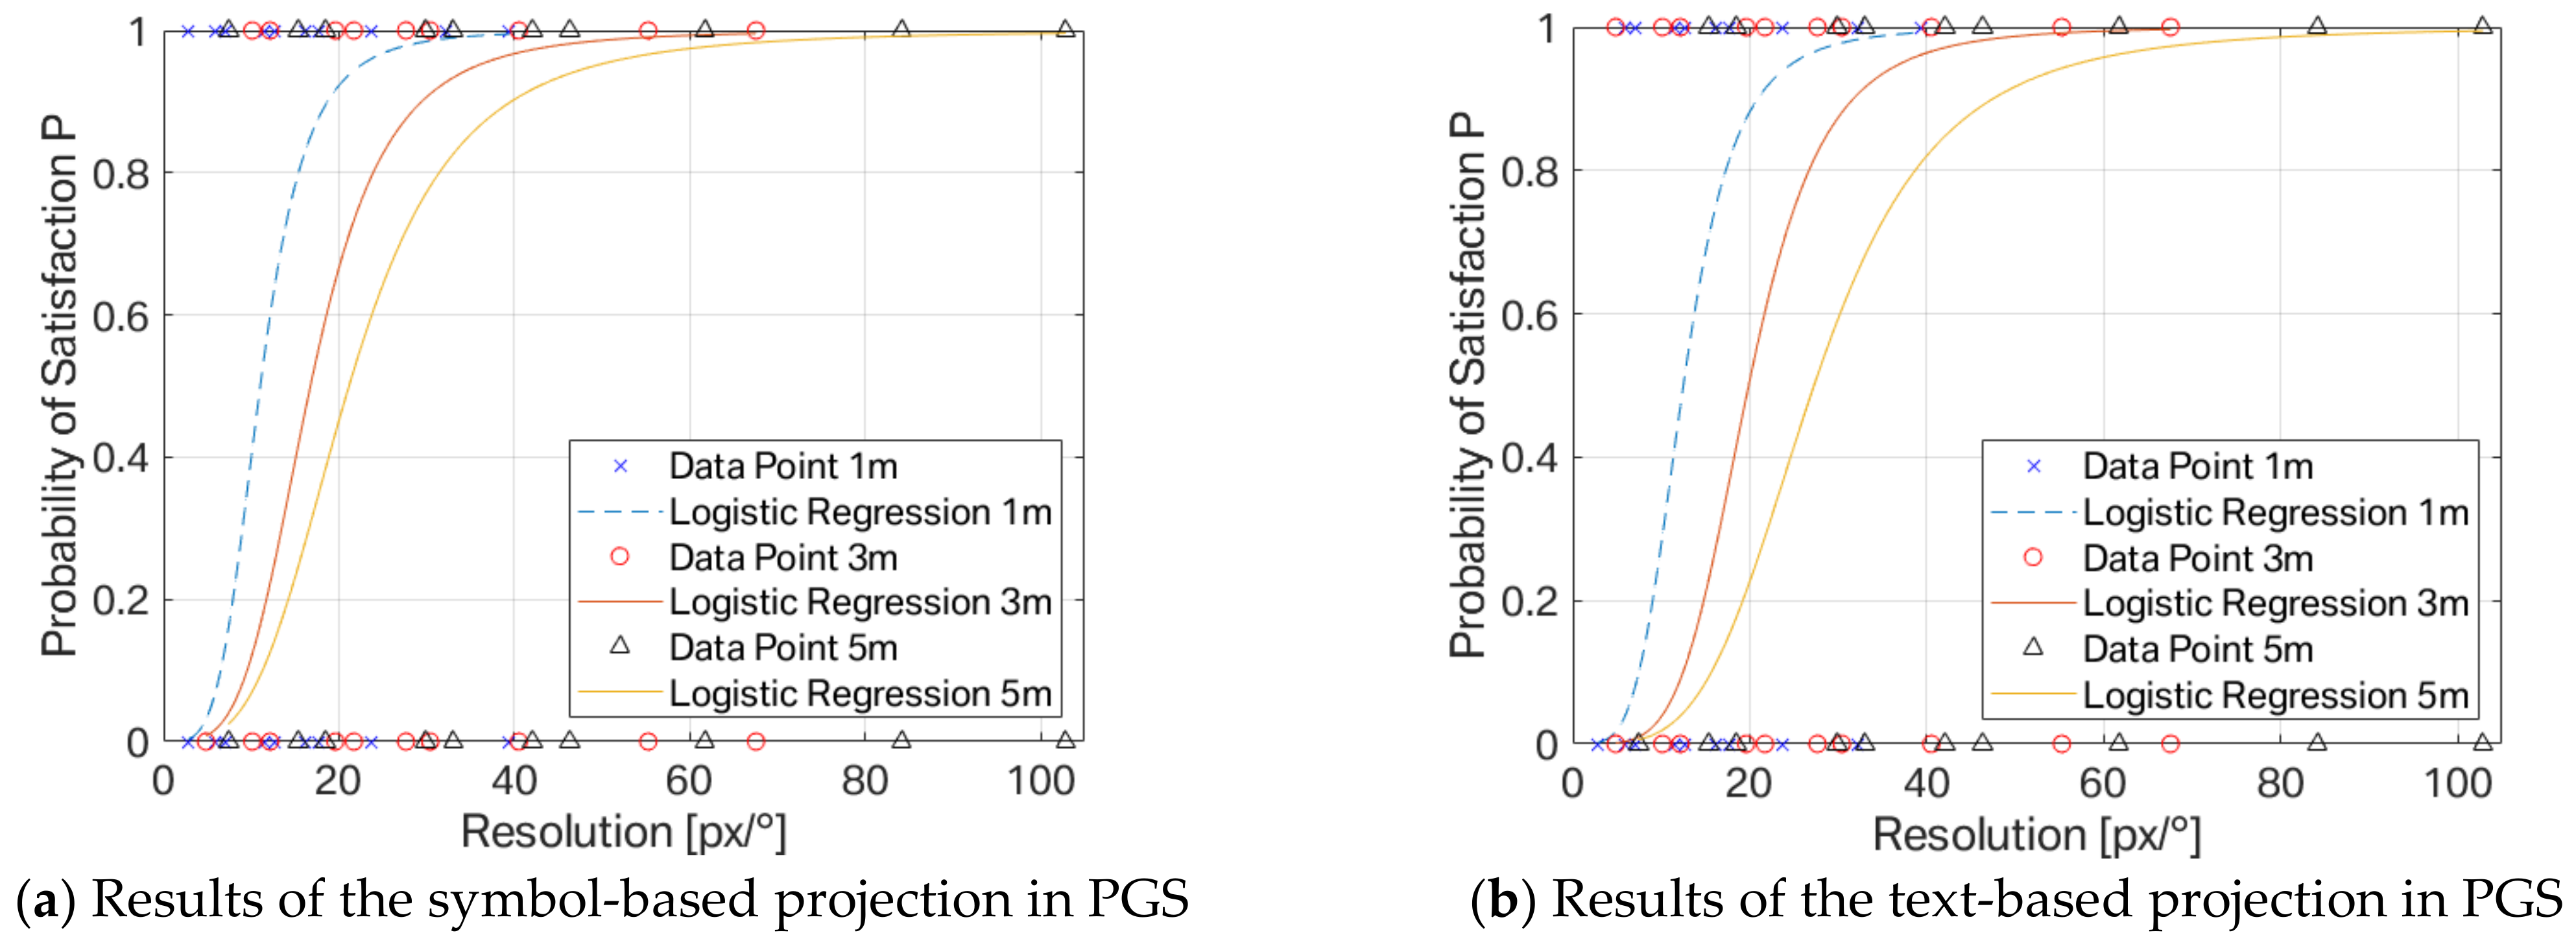
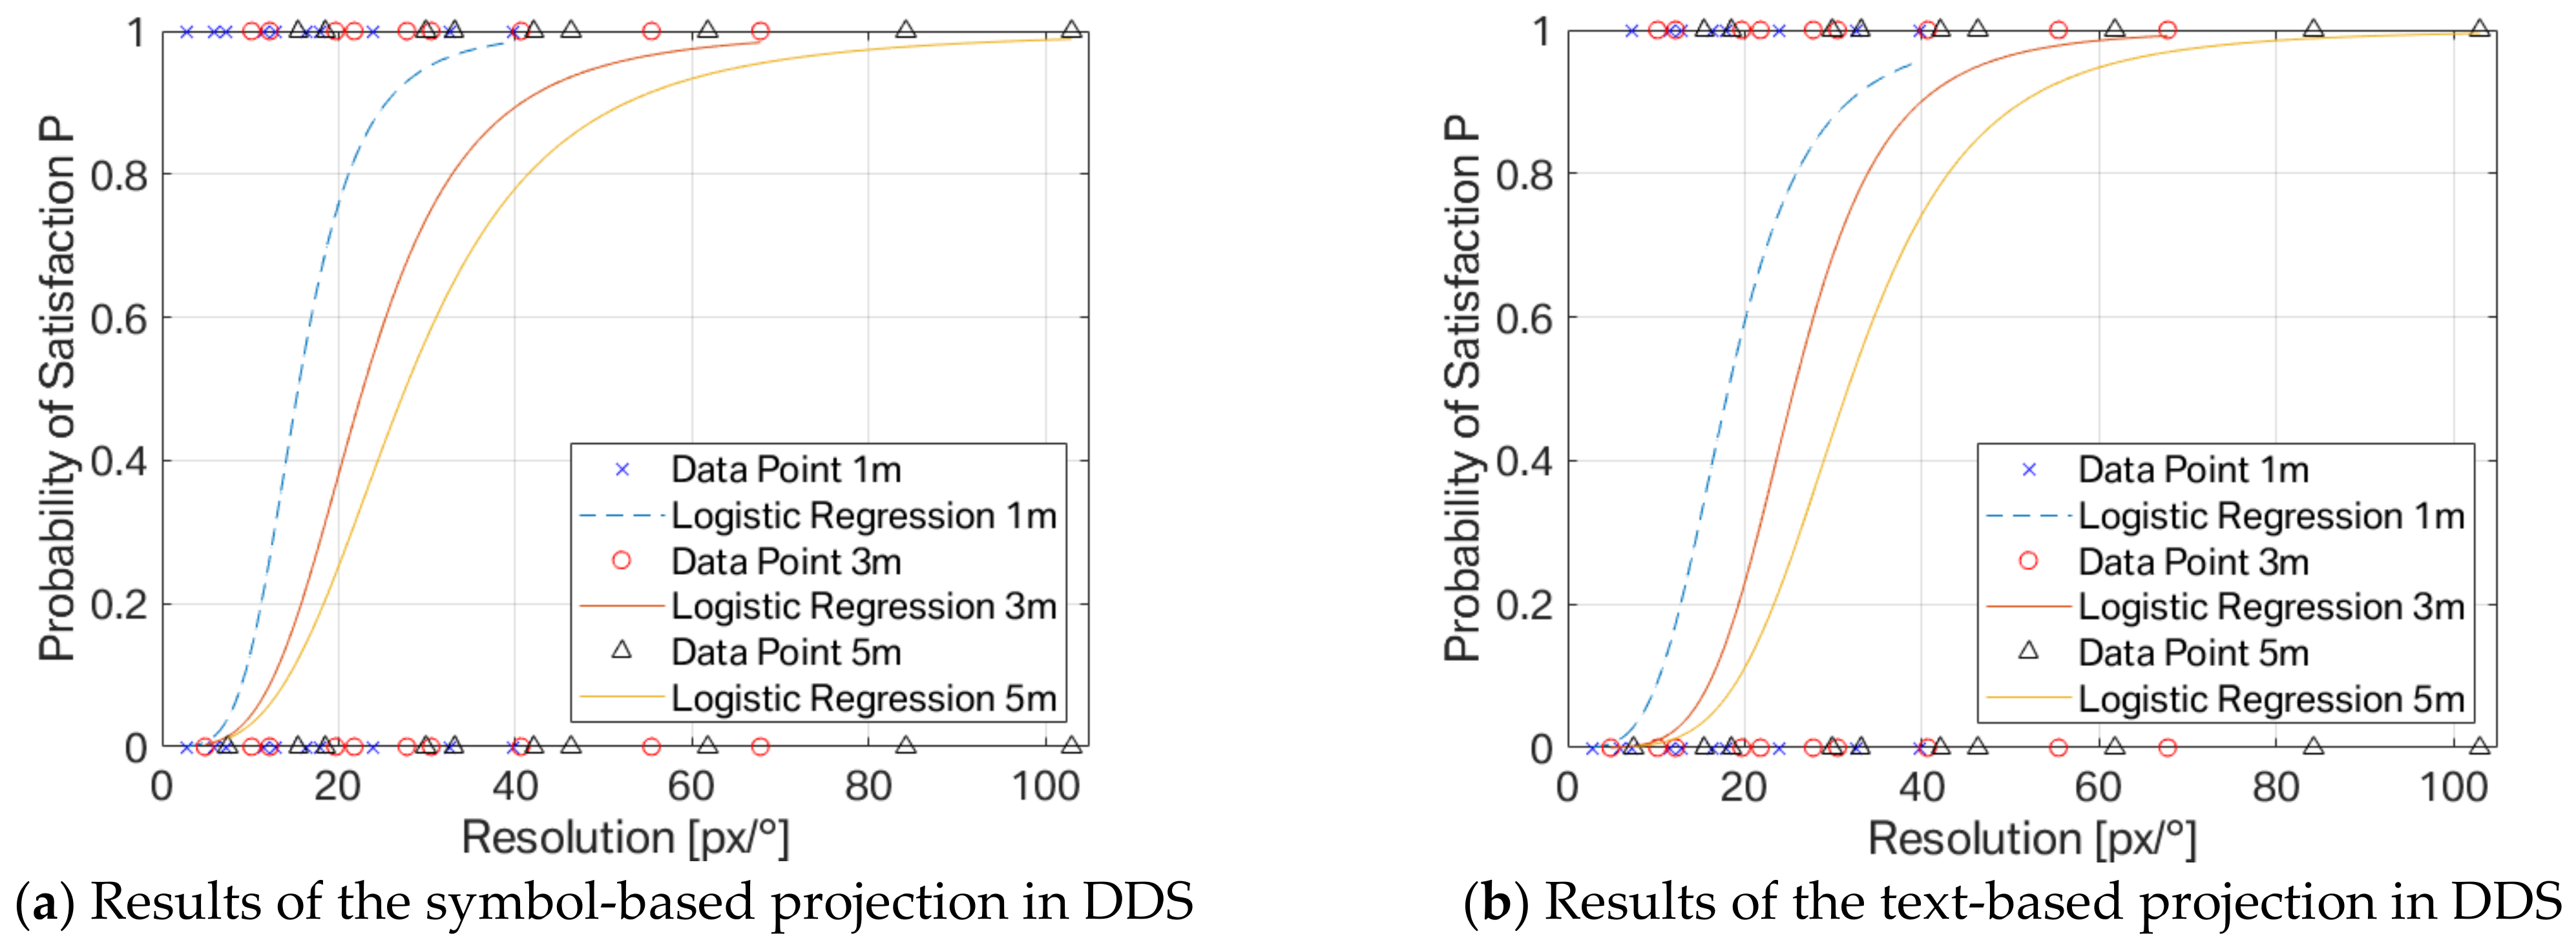
This work’s analysis considers the dependencies of the observer’s viewing distance, different ambient lighting scenarios and various projection content. All discussed resolution levels are the 90% values of the logistic regression function. This quality threshold level is selected to guarantee a high-quality resolution requirement and consider the worst-case scenario, since the executed studies had a fine-grained asphalt surface. However, previous studies examined resolution requirements for displays or projection screens in cinemas, which have a projection surface with nearly ideal characteristics without a tilted view. However, none derives the necessary characteristics from the customer- or pedestrian-orientated perspective, i.e., the perspective of the receivers of near-field projections in future mobility.
The results of symbol- and text-based projections in PGS and DDS are lower than the resolution of the gap size between the two lines of 85.73 px/° for PGS and 52.93 px/° for DDS in the pre-study. In conclusion, the difference between the results in
Table 2 and the pre-study, which defines the maximum perceived resolution on the projection surface, ensures that the tested quality levels were resolvable at the closest observation distance of 1 m. Furthermore, this guarantees that the resulting resolution of symbol- and text-based projections regarding the evaluation aspect of quality has other requirements than the resolvable detail, which is less complex and relates to the static visual acuity task [
36].
Therefore, the analyses conducted in this work define some dependencies and simplifications for perceived resolution requirements. First, the impact of ambient lighting is significant (
Table 1) for all combinations and defines an explicit dependency in the participants’ perception. This significant difference is due to the interaction of rods and cones in the mesopic range of adaptation luminance, which is linked to the increasing acuity at increasing luminance levels [
38]. Hence, this phenomenon confirms the use case of near-field projections for text- and symbol-based projection content in DDS (~6 cd/m
2) or PGS (~1 cd/m
2) due to Valberg’s definition [
36] of maximal acuity above 2 cd/m
2.
Second, the impact of the projection content focuses on the effective resolution in
Table 2 to increase the importance of the resolution values and not just to focus on significance levels [
44].
Table 2 also displays the spread of the results with 95% confidence intervals, which deliver an overlay of the symbol- and text-based projection content in the PGS and DDS. The overlay leads to a tendency of a uniform projection system for both projection content varieties regarding the perceived resolution.
5. Conclusions and Outlook
In conclusion, near-field projections have higher visual acuity requirements for text-based projections compared with symbol-based content. The theory especially states that textual acuity tests demand higher visual acuity than sign-based optotype tests due to the more significant cognitive load of the participant [
36]. The resolution requirements for near-field projections disagree with the theory of visual acuity regarding the text- or symbol-based content in DDS for 3 m and 5 m viewing distances. External factors such as variation in the roughness of the street surface or the reflection characteristics of the asphalt due to the various viewing distances and viewing angles may be specific to the automotive sector compared to other applications.
Nevertheless, taking the 95% confidence intervals into account, it is possible to find in most combinations an overlap of perceived resolutions in
Table 2, which are valid for both projection contents, such as PGS 3 m and DDS 3 m and 5 m. This overlay and the possibility to simplify allows us to focus on safety-relevant situations in future mobility-viewing distances above 1 m. The 3 m and 5 m observation distances will be a widespread use case for safety-relevant projections. A vulnerable road user, such as a pedestrian or cyclist, has to be warned by a safety-relevant projection in hers/his field of view and still has enough time and distance to the vehicle to interact with the symbol- or text-based message to avoid any fatalities. The importance of these use cases is likewise emphasized by the report of DEKRA, which states a cycling braking distance of about 4 m to 5 m depending on the braking system and if the road is wet or dry [
45].
To create a realistic setting and thus ensure external validity, we instructed the participants to evaluate the perceived quality of the projection instead of solely focusing on the resolution. Moreover, we used automotive-specific symbols and texts instead of symbols typically used in acuity testing, e.g., Landolt rings. The results in
Table 2 are indicators for high-quality resolutions for near-field projections and should be considered in the design of near-field projectors. Future studies should investigate if those indicators apply in different contexts, too. However, these findings are the first indicators in the introduced field of research, which can motivate other researchers focusing on future mobility solutions to concentrate on this application field. Especially other research facilities can confirm the discovered relations and increase the importance of this benchmark.
A generalization of the study results on every text- or symbol-based projection must be carefully examined. Especially for safety-relevant projection content in an urban environment, further research is needed. The static laboratory setting in this work did not include the movements of either the participant or the vehicle, which derogates the conditions of a realistic urban setting. Next, the theoretical derivation based on the subject study should lead to a verification study, where the displayed study aperture evaluates the resulting resolution requirements in a field test and the requirements for the optical system of the near-field projector. Furthermore, the effect of age or sex, which are possible impact factors for visual acuity, is neglected in this work to establish general resolution requirements. Further, the influence of the font style or complexity of characters [
46], which is a stylistic characteristic and language dependent, must be considered when focusing on text-based projection content, such as text-based information of the highly automated vehicle or welcoming messages.
