Abstract
Basement excavation may induce deformations of the adjacent tunnels. The response of existing tunnels to basement excavation considering the critical unloading ratio is rarely studied. In this study, a three-dimensional numerical model is established to investigate basement–tunnel interaction. Then, the numerical model is validated by simulating the centrifuge model test. Thereafter, the influences of basement geometry and tunnel location relative to the basement on the vertical deformation of the tunnel are studied. The results show that the vertical deformation of the tunnel increases linearly with the unloading ratio, which describes the degree of excavation depth above the tunnel. But there exists a critical unloading ratio of 0.6, beyond which the vertical deformation of the tunnel increases significantly. On this basis, an empirical model is proposed to predict the vertical deformation of the tunnel considering the unloading ratio.
1. Introduction
In recent years, cities in China have been continuously expanding in scale, generating a large number of basement projects with increasing depths and scales. Meanwhile, rail transit has become an important means of reducing urban congestion. Therefore, basement excavation near existing tunnels is inevitable in land-limited central cities. It has been proved that the excavation of underground space will induce the deformation in adjacent existing structures and affect the safety of the structures [,,,,,,,]. Consequently, many scholars have carried out significant experimental and theoretical research on the interaction between the basement and the tunnel, but there are still some shortcomings.
The current research methods for underground structure construction include field monitoring [,,,,,], centrifuge tests [,], and numerical simulation [,,,,,,,,,,,,,,,,,,]. Complex factors such as engineering geological conditions, tunnel structure form, and foundation construction technology can be fully considered in the numerical simulation method, and many scholars have applied this method in their research. Doležalová M [] established a two-dimensional numerical model of a deep basement in the Czech Republic to predict the deformation and stresses in an undercut tunnel induced by excavation. Liao et al. [] analyzed the influence of parameters (such as excavation depth and distance between the station and basement) in a project in Suzhou. Liu et al. [] studied the control effect of construction measures (such as excavation sequence, jet grouting, pile, and slab support) based on the construction of a tunnel in Nanjing. Chen [] and Li [] proposed the divided alternate excavation method as a way to cope with complex projects with a large excavation depth and long crossing length according to a project in Shanghai. Zhou et al. [] studied the deformation characteristics of a tunnel at different positions and proposed soil reinforcement measures for the tunnel at different positions based on a project in Shenzhen. Huang [] presented a study on excavation above collinear tunnels in Shanghai, which shows that the development of tunnel deformation is similar for tunnels with different diameters at the same position. Yang [] found that a door-frame structure formed by isolated piles and uplift piles was an effective method of suppressing tunnel deformation in a project in Suzhou.
Many scholars have investigated the influence of the variables of a basement–tunnel interaction problem using numerical simulations. Zheng [] compared tunnel deformations at three different locations (at the midline of the basement, directly below the diaphragm wall, and outside the basement) and found that the tunnel settled or bulged depending on the location. Lin [] compared the deformation forms of a tunnel at different positions of the basement and found that vertical deformations of the underlying tunnel were significantly greater than horizontal deformations. Liu [] studied basement support methods to reduce this influence on tunnels according to Lin’s research results. Zheng [] and Fan [] analyzed the deformation characteristics of a tunnel and divided it into four influenced zones. Sun et al. [] compared the tunnel deformation induced by circular and rectangular basements and concluded that the tunnel deformation induced by a circular basement was about 1.2 times that of a rectangular basement under the same conditions. Ng et al. [] carried out centrifuge model tests in dry sand to investigate the influence of basement excavation on existing tunnels. Shi et al. [,,,] studied the influencing factors of this problem and proposed a calculation method to predict the tunnel deformation through numerical simulation on this basis. Zhao et al. [] compared four tunnels with different positions under the basement and found that the tunnel outside the excavation scope in an area that was twice as large was virtually unaffected. Although the influence of basement excavation above an existing tunnel has been studied by means of numerical simulations, the effects of the rules of basement geometry and tunnel location relative to the basement on the vertical deformation of the tunnel are not yet fully understood.
In this study, a three-dimensional numerical model was first established to investigate the effect of basement excavation above an existing tunnel. Thereafter, the model was validated using the centrifuge model test of basement excavation above an existing tunnel in dry sand, as performed by Ng et al. []. On this basis, the influences of excavation size and the relative position between the basement and tunnel on the vertical deformation of the tunnel were further investigated.
2. Numerical Model of Centrifuge Test
2.1. Description of the Centrifuge Test
A three-dimensional numerical model of basement excavation above the existing tunnel was established based on a centrifuge model test. This centrifuge model test was performed by Ng et al. [] to investigate the effect of basement excavation on an existing tunnel in Toyoura sand. The test was carried out at a centrifuge acceleration of 60 g. In the centrifuge model test, the sand sample had plan dimensions of 1245 × 990 mm and a depth of 750 mm. The basement model had plan dimensions of 300 × 300 mm (L × B = 300 × 300 mm) and a depth of 150 mm (He = 150 mm). The tunnel model had a diameter of 100 mm (D = 100 mm). It was located directly under the basement model, with a distance of 250 mm from the surface of the model foundation to the tunnel axis, and a distance of 450 mm from the bottom of the tunnel to the model foundation. The dimensions of the centrifuge model are shown in Figure 1.
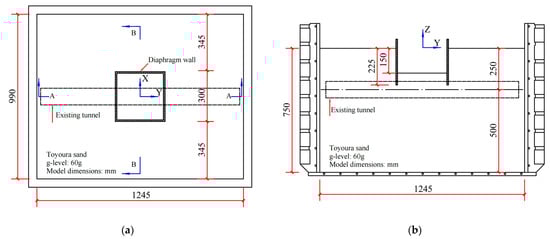
Figure 1.
Schematic diagram of the centrifuge test: (a) plan view; (b) elevation view.
As shown in Figure 1, the diaphragm walls had a depth of 225 mm. These walls were made of 12.7 mm thick aluminum sheets which were equivalent to 0.96 m thick slabs of C50 concrete in the prototype. The tunnel model was composed of a 3 mm thick aluminum sheet which was equivalent to 0.18 m tunnel lining of C50 concrete in the prototype. A closed latex membrane, which had the same volume as the basement, was installed inside the basement. The latex membrane was filled with a heavy fluid (ZnCl2) of the same density as the Toyoura sand. To simulate the excavation of a layered basement, the heavy fluid (ZnCl2) was discharged from the latex membrane. According to measurements from the servo control device, three excavation stages (He = 3.1 m, 6.2 m, and 9.0 m) were realized, respectively. In the centrifuge model tests, a servo control device was used to discharge the heavy fluid (ZnCl2) in three stages, simulating an excavation for three depths, respectively.
2.2. Numerical Model
Figure 2 shows the view of the numerical model in PLAXIS 3D in accordance with the prototype model. In the numerical model, the foundation had plan dimensions of 74.7 × 59.4 m and a depth of 50 m. The basement had plan dimensions of 18 × 18 m (L × B = 18 × 18 mm) and a depth of 9 m. The diaphragm wall had a depth of 13.5 m. The tunnel had a diameter of 6 m (D = 6 m), a lining of 0.18 m thick concrete slab, and a cover depth of 12 m (Hc = 12 m). The horizontal unidirectional constraints were applied on the four vertical sides of the model, whereas the horizontal and vertical bidirectional constraints were applied on the bottom of the model. Thus, soil movements normal to those four vertical sides and all movements to the bottom were restrained. The effect of groundwater was not considered in the model since the centrifuge test was established in dry sand.
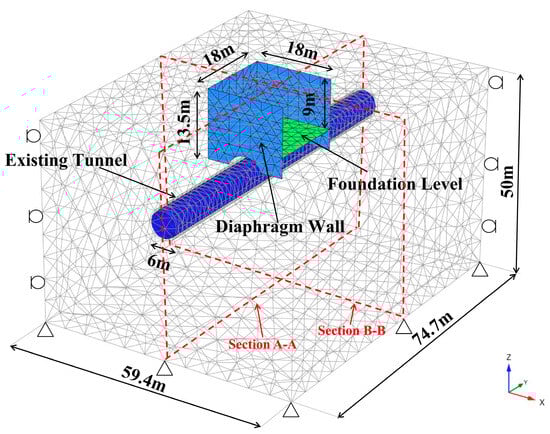
Figure 2.
Schematic diagram of the numerical model.
In PLAXIS, there are five global levels of finite element meshes (very coarse, coarse, medium, fine and very fine). The mesh should be sufficiently fine to obtain accurate numerical results. On the other hand, very fine meshes should be avoided since they will lead to excessive calculation times []. In this study, the global mesh of the model was set to “Medium”, but the meshes of the tunnel and the soil within 3 m outside the tunnel were refined to “Fine”. Compared with the calculation results of the model with the global mesh refined to “Very fine”, the calculation accuracy of the model mesh division in this paper is sufficient, and the calculation efficiency is relatively high.
2.3. Constitutive Models and Model Parameters
The Toyoura sand was simulated using the Hardening Soil (HS) model. The HS model is a shear and compression hardening constitutive model for the behavior simulation of both soft soils and stiff soils. Shear hardening is used to model irreversible strains due to primary deviatoric loading. Compression hardening is used to model irreversible plastic strains due to primary compression in oedometer loading and isotropic loading []. The parameters for Toyoura sand are adopted from Diao [] and summarized in Table 1.

Table 1.
Foundation soil material parameters.
The plate element inherent in Plaxis 3D was used to simulate the diaphragm walls and tunnel linings, which were modeled as an elastic material with a Young’s modulus of 35.0 GPa and Poisson’s ratio of 0.2 []. The unit weight of the diaphragm walls and tunnel lining was 25.0 kN/m3.
2.4. Modeling Procedure
The numerical simulation process was the same as the centrifuge test process, as shown in Figure 3, and the steps were as follows: (1) Initiate the boundary, initial stress conditions, and the initial equilibrium state; (2) activate the tunnel lining and diaphragm walls, and calculate the equilibrium state; (3) reset the displacement to zero, and simulate the basement excavation by deactivating the soil elements in the basement.
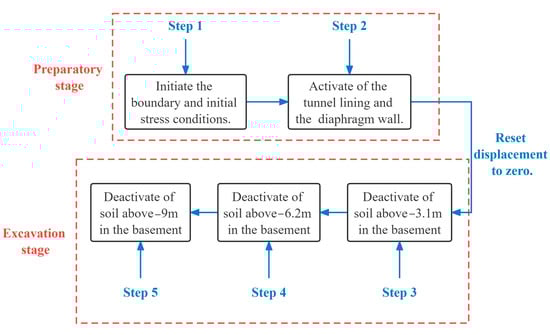
Figure 3.
Schematic diagram of the calculated working conditions.
2.5. Numerical Results
The ground and tunnel deformations as measured from the centrifuge tests were compared and discussed with the numerical simulation results in terms of prototype units. The tunnel cover depth, Hc, was used as a normalized parameter to normalize the calculation results.
Figure 4 shows the measured and computed ground settlement of sections A-A and B-B (shown in Figure 2). It can be seen that the computed profiles of ground surface settlement agree reasonably well with the measurements. The maximum settlement occurs near the edge of the basement, with a settlement of 0.06% Hc. The settlement decreases gradually with increasing distance, with a settlement of 0.02% Hc at a distance of 2.0 Hc from the wall edge.
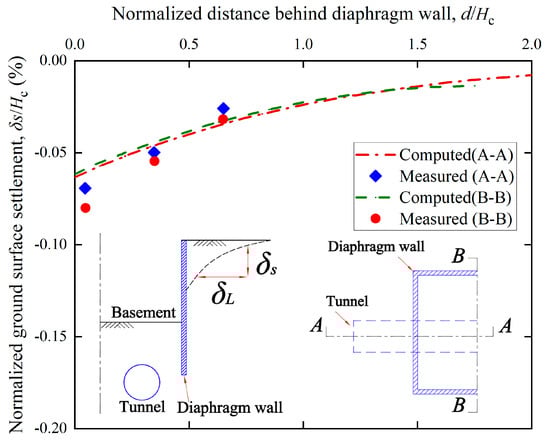
Figure 4.
Ground surface settlement behind the diaphragm wall.
Figure 5 shows the measured and computed soil heave at the formation level of the basement. It can be seen that the computed profiles of soil heave agree reasonably well with the measurements when the basement depth is shallow (He = 3.1 m, 6.2 m). However, when the basement depth, He, is 9 m, there are some differences between the measured and computed soil heave. The soil heave at the basement center is 0.099% Hc (the measured heave is 0.08% Hc) and decreases to 0.096% Hc (measured heave is 0.07% Hc) at 0.4 L away from the basement center. According to the computed results, the variation in the soil heave is relatively small within 0.4 L from the basement center but decreases rapidly beyond this distance. The heavy fluid (ZnCl2) in the centrifuge model test is isotropic, and the stresses in the ZnCl2 solution are isobaric. However, the ratio of horizontal to vertical stresses in the sand is less than 1 in the numerical simulation. So, there are some relatively large differences between the measured and computed results.
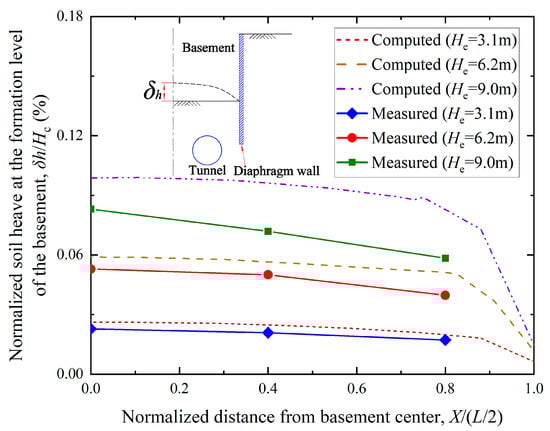
Figure 5.
Soil heave at the formation level of the basement.
Figure 6 shows the measured and computed vertical deformation of the tunnel with excavation depth. It can be seen that the computed profiles of vertical deformation agree reasonably well with the measurements. The vertical deformation of the tunnel increases with increasing excavation depth. The non-linear relationship of the computed vertical deformations is more obvious than the measurements. Within the scope of the basement, the closer the measurement point is to the diaphragm wall, the greater the reduction in vertical deformation of the tunnel, while outside the scope of the basement, the vertical deformation of the tunnel is relatively small. Finally, the vertical deformation of the tunnel decreases to zero at a distance of 1.5 L away from the basement center, which indicates that the main influence area of basement excavation on the lower tunnel is 1.5 times the length of the basement.
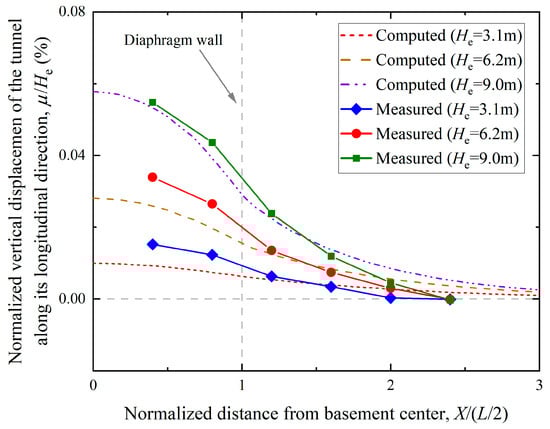
Figure 6.
Vertical displacement along the tunnel.
Comparisons of the measured and computed results of the ground surface settlements, soil heave at the formation level of the basement, and vertical displacement along the tunnel indicate that the numerical model is reasonably accurate in its analysis of the influence of basement excavation on the existing tunnel.
3. Analysis of Influencing Factors
In this section, the influences of basement geometry and tunnel location relative to the basement on the vertical deformation of the tunnel, µ, are investigated. Figure 7 shows the basement length, L, along the tunnel direction, the basement width, B, perpendicular to the tunnel direction, the basement depth, He, the tunnel cover depth, Hc, the tunnel diameter, D, and the distance between the tunnel axis and the basement center, F.
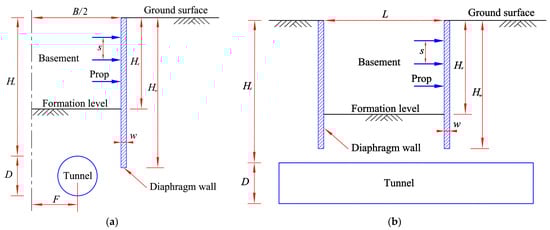
Figure 7.
Schematic diagram of the basement–tunnel interaction problem: (a) cross section 1; (b) cross section 2.
The relationship between the vertical deformation of the tunnel, µ, and the various influencing factors is expressed by the function
where the parameters in the equation are all length parameters. The dimensionless processing of each parameter is carried out to analyze the general relationship between these parameters and tunnel deformation. The dimensionless group is obtained as follows:
3.1. Influences of Basement Plan Dimensions
In this section, the vertical deformation of the tunnel for six different cases (basement length L = 36 m, 63 m, 90 m and basement width B = 36 m, 63 m, 90 m) is analyzed. Figure 8 shows the vertical deformation of the tunnel for different basement plan dimensions. It can be seen that tunnel vertical deformations increase significantly with the increase in L or B. However, for the same increment, the vertical tunnel deformation induced by increasing L is significantly larger than that induced by increasing B. The scope of vertical tunnel deformation due to basement excavation is expanded significantly by an increase in L, but remains almost constant with the increase in B. Although the scope of vertical deformation is expanded, the ratio X/(L/2) gradually decreases and tends to 0.5 L. The results indicate that the diaphragm wall is a constraint on tunnel deformations, but this constraint gradually weakens with the increase in L.
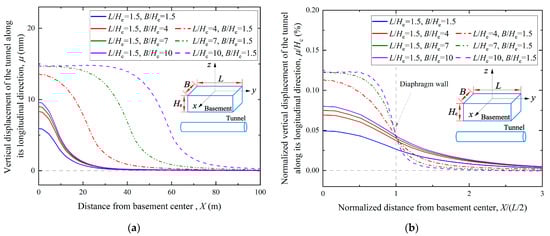
Figure 8.
Vertical deformation of the tunnel for different basement plan dimensions: (a) vertical deformations along the tunnel; (b) normalized vertical deformations along the tunnel.
Figure 9 shows the relationship between the maximum vertical deformation of the tunnel, µmax/Hc, and basement dimensions. The maximum vertical deformation of the tunnel increases with the increase in L or B. But the increase in the maximum deformation due to L is larger than that due to B. When the ratio of L/Hc or B/Hc is less than 3, the maximum vertical deformation increases rapidly, while the change is relatively small for ratios larger than 3, and it keeps constant for ratios larger than 7. Therefore, when the ratio of L/Hc is larger than 7, the problem of the maximum vertical tunnel deformation below the center of the basement can be considered a planar problem.
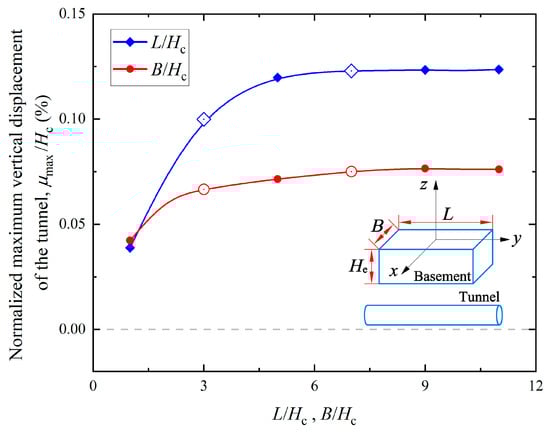
Figure 9.
Relationship between maximum vertical tunnel deformation and basement plan dimensions.
3.2. Influence of the Tunnel Cover Depth, Hc, and the Basement Excavation Depth, He
The maximum vertical deformation of the tunnel µmax affected by the basement depth, He, for the five different tunnel cover depths (Hc = 12 m, 24 m, 36 m, 48 m, 60 m) is analyzed. Figure 10 shows the maximum vertical deformation of the tunnel, µmax, with different Hc and He. It can be seen that the maximum vertical deformation of the tunnel increases with increasing He and decreases with increasing Hc. The non-linear relationship between maximum vertical deformation and He becomes more significant with increasing Hc. At the same He, the tunnel with larger Hc produces smaller maximum vertical deformation. This is due to a larger Hc corresponds to a smaller relative excavation depth.
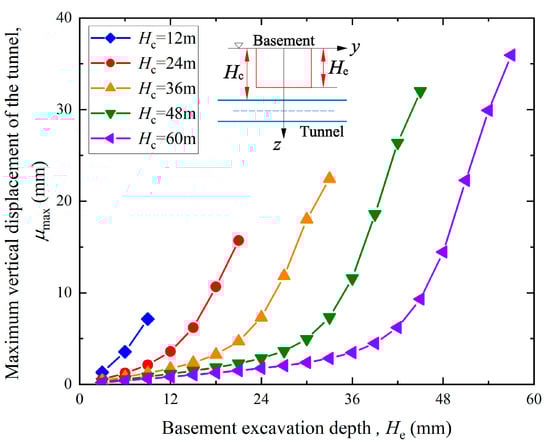
Figure 10.
Maximum vertical deformation of the tunnel with different basement depths and varying strata depth.
The ratio of basement depth, He, to tunnel cover depth, Hc, is defined as the unloading ratio, α, which describes the degree of excavation depth above the tunnel. The value of α ranges from 0 and 1, with a higher α indicating a greater excavation depth above the tunnel. Figure 11 shows the relationship between the maximum vertical deformation of tunnel, µmax, and the unloading ratio, α. It can be seen that the vertical deformation increases with increasing α. There exists a critical unloading ratio α of 0.6. The vertical deformation of the tunnel shows a linear increase with increasing α for a value of α less than 0.6, while it increases rapidly for an α larger than 0.6. The figure shows the hyperbolic fitting function between the maximum vertical deformation and α and the linear fitting function for a value of α less than 0.6.
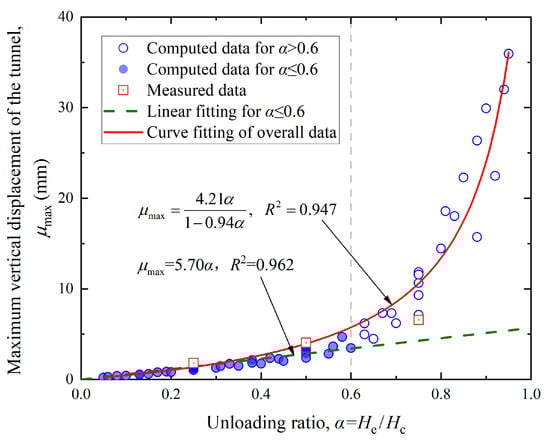
Figure 11.
Relationship between maximum tunnel vertical deformation and unloading ratio.
3.3. Influence of Tunnel Diameter D
The maximum vertical deformation of the tunnel, µmax, affected by basement depth, He, and tunnel cover depth, Hc, for four different tunnel diameters (D = 3 m, 9 m, 12 m, 15 m) is analyzed. Figure 12 shows the relationship between the vertical deformation of the tunnel, µmax, with He and Hc for different Ds. It can be seen that the variation in D does not alter the non-linear relationship between the vertical deformation of the tunnel with He and Hc, and the magnitude of deformation has a relatively small change. The results indicate that tunnel diameter, D, has a relatively small influence on vertical deformation. This is consistent with the conclusion of similarity in the tunnel deformations induced by unloading for varying diameters at the same position drawn by Huang [].
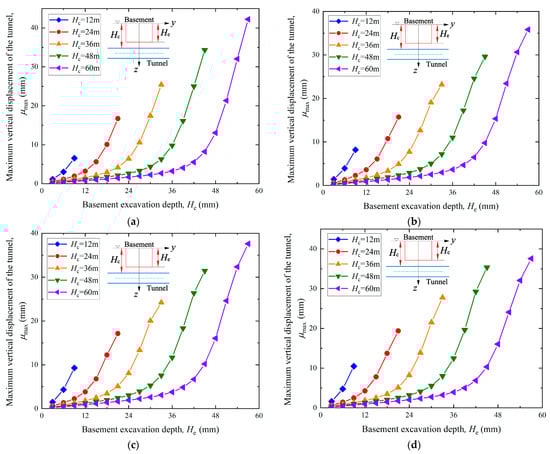
Figure 12.
Maximum vertical deformation of tunnels for different tunnel diameters: (a) D = 3 m; (b) D = 9 m; (c) D = 12 m; (d) D = 15 m.
Figure 13 shows the relationship between the maximum vertical deformation of the tunnel, µmax, and the unloading ratio, α, for different tunnel diameters, D, respectively. It can be seen that there is still a critical unloading ratio α of 0.6. The vertical deformation of the tunnel increases linearly with increasing α for a value of α less than 0.6, while it increases rapidly for an α larger than 0.6. The figure shows the fitting function between the maximum vertical deformation and α for different D, respectively.
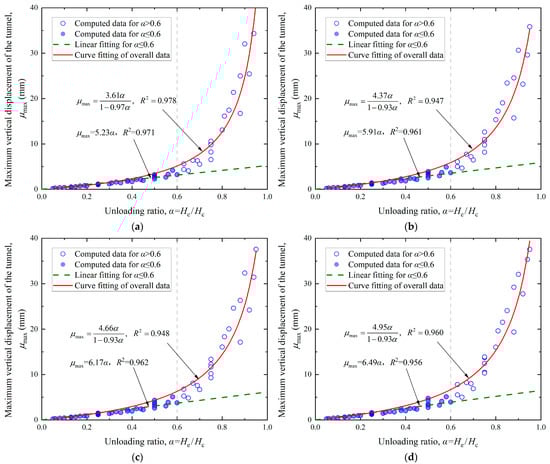
Figure 13.
Relationship between maximum tunnel vertical deformation and unloading ratio for different tunnel diameters: (a) D = 3 m; (b) D = 9 m; (c) D = 12 m; (d) D = 15 m.
Figure 14 shows the relationship between the maximum vertical deformation of the tunnel, µmax, and the unloading ratio, α, for different tunnel diameters, D. The statistical relationship for the vertical deformation of the tunnel is obtained via hyperbolic fitting:
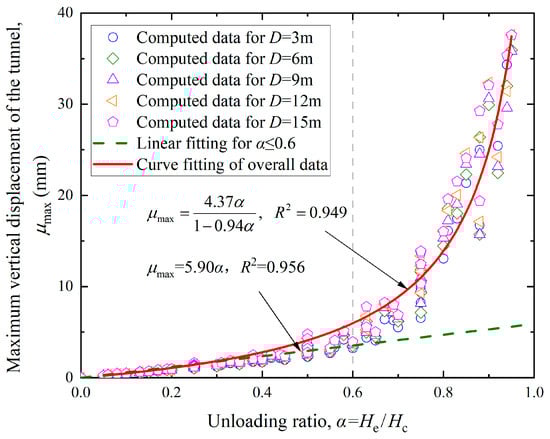
Figure 14.
Relationship between maximum vertical deformation of tunnel and unloading ratio.
The linear relationship of tunnel vertical deformation for an α value of less than 0.6 is obtained using the least-squares method:
3.4. Influence of Basement Length L
The maximum vertical deformation of the tunnel, µmax, affected by basement length, L, for three different unloading ratios (α = 0.25, 0.50, 0.75) and five different tunnel cover depths (Hc = 12 m, 24 m, 36 m, 48 m, 60 m) is analyzed. Figure 15 shows the relationship between the maximum vertical deformation of the tunnel, µmax, and the basement length, L, for different cases, respectively. There are two transition ratios, L/Hc, for each curve. The first transition ratio occurs when L/Hc is 3, and the increased rate of maximum vertical deformation of the tunnel begins to decrease. The maximum vertical deformation remains stable at the second transition ratio. The second transition ratio for each curve is different, and it decreases with increasing Hc. The second inflection point occurs at L/Hc = 7 for Hc = 12 m, while L/Hc = 4 for Hc = 60 m. This result indicates that the tunnel with larger Hc is relatively less influenced by L.
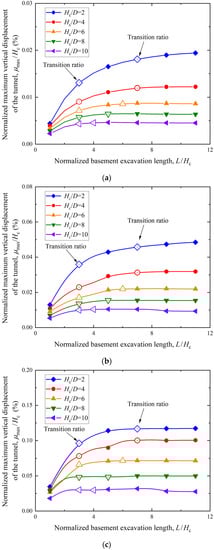
Figure 15.
Relationship between maximum vertical deformation of tunnel and basement length for different cases: (a) α = 0.25; (b) α = 0.50; (c) α = 0.75.
To eliminate the influence of the unloading ratio, the maximum vertical deformation of the tunnel, µmax, was normalized in the form of µmax/(αHc). Figure 16 shows the relationship between the maximum vertical tunnel displacement and the basement length, L, after normalization. It can be seen that the maximum vertical deformation of the tunnel for an α value of less than 0.6 is all distributed within a certain range, while the distribution of the maximum vertical deformations for α = 0.75 goes outside this range. This is similar to previous research findings showing that tunnel deformation is less induced by excavation when α < 0.6.
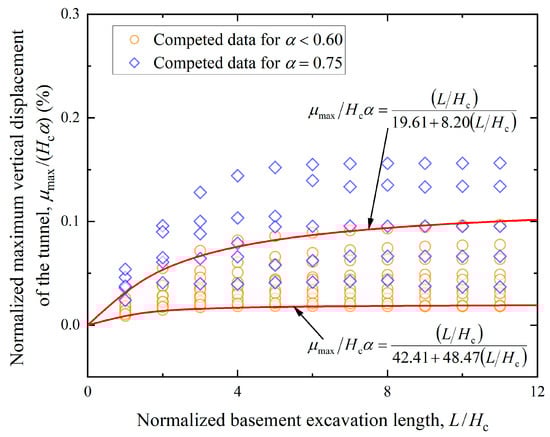
Figure 16.
Relationship between maximum vertical of tunnel displacement and basement length after normalization.
3.5. Influence of Basement Width B
In this section, the maximum vertical deformation of the tunnel affected by basement width, B, for three different unloading ratios (α = 0.25, 0.50, 0.75) and five different tunnel cover depths (Hc = 12 m, 24 m, 36 m, 48 m, 60 m) is analyzed. Figure 17 shows the relationship between the maximum vertical deformation of the tunnel and the basement width, B, for different cases, respectively. The maximum vertical deformation of the tunnel is less influenced by B than by L. There are two transition ratios, B/Hc, for each curve as well. The first transition ratio, B/Hc, is 3, and the second transition ratio decreases with increasing Hc. This result also indicates that the tunnel with larger Hc is relatively less influenced by B.
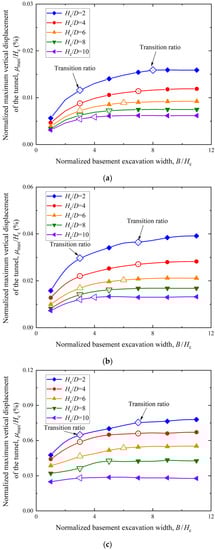
Figure 17.
Relationship between maximum vertical deformation of tunnel and basement width for different cases: (a) α = 0.25; (b) α = 0.50; (c) α = 0.75.
Figure 18 shows the relationship between the maximum vertical tunnel displacement and the basement width, B, after normalization. It can be seen that the maximum vertical deformation of the tunnel for an α value of less than 0.6 is all distributed within a certain range, while the distribution of the maximum vertical deformations when α is 0.75 goes outside this range. It may be due to the lesser influence of tunnel deformation by unloading for an α value of less than 0.6. Therefore, the unloading ratio, α, should be maintained at less than 0.6 in relevant engineering projects.
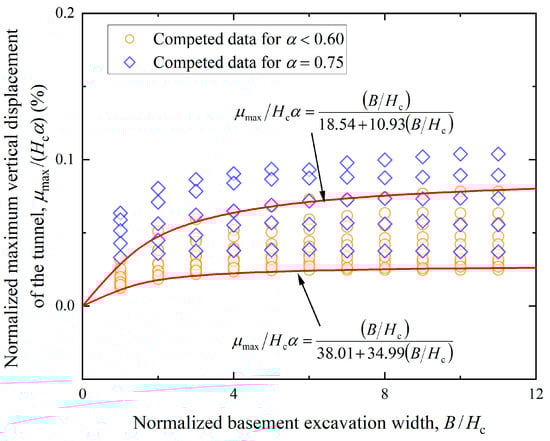
Figure 18.
Relationship between maximum vertical of tunnel displacement and basement width after normalization.
3.6. Influence of Distance between Tunnel Axis and Basement Center F
The maximum vertical deformation of the tunnel, µmax, affected by the distance between the tunnel axis and the basement center, F, for three different unloading ratios (α = 0.25, 0.50, 0.75) and four different basement widths (B = 30 m, 60 m, 90 m, 120 m) is analyzed. Figure 19 shows the relationship between the maximum vertical deformation of the tunnel, µmax, and the distance between the tunnel axis and the basement center, F, for different cases, respectively. It can be seen that the maximum vertical deformation of the tunnel decreases with increasing F. The maximum vertical deformation of the tunnel remains unchanged for the lower F, while it begins to decrease when F reaches a critical level.
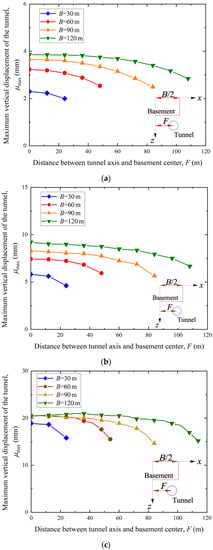
Figure 19.
Relationship between maximum vertical tunnel displacement and distance between tunnel axis and basement center: (a) α = 0.25; (b) α = 0.50; (c) α = 0.75.
The ratio of the distance between the tunnel axis and the basement center, F, to half the basement width, B/2, is defined as the offset ratio, β, which describes the degree of tunnel offset from the basement center. The value of β ranges from 0 and 1, with a higher β indicating a greater tunnel offset. Figure 20 shows the relationship between the maximum vertical deformation of the tunnel and offset ratio, β. It can be seen that vertical deformation decreases with increasing β. There exists a critical offset ratio, β, of 0.4. The vertical deformation of the tunnel remains unchanged for a value of β less than 0.4, while it decreases rapidly for a value of β larger than 0.4.
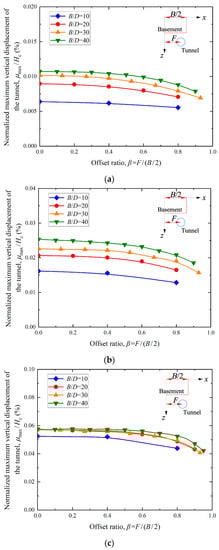
Figure 20.
Relationship between maximum vertical deformation of tunnel and offset ratio: (a) α = 0.25; (b) α = 0.50; (c) α = 0.75.
The deformation discount ratio, η, is defined to describe the degree of deformation discount for tunnel offset:
where μmax is the maximum vertical deformation of the tunnel for β = 0 and μ′max is the maximum vertical deformation of the tunnel for β > 0. The value of η ranges from 0 and 1, with a higher η indicating a greater deformation reduction. Figure 21 shows the relationship between η and β. It can be seen that η increases with increasing β. η is essentially zero for a value of β less than 0.4, while it increases rapidly for a value of β larger than 0.4. The maximum η is approximately 0.3.
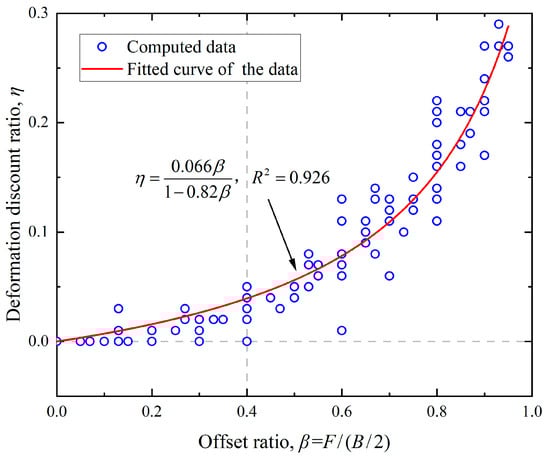
Figure 21.
Relationship between deformation discount ratio and offset ratio.
4. Conclusions
In this study, a three-dimensional numerical model is established and validated to investigate basement–tunnel interaction. Then, the influences of basement geometry and tunnel location relative to the basement on the vertical deformation of the tunnel are studied. The following conclusions can be drawn:
- (1)
- The vertical deformation of the tunnel is greatly affected by the basement length, the basement width, the excavation depth, the tunnel cover depth, and the distance between the tunnel axis and the basement center, but is little affected by the tunnel diameter. When the ratio of basement length or width to tunnel cover depth is less than 3, the maximum vertical deformation of the tunnel increases rapidly with increasing basement length or width.
- (2)
- The vertical deformation of the tunnel increases linearly with the unloading ratio, which describes the degree of excavation depth above the tunnel. But there exists a critical unloading ratio of 0.6, beyond which the vertical deformation of the tunnel increases significantly. On this basis, an empirical model is proposed to predict the vertical deformation of the tunnel considering the unloading ratio.
- (3)
- The vertical deformation decreases with an increasing offset ratio, which describes the degree of tunnel offset from the basement center. But there exists a critical offset ratio of 0.4, below which the maximum vertical deformation of the tunnel decreases slightly. The maximum reduction in deformation is about 30%.
Based on the empirical models proposed in this study, the vertical deformation of the existing tunnel induced by overlying basement excavation in sand can be estimated. However, it should be pointed out that these conclusions were drawn without considering similar cases in clay. Thus, subsequent research should be carried out to investigate basement–tunnel interaction in clay using coupled mechanical and hydraulic modeling.
Author Contributions
Conceptualization, J.L.; methodology, J.L. and W.M.; software, X.H.; validation, J.L., K.L. and W.M.; formal analysis, J.L., X.H. and W.M.; investigation, X.H.; resources, J.L. and W.M.; data curation, X.H.; writing—original draft preparation, J.L. and X.H.; writing—review and editing, K.L. and Y.D.; visualization, X.H., K.L. and W.M.; supervision, J.L.; project administration, J.L., K.L. and W.M.; funding acquisition, J.L. and K.L. All authors have read and agreed to the published version of the manuscript.
Funding
This research was funded by the University Natural Science Research Project of Anhui Province (Nos. 2022AH030035, 2022AH020029, and KJ2021ZD0066), the National Natural Science Foundation of China (Nos. 51608005 and 12172001), and the Anhui Provincial Natural Science Foundation (Nos. 2208085Y01 and 2008085QA23).
Institutional Review Board Statement
Not applicable.
Informed Consent Statement
Not applicable.
Data Availability Statement
The data used to support the findings of this study are available from the corresponding author upon request.
Conflicts of Interest
The authors declare no conflict of interest.
References
- Wang, Z.W.; Ng, C.W.W.; Liu, G.B. Characteristics of wall deflections and ground surface settlements in Shanghai. Can. Geotech. J. 2005, 42, 1243–1254. [Google Scholar] [CrossRef]
- Zhang, J.F.; Chen, J.J.; Wang, J.H.; Zhu, Y.F. Prediction of tunnel displacement induced by adjacent excavation in soft soil. Tunn. Undergr. Space Technol. 2013, 36, 24–33. [Google Scholar] [CrossRef]
- Chen, R.P.; Meng, F.Y.; Li, Z.C.; Ye, Y.H.; Ye, J.N. Investigation of response of metro tunnels due to adjacent large excavation and protective measures in soft soils. Tunn. Undergr. Space Technol. 2016, 58, 224–235. [Google Scholar] [CrossRef]
- Chang, C.-T.; Sun, C.-W.; Duann, S.W.; Hwang, R.N. Response of a Taipei Rapid Transit System (TRTS) tunnel to adjacent excavation. Tunn. Undergr. Space Technol. 2001, 16, 151–158. [Google Scholar] [CrossRef]
- Chai, J.C.; Shen, S.L.; Ding, W.Q.; Zhu, H.H.; Carter, J. Numerical investigation of the failure of a building in Shanghai, China. Comput. Geotech. 2014, 55, 482–493. [Google Scholar] [CrossRef]
- Li, M.G.; Xiao, X.; Wang, J.H.; Chen, J.J. Numerical study on responses of an existing metro line to staged deep excavations. Tunn. Undergr. Space Technol. 2019, 85, 268–281. [Google Scholar] [CrossRef]
- Liu, B.; Shao, C.M.; Wang, N.N.; Zhang, D.W. Influenced Zone of Deep Excavation and a Simplified Prediction Method for Adjacent Tunnel Displacement in Thick Soft Soil. Appl. Sci. 2023, 13, 4647. [Google Scholar] [CrossRef]
- Hu, Z.F.; Yue, Z.Q.; Zhou, J.; Tham, L.G. Design and construction of a deep excavation in soft soils adjacent to the Shanghai Metro tunnels. Can. Geotech. J. 2003, 40, 933–948. [Google Scholar] [CrossRef]
- Lo, K.Y.; Ramsay, J.A. The effect of construction on existing subway tunnels—A case study from Toronto. Tunn. Undergr. Space Technol. 1991, 6, 287–297. [Google Scholar] [CrossRef]
- Sharma, J.S.; Hefny, A.M.; Zhao, J.; Chan, C.W. Effect of large excavation on deformation of adjacent MRT tunnels. Tunn. Undergr. Space Technol. 2001, 16, 93–98. [Google Scholar] [CrossRef]
- Ayasrah, M.; Qiu, H.S.; Zhang, X.D. Influence of Cairo Metro Tunnel Excavation on Pile Deep Foundation of the Adjacent Underground Structures: Numerical Study. Symmetry 2021, 13, 426. [Google Scholar] [CrossRef]
- Burford, D. No AccessHeave of tunnels beneath the Shell Centre, London, 1959–1986. Géotechnique 1988, 38, 135–137. [Google Scholar] [CrossRef]
- Bahri, M.; Mascort-Albea, E.J.; Romero-Hernandez, R.; Koopialipoor, M.; Soriano-Cuesta, C.; Jaramillo-Morilla, A. Numerical Model Validation for Detection of Surface Displacements over Twin Tunnels from Metro Line 1 in the Historical Area of Seville (Spain). Symmetry 2022, 14, 1263. [Google Scholar] [CrossRef]
- Simpson, B.; Vardanega, P.J. Results of monitoring at the British Library excavation. Proc. Inst. Civ. Eng.-Geotech. Eng. 2014, 167, 99–116. [Google Scholar] [CrossRef]
- Ng, C.W.W.; Shi, J.W.; Hong, Y. Three-dimensional centrifuge modelling of basement excavation effects on an existing tunnel in dry sand. Can. Geotech. J. 2013, 50, 874–888. [Google Scholar] [CrossRef]
- Ng, C.W.W.; Shi, J.W.; Masin, D.; Sun, H.S.; Lei, G.H. Influence of sand density and retaining wall stiffness on three-dimensional responses of tunnel to basement excavation. Can. Geotech. J. 2015, 52, 1811–1829. [Google Scholar] [CrossRef]
- Doležalová, M. Tunnel complex unloaded by a deep excavation. Comput. Geotech. 2001, 28, 469–493. [Google Scholar] [CrossRef]
- Liao, S.M.; Wei, S.F.; Shen, S.L. Structural Responses of Existing Metro Stations to Adjacent Deep Excavations in Suzhou, China. J. Perform. Constr. Facil. 2016, 30, 11. [Google Scholar] [CrossRef]
- Liu, H.L.; Li, P.; Liu, J.Y. Numerical investigation of underlying tunnel heave during a new tunnel construction. Tunn. Undergr. Space Technol. 2011, 26, 276–283. [Google Scholar] [CrossRef]
- Chen, J.J.; Zhu, Y.F.; Li, M.G.; Wen, S.L. Novel Excavation and Construction Method of an Underground Highway Tunnel above Operating Metro Tunnels. J. Aerosp. Eng. 2015, 28, 7. [Google Scholar] [CrossRef]
- Li, M.G.; Chen, J.J.; Wang, J.H.; Zhu, Y.F. Comparative study of construction methods for deep excavations above shield tunnels. Tunn. Undergr. Space Technol. 2018, 71, 329–339. [Google Scholar] [CrossRef]
- Zhou, Z.L.; Zhou, Y.L.; Zhang, H.; Chen, S.G.; Xiang, L.; Wang, L. Effects of Foundation Excavation on Metro Tunnels at Different Locations and Performance of Corresponding Reinforcement Measures: A Case of Shenzhen Metro Line 11, China. Symmetry 2022, 14, 2561. [Google Scholar] [CrossRef]
- Huang, X.; Schweiger, H.F.; Huang, H.W. Influence of Deep Excavations on Nearby Existing Tunnels. Int. J. Geomech. 2013, 13, 170–180. [Google Scholar] [CrossRef]
- Yang, T.; Tong, L.Y.; Pan, H.S.; Wang, Z.S.; Chen, X.M.; Li, H.J. Effect of Excavation Sequence on Uplift Deformation of Underlying Existing Metro Tunnel. J. Perform. Constr. Facil. 2021, 35, 13. [Google Scholar] [CrossRef]
- Zheng, G.; Wei, S.W. Numerical analyses of influence of overlying pit excavation on existing tunnels. J. Cent. South Univ. Technol. 2008, 15, 69–75. [Google Scholar] [CrossRef]
- Lin, H.; Chen, J.Y.; Guo, C.; Liu, Q.Y. Numerical analysis on influence of foundation pit excavation on deformation of adjacent existing tunnel. J. Cent. South Univ. (Sci. Technol.) 2015, 46, 4240–4247. [Google Scholar]
- Liu, B.H.; Lin, H.; Chen, Y.F.; Liu, J.S.; Guo, C. Deformation Stability Response of Adjacent Subway Tunnels considering Excavation and Support of Foundation Pit. Lithosphere 2022, 2022, 9. [Google Scholar] [CrossRef]
- Zheng, G.; Du, Y.M.; Diao, Y.; Deng, X.; Zhu, G.P.; Zhang, L.M. Influenced zones for deformation of existing tunnels adjacent to excavations. Chin. J. Geotech. Eng. 2016, 38, 599–612. [Google Scholar]
- Fan, X.H.; Liu, B.; Wang, Y.Y.; Zhang, J.B.; Fan, Z.B.; Zhang, D.W. Influenced zones for deformation of underlying metro tunnels induced by braced deep excavation in soft strata. Chin. J. Geotech. Eng. 2021, 43, 217–220. [Google Scholar]
- Sun, H.S.; Wang, L.W.; Chen, S.W.; Deng, H.W.; Zhang, J.H. A Precise Prediction of Tunnel Deformation Caused by Circular Foundation Pit Excavation. Appl. Sci. 2019, 9, 2275. [Google Scholar] [CrossRef]
- Shi, J.W.; Fu, Z.Z.; Guo, W.L. Investigation of geometric effects on three-dimensional tunnel deformation mechanisms due to basement excavation. Comput. Geotech. 2019, 106, 108–116. [Google Scholar] [CrossRef]
- Shi, J.W.; Ng, C.W.W.; Chen, Y.H. Three-dimensional numerical parametric study of the influence of basement excavation on existing tunnel. Comput. Geotech. 2015, 63, 146–158. [Google Scholar] [CrossRef]
- Shi, J.W.; Ng, C.W.W.; Chen, Y.H. A simplified method to estimate three-dimensional tunnel responses to basement excavation. Tunn. Undergr. Space Technol. 2017, 62, 53–63. [Google Scholar] [CrossRef]
- Shi, J.W.; Zhang, X.; Chen, Y.H.; Chen, L. Numerical parametric study of countermeasures to alleviate basement excavation effects on an existing tunnel. Tunn. Undergr. Space Technol. 2018, 72, 145–153. [Google Scholar] [CrossRef]
- Zhao, X.; Li, Z.W.; Dai, G.L.; Wang, H.X.; Yin, Z.W.; Cao, S.N. Numerical Study on the Effect of Large Deep Foundation Excavation on Underlying Complex Intersecting Tunnels. Appl. Sci. 2022, 12, 4530. [Google Scholar] [CrossRef]
- Brinkgreve, R.B.J.; Kumarswamy, S.; Swolfs, W.M.; Foria, F. Material Model Manual; Plaxis BV: Delft, The Netherlands, 2018. [Google Scholar]
- Diao, H.G.; Wang, X.Q.; Wei, G.; Cui, Y.L.; Zhang, T.C. Analysis of prediction ability of hypoplastic model for soil-structure interaction problem. J. Nat. Disasters 2022, 31, 210–218. [Google Scholar]
Disclaimer/Publisher’s Note: The statements, opinions and data contained in all publications are solely those of the individual author(s) and contributor(s) and not of MDPI and/or the editor(s). MDPI and/or the editor(s) disclaim responsibility for any injury to people or property resulting from any ideas, methods, instructions or products referred to in the content. |
© 2023 by the authors. Licensee MDPI, Basel, Switzerland. This article is an open access article distributed under the terms and conditions of the Creative Commons Attribution (CC BY) license (https://creativecommons.org/licenses/by/4.0/).