Article

Performance Analysis of Multiple Steel Corrugated Pipe Arch Culvert under Construction and Periodic Vehicle Load

Key Laboratory for Resilient Infrastructures of Coastal Cities, MOE, College of Civil and Transportation Engineering, Shenzhen University, Shenzhen 518060, China
*
Author to whom correspondence should be addressed.
Appl. Sci. 2023, 13(16), 9441; https://doi.org/10.3390/app13169441
Submission received: 3 August 2023 / Revised: 13 August 2023 / Accepted: 14 August 2023 / Published: 21 August 2023

Abstract

:
The arrangement of multiple culverts has gradually increased in road engineering. However, the arrangement will face a series of risks in both the construction and operation stages. A numerical model was established to analyze the construction and operation safety of multiple steel corrugated pipe arch culverts by using a fully fluid–solid coupling two-dimensional (2D) model of a highway project. The sensitivity of factors affecting the settlement of the composite foundation such as modulus and depth of ground reinforcement was discussed. Based on the results of the 2D model, a fully fluid–solid coupling three-dimensional (3D) model was established to study the influence of dynamic cyclic vehicle load on the mechanical properties of multiple steel corrugated pipe arch culverts. The ground deformation, soil stress and pore pressure, structure stress, and deformation were analyzed. The results show that the maximum settlement of the soil in the arch culvert area is at the junction of the two different arch culverts after construction. The maximum vertical deformation of the structure appears at the vault, and the arch waist is prone to stress concentration. Under cyclic vehicle dynamic load, the ground deformation, structural stress, and arch culvert subgrade deformation showed a rapid growth stage, and then tended to be stable. The weak points in the structure during the construction and operation stages were revealed, which can provide a useful reference for the design and construction of multiple steel corrugated pipe arch culverts.

1. Introduction

As a flexible structure, steel corrugated pipe has many advantages, such as light weight, environmental protection, and rapid construction [1,2]. Therefore, steel corrugated pipe is widely used in bridges, viaducts, highways, and underground passages [3,4,5,6,7,8,9]. Culvert is a common type of hydraulic structure that is mainly used to promote drainage through road systems and other barriers. Although culvert is made of a variety of materials, the most common types are steel corrugated pipes and reinforced concrete pipes, the former accounting for about 80% of the market [10]. Steel corrugated pipe culvert is a typical underground flexible structure. Compared with the traditional concrete culvert, this structure has less interference with the foundation and can better adapt to deformation.
At the end of the 19th century, steel corrugated pipes began to be used in culverts in Europe and North America. Since then, many researchers have conducted a lot of research on the construction and performance of steel corrugated pipe culverts. Katona [11] carried out active load analysis of box culverts and arch culverts, and proposed a 2D analysis program for reducing surface load methods and load diffusion methods. Liu et al. [12] established a three-dimensional finite-element model to simulate the behavior of buried steel corrugated pipe culverts during construction, and studied the stress characteristics with different filling heights within a certain wavelength range. Sezen et al. [13] studied the performance of eight single-steel corrugated pipe culverts under static load and dynamic load. Tehrani et al. [14] carried out static loading tests on circular and arched steel corrugated pipe culverts, and the working performance of steel corrugated pipe culverts with different shapes was evaluated. Yeau et al. [15] conducted a three-dimensional numerical simulation and compared it with field measurement data to analyze the influence of backfill height, loading, size, shape, and other characteristics on culvert performance. Chaallal et al. [16] established a three-dimensional finite-element model to simulate the mechanical properties of buried flexible pipelines under vehicle loads, and conducted field tests to evaluate the accuracy of the numerical model. Then, extensive parametric studies were conducted to examine the effects of burial depth, backfill type, and compaction level on the buried pipe. In all the above studies, the research on steel corrugated pipe culverts mainly focused on the behavior of a single-steel corrugated pipe culvert. However, multiple culverts in practical engineering are often used. It is necessary to study the behavior of multiple culverts.
The behavior of multiple culverts in the construction and work stages has been studied by many scholars. Hwang et al. [17] studied the influence of multi-arch culvert spacing through dynamic finite-element analysis, and concluded that when the spacing between arch culverts is close, the increase in ground stress and volumetric strain is limited. Sawamura et al. [18] studied the influence of multi-arch culvert spacing and mechanical behavior under seismic conditions through numerical analysis. The results show that when the element spacing is narrow, the overall stiffness of the ground and arch culvert is relatively increased. Zhang et al. [19] studied the structural mechanical behavior and surrounding soil arching state of multi-culverts in the backfill process by combining field testing, finite-element analysis, and theoretical analysis. These studies show that the interaction between culverts cannot be ignored in the analysis of multiple culvert structures. In summary, the behavior of multi-culverts in construction and operation stage still needs further study.
In this study, two-dimensional and three-dimensional numerical models were established to analyze the behavior of multiple steel corrugated pipe arch culverts under construction and operation vehicle loads. The characteristics of foundation displacement, stress, pore water pressure, structural stress, and steel corrugated pipe arch culvert deformation under the construction stage were discussed. The sensitivity analysis of the influencing factors of foundation settlement was carried out. The ground deformation, internal force, and settlement of steel corrugated pipe under vehicle load were discussed. The analysis results are helpful to find out the weak points in the structure, which can provide a useful reference for the design and construction of multiple steel corrugated pipe arch culverts.

2. Project Background

The Tongji Road west extension project is located in Foshan City, a coastal city in China. The road is 1.54 km in length and was built using the standard construction technique for first-class highways and urban roads [20]. The primary road consists of six two-way lanes with a design speed of 60 km/h. The auxiliary road is composed of two-way four lanes, and the design speed is 40 km/h. An asphalt concrete pavement structure was used for the entire road. The upper and lower layers of the pavement structure were 19 cm thick modified asphalt concrete material and 51 cm thick cement-stabilized gravel material. The road section is 2 × 18.5 m (lane line) plus 2 × 5 m (sidewalk) and 2 m (central median), as shown in Figure 1. The steel corrugated pipe arch culvert below the road is used to connect the two sides of the lake that the road crosses. The design flood frequency is 1/300, and the design life is 100 years. This study focuses on the part of the road with culverts connecting lakes.

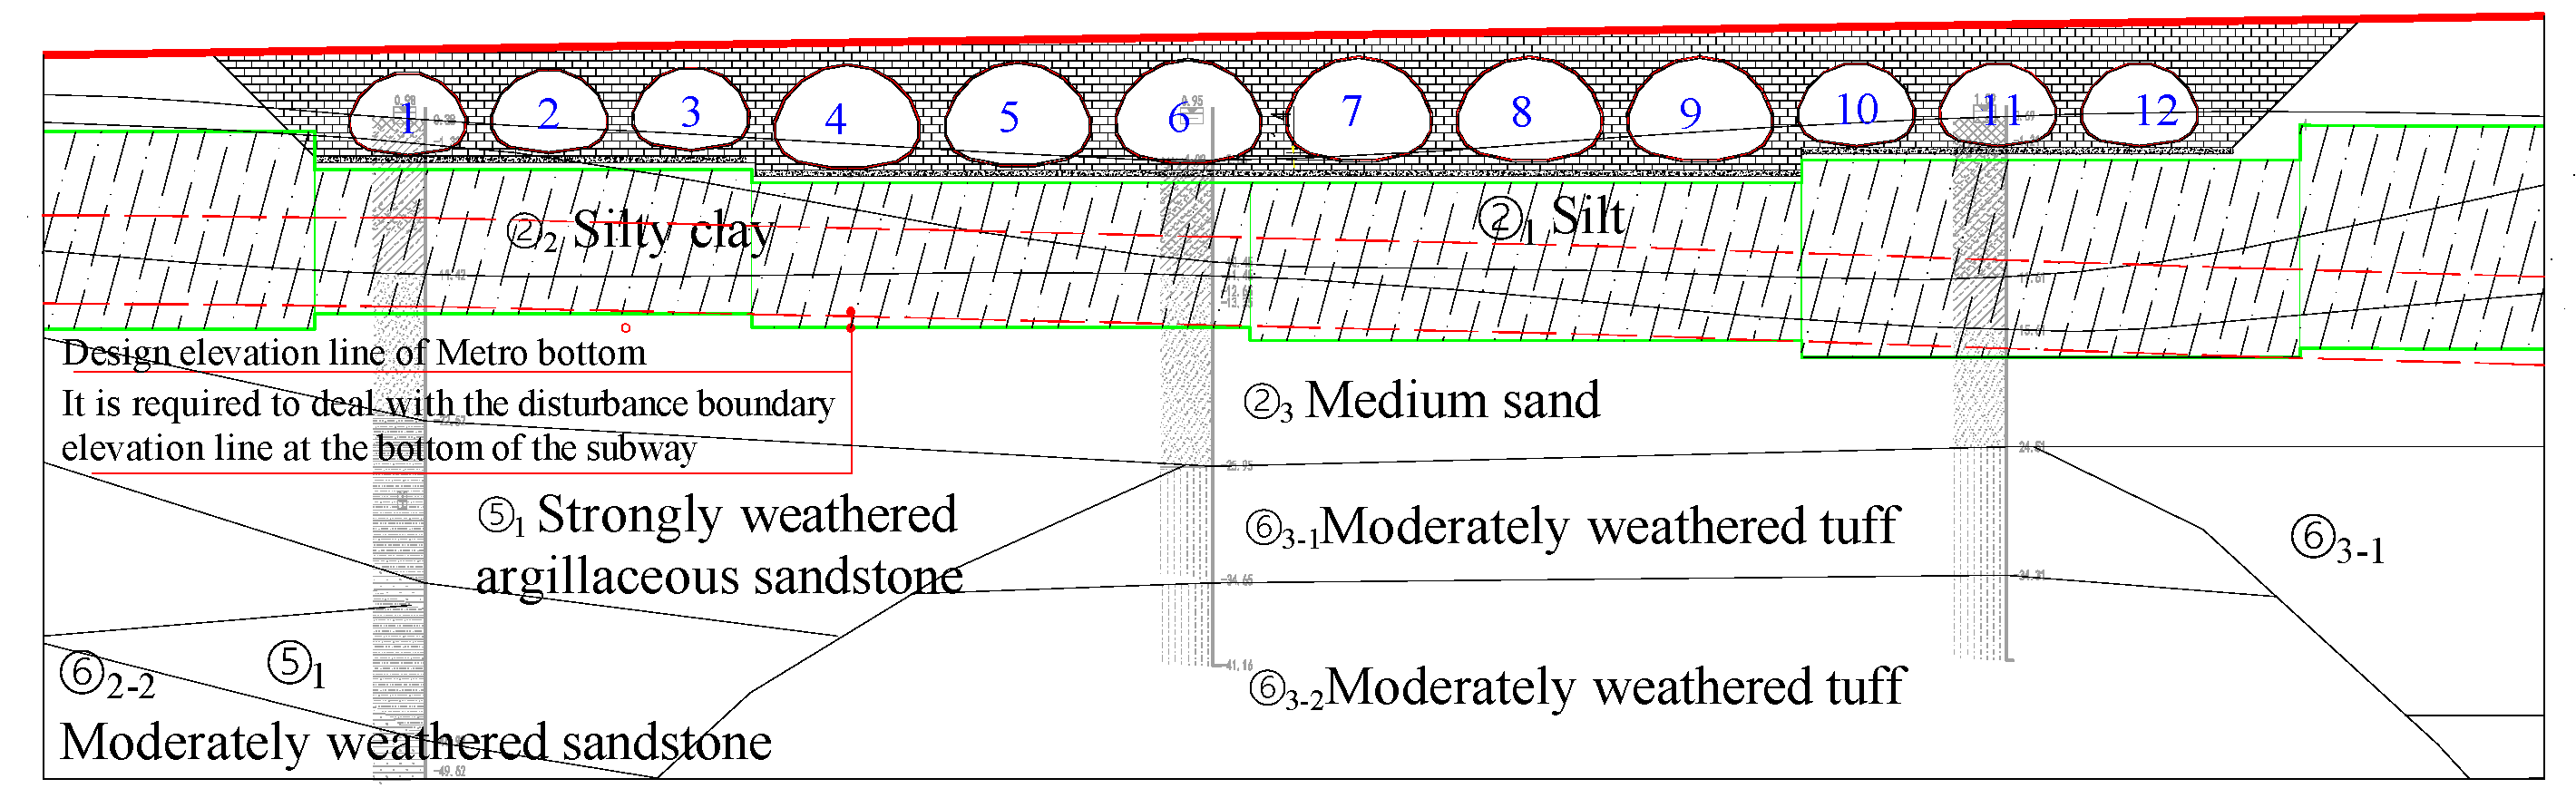
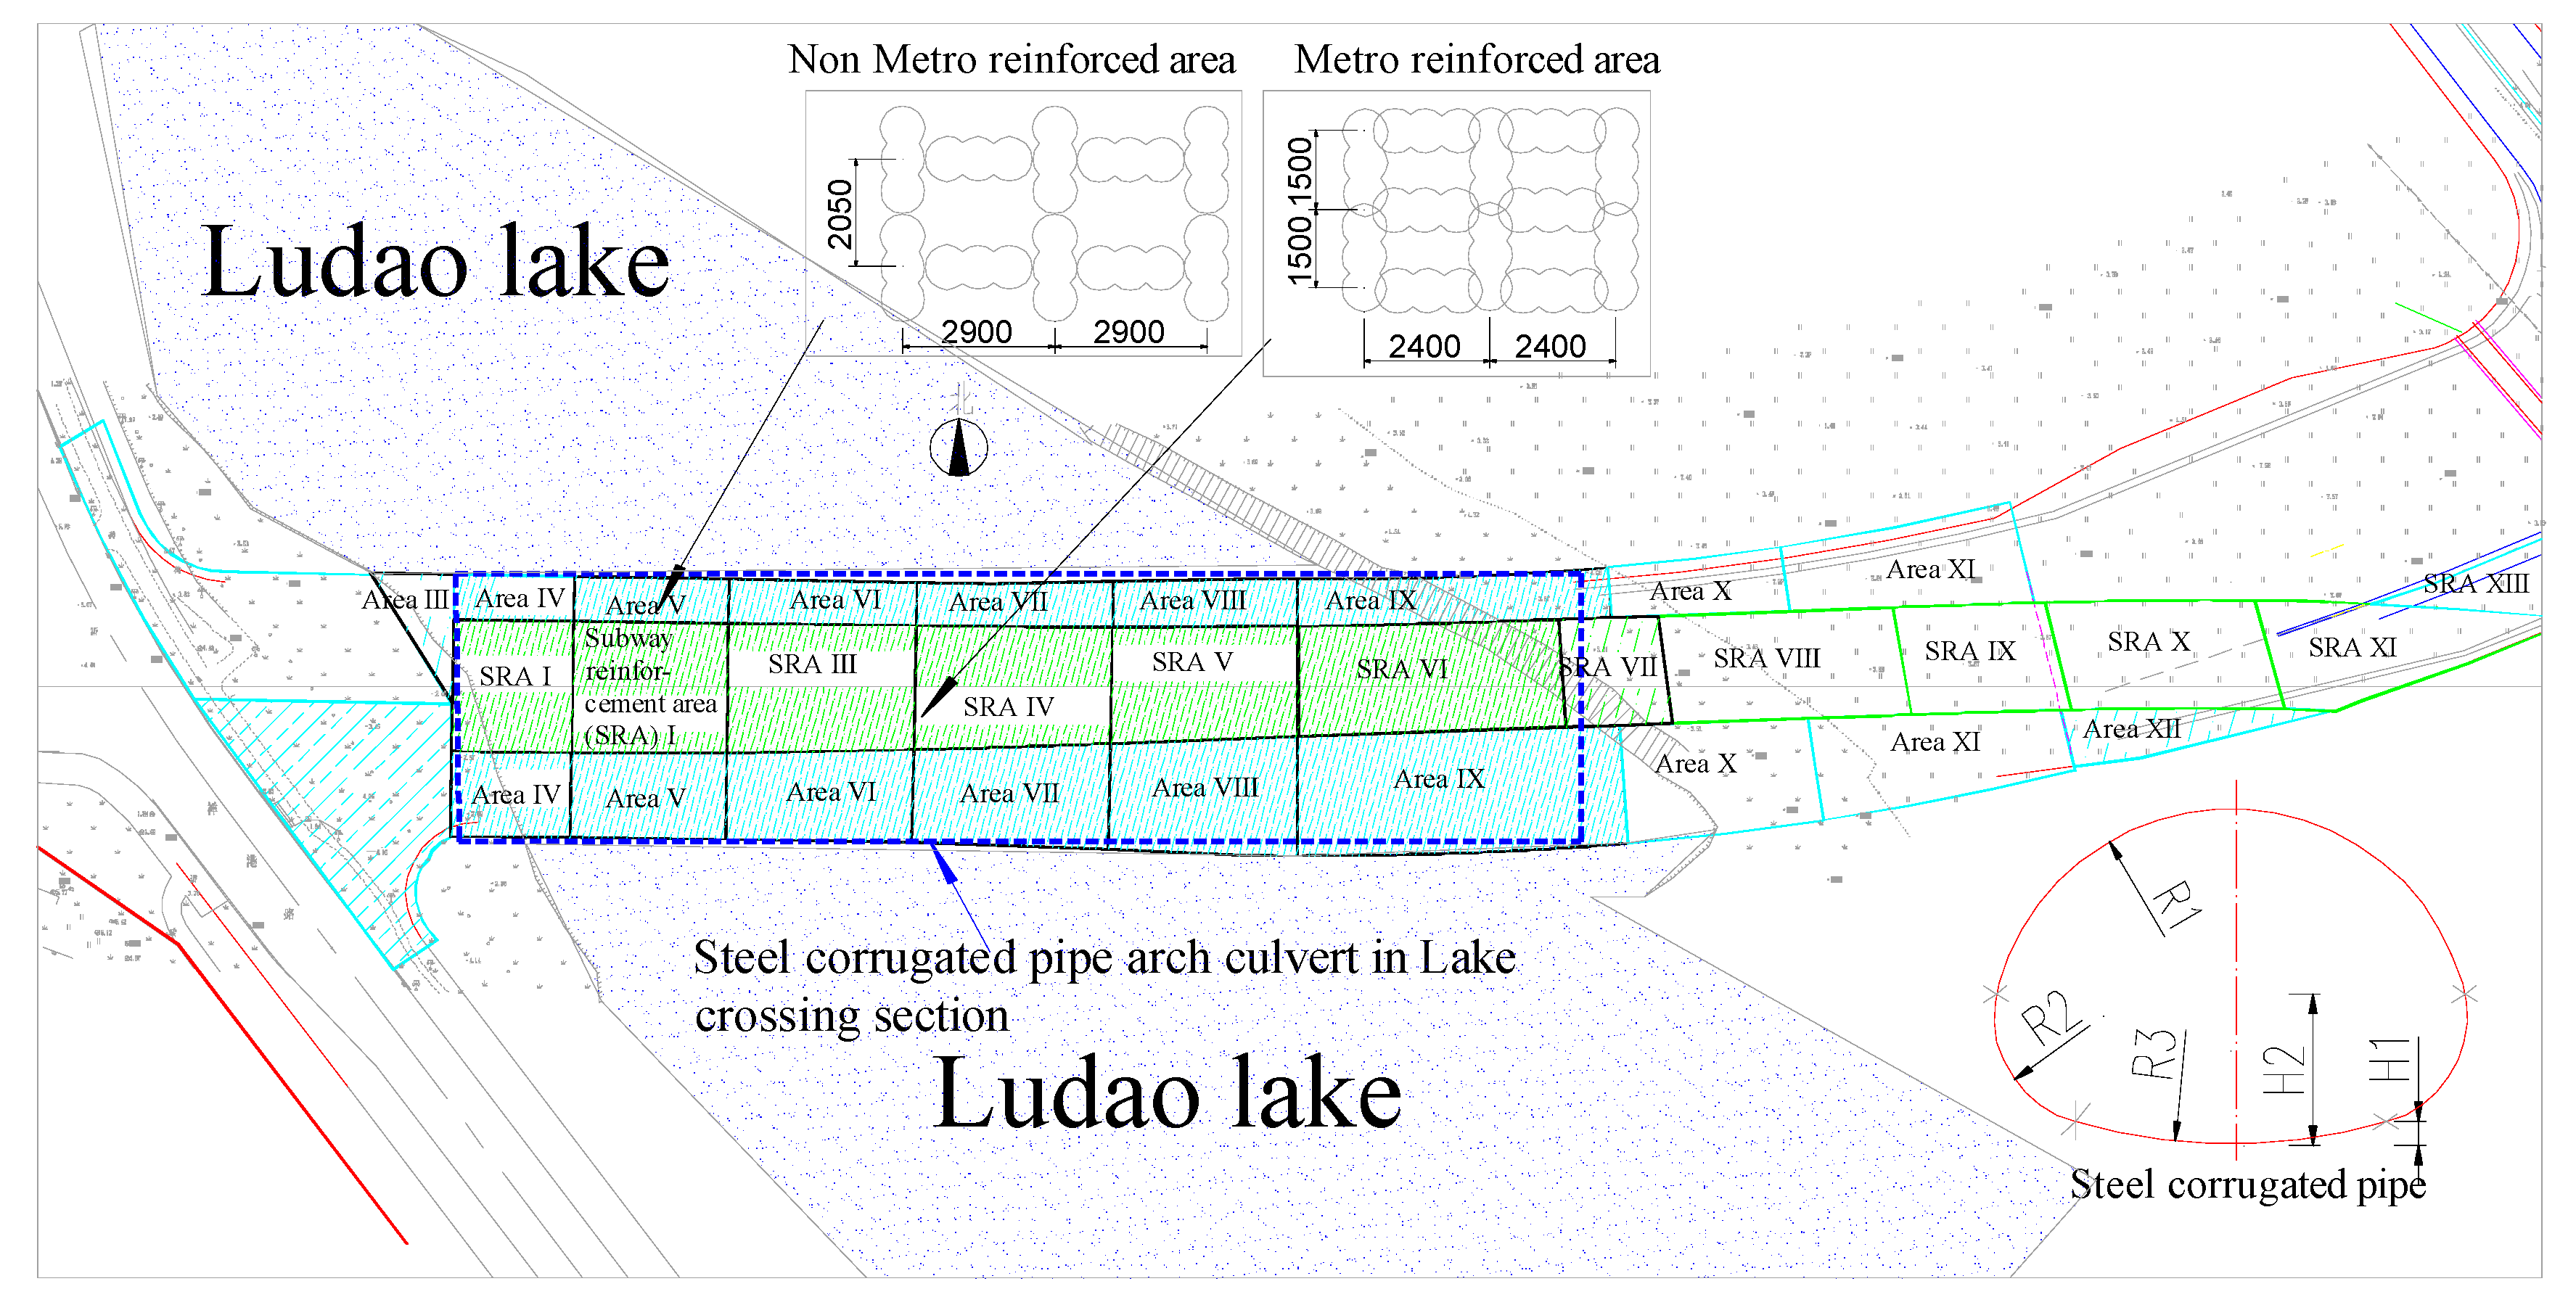
2.1. Culvert and Foundation

The road length is 140 m, and the width is 50 m. Figure 2 shows a diagram of the culvert and foundation sections. The culvert contains 12 holes from left to right. The road surface is low in the west and high in the east, with a slope of 2°. The waveform specification of steel corrugated pipe numbered 1–12 is 380 mm × 140 mm, the parameters and dimensions are listed in Table 1. The basic physical and mechanical parameters of the foundation are shown in Table 2, the foundation contains a large amount of easily deformed soil, which has the characteristics of the stratum in the coastal area. The foundation distribution in the figure does not consider the local small interlayer and the foundation with similar engineering properties are merged. The bottom of the lake is located on the muddy soil layer.

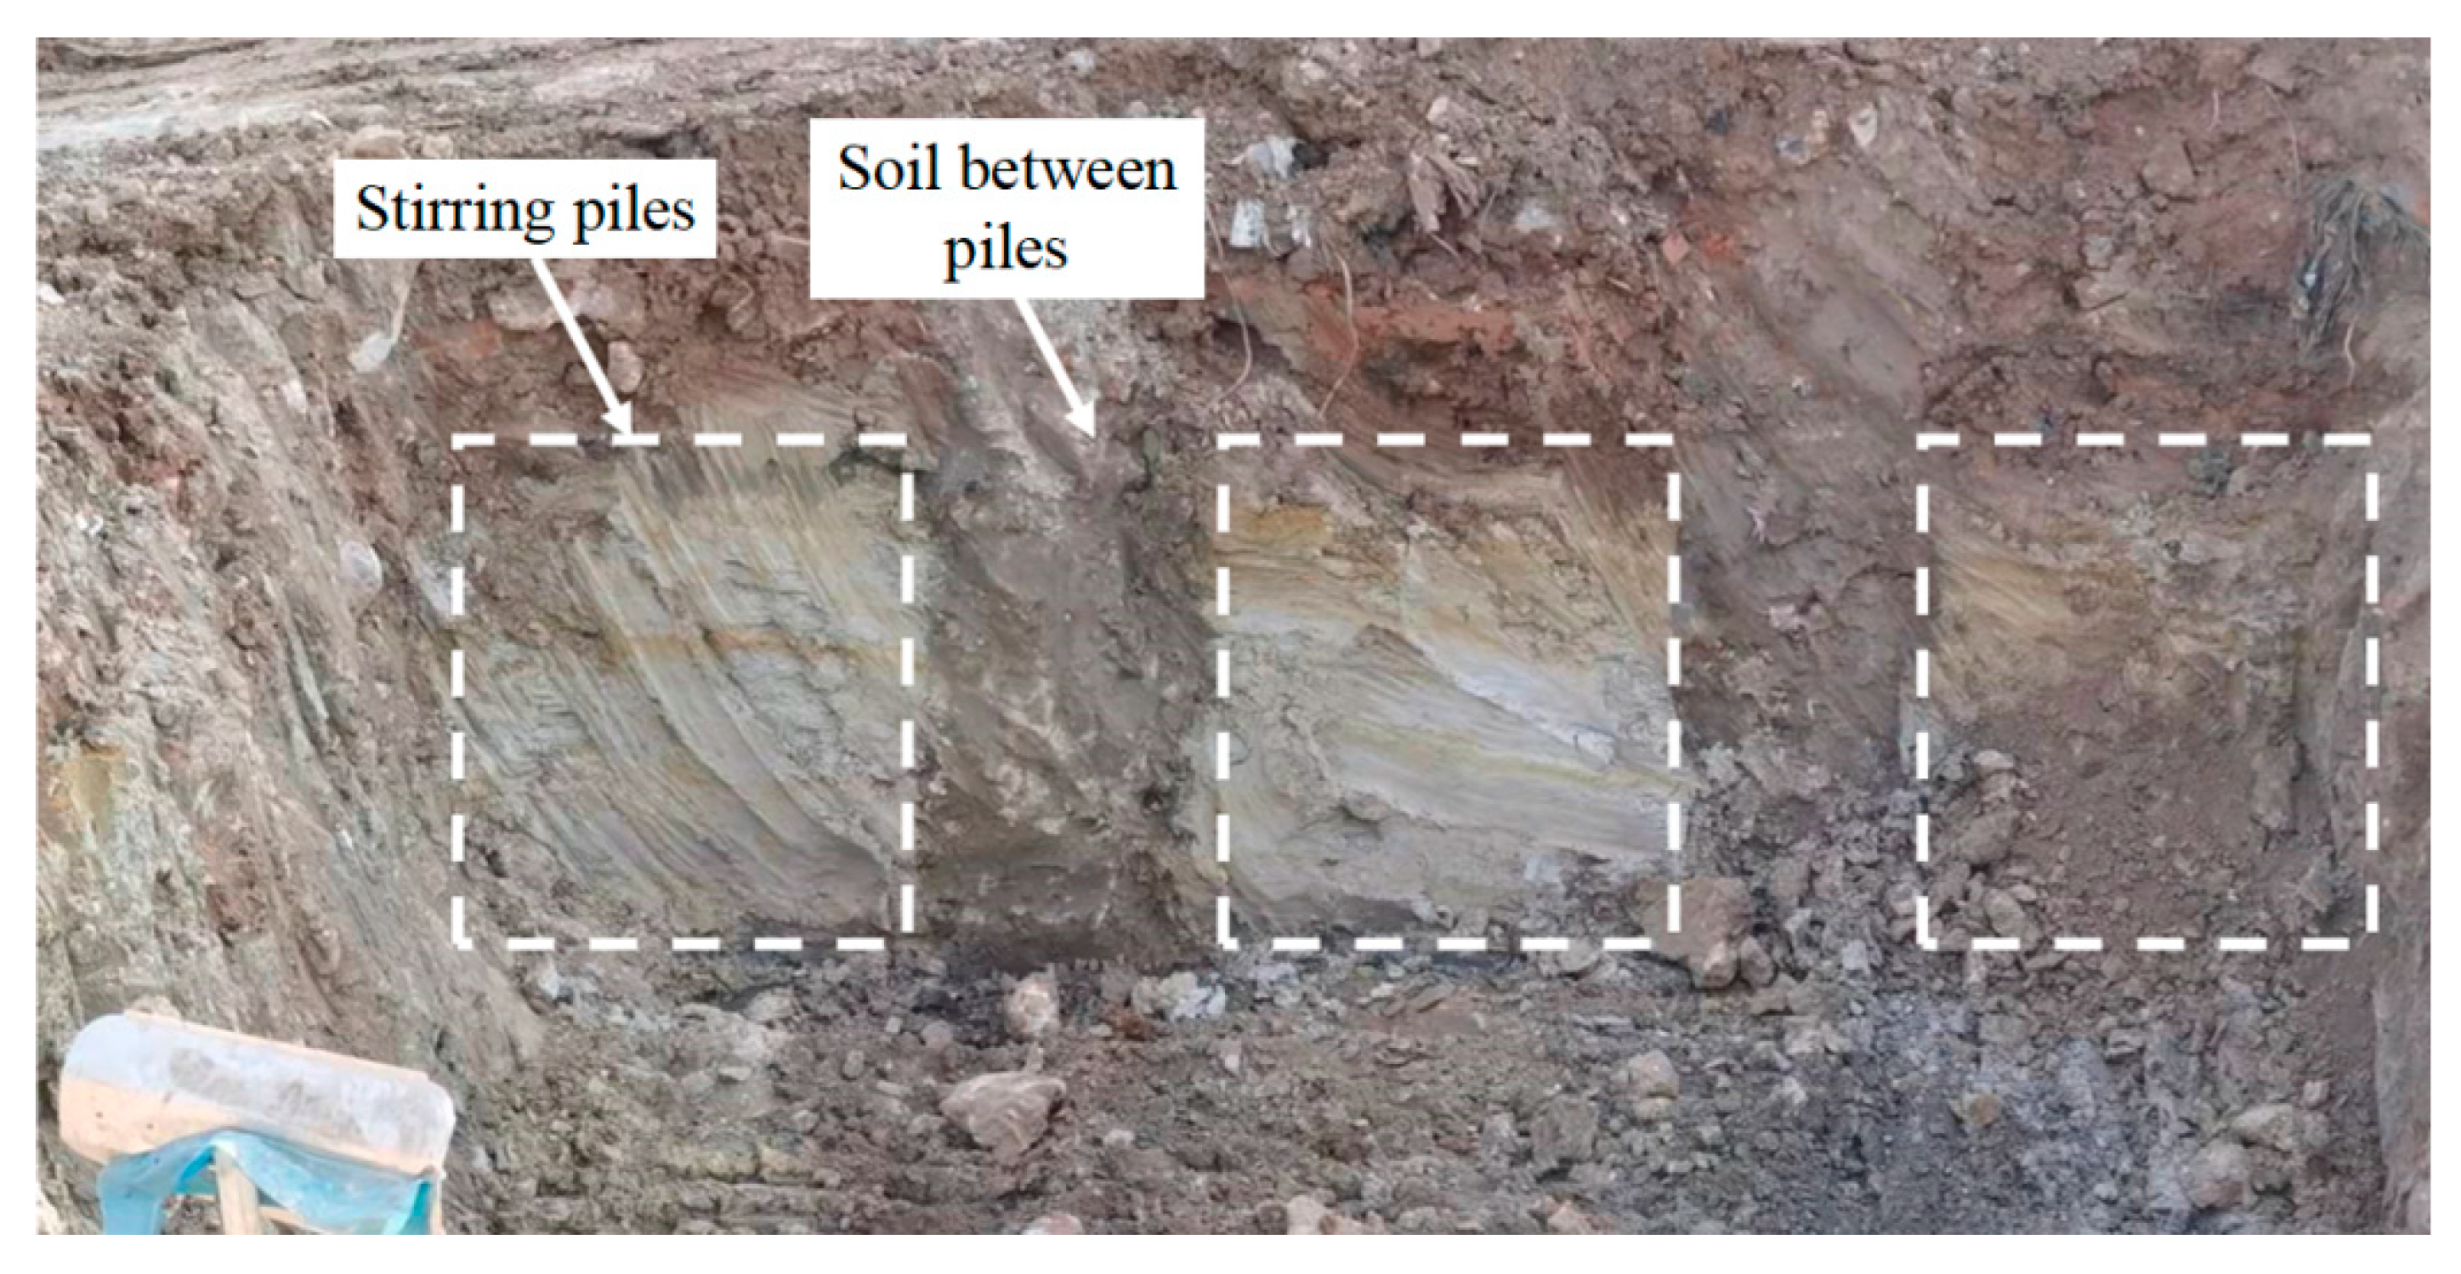
2.2. Foundation Treatment

Due to tunnel construction after the project, the soil in the culvert area needs to be reinforced. In the range of the foundation treatment, the ground is primarily composed of silty soil, silty clay, and a medium sand layer (Figure 2). A grid-type deep cement–soil triaxial mixing pile with a diameter of 850 mm was used to reinforce the culvert foundation. The reinforced area is divided into non-metro- and metro-reinforced areas. Figure 3 shows a schematic diagram of the foundation treatment plan across the lake section. The center distance of mixing piles in the non-metro- and metro-reinforced area is 1.5 m × 2.4 m and 2.05 m × 2.9 m, respectively. The replacement rates of metro-reinforced and non-metro-reinforced are 59% and 72%, respectively. The treatment depth is 3 m below the tunnel excavation limit. The strengthening effect of the site mixing pile is shown in Figure 4. Sampling drilling was performed on site for the reinforced foundation. The results of triaxial tests show that the bearing capacity of the metro-reinforced area and the non-metro-reinforced area is 450 kPa and 300 kPa, respectively.

3. Finite-Element Model

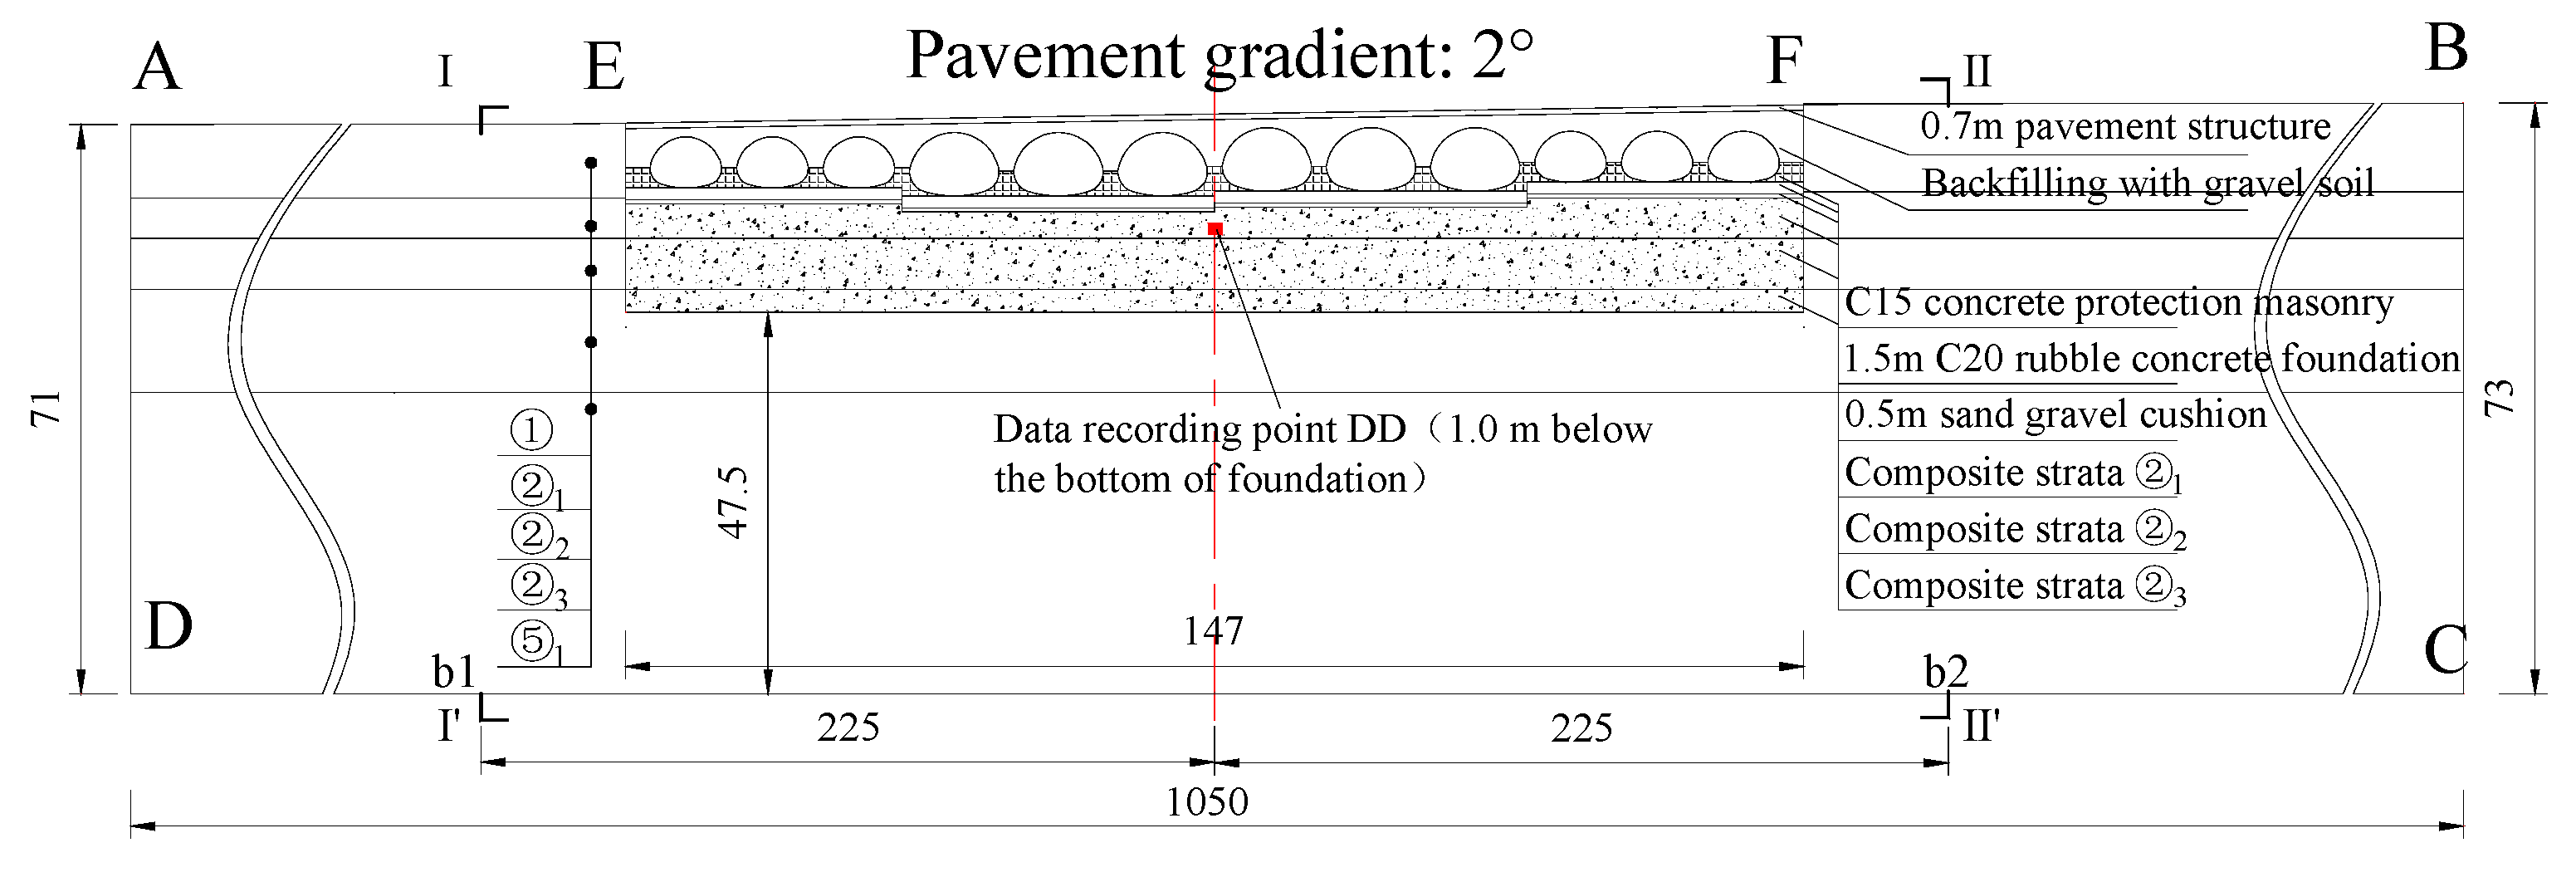
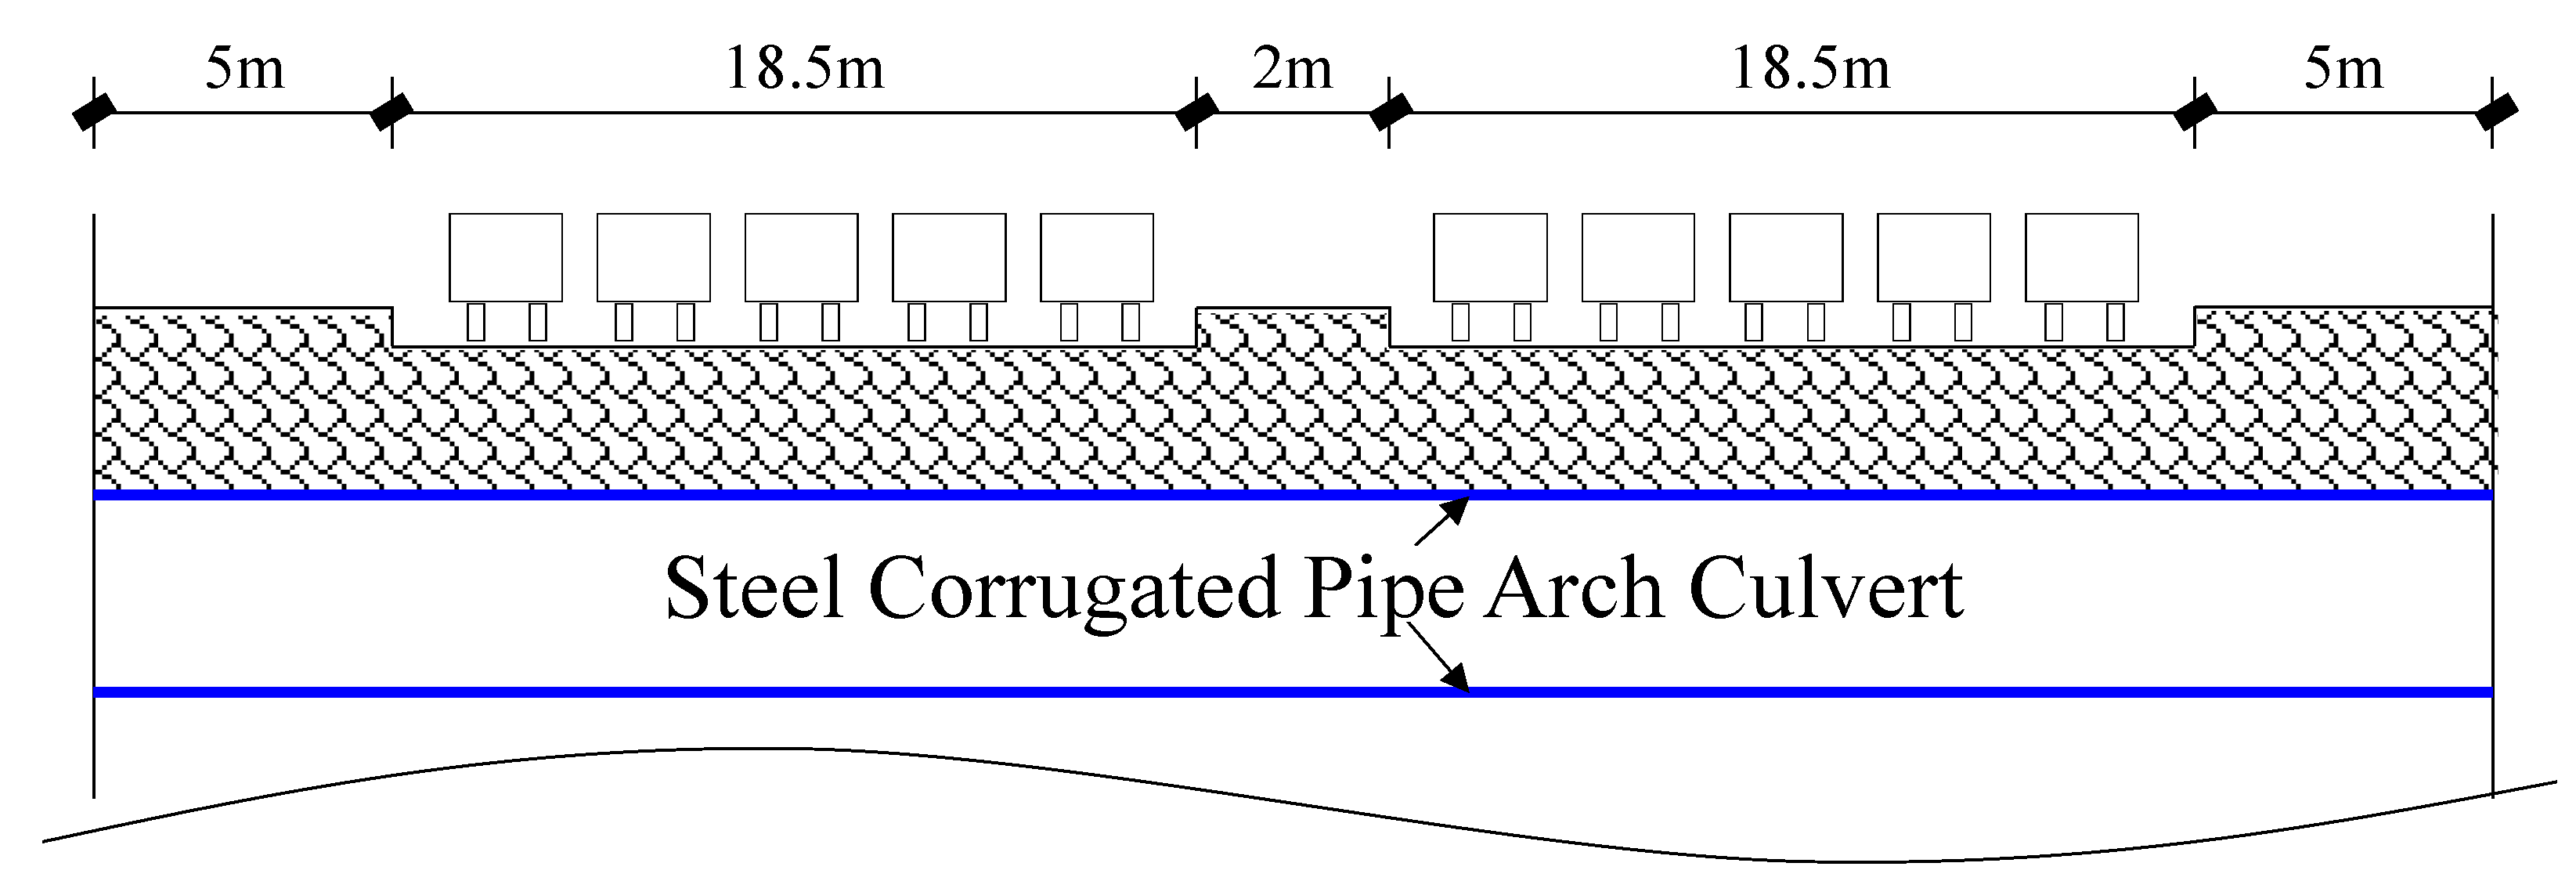
3.1. Two-Dimensional Model

As the project is located in an area with abundant groundwater, a complete fluid–solid coupling method was employed in the simulation. Owing to the existence of a soft soil layer and composite foundation with a low permeability coefficient, the following assumptions were made based on relevant studies before establishing the model [21,22]: (1) The foundation was considered to have a horizontal distribution, and an average thickness was used for the analysis. (2) The composite foundation was assumed to be isotropic, homogeneous materials. (3) Deformation was assumed to conform to the plane strain principle. (4) The effect of construction time was not taken into consideration. Based on the above assumptions, a two-dimensional finite-element model was established as illustrated in Figure 5. The unit thickness of soil was chosen based on measured data in the vertical direction. The average thicknesses of strata ①, ②1, ②2, ②3, and ⑤1 are 9.2–11 m, 5 m, 6.4 m, 12.8 m, and 37.5 m, respectively. Other details of the model are shown in Figure 5.
The Mohr–Coulomb constitutive model was used for both natural and reinforced strata. A linear structural element was employed to simulate the retaining structure of the foundation pit. The same contact model was set on both sides of the foundation pit. The steel corrugated pipe structure was simulated using the shell element without considering the contact between the structure and surrounding soil. A linear-elastic constitutive model was adopted for all the structural elements. The displacements of shell structural elements and the bottom boundary of the numerical model were constrained, and the top surface of the numerical model is the free boundary. After the initial pore pressure was established, the left and right sides of the model (AD and BC) were set as permeable boundaries, while the bottom was set as an impermeable boundary. The groundwater level was set at 3.0 m below the top surface of the model, and the pore water pressure at the free surface was zero.
For safety, unfavorable working conditions should be analyzed. Equivalent parameters obtained from the non-metro-reinforced area were selected to represent the value of the composite foundation. Firstly, the relationship between the deformation modulus and unconfined compressive strength value qu was investigated, and E50 = 175qu was selected according to the empirical formula [23,24,25]. Secondly, the natural foundation’s deformation modulus E0 was estimated using the approximate conversion formula E0 = Es[(1 − 2v2)/(1 − v)] when there is no field test data. Subsequently, the comprehensive deformation modulus was determined using the bidirectional weight coefficient method. The equivalent formula is expressed in Formulas (1) and (2), and the calculation results are listed in Table 3. Other parameters used in the simulation are listed in Table 4 and Table 5. In the simulation, the steel corrugated pipe was equivalent to a straight-wall structure of the same size. The calculation results are listed in Table 6.
E 0 c = i = 1 n α i E i / i = 1 n α i
E 0 m = j = 1 k h j E j / j = 1 k h j
where E0c is the comprehensive deformation modulus of the foundation-reinforced layer, Ei is the deformation modulus of the soil and foundation-reinforced materials, αi is the area weight coefficient or replacement rate of different materials, E0m is the comprehensive deformation modulus of the multilayer foundation, Ej is the deformation modulus of the soil in each layer, and Hj is the soil thickness.
The effect of the backfilling of the lake and foundation treatment was not considered in the numerical simulation. Once the foundation pit dewatering reached 1.0 m below the lowest excavation surface, the horizontal displacement of the foundation pit was restricted. The excavation was completed in a single step, and the stress field and pore pressure field after the excavation were preserved (as shown in Figure 6 and Figure 7), while the displacement field was cleared. Based on this, the simulation procedure of the arch culvert construction was carried out as follows:
(1)
The construction of a 0.5 m gravel cushion and 1.5 m C20 stone concrete foundation was completed in one step.
(2)
The installation of the steel corrugated pipe and C15 fine stone concrete protective masonry around the pipe was completed in one step.
(3)
The gravel soil around the pipe was backfilled in one step, and then the supporting structure of the foundation pit was removed.
(4)
The pavement structure was constructed in one step, and a 20 kPa load was applied to the pavement to simulate the action of construction machinery.

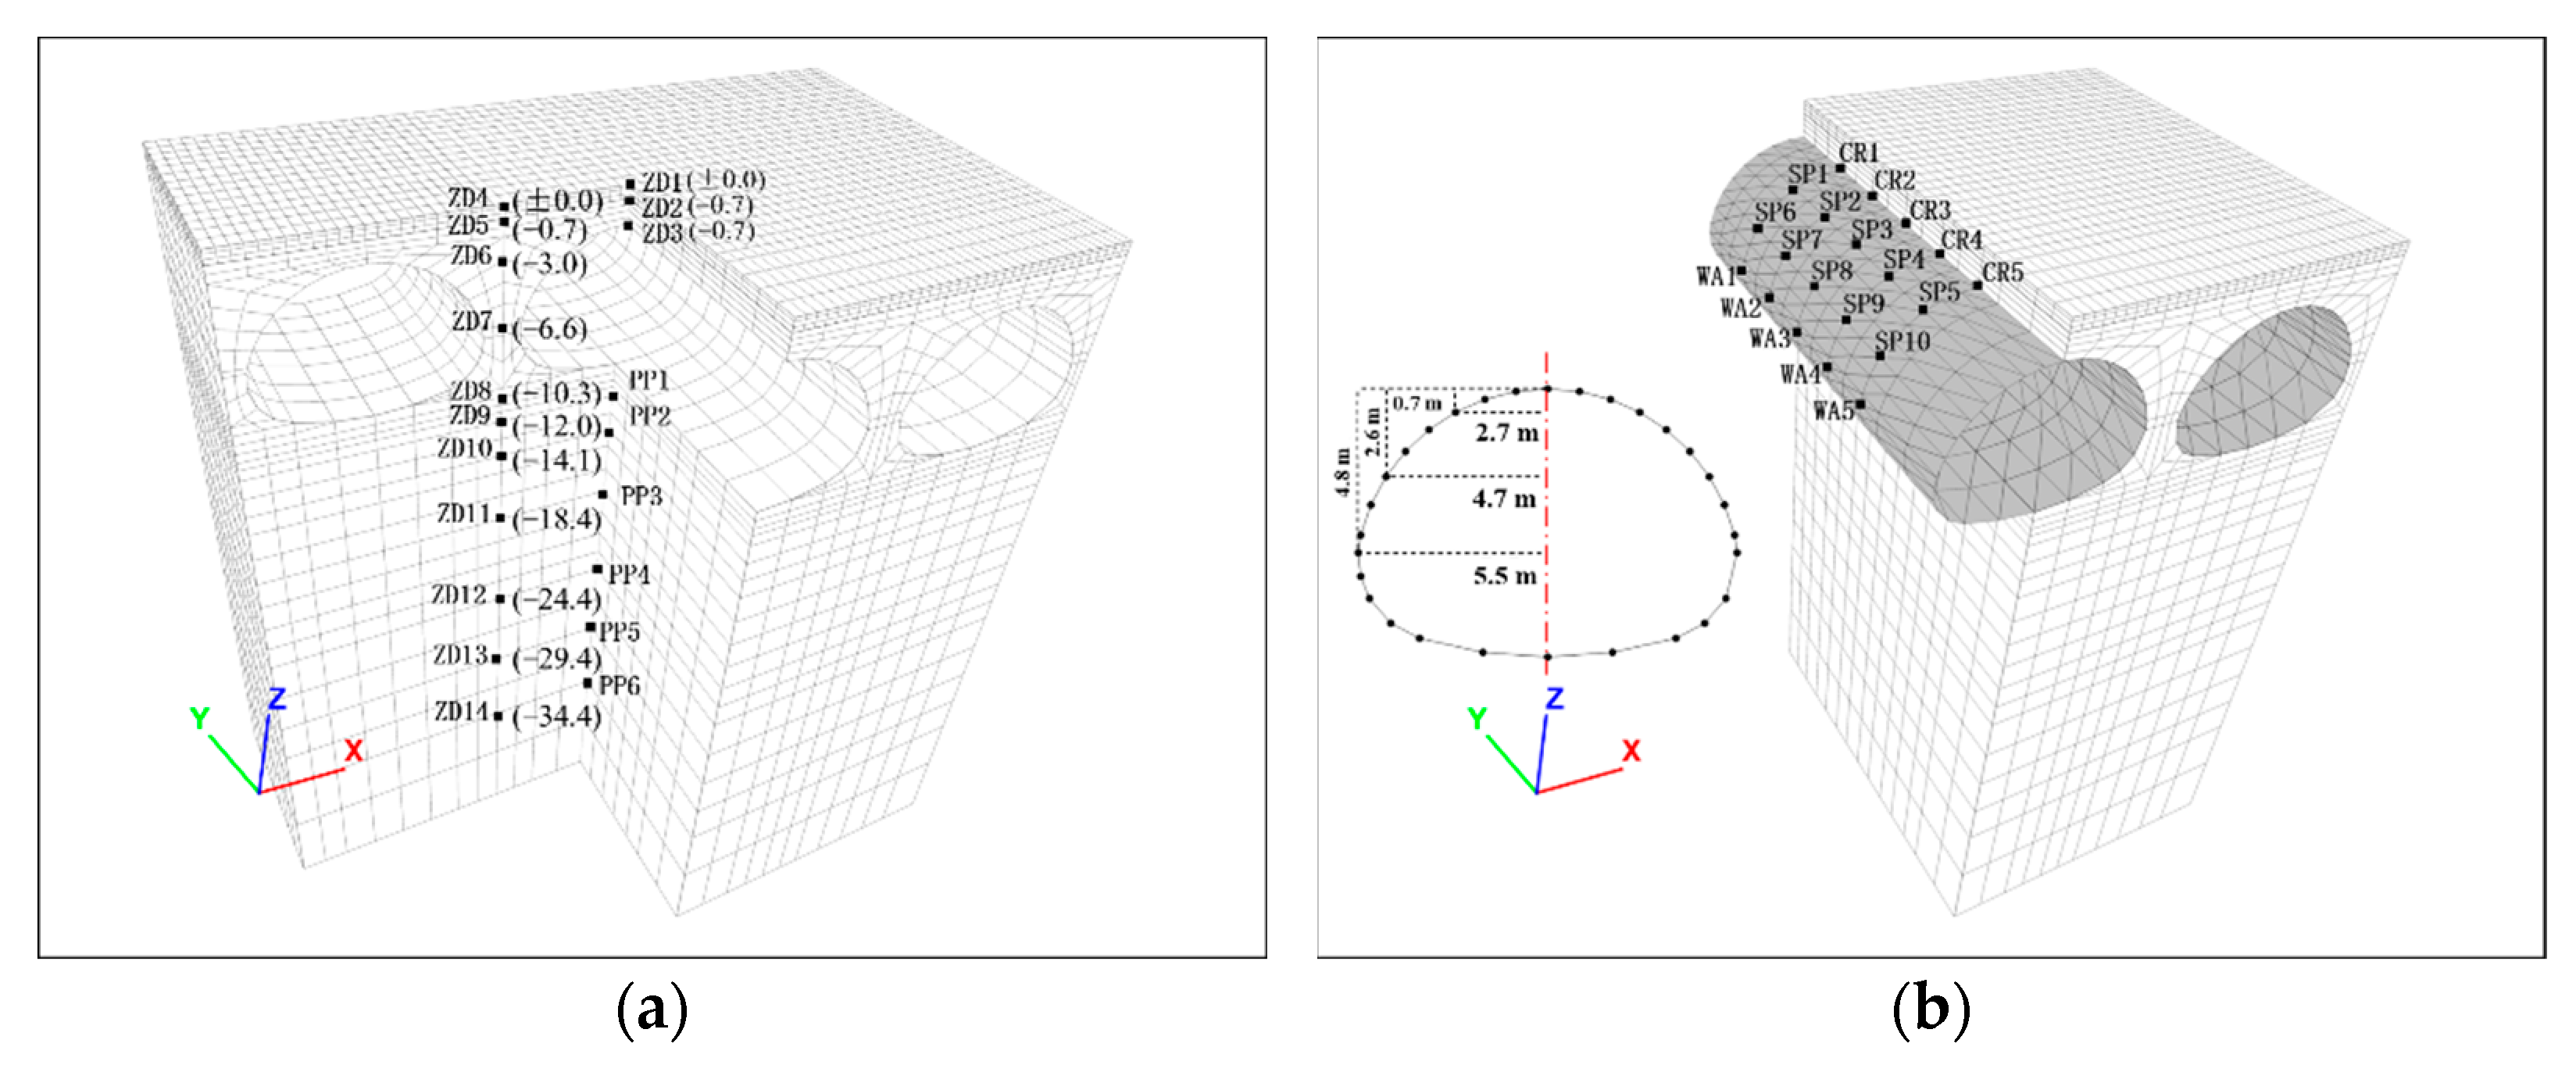
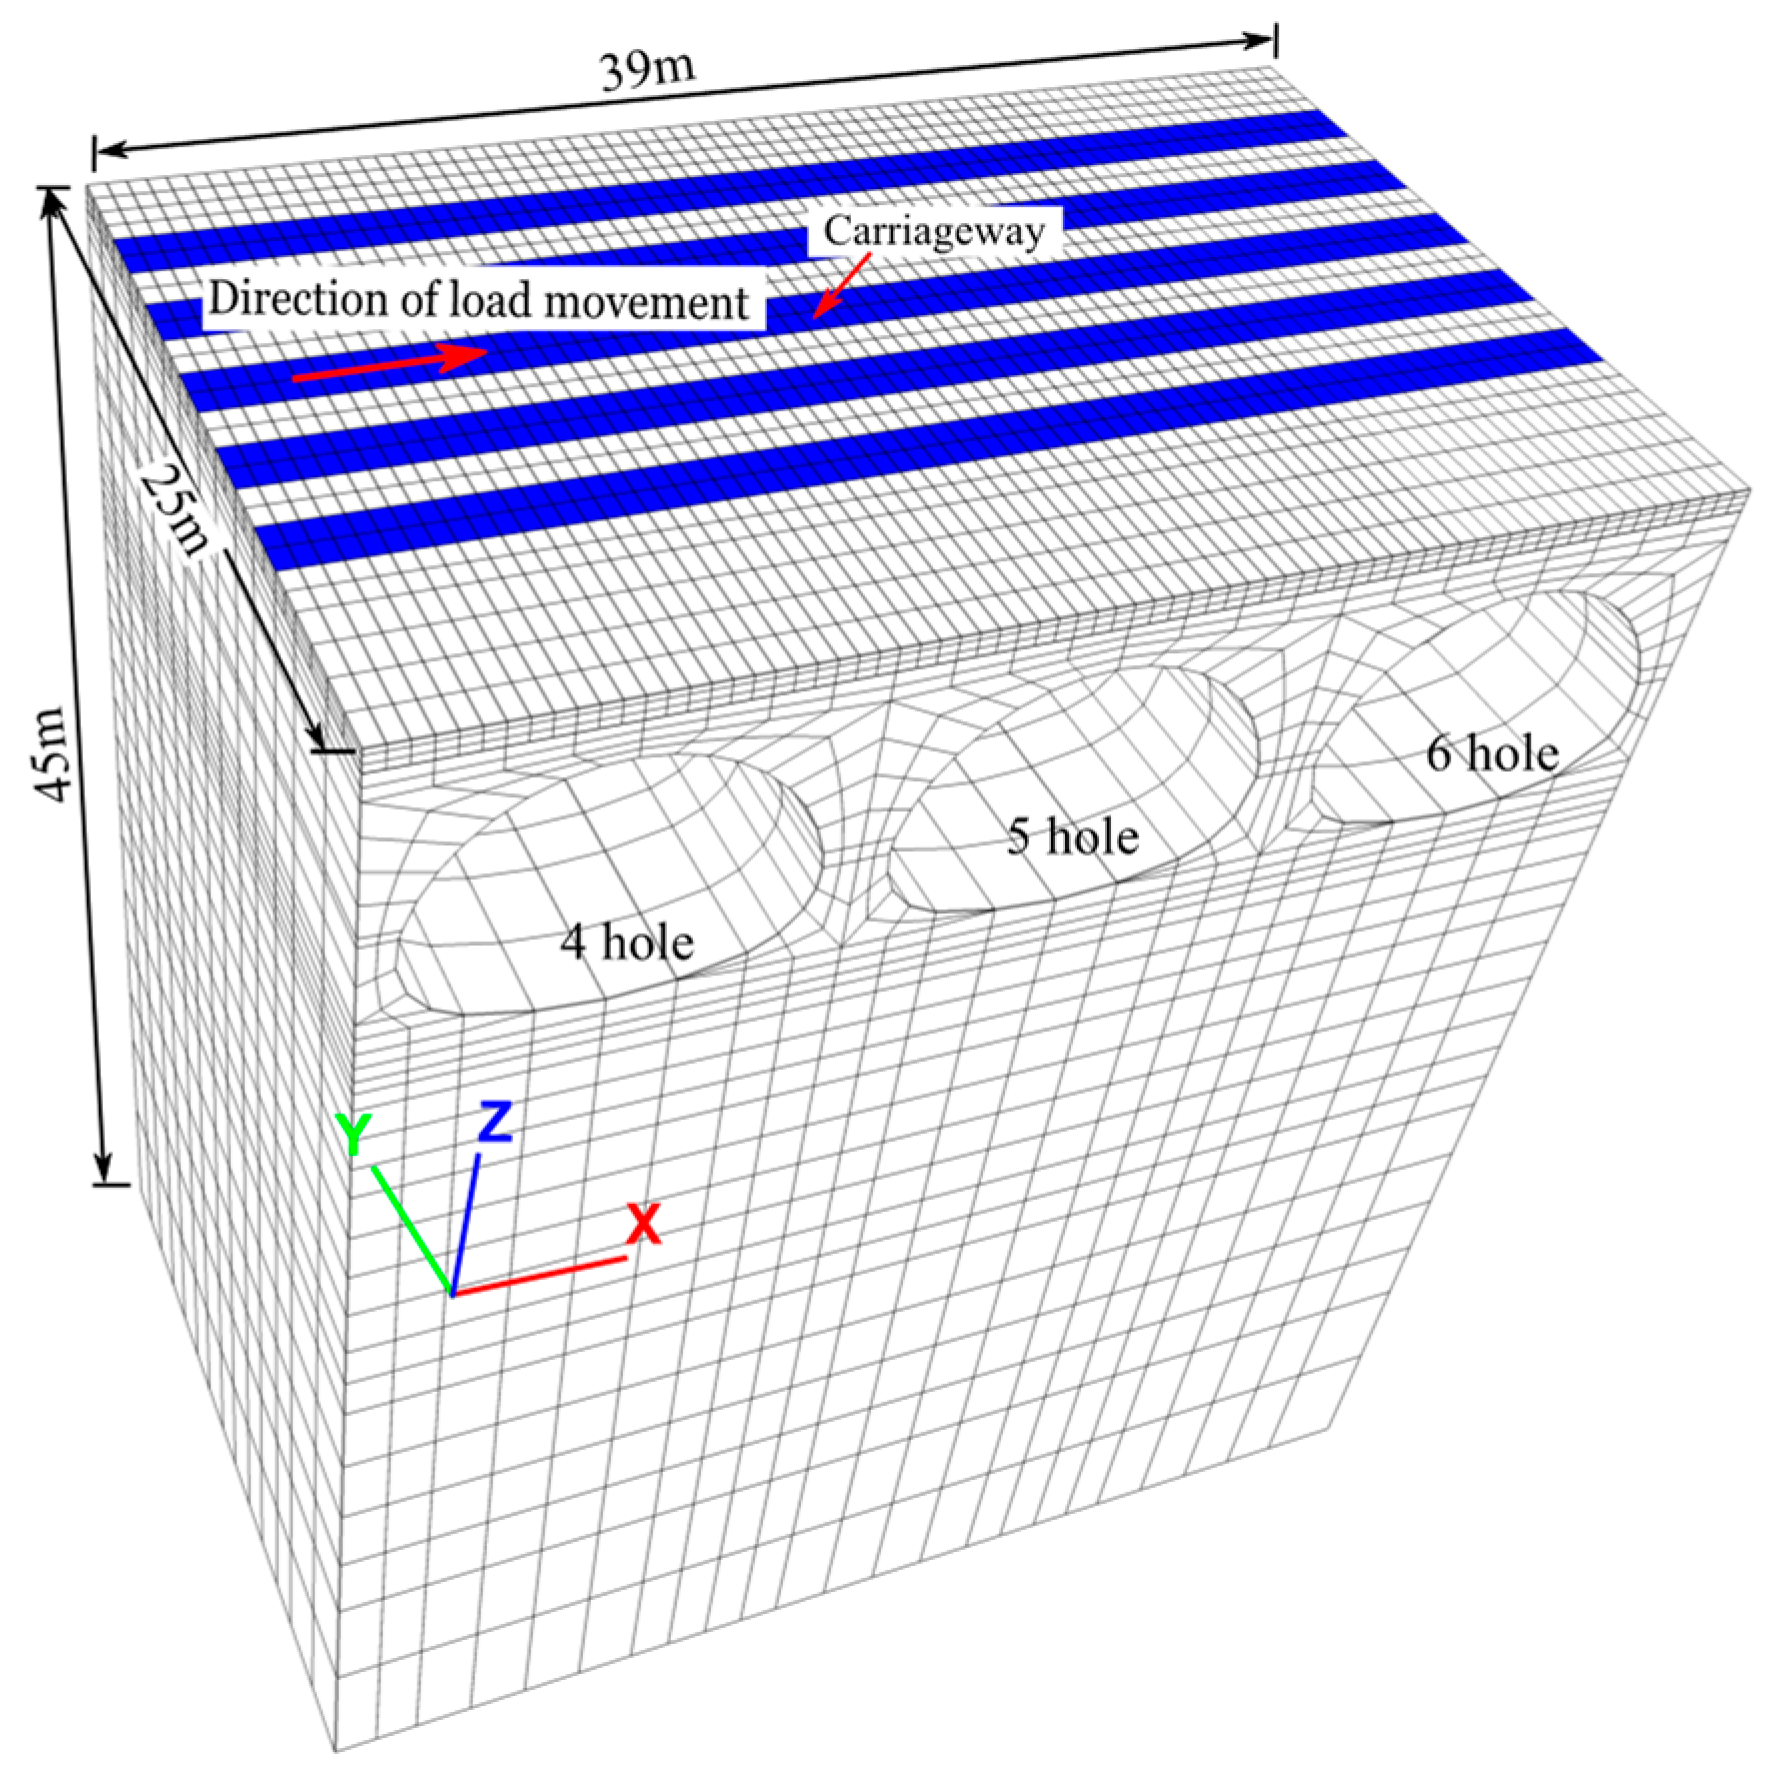
3.2. Three-Dimensional FE Model

The initial stress field, pore pressure field, and structural internal force of the 3D calculation model were generated using the initialization method. The final field and structural internal forces of the above plane model were considered as the initial states of the 3D calculation model. In dynamic analysis, both the numerical model and mesh size can affect the calculation speed and accuracy. Specifically, the representative holes 4–6 were considered along the driving direction, and the width of the model was 1/2 of the road width. The plane grid was expanded into a 3D shape along the road width, as shown in Figure 8. The road is not symmetrically arranged, the front is the sidewalk, and the rear is the concentration of the load. Kuhlmeyer and Lysmer [27] demonstrated that for accurate wave propagation, the mesh size must be less than 1/8–1/10 of the minimum wavelength λmin and equal to the formation shear wave velocity u divided by the maximum input wave frequency f. The vibration frequency measured under vehicle load is primarily concentrated in the range of 3–30 Hz. The maximum mesh size of the model is approximately in the range of 0.17–1.67 m when the shear wave velocity of the foundation is 50–100 m/s. The road surface area was refined by dividing the model grid. The 1.8 m wide carriageway was divided into two 0.9 m wide grids, and seventy-one 0.55 m wide grids were divided in the driving direction; the remaining grids were approximately 1.8 m wide. The displacement in the three directions at the bottom of the model was constrained, the four sides of the model were set as free-field boundaries, and vehicle loads that varied with time were applied in the carriageway. The range of the critical damping ratio (ξ) of geotechnical materials is typically 2–5%. In this study, a small damping ratio of 0.5% was used to satisfy the calculation requirements.
As shown in Figure 9, the design load of the road is a first-class highway, and the vehicle load was considered as on the 10-wheeled vehicle type. The ground area of the front and the rear wheel of the vehicle is 0.2 m × 0.3 m and 0.2 m × 0.6 m [20], respectively. According to the specifications, the oval wheel ground area in this study was treated as a rectangle. Only a single-row load of 140 kN by the rear wheel was considered.
The sinusoidal variation law was selected as the vehicle load model, which can reflect the vehicle load cycle and considers the influence of similar excitation forms with geometric irregularities, as shown in Formula (3). To facilitate the model in applying the vehicle load, the concentrated load F(t) should be equivalent to an evenly distributed load in areas (1.8 m × 0.5 m), and the load should be applied in a moving manner [28,29]. When the speed is 60 km/h, which is the maximum design speed, 0.033 s are required by the load to move from the current node to the next node, which is a 0.55 m distance between the adjacent two points. The time of load contact with the road surface is 0.012 s (t0 = L0/v and L0 is 0.2 m of wheel grounding length); thus, a complete load action and calculation period of 0.045 s can be obtained. The time–history curve of a single vehicle load is shown in Figure 10.
F t = P 0 + P sin ω t
where P0 is the wheel static load, chosen as 140 kN; P is the amplitude of the vibration load, P = M0αω2; M0 is the vehicle unsprung mass, chosen as 5 kN·s2/m; α is the geometric irregularity vector height, chosen as 2 mm; ω is the vibration circle frequency, ω = 2πv/L; L is the geometric curve wavelength, chosen as the vehicle length 12.8 m; and v is the speed.
Figure 11 shows the numbers and locations of the data recording points in the numerical simulation. ZD represents the data recording points of the road foundation; PP represents the data recording points of the formation’s pore water pressure; and CR, SP, and WA represent the data recording points of a structural vault, an arch’s shoulder, and an arch’s waist, respectively. In particular, ZD1 and ZD2 recorded the data of the road surface and subgrade top above the vault, respectively, and ZD4 and ZD5 recorded the data of the road surface and subgrade top above the soil between pipes.

4. Results and Analysis

4.1. Simulation Results of Arch Culvert Construction

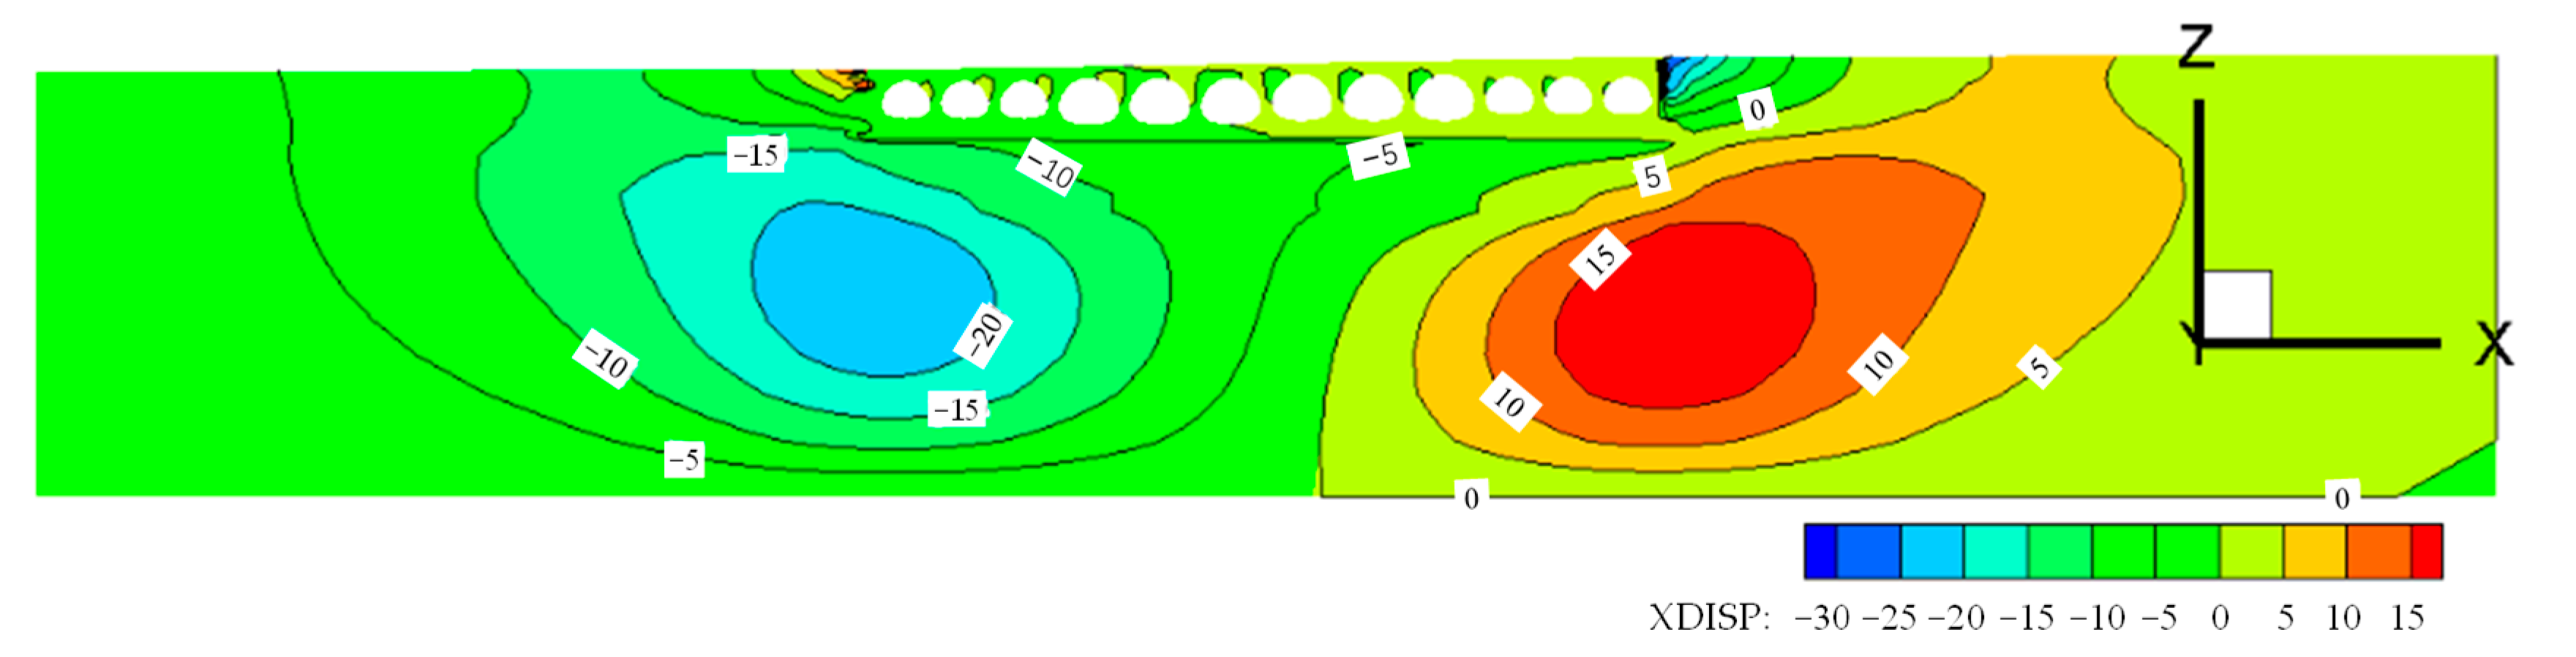
4.1.1. Displacement of Strata

Figure 12 shows the contour map of the foundation settlement under construction load. The settlement of the foundation soil on the left and right sides is roughly symmetrical. Because the height of the right filling is slightly higher than that of the left, the settlement of the right foundation is slightly larger than that of the left. There are two different types of arch culverts in the arch culvert area, and the sizes of arch culverts numbered 4–9 are larger than others. Due to the varying sizes of arch culverts, the soil in the surrounding area will be discontinuous and uneven, resulting in different load responses. The foundation below the junction of different types of arch culverts has the largest settlement. Figure 13 shows the horizontal displacement distribution of the foundation under construction backfill load. The maximum horizontal displacement occurs below both ends of the foundation, about 30 m from the bottom of the foundation, which is three times the depth of the foundation pit, and about 17 m from the bottom of the composite foundation. The settlement deformation depth affected by construction is 50 m below the bottom of the foundation, which is about five times the depth of the foundation pit, and the influence range of horizontal displacement deformation is about twice the length of the foundation pit. The specifications dictate that the post-construction settlement for general sections of first-class highways should be no more than 30 cm, while the post-construction settlement for culverts, box culverts, and channels should be no more than 20 cm [30]. The calculation results show that the settlement caused by the construction of the arch culvert on the soft soil composite foundation meets the requirements of the code.

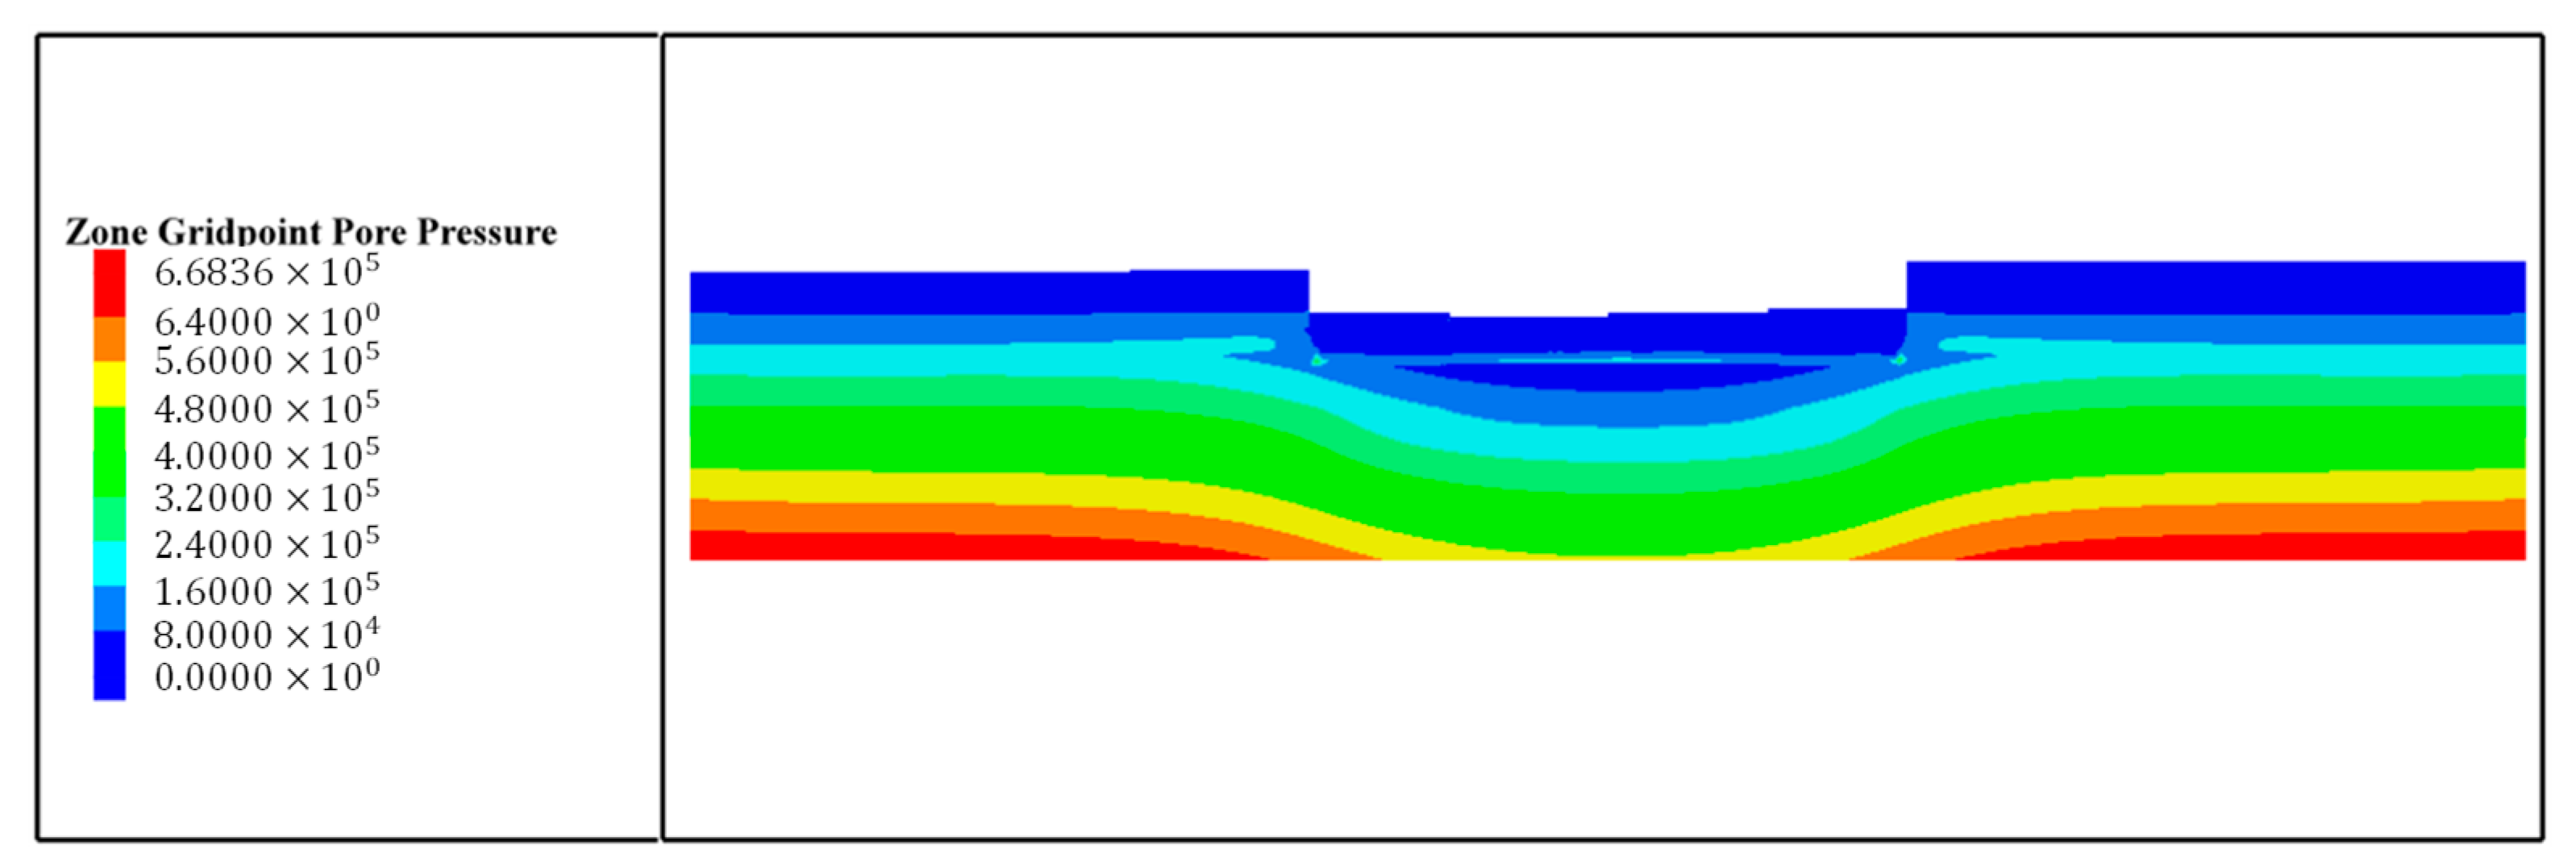
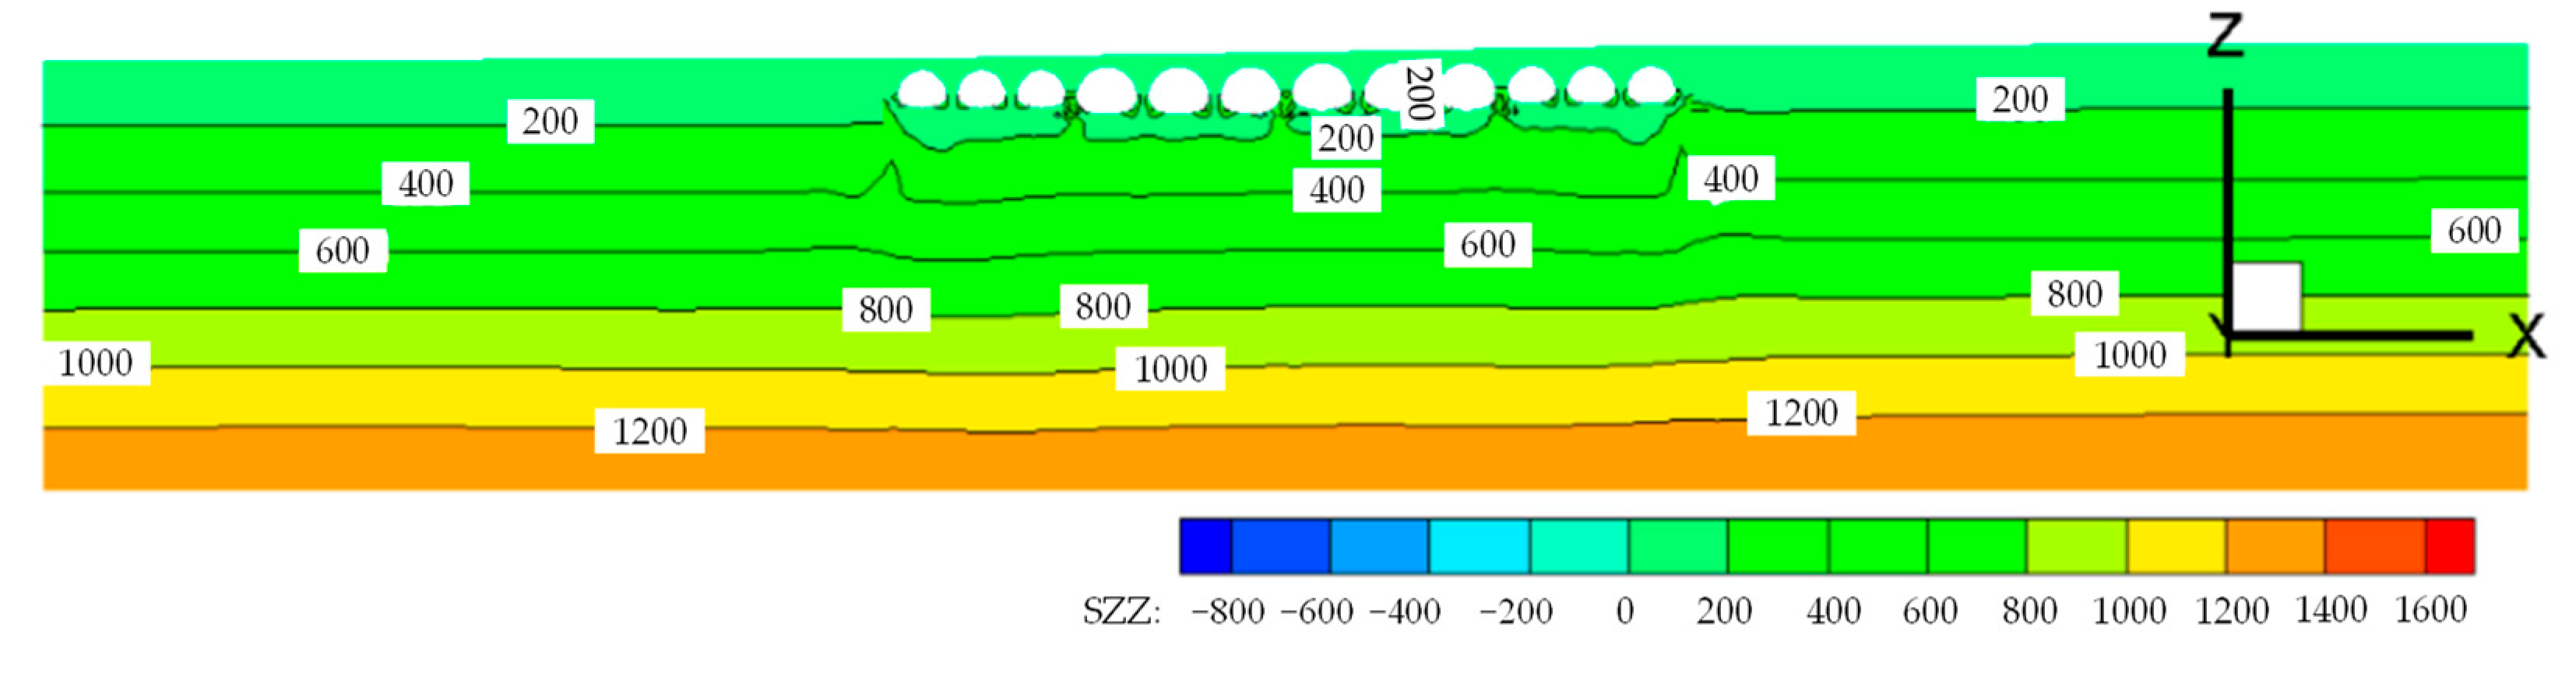
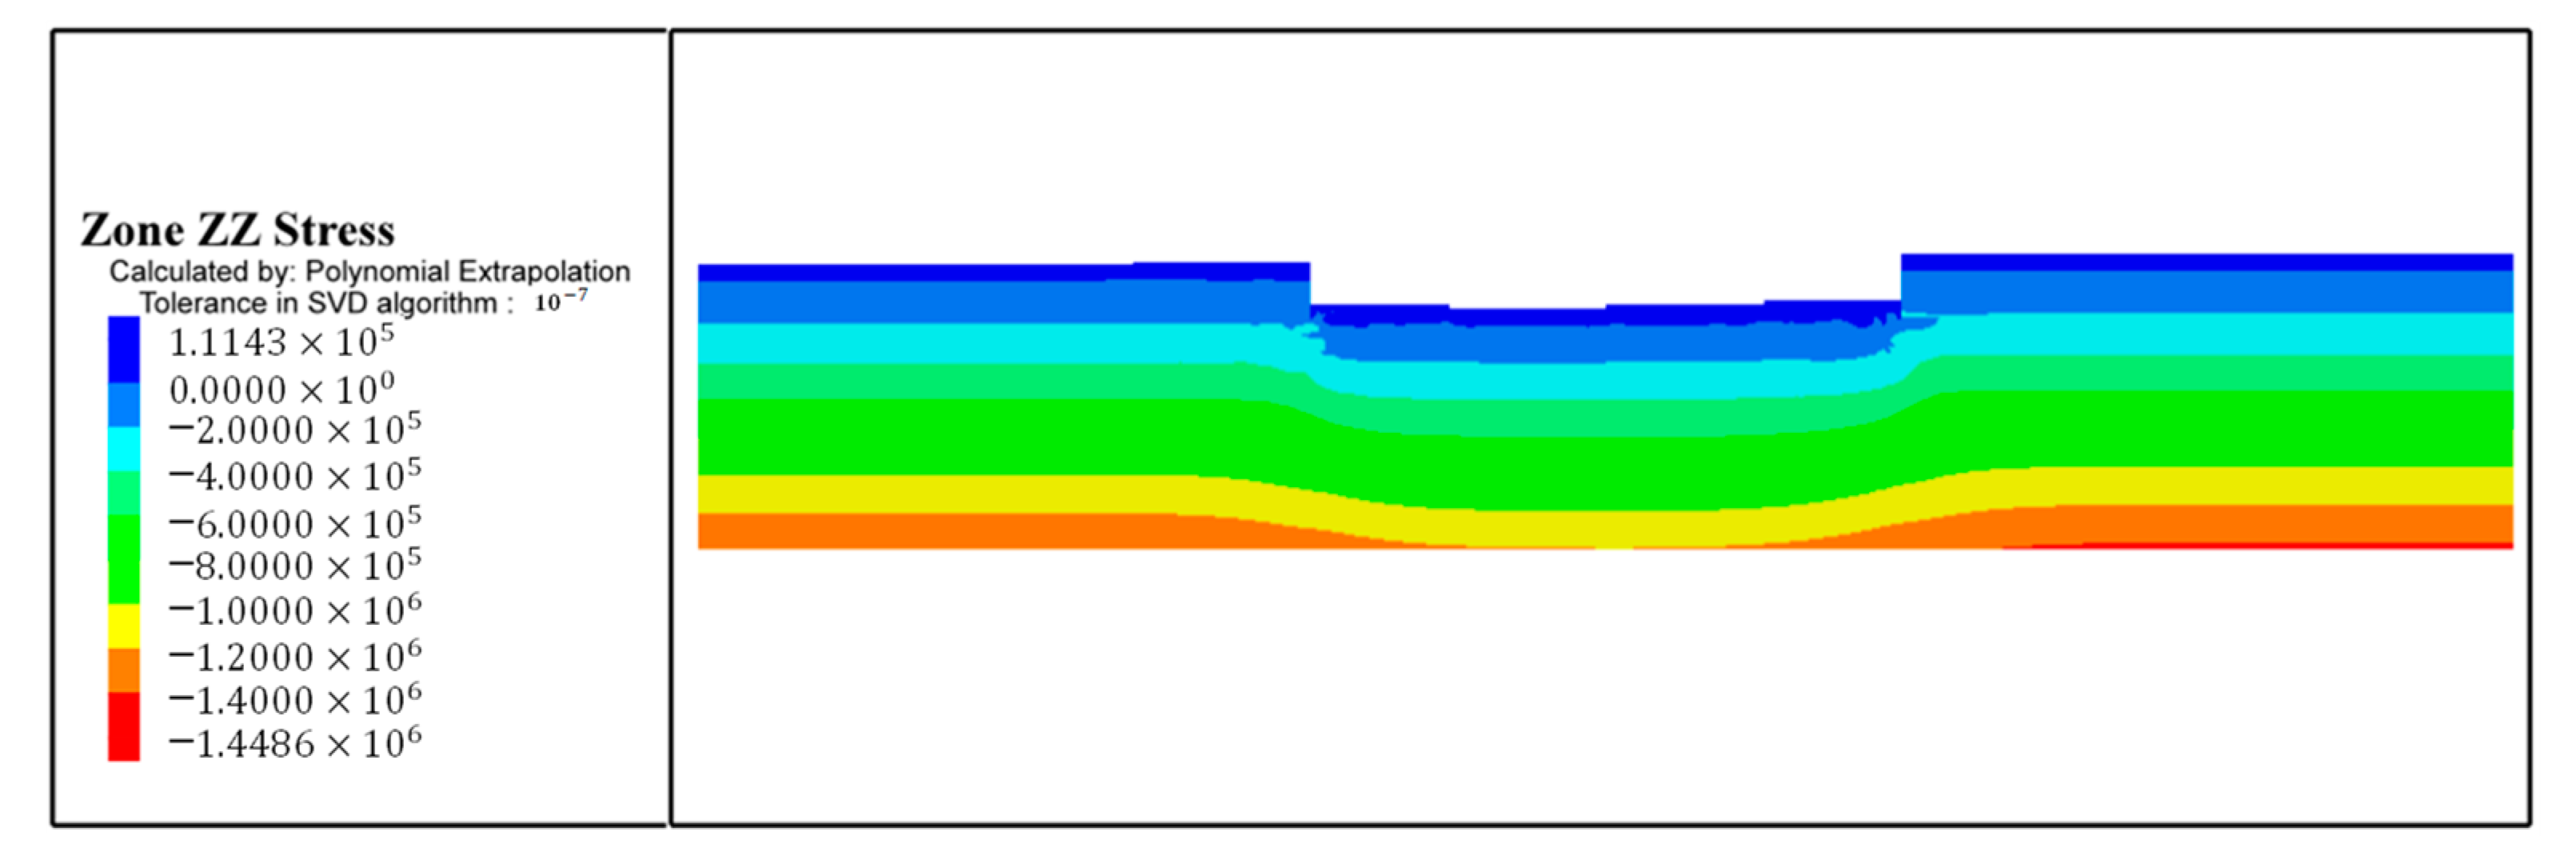
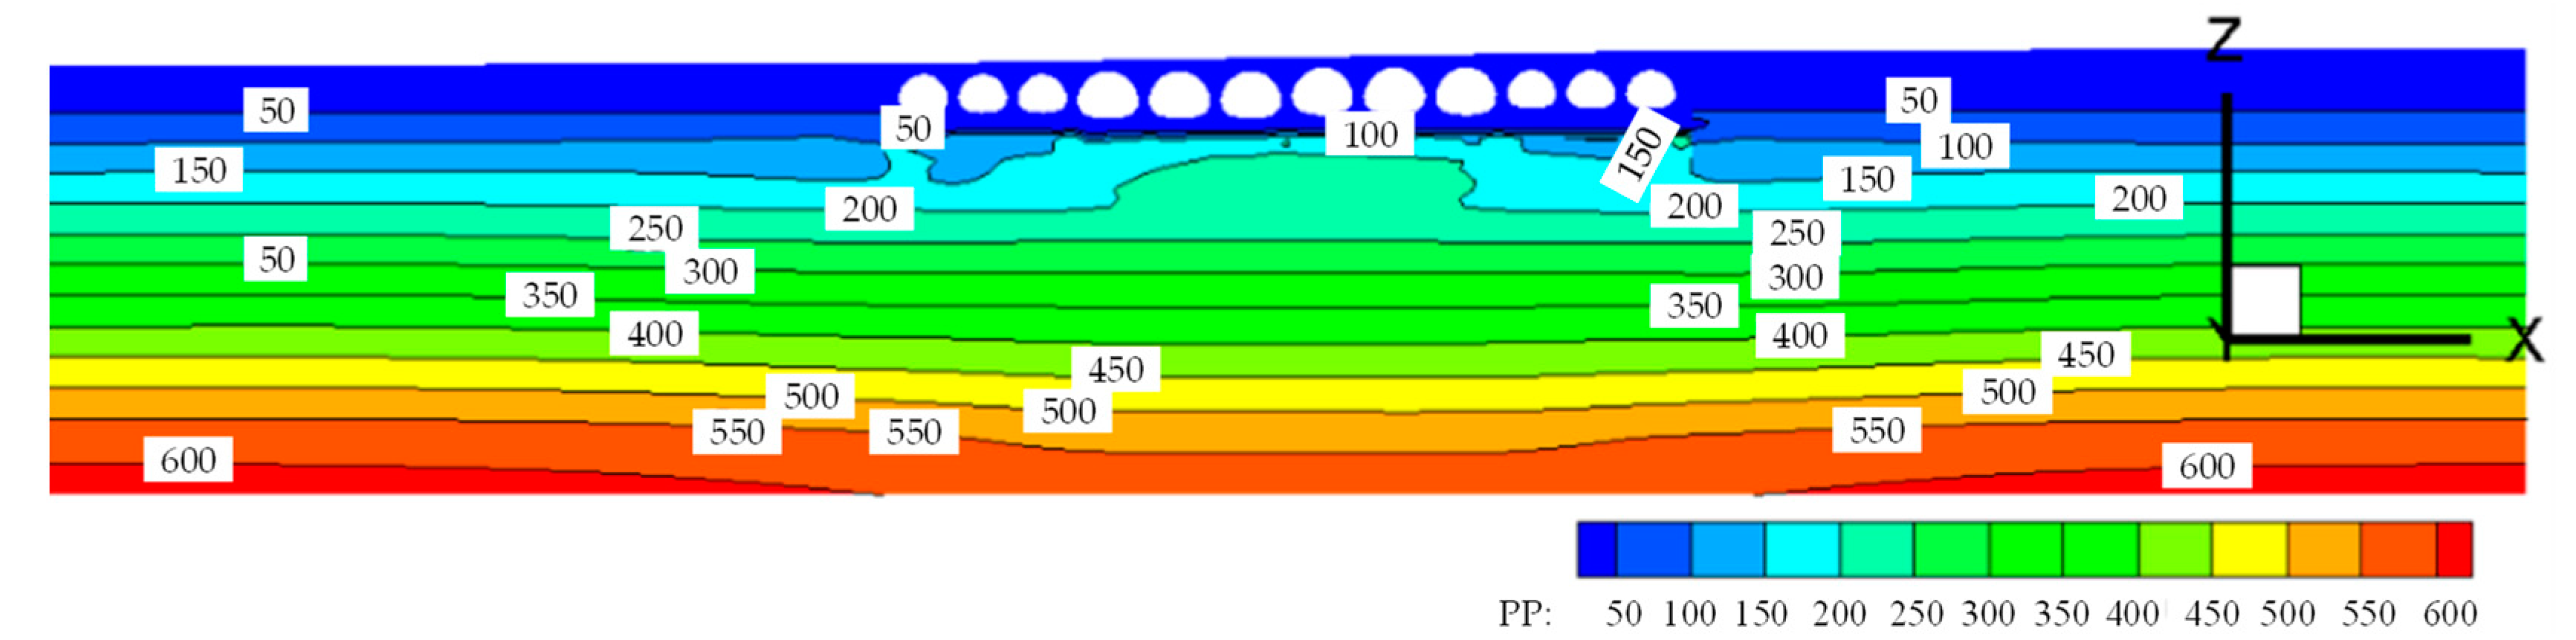
4.1.2. Soil Stress and Pore Water Pressure

Figure 14 shows the vertical stress curve recorded by the data recording point DD (Point DD as shown in Figure 5). Figure 15 shows the vertical stress contour after construction. The distribution of vertical stress exhibits only slight fluctuations in the shallow soil, primarily at the edge of the arch culvert area and the junction of the larger and smaller arch culverts. Because in the excavation area of the foundation pit, the self-weight load of the arch culvert is slightly less than that of soil and water. Therefore, the load generated by the lake filling is regarded as the historical maximum load of the foundation, the load generated by the arch culvert construction after the excavation is the normal consolidation pressure of the foundation. Figure 16 shows the outline of pore water pressure distribution after construction. Based on the results of this study, it can be observed that the pore water pressure of the bearing layer of the composite foundation along the length of the arch culvert is slightly lower. However, the pore water pressure is significantly higher in other areas. It should be noted that the influence of foundation treatment was not considered in this study, and the pore water pressure may not have had enough time to dissipate. The higher pore water pressure observed in the study may be related to the construction time and the lower permeability coefficient of the reinforced area.

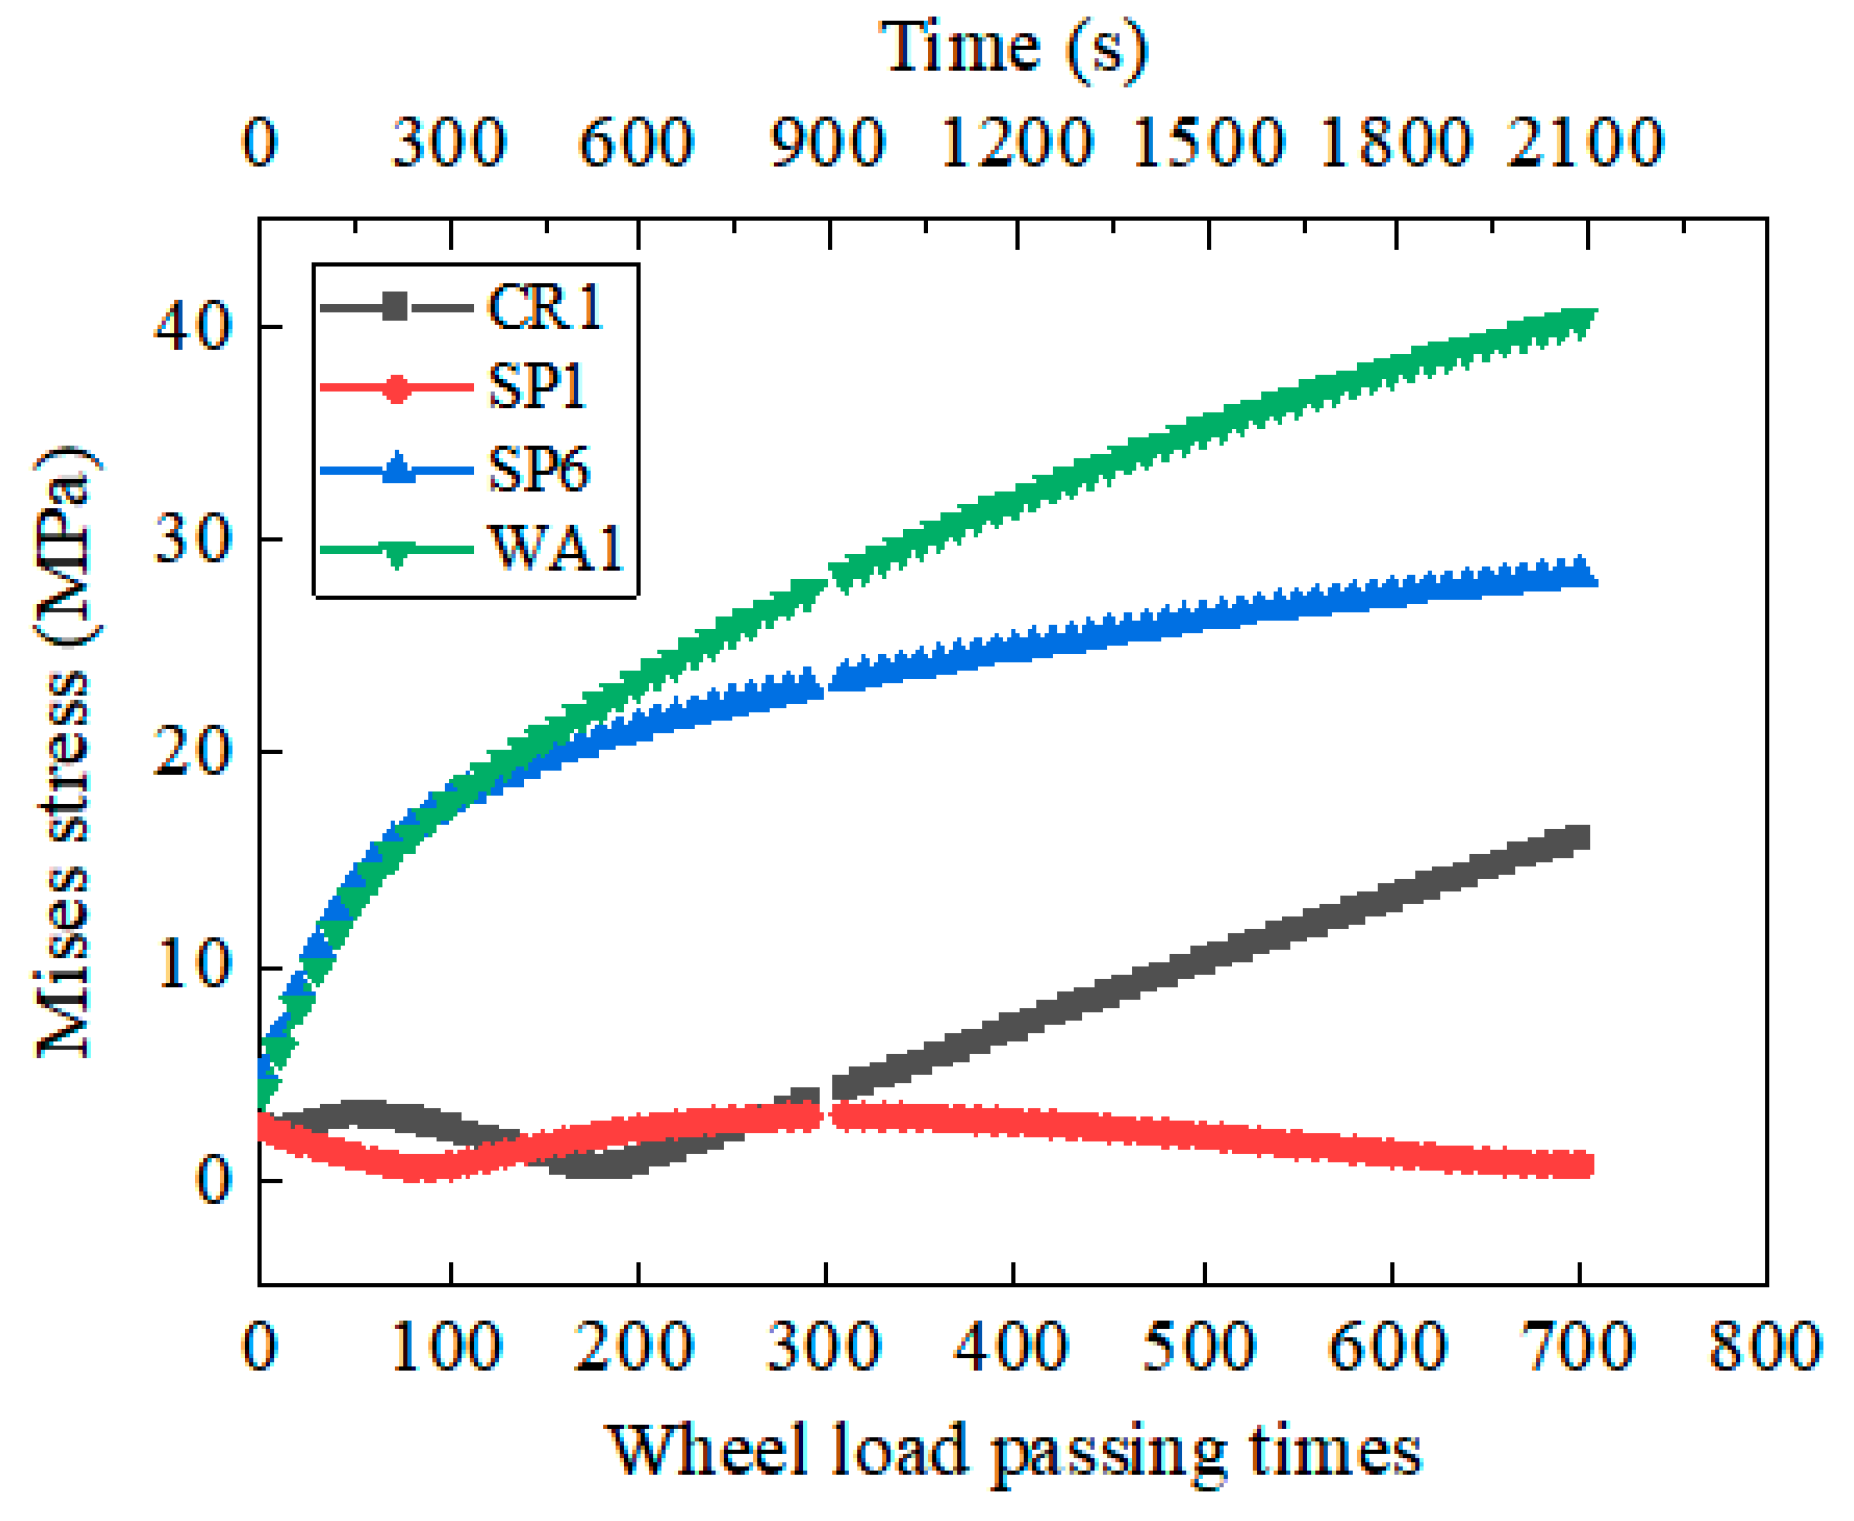
4.1.3. Structural Stress and Deformation

Figure 17 and Figure 18 show the vertical and horizontal deformation distribution of the steel corrugated pipe structure after construction. Because the vertical load of the vault at the right end of the arch culvert is larger and the soil is thicker. The vertical deformation of the arch culvert structure on the right side is larger. The 10-hole and 11-hole have the maximum vertical deformation of 23 mm. The maximum horizontal displacement of about 9 mm appears at the waist of the 4-hole to 6-hole. The horizontal displacement is related to the constraints of the soil, and the left culvert structure is covered with thin soil. The soil constraints of the left and right arch structures are small. Therefore, the horizontal deformation of the middle and left culvert structure is larger, which is similar to the deformation results of Wadi [31].
According to the specifications [32], when the backfill is completed, the shape deformation of the structure section should not exceed 2%. Additionally, the settlement deformation of steel corrugated pipes with vector heights of 6.205 m and 7.770 m would be less than 124.4 mm and 155.4 mm, respectively. The calculation results confirmed that the deformation did not exceed 2%.
Figure 19 shows the maximum principal stress profile of steel corrugated pipe after construction. The maximum principal stress of the structure is 0.86 MPa at the waist of the structure. Because the strength and stiffness of the material around the pipe suddenly change at the boundary between the protected masonry and the backfill. Appropriate protective measures should be taken during actual construction. When the thickness of low alloy high strength structural steel Q345 is less than 16 mm, the design values for compressive strength and bending strength are 305 MPa, while the design value for shear strength is 175 MPa. The results confirm that the material strength meets the design requirements.

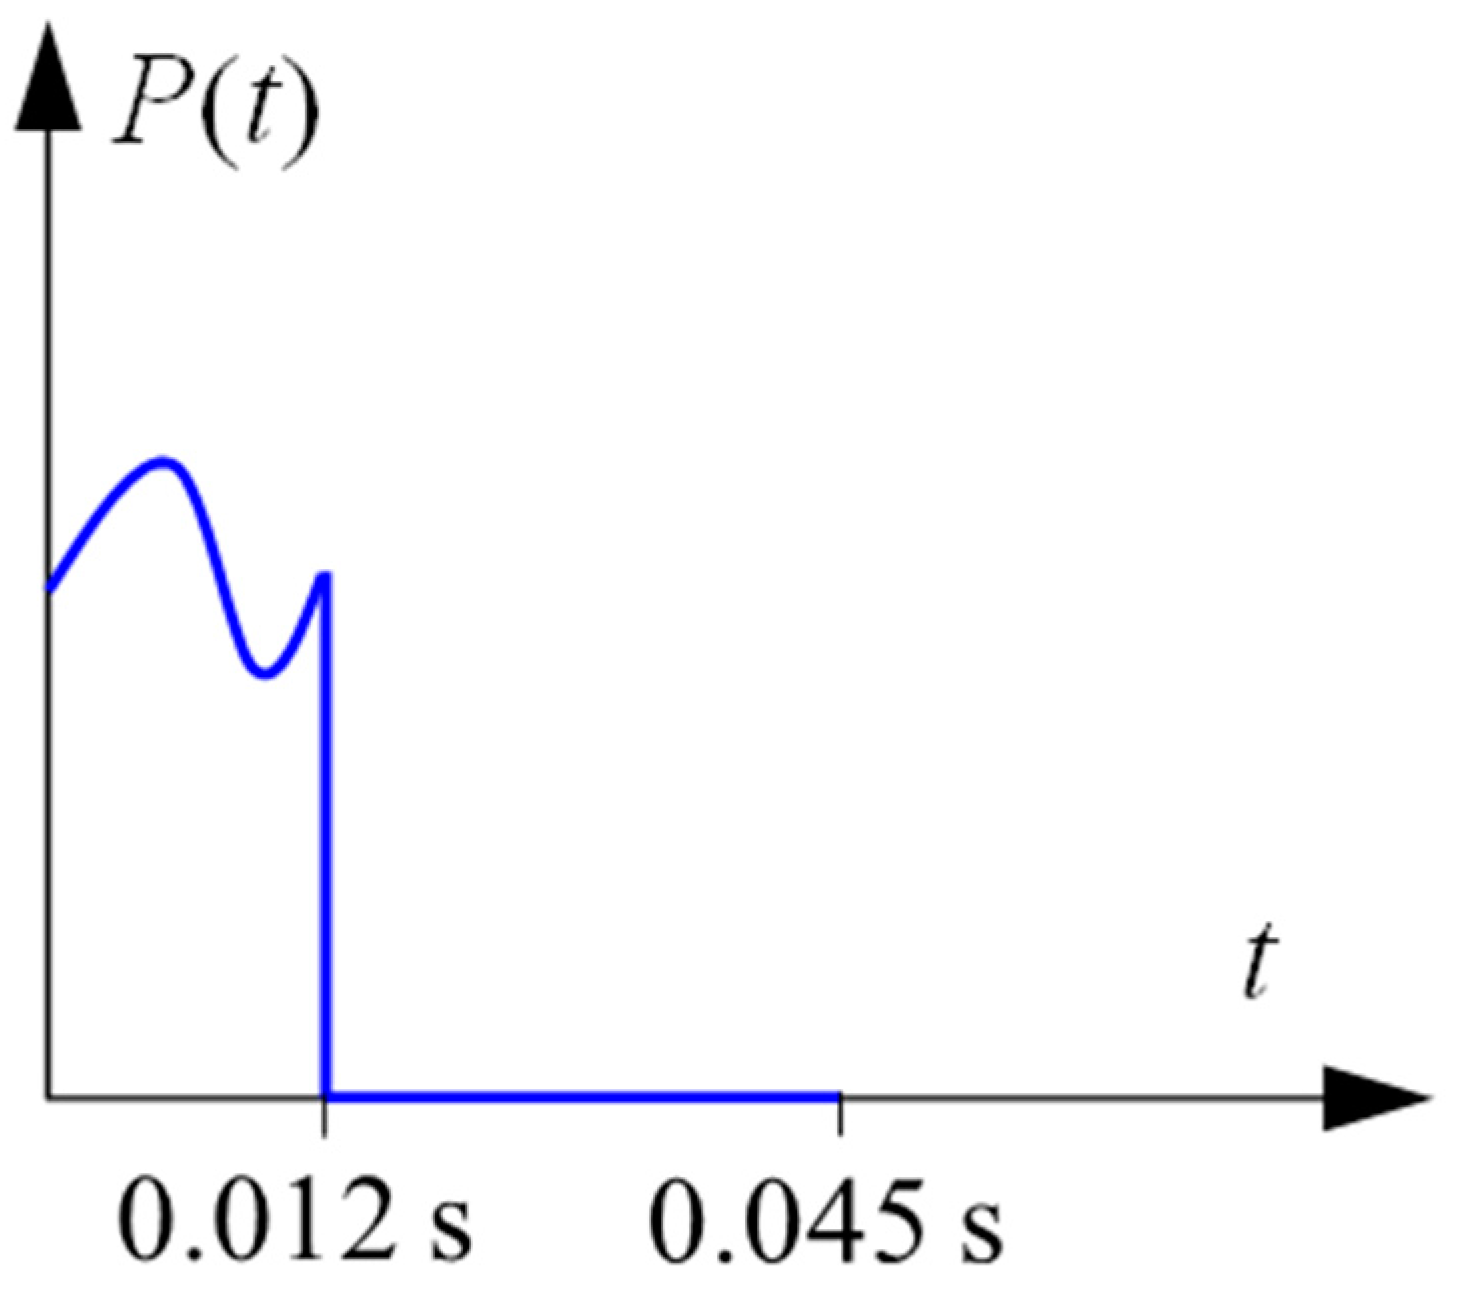
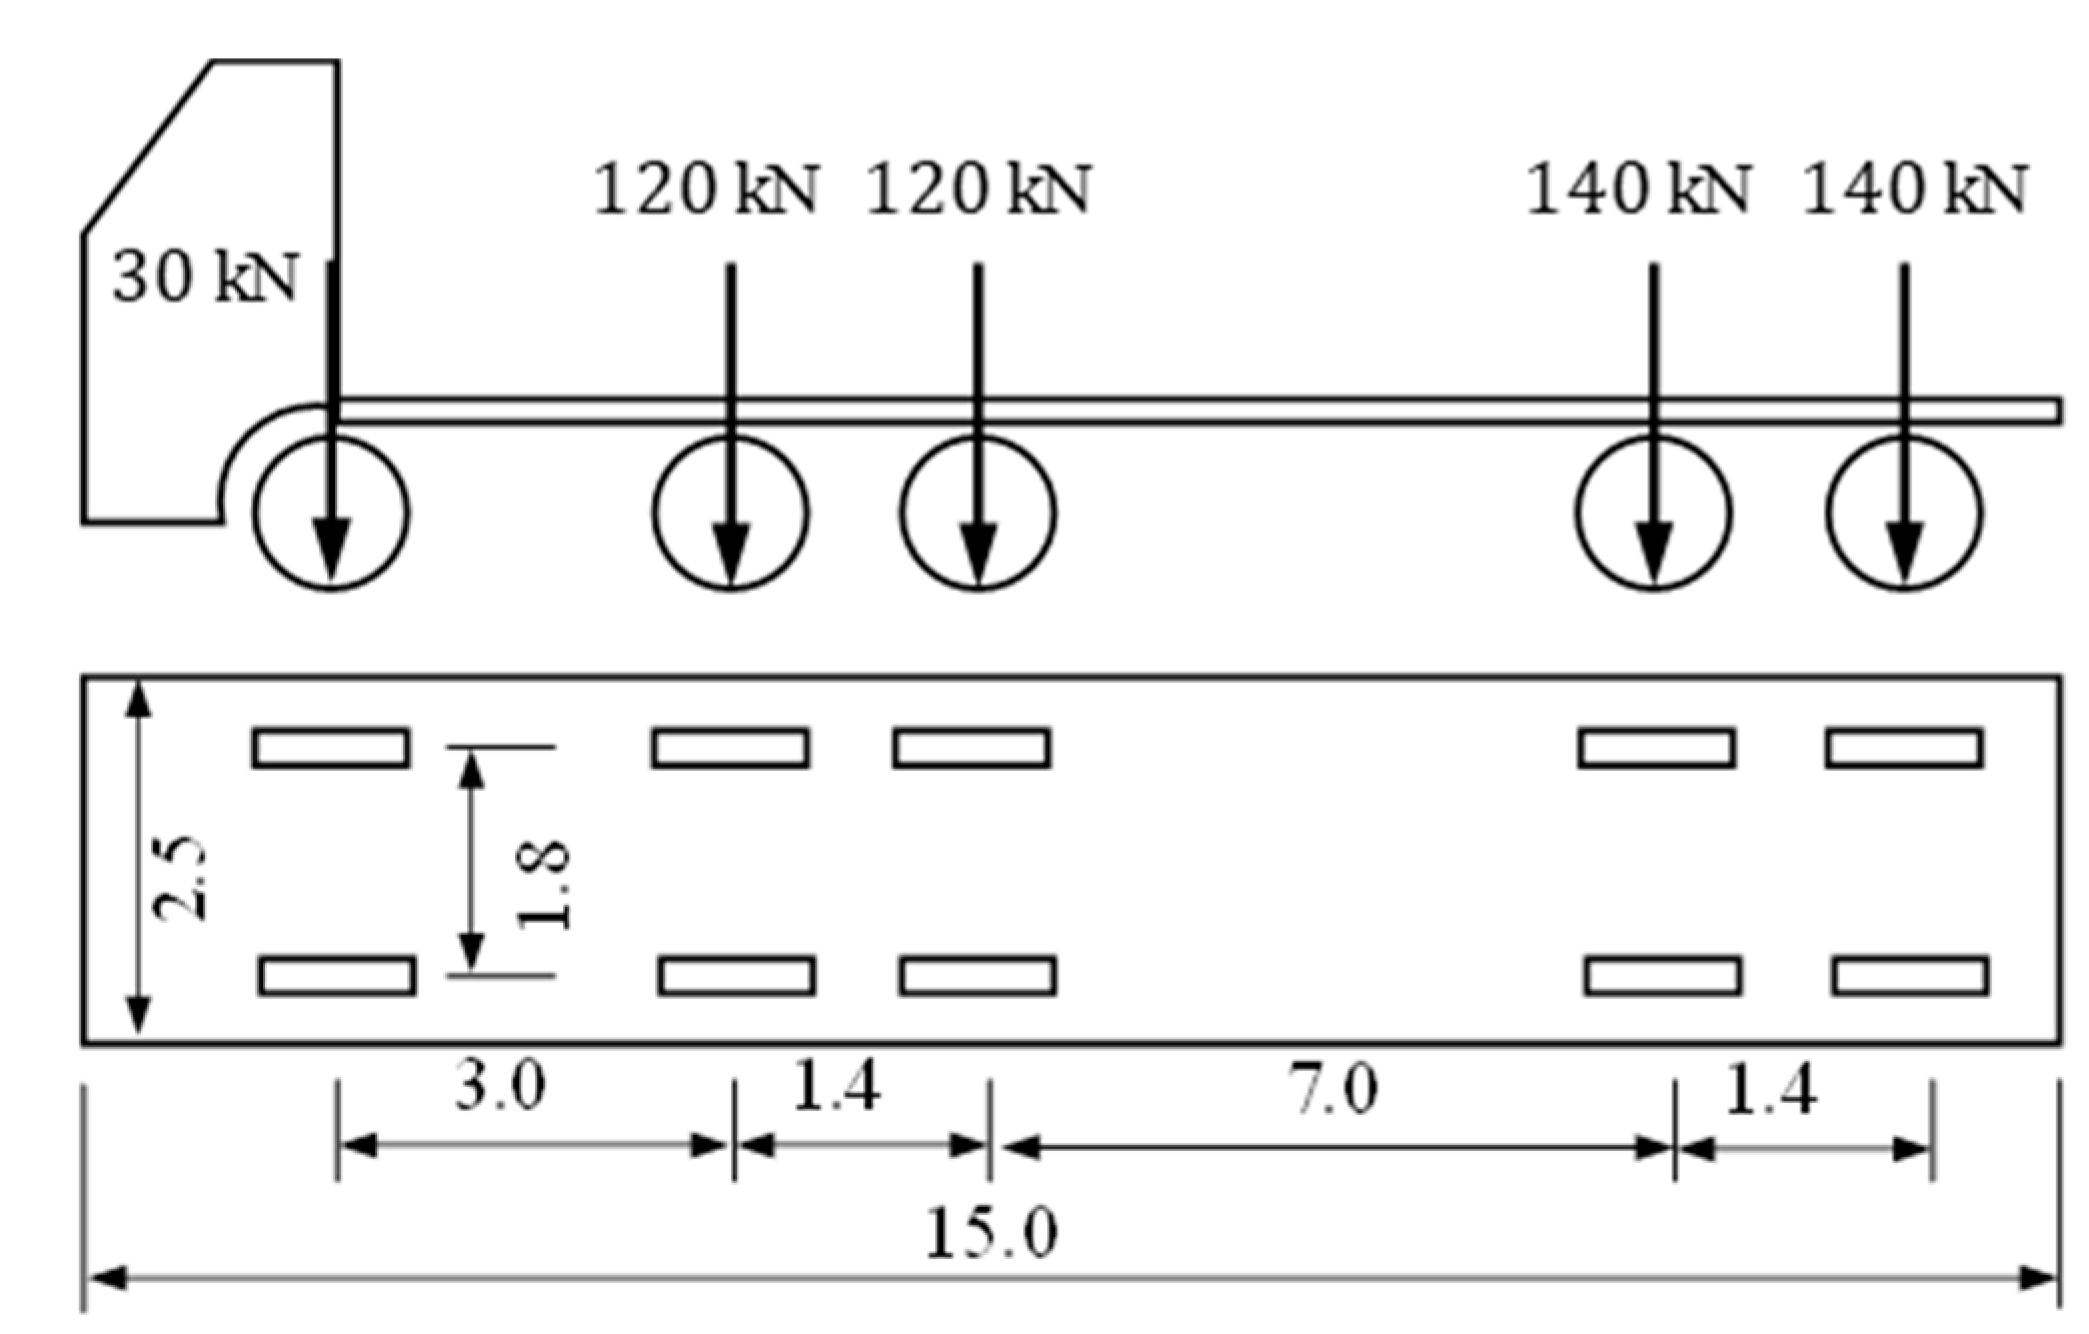
4.2. Simulation Results of Arch Culvert under Periodic Vehicle Load

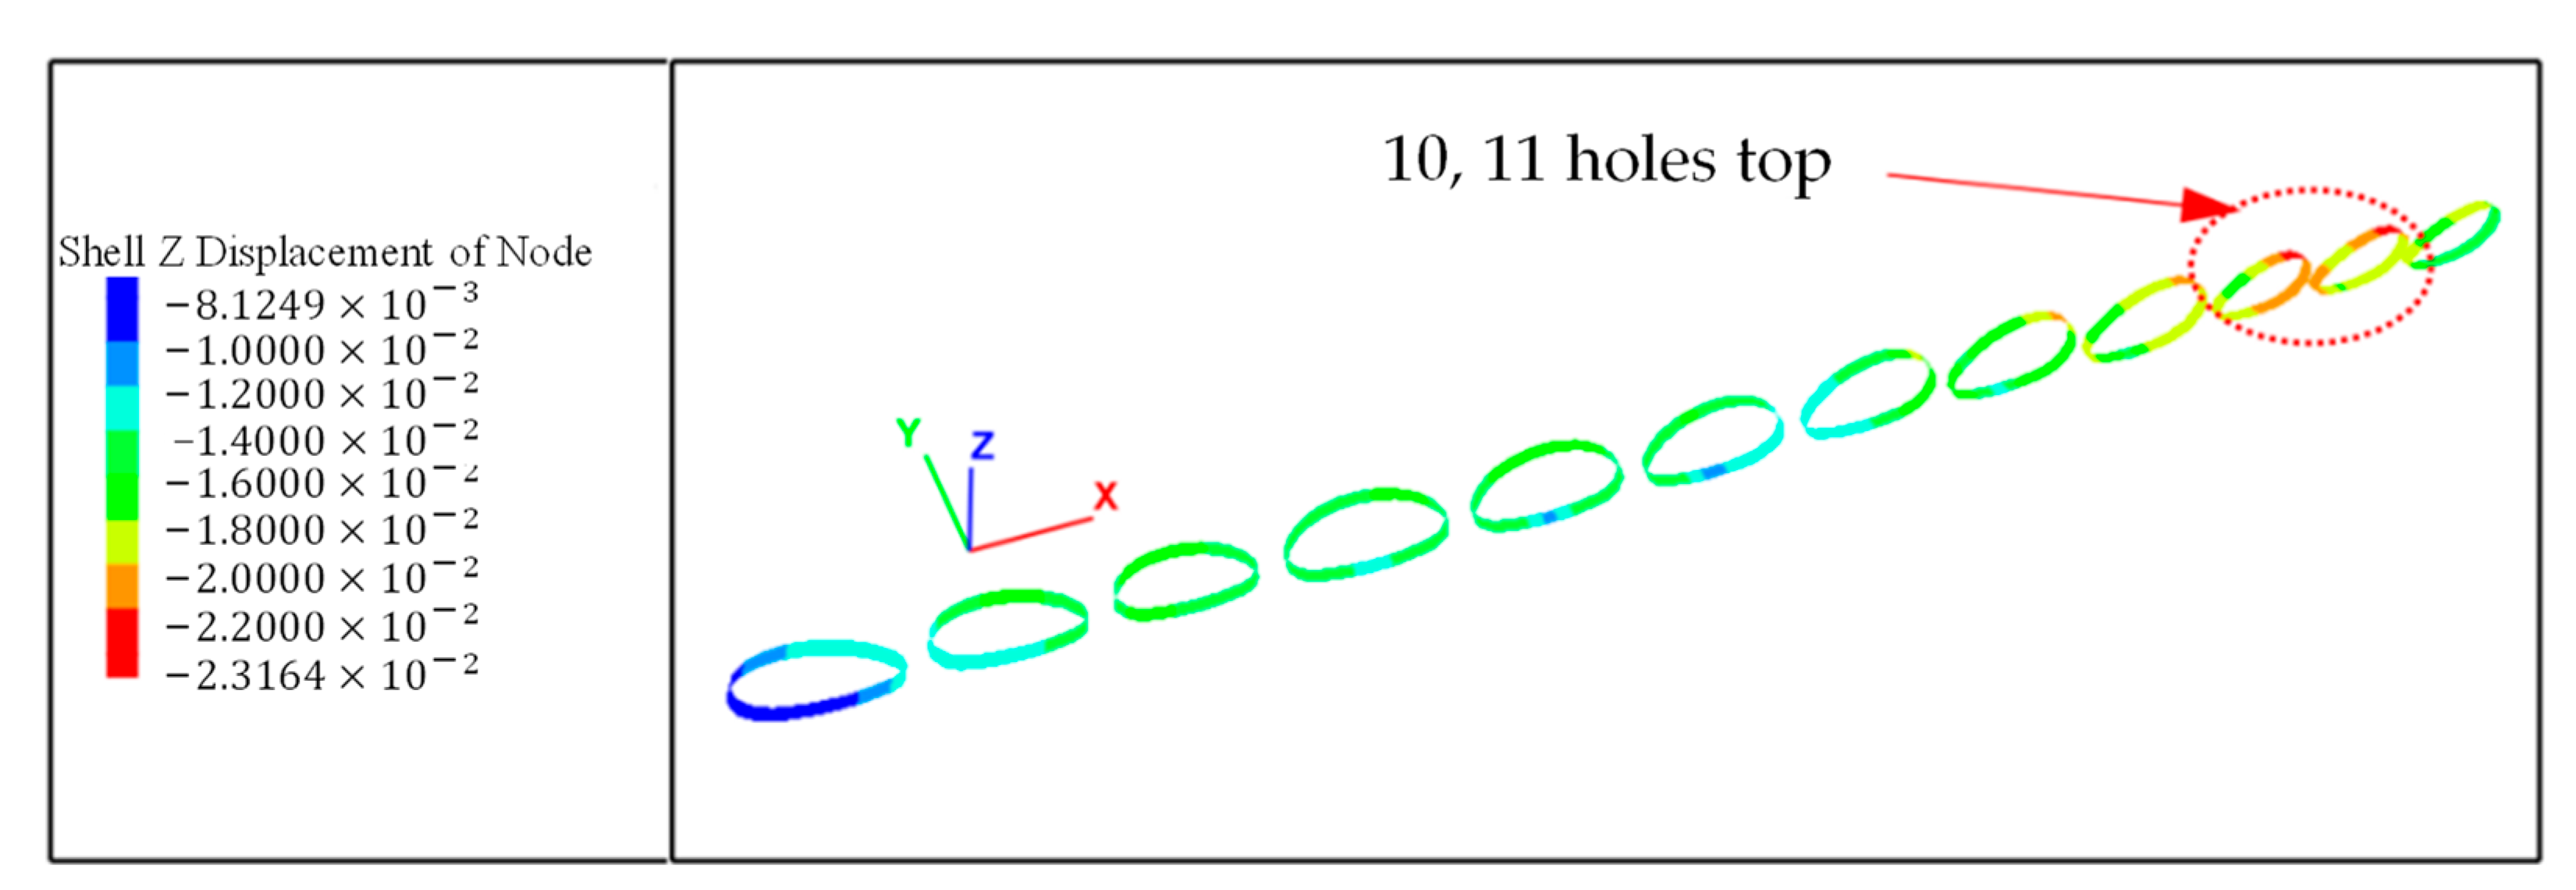
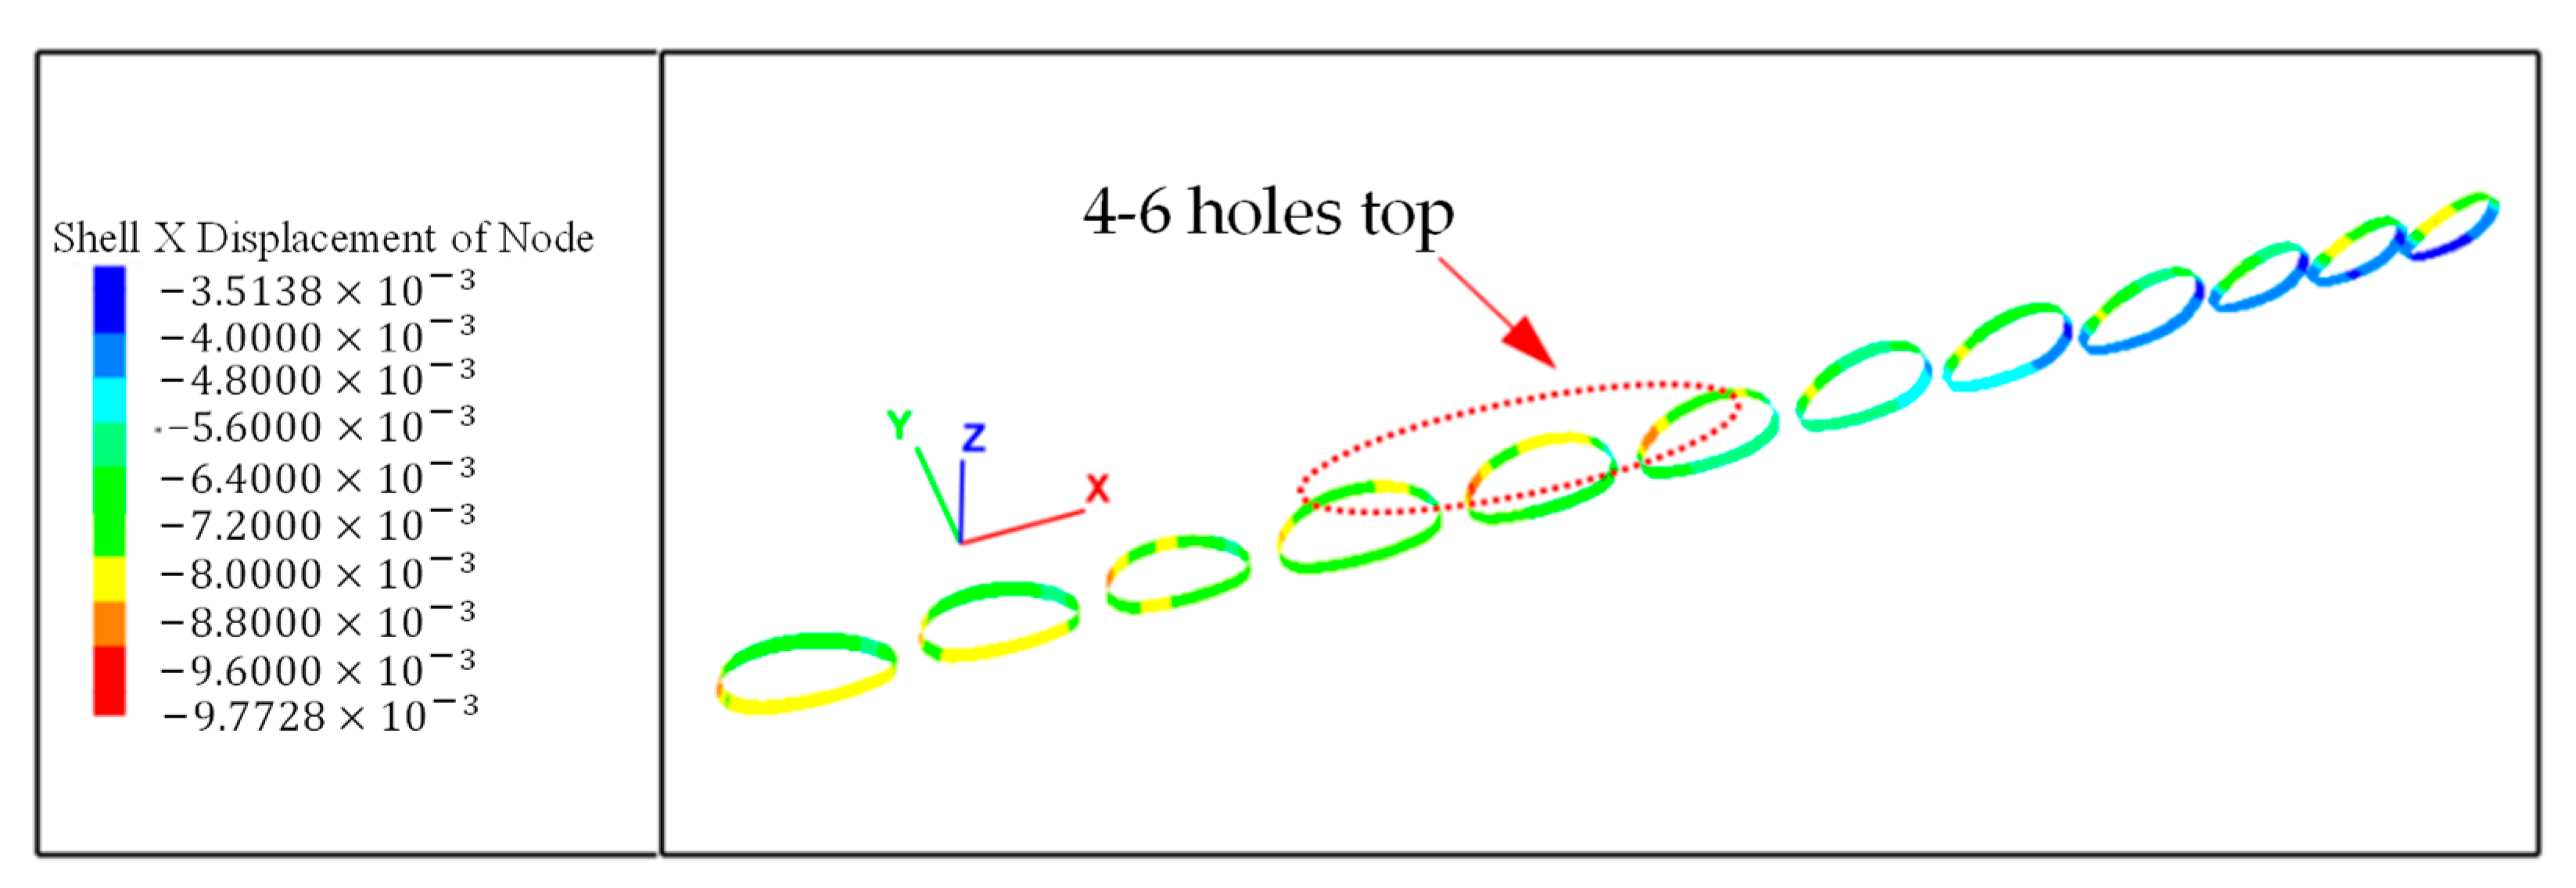
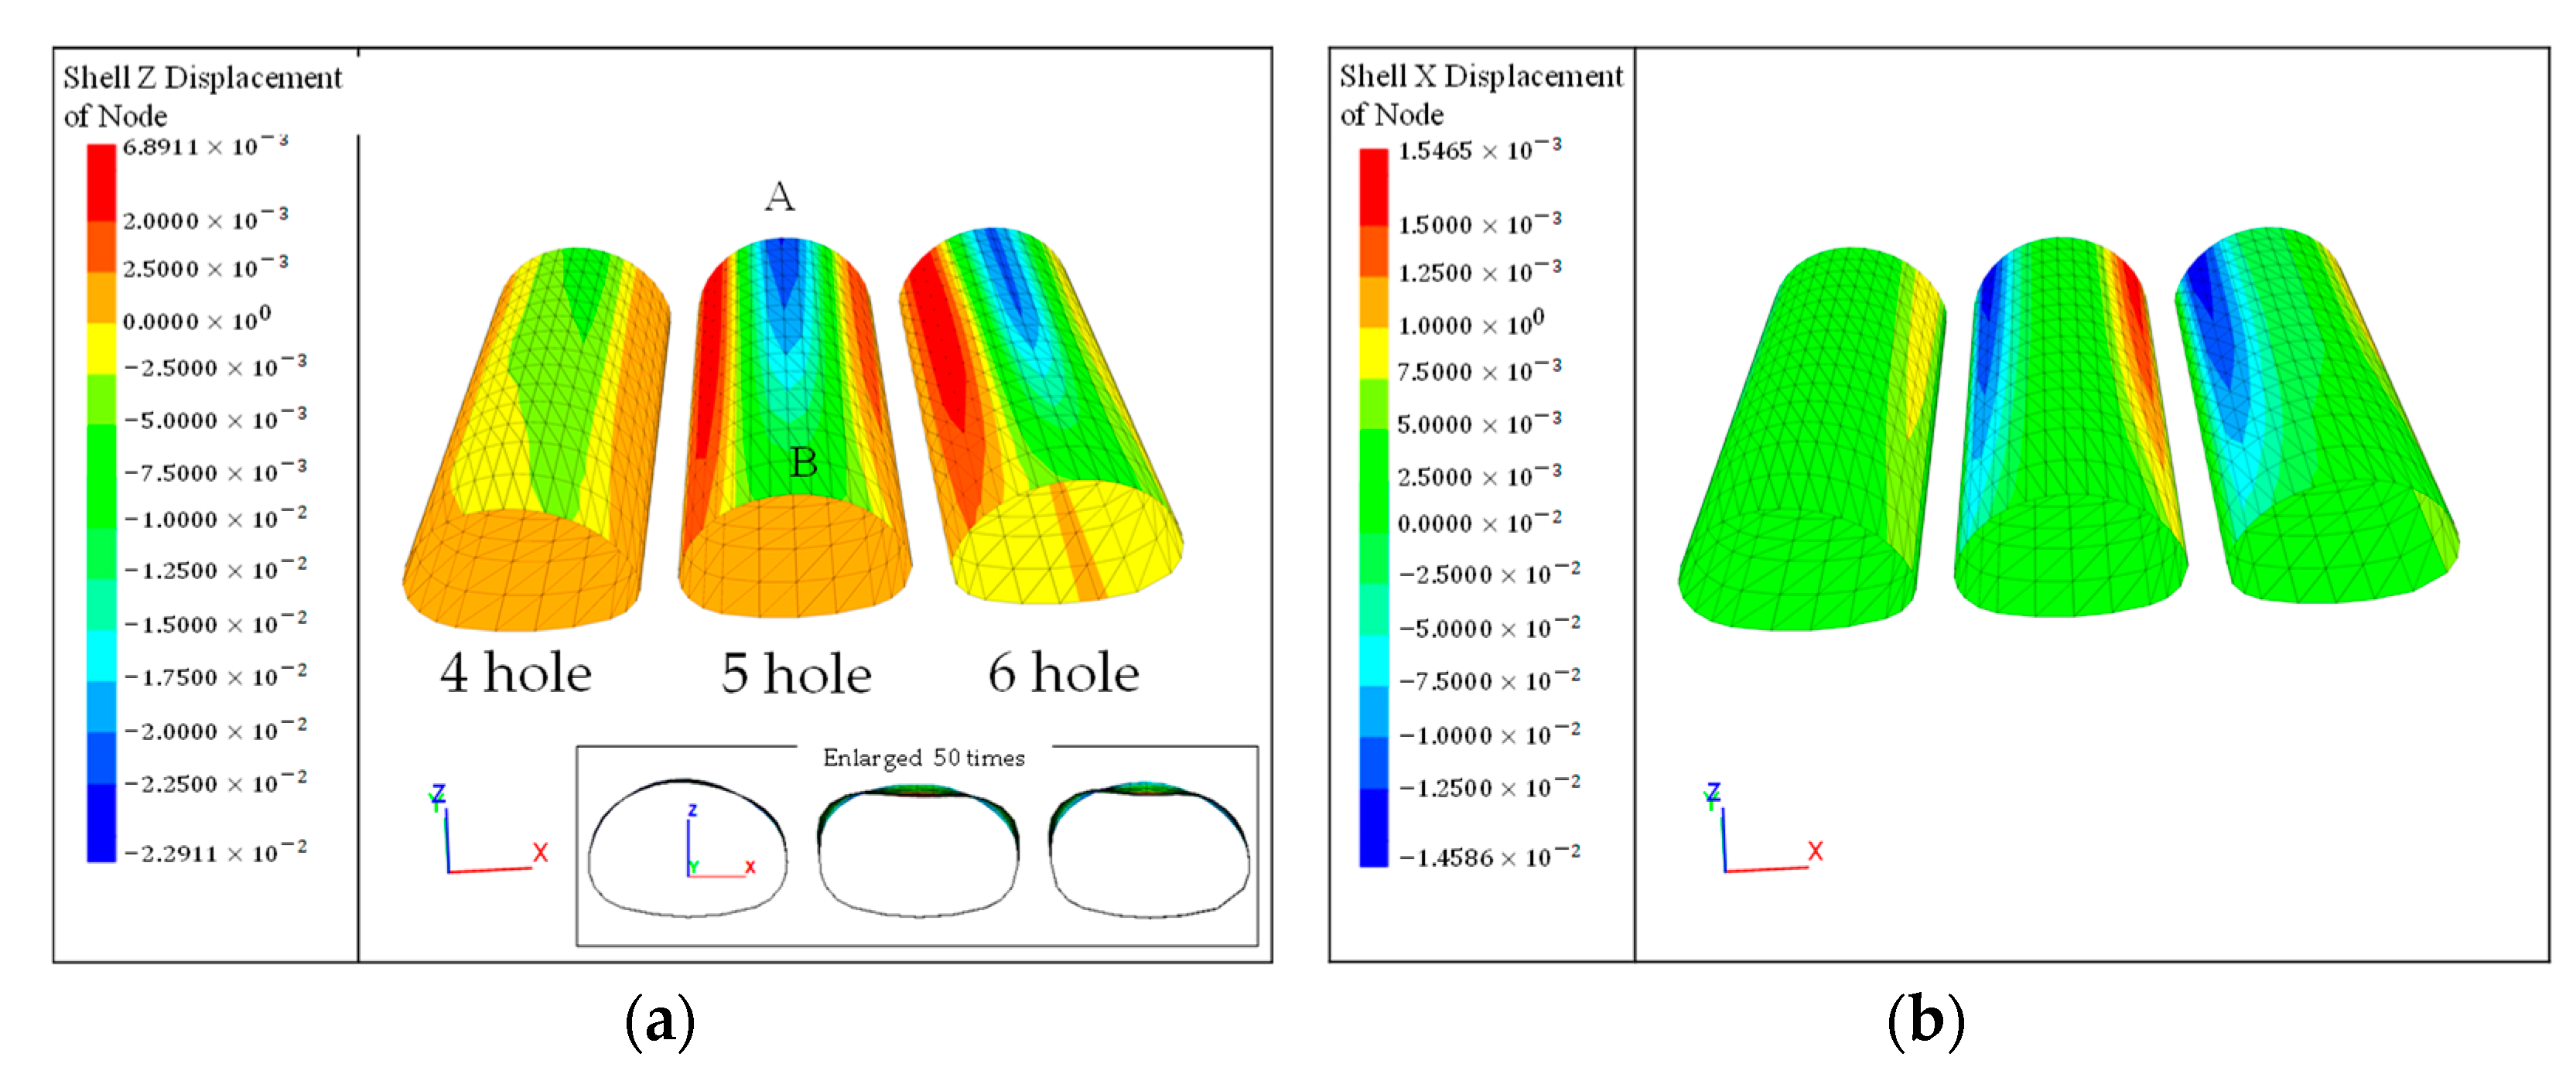
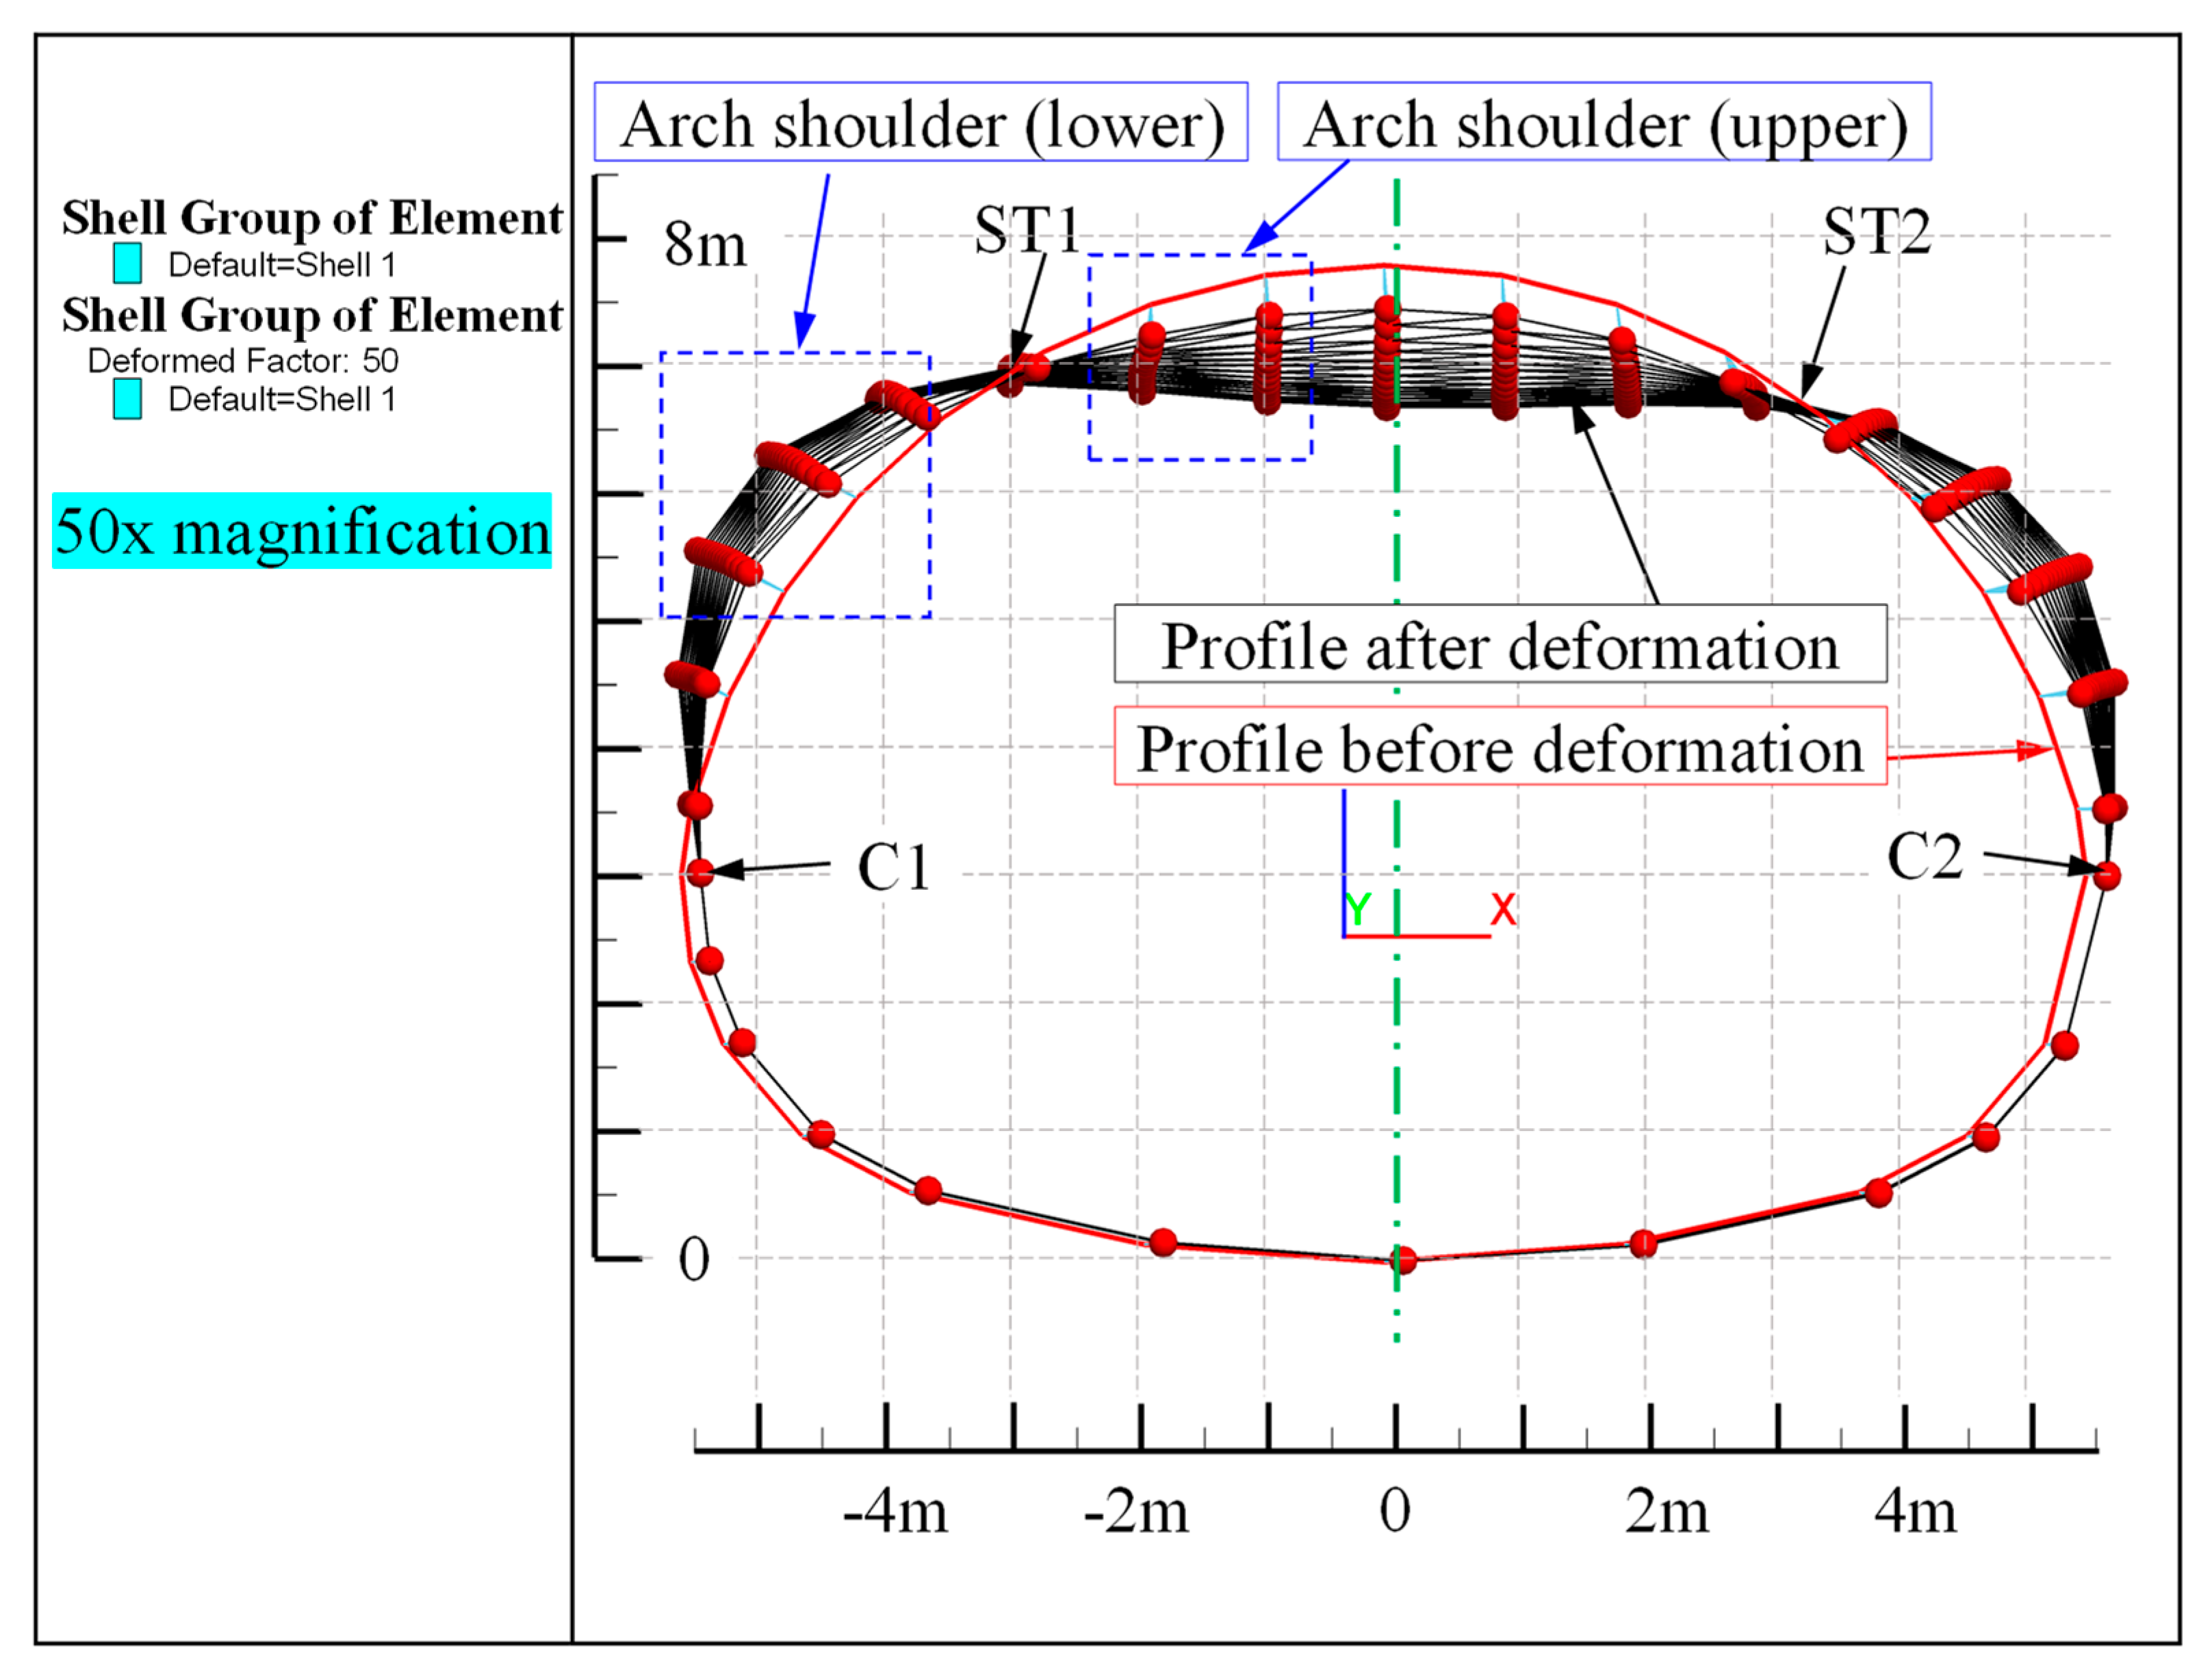
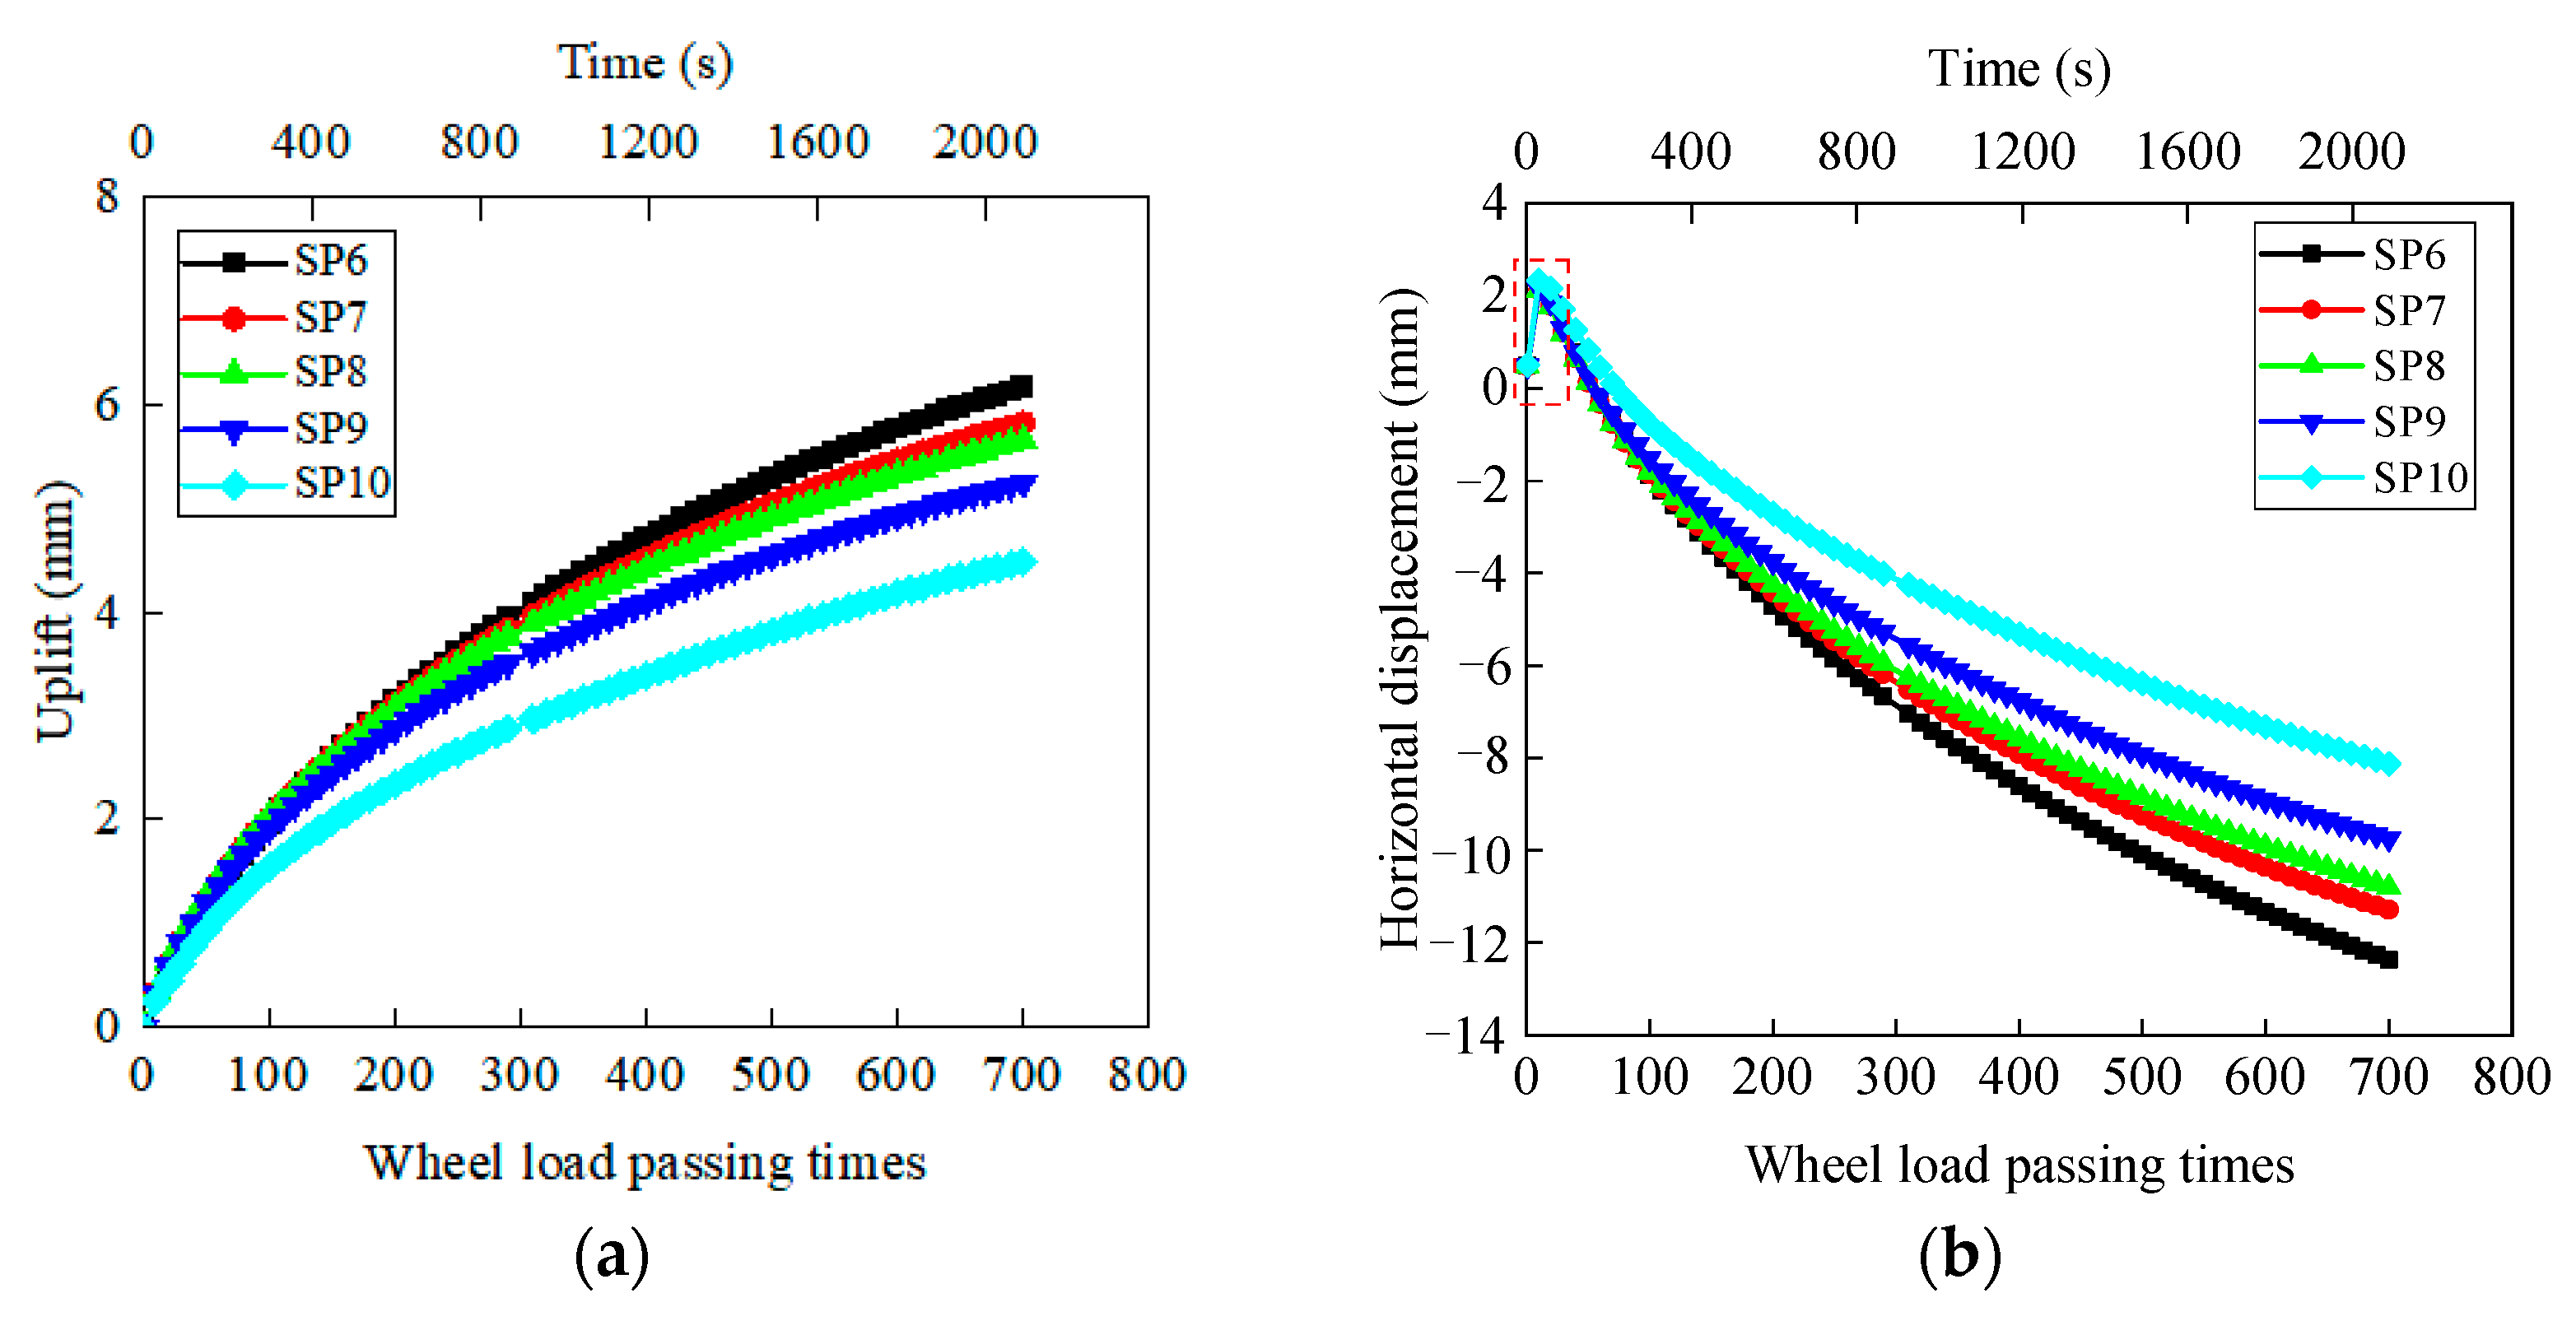
4.2.1. Deformation of Steel Corrugated Pipe

Figure 20 shows the vertical and horizontal deformations of the steel corrugated pipe after 700 times of wheel load has passed over. When the vehicle load moves in one direction (from the 4-hole side to the 6-hole side), the vertical and horizontal deformations of the 4-hole and 6-hole sides show notable differences. This indicates that the direction of the dynamic load affects the deformation of the culvert and must be fully considered in the design. The front end of the model is a sidewalk, which is far from the vehicle load. Therefore, the settlement of the front-end culvert vault is smaller than that of the back-end culvert vault. The vault of the culvert sinks, and at the same time, the arch shoulder rises. The maximum subsidence is 23 mm, and the maximum uplift is 6.8 mm. The maximum lateral movement of ±15 mm occurred at the shoulder, not the waist. Because the C15 concrete protective masonry limited the horizontal displacement of the waist. Whereas the shoulder was constrained by backfill soil, and the constraint effect was visibly weakened.
To further analyze the deformation of the steel corrugated pipe culvert, the 5-hole corrugated pipe culvert with the largest deformation was selected. Figure 21 shows a magnified view of the 5-hole steel corrugated pipe before and after deformation, revealing the initial state of the structure and the contours after deformation of PB700 (PB means the number of wheel load that passes bridge, and PB700 means the number of wheel load that passes bridge is 700). Two obvious transition points, ST1 and ST2, can be found in the deformation diagram. The deformation transition points ST1 and ST2 are symmetrically distributed, approximately 3.0 m from the vertical symmetry axis of the structure and 1.0 m from the vault. The structural deformation above the transition point is concave, and the structural deformation between the transition point and the arch waist C1 (C2) is convex. Several deformation curves of different vehicle load passing times are drawn in Figure 21. When the passing times of vehicle loads are small, the deformation of the structure is small. As the passing times increase, the deformation will continue to increase and eventually converge.
Figure 22a shows the relationship between structural vault settlement and wheel load passing times. Because the vehicle load action point is biased towards CR1, the settlement at CR1 is the largest. The sedimentation from CR1 to CR5 decreased gradually. The settlement rate at each point from PB0 to PB300 is nearly linear. The settlement starts showing a slow trend after PB300, because the structure may quickly reach a cooperative deformation state with the surrounding soil after a certain degree of rapid and large deformation. At PB700, the settlements of CR1 and CR5 were −22 mm and −14 mm, respectively. The difference was 8 mm, and the ratio of settlement to structural vector height was 0.28% and 0.18%, respectively. To explore the settlement stability value of the vault, quadratic polynomial fitting was performed for CR1 and CR5. The fitting curves and their function are shown in Figure 22b. The settlements of CR1 and CR5 were predicted to be stable in PB1500 and PB1950, respectively. The corresponding settlement stability values were −40 mm and −20 mm, respectively, and the ratio of CR1 and CR5 settlement to structural vector height was 0.51% and 0.26%, respectively.
Figure 23 shows the settlement and lateral displacement of the arch’s upper shoulder (the points of SP1 to SP5). The sedimentation from SP1 to SP5 decreased gradually. The settlement rate began to show an inflection point after a short period of linear increase from PB0 to PB300 and tended to zero at PB300. With a maximum settlement of −4 mm for SP1 and a minimum settlement of −2 mm for SP5, the settlement during this period was stable. Figure 23b shows that when the structure first exhibits a minor right-wing movement between PB0 and PB40, that is, the structure begins to squeeze the soil towards one side. After PB40, the structure starts to exhibit a left-wing deformation. For PB0–PB300, the lateral displacement increased linearly, and subsequently, the settlement rate began to decrease. The functions and curves obtained from the curve fitting of SP1 and SP5 (starting from PB40) are shown in Figure 24. The lateral deformation of SP1 and SP5 is predicted to be stable at PB1200 and PB1500, approximately −7 mm.
Figure 25 shows the settlement and lateral displacement of the arch’s lower shoulder (the points of SP6 to SP10). As shown in Figure 25a, from SP6 to SP10, the uplift and uplift rates increased gradually. Due to the presence of the deformation transition points ST1 and ST2, when the vault sinks, the arch shoulder will experience uplift. From PB0 to PB50, the uplift increased linearly. Subsequently, the arching rate gradually decreased, with a maximum arch of 6 mm for SP6 and a minimum arch of 4 mm for SP10. As shown in Figure 25b, due to the short distance between SP1 and SP5, and SP6–SP10, the latter first moved towards the vacant surface of the structure and then began to deform towards the backfill soil, resulting in soil compression. The deformation convergence trend shown in Figure 25 indicates that the stable deformation of the arching and lateral displacement is predicted to be small.

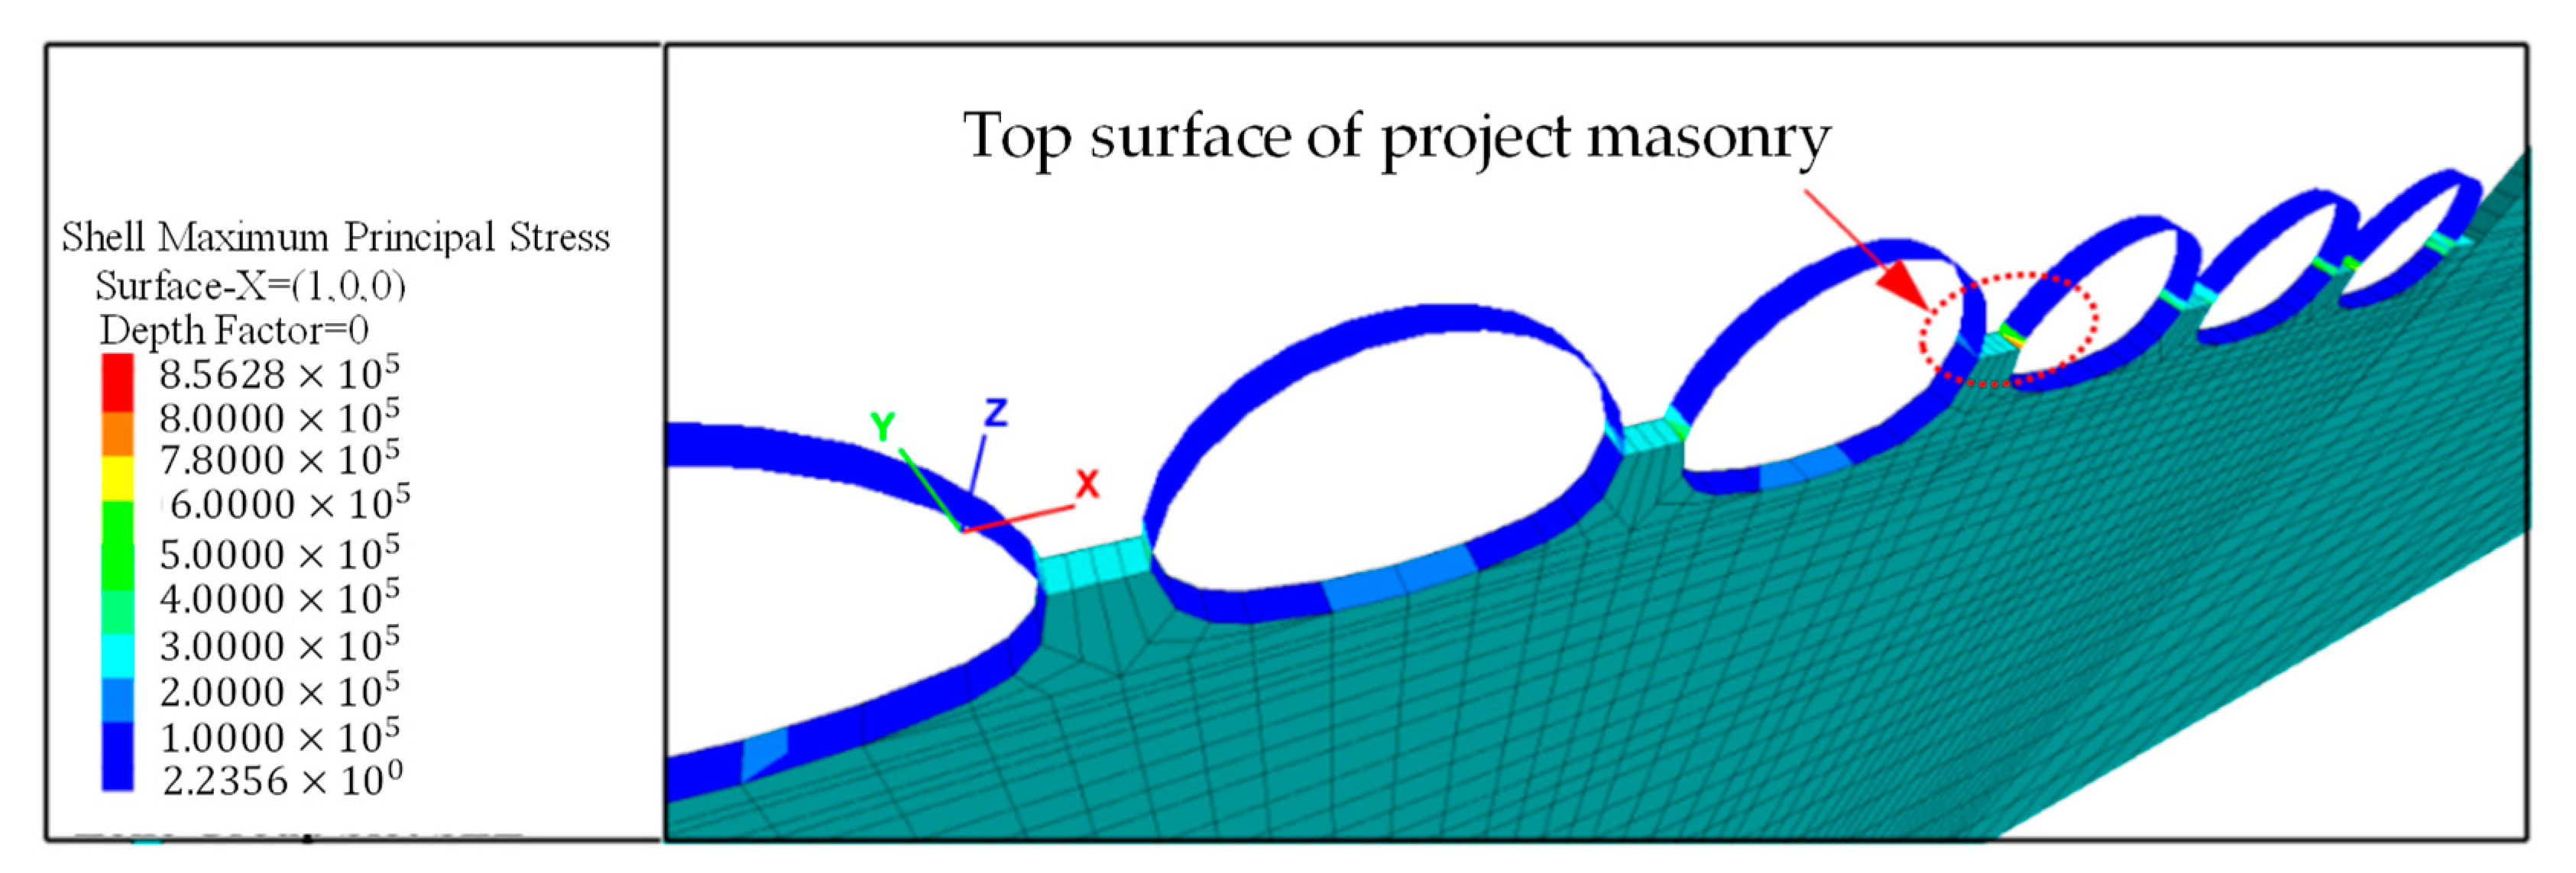
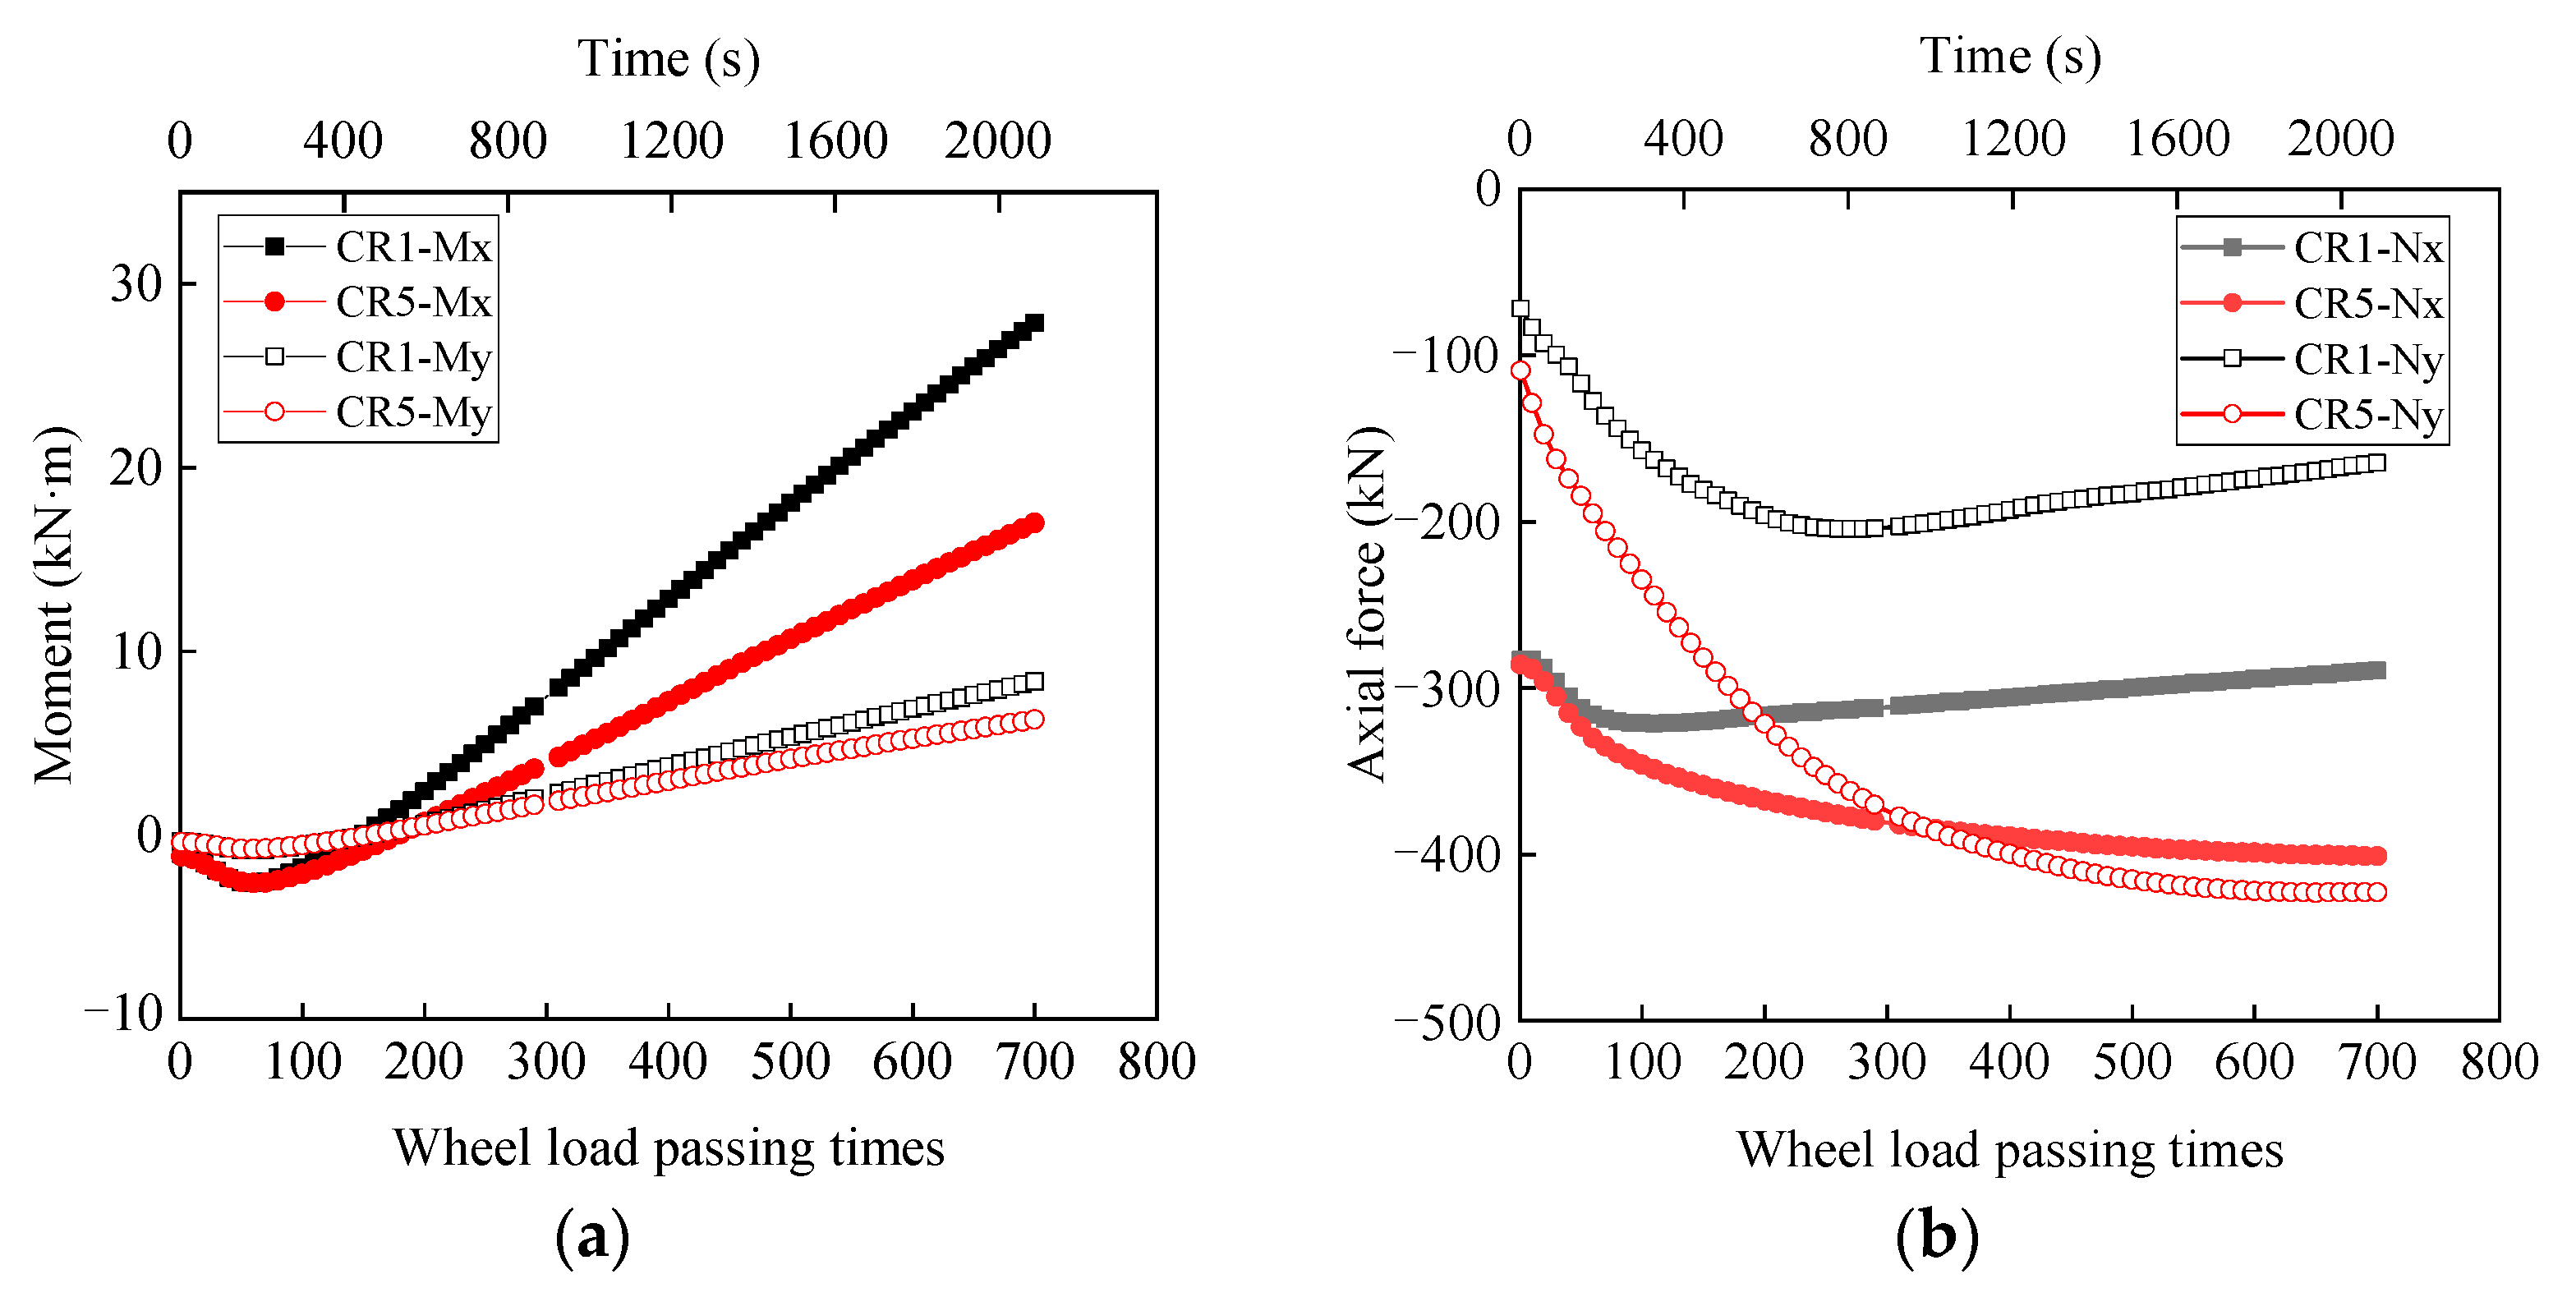
4.2.2. Internal Force of Steel Corrugated Pipe Structure

Figure 26 shows the circumferential stress and maximum principal stress of the steel corrugated pipe when the wheel load passes 700 times. As shown in Figure 26a,b, a maximum circumferential stress of −6 MPa is observed in the vault, indicating that a large compressive stress is generated when the vault is settled. A maximum principal stress of 3 MPa appears at the arch’s waist. Due to the constraint of concrete masonry at the haunch, the deformation at the haunch is smaller than that at the vault. The stress cannot be effectively released, so the stress at the arch waist is the largest.
Figure 27 shows the variation in the bidirectional bending moment and axial force on the vault structure. The Mx represents the bending moment along the x-axis and the My represents the bending moment along the y-axis. As shown in Figure 27a, the negative bending moment represents pressure on the structure’s inner side of the vault, whereas the positive bending moment represents the opposite. Between PB0 and PB150, the bending moment Mx appears negative at the beginning. The bending moment decreases first and then increases. Finally, the bending moment becomes positive and increases linearly. When the bending moment decreases to a negative value, Mx has a little change. After the inflection point of the negative bending moment appears, CR1-Mx becomes greater than CR5-Mx, and the difference between the two becomes increasingly larger. This is because the CR1 settlement is larger, so the bending moment is larger. In PB700, CR1-Mx and CR5-Mx were 28 kN·m and 18 kN·m, respectively, with a difference of approximately 10 kN·m. Between PB0 and PB150, the bending moment My shows little change. It subsequently begins to grow linearly, but at a much smaller rate than Mx. The difference between CR1-My and CR5-My is small because the steel corrugated pipe vault is uniformly settled along the axis, and My is approximately 8 kN·m at PB700.
As shown in Figure 27b, the axial force represents the pressure at the thin-walled neutral plane of the structure, and negative values indicate compression. The Nx represents the axial force along the x-axis, and the Ny represents the axial force along the y-axis. The initial axial force Nx is greater than Ny. Because the structure is circumferential compression in the initial state, the force in the circumferential direction is small. Therefore, CR1-Nx is smaller than CR5-Nx. Combining the change in bending moment with the observation that CR1-Mx is greater than CR5-Mx at this point indicates that the deformation of structure CR1 is very large and bending deformation takes precedence, whereas the compression of the arch structure takes precedence at the CR5 position. The axial pressure is not excessively high because CR1 generates an overall settlement, according to the data analysis of CR1-Ny and CR5-Ny. However, CR5, as the edge of the motor vehicle lane and close to the sidewalk, does not generate an overall settlement. Therefore, the axial pressure increment in the y-direction is considerable.
Figure 28 summarizes the variation curves of the axial force around the steel corrugated back end and front end. The solid sign curve shows that the circumferential stress of the back-end pipe decreases rapidly from SP6 to SP1 in the order of SP6 > SP1 > WA1 > CR1 (the position of points can be seen in Figure 11b). It can be observed from Figure 21 that the structure cannot effectively transfer circumferential axial force down at the maximum bending deformation. Because the bending deformation between ST1 and C1 shows an inflection point. The circumferential axial force increases rapidly from SP1 to SP6. Because the bending deformation at this position is significant. However, owing to the lateral backfill constraints, the structure cannot produce large deformations and can only bear the circumferential axial force. The structure has played a significant role in the arch support. The hollow sign curve shows that the axial force around the pipe at the front-end decreases from large to small, that is, SP10 > CR5 > SP5 > WA5. The difference from the back end is that CR5-Nx does not change as much as CR1-Nx does, but continues to increase because the settlement at this position is small. That is because the structure is effective in compression.
The structure deformation at the back end is larger than that at the front end, which is more likely to cause structural damage when the material reaches its ultimate strength. Therefore, further analysis of the von Mises stress should be performed around the pipe at the A-end. Figure 29 shows that Mises stress was WA1 > SP6 > CR1 > SP1. The arch’s waist is the most susceptible to damage. The position of the arch waist is the boundary between the protection masonry and the backfill, and the lateral constraint stiffness is abrupt. Therefore, it is easy to cause structural stress concentration, resulting in a continuous increase in stress. The arch’s shoulder SP1 was the least likely to be damaged. Because this position can settle freely and differs from the arch’s evident bending after settling. After PB200, the von Mises stress of CR1 increased almost linearly, which may be due to the large settlement and evident bending of the vault. According to Code [33], the design value of the shear strength of the structural material was 175 MPa. The maximum calculated von Mises stress was 40 MPa (PB700), which was 23% of the design value.

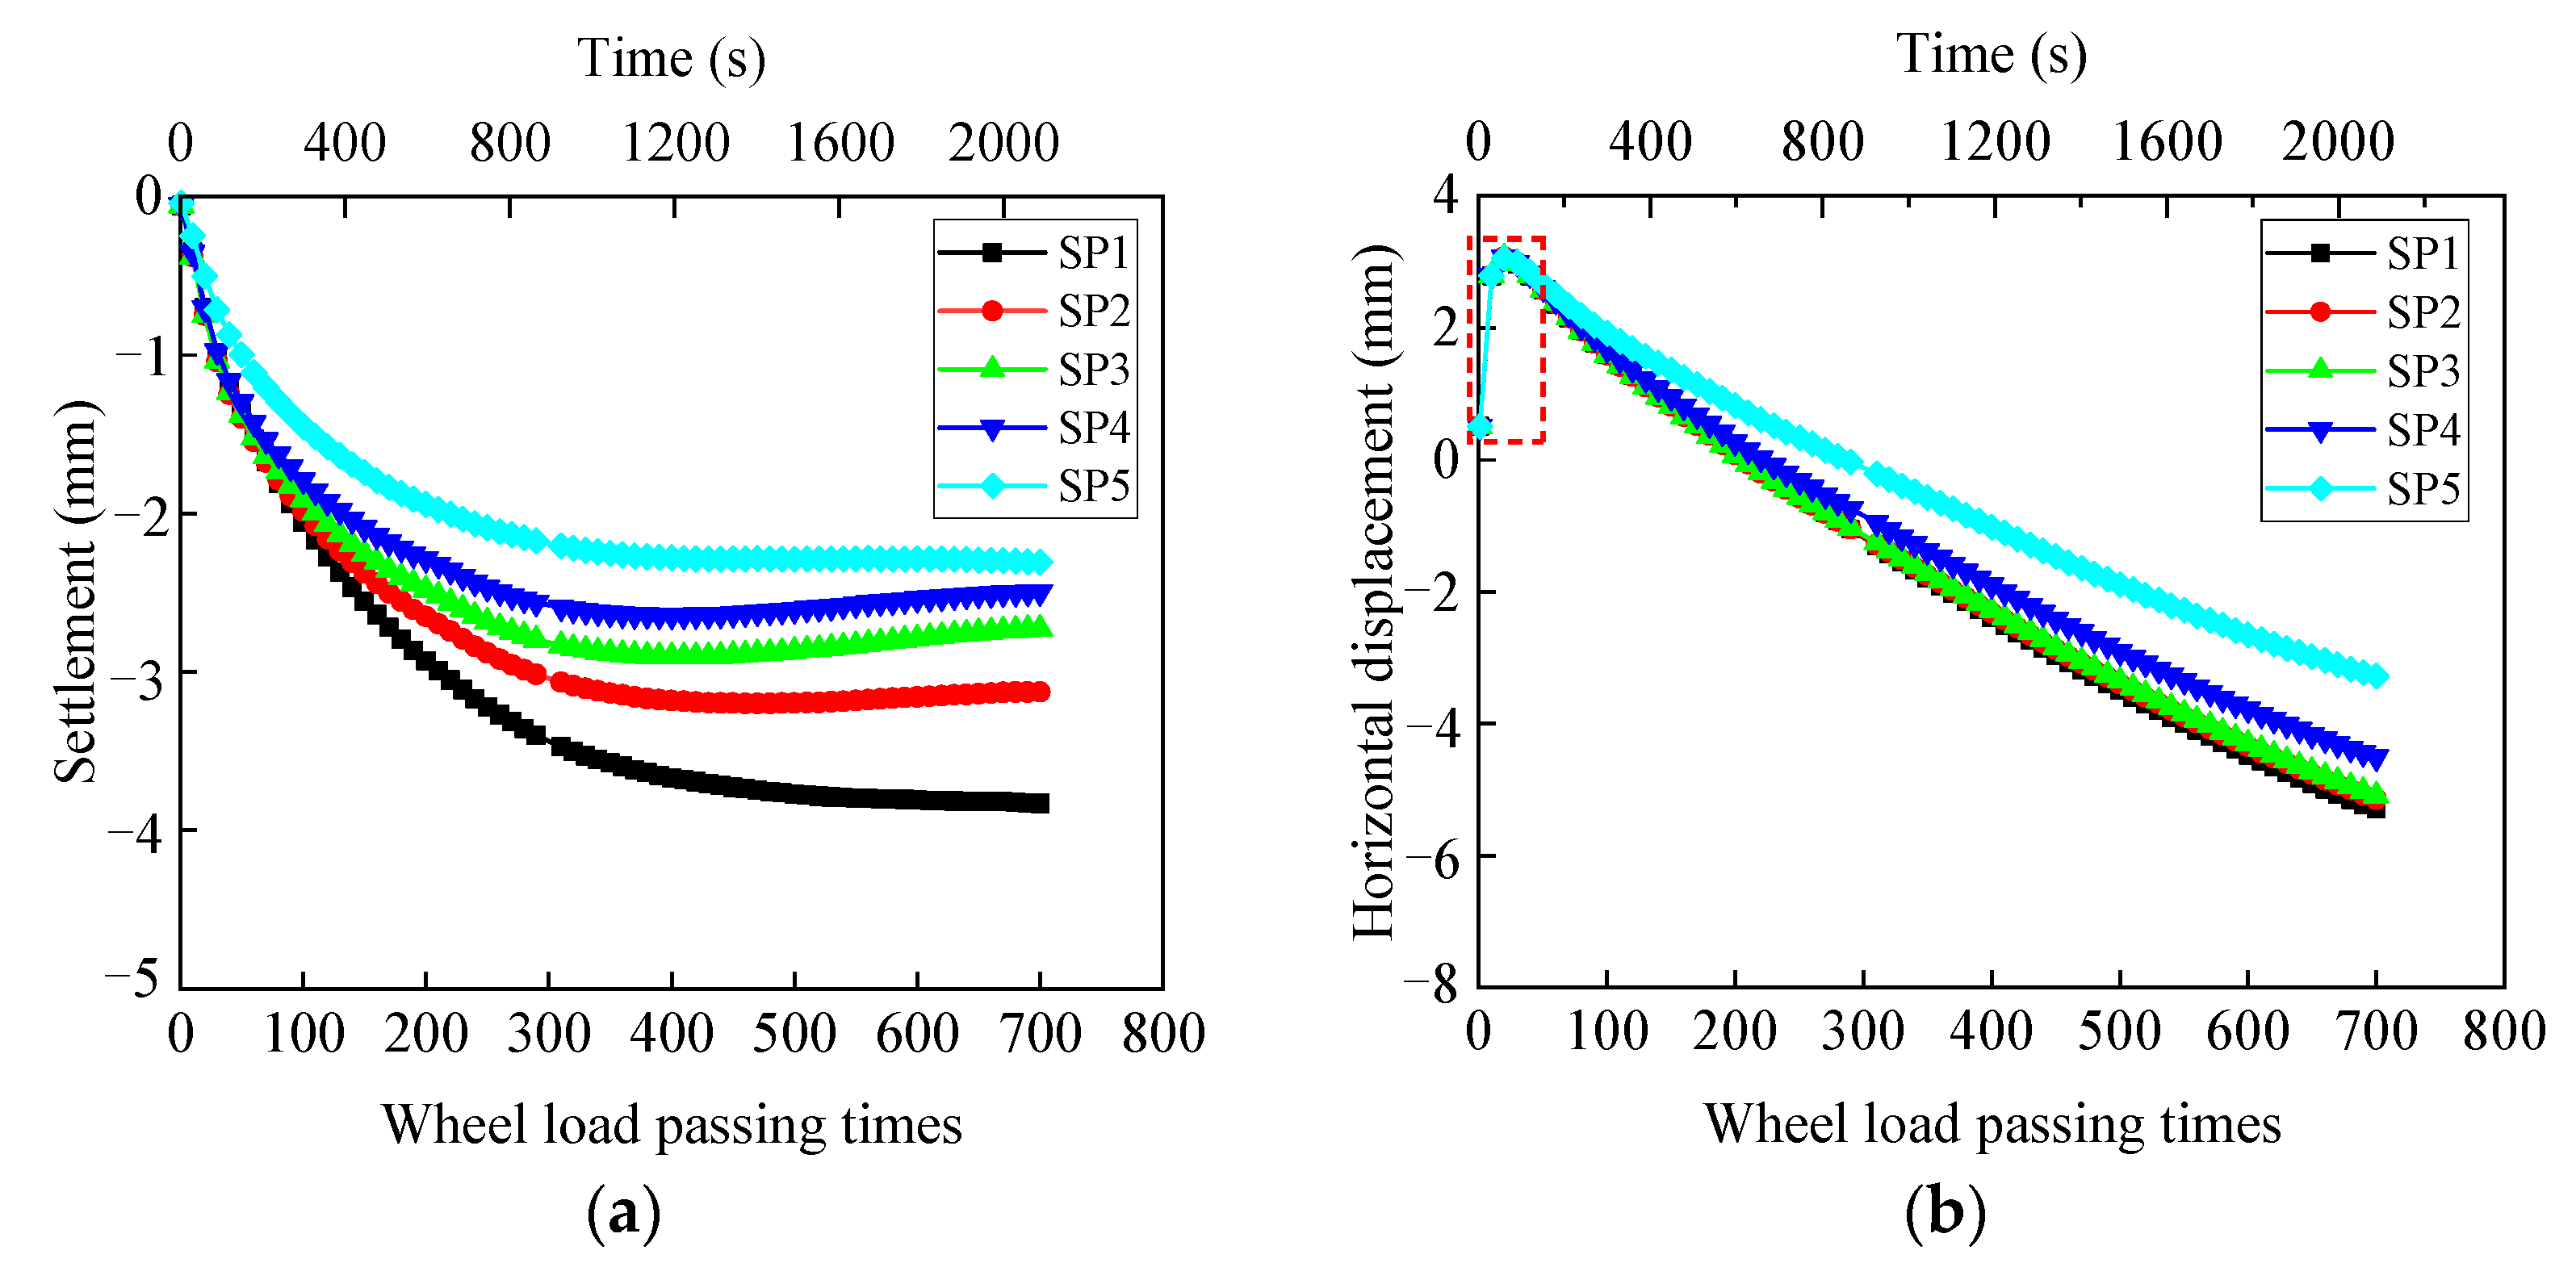
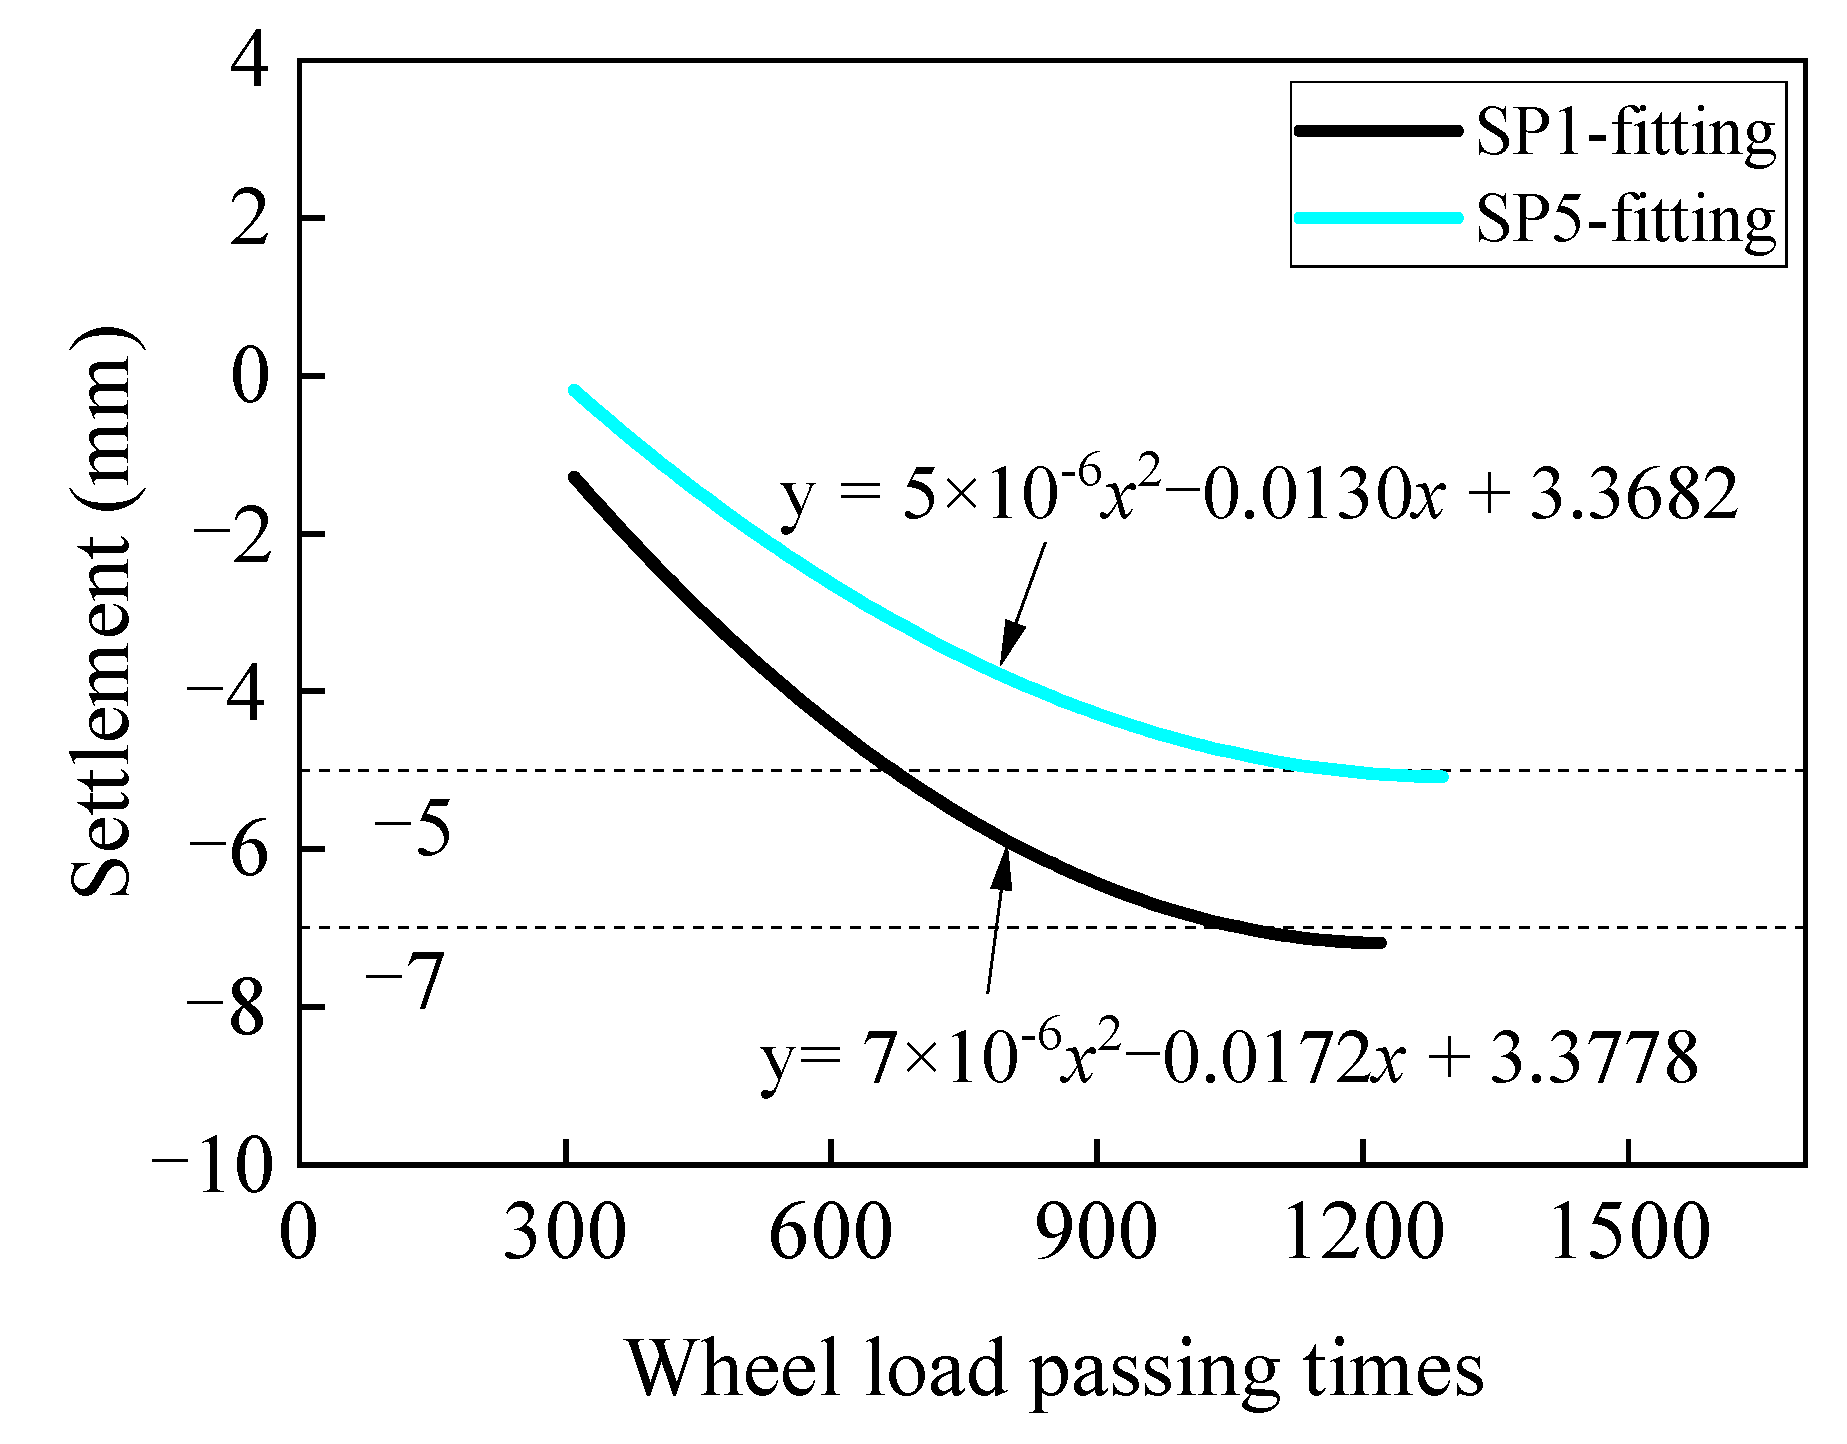
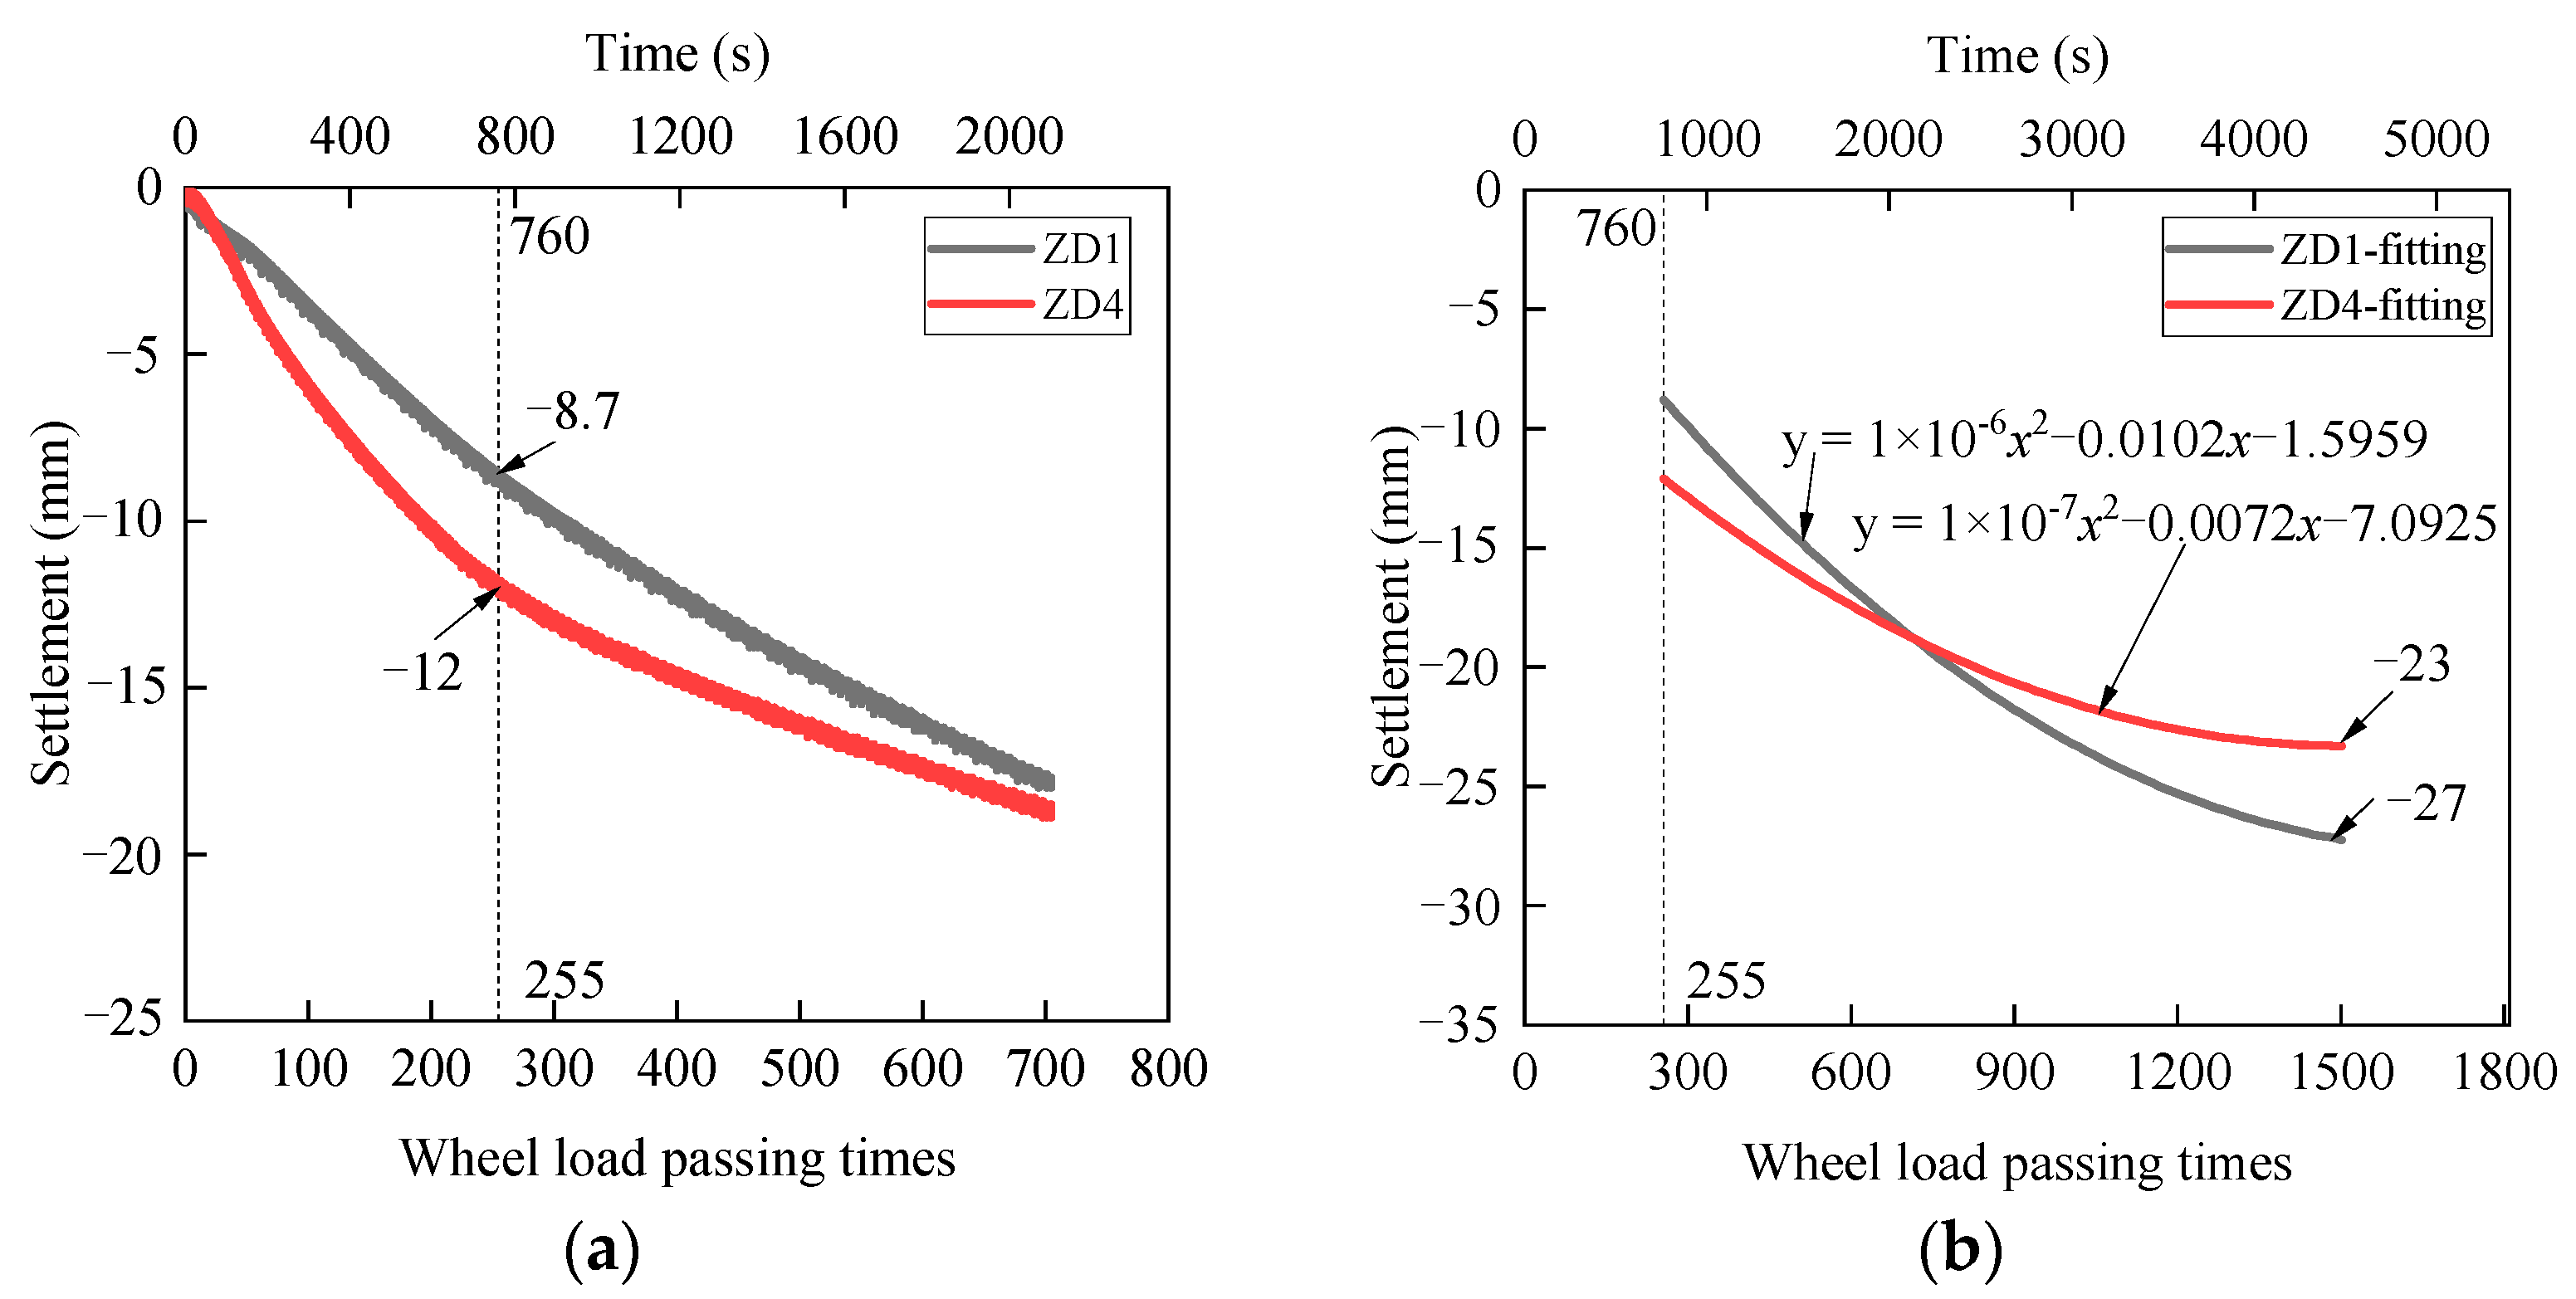
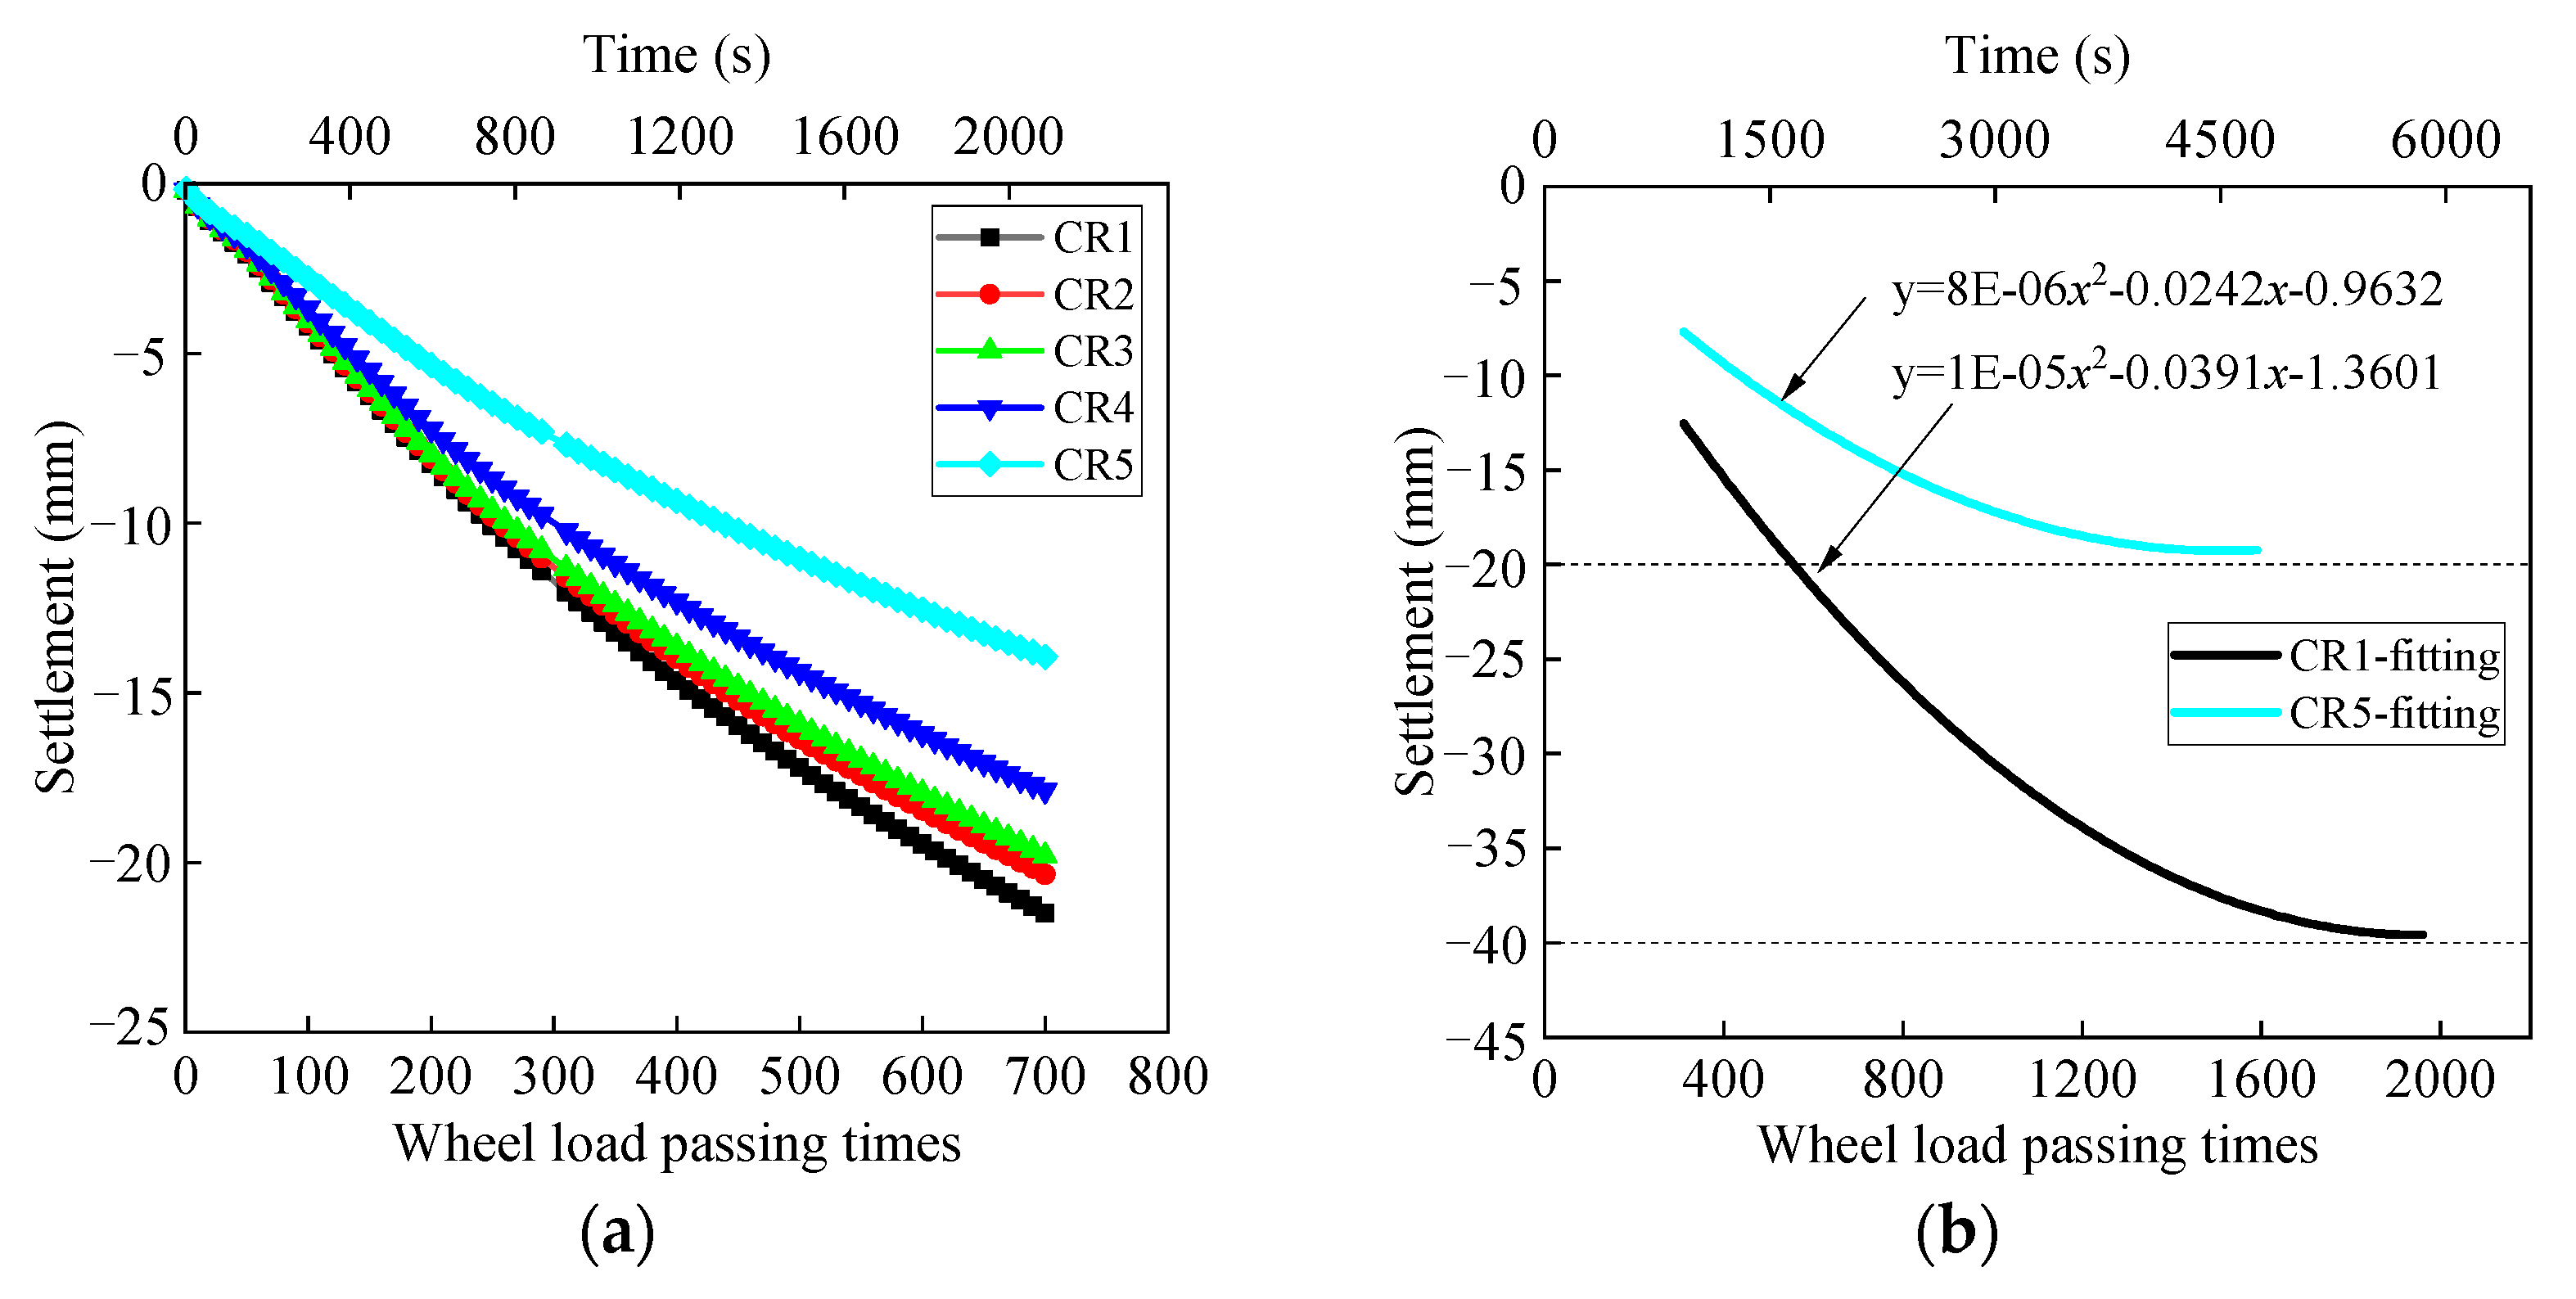
4.2.3. Settlement of Pavement of Steel Corrugated Pipe Arch Culvert

Figure 30a shows the change in pavement settlement over time. The settlement difference between ZD1 and ZD4 that reached the maximum was about 3.3 mm at PB255. For PB0–PB255, both the settlement value and settlement rate of ZD1 were lower than those of ZD4. After that, the settlement rates of ZD1 and ZD4 tended to decrease. But the settlement rate of ZD4 decreased significantly and was lower than that of ZD1. At PB700, the two curves are close to intersecting, and the settlement is approximately −18 mm. ZD1 and ZD4 represent the pavement settlement above the steel corrugated pipe vault and the soil between the arches, respectively. ZD4 is always lower than ZD1 before PB700, which may be due to the larger thickness of the backfill soil between the arches and the slightly larger settlement caused by compression deformation. To explore the stability value of the pavement settlement, a quadratic polynomial fitting was performed on the two curves. The data after PB255 (760 s) were used to improve the rationality of fitting. The fitting curves and corresponding polynomials are shown in Figure 30b. The figure shows that ZD1 and ZD4 are predicted to be stable at PB1500 when the settlements are −23 mm and −27 mm, respectively, with a difference of 4 mm.
Combined with the above analysis, the settlement rates of ZD1 and ZD4 decreased at approximately PB255. However, this settlement rate caused by the actual daily traffic volume is less than the calculated value. According to the simulation, the time required for structural deformation of the new steel corrugated pipe arch culvert bridge is quite short. Therefore, the foundation design and reinforcement scheme are safe for the engineering project.

5. Conclusions

In this study, numerical simulation was performed to predict and analyze the construction and operation safety of multiple steel corrugated pipe arch culverts. The study is divided into two parts: one is the numerical analysis of arch culvert construction. The other is the investigation of the influence of the dynamic cycle vehicle load on arch culverts. The following conclusions were drawn:
(1)
After construction, due to the influence of filling thickness, the settlement of the east side of the arch culvert is larger. The maximum settlement of the soil in the arch culvert area is at the junction of the two different arch culverts. The different structure sizes have caused the soil to be discontinuous and uneven in space, and the response to the load is greater. The maximum vertical deformation of the structure appears at the vault, and the arch waist is prone to stress concentration. Therefore, the vault and haunch need to be considered in the design stage.
(2)
The stress and deformation of the structure increase rapidly with an increase in the number of times the load passes through the steel corrugated pipe arch culverts and then stabilizes rapidly. The structure can reach the cooperative state of deformation with the soil in the initial stage of arch culvert operation. However, the subgrade soil between the arch culvert and the structure itself will produce some unrecoverable deformation or internal force accumulation.
(3)
After structural deformation, there is a relatively constant deformation point around the pipe. The vertical deformation of the left side of the structure at this point is opposite to that on the right side. In addition, the circumferential stress transformation point appears at the arch’s shoulder of the structure. From the vault to the arch’s waist, the circumferential stress first increases gradually and then decreases gradually towards the arch’s waist after reaching its maximum at this point.
(4)
Although the arch’s crown had a large vertical deformation, the von Mises stress of the arch’s waist increased rapidly and was highest. Based on the fourth strength criterion, the arch’s waist is the most dangerous for structural damage. Therefore, utmost care must be taken during the design and construction.
The span of the steel corrugated pipe structure, height of the arch fill, mesh, boundary of the calculation model, parameters of materials, and interaction between soils and structures may affect the calculation results. Field monitoring data should be collected for the verification of the analysis in the following study.

Author Contributions

Conceptualization, X.B. and X.C.; methodology, X.W.; validation, J.S., S.W. and H.C.; formal analysis, S.W.; investigation, X.W.; data curation, X.W.; writing—original draft preparation, S.W.; writing—review and editing, J.S., X.W.; supervision, X.B.; project administration, X.C.; funding acquisition, X.B. All authors have read and agreed to the published version of the manuscript.

Funding

This research was funded by the National Key R&D Program of China (Grant No. 2019YFC1511104), the National Natural Science Foundation of China (Grant No. 52090084), and the Technical Innovation Foundation of Shenzhen (Grant No. JCYJ20220531101214031).

Institutional Review Board Statement

Not applicable.

Informed Consent Statement

Not applicable.

Data Availability Statement

Not applicable.

Conflicts of Interest

The authors declare no conflict of interest.

References

  1. Che, H.B.; Tong, L.Y.; Liu, S.Y.; Yang, Q. Field investigation on the mechanical performance of corrugated steel utility tunnel (CSUT). J. Constr. Steel Res. 2021, 183, 106693. [Google Scholar] [CrossRef]
  2. Marquez, A.; Fazzini, P.G.; Otegui, J.L. Failure analysis of flexible metal hose at compressor discharge. Eng. Fail. Anal. 2009, 16, 1912–1921. [Google Scholar] [CrossRef]
  3. Korusiewicz, L.; Kunecki, B. Behaviour of the steel box-type culvert during backfilling. Arch. Civ. Mech. Eng. 2011, 11, 637–650. [Google Scholar] [CrossRef]
  4. Bian, X.C.; Tang, X.W.; Shen, W.M.; Ling, D.S.; Chen, Y.M. An Experimental Study on a Culvert Buried in Granular Soil Subjected to Vehicle Loads. Adv. Struct. Eng. 2012, 15, 1031–1040. [Google Scholar] [CrossRef]
  5. Beben, D. Field Performance of Corrugated Steel Plate Road Culvert under Normal Live-Load Conditions. J. Perform. Constr. Facil. 2013, 27, 807–817. [Google Scholar] [CrossRef]
  6. Abuhajar, O.; Newson, T.; El, N.H. Scaled physical and numerical modelling of static soil pressures on box culverts. Can. Geotech. J. 2015, 52, 1637–1648. [Google Scholar] [CrossRef]
  7. Beben, D. The Role of Backfill Quality on Corrugated Steel Plate Culvert Behaviour. Balt. J. Road Bridge Eng. 2017, 12, 1–11. [Google Scholar] [CrossRef]
  8. Wang, T.Y.; Tan, L.X.; Xie, S.Y.; Ma, B.S. Development and applications of common utility tunnels in China. Tunn. Undergr. Space Technol. 2018, 76, 92–106. [Google Scholar] [CrossRef]
  9. Yue, F.; Liu, B.W.; Zhu, B. Shaking table investigations on seismic performance of prefabricated corrugated steel utility tunnels. Tunn. Undergr. Space Technol. 2020, 105, 103579. [Google Scholar] [CrossRef]
  10. Kells, J.A. Hydraulic performance of damaged-end corrugated steel pipe culverts. Can. J. Civ. Eng. 2008, 35, 918–924. [Google Scholar] [CrossRef]
  11. Katona, M.G. Improved Methods for Simulating Live Loads for Two-Dimensional Structural Analysis of Buried Culverts. Transp. Res. Rec. 2019, 2673, 449–462. [Google Scholar] [CrossRef]
  12. Liu, B.D.; Sun, H.B.; Xu, W.B.; Shi, Y.F.; Zhang, B.C.; Yao, M.M. Research on the Law of Stress Development Along Backfilling Process Between Crest and Valley of Buried Corrugated Steel Pipe Culverts. Int. J. Steel Struct. 2021, 21, 142–153. [Google Scholar] [CrossRef]
  13. Sezen, H.; Yeau, K.Y.; Fox, P.J. In-Situ load testing of corrugated steel pipe-arch culverts. J. Perform. Constr. Facil. 2008, 22, 245–252. [Google Scholar] [CrossRef]
  14. Tehrani, A.D.; Kouchesfehani, Z.K.; Chimauriya, H.R.; Raut, S.; Najafi, M.; Yu, X.B. Structural evaluation of invert-cut circular and arch shape corrugated steel pipes through laboratory testing. Can. J. Civ. Eng. 2021, 48, 187–201. [Google Scholar] [CrossRef]
  15. Yeau, K.Y.; Sezen, H.; Fox, P.J. Simulation of Behavior of In-Service Metal Culverts. J. Pipeline Syst. Eng. Pract. 2014, 5, 04013016. [Google Scholar] [CrossRef]
  16. Chaallal, O.; Arockiasamy, M.; Godat, A. Numerical Finite-Element Investigation of the Parameters Influencing the Behavior of Flexible Pipes for Culverts and Storm Sewers under Truck Load. J. Pipeline Syst. Eng. Pract. 2015, 6, 04014015. [Google Scholar] [CrossRef]
  17. Hwang, J.H.; Kikumoto, M.; Kishida, K.; Kimura, M. Dynamic stability of multi-arch culvert tunnel using 3-D FEM. Tunn. Undergr. Space Technol. 2006, 21, 384. [Google Scholar] [CrossRef]
  18. Sawamura, Y.; Kishida, K.; Kimura, M. Centrifuge Model Test and FEM Analysis of Dynamic Interactive Behavior between Embankments and Installed Culverts in Multiarch Culvert Embankments. Int. J. Geomech. 2015, 15, 04014050. [Google Scholar] [CrossRef]
  19. Zhang, Y.; Liu, B.D.; Meng, L.W. Structural behavior and soil arching state of underground corrugated steel utility tunnel. J. Constr. Steel Res. 2023, 203, 107798. [Google Scholar] [CrossRef]
  20. JTGB01-2014; Technical Standard of Highway Engineering. China Communications Press Co., Ltd.: Beijing, China, 2014.
  21. Wadi, A.; Pettersson, L.; Karoumi, R. Flexible culverts in sloping terrain: Numerical simulation of soil loading effects. Eng. Struct. 2015, 101, 111–124. [Google Scholar] [CrossRef]
  22. Yang, W.; Hussein, M.F.M.; Marshall, A.M. Centrifuge and numerical modelling of ground-borne vibration from an underground tunnel. Soil Dyn. Earthq. Eng. 2013, 51, 23–34. [Google Scholar] [CrossRef]
  23. Uddin, K.; Balasubramaniam, A.S.; Bergado, D.T. Engineering behavior of cement-treated Bangkok soft clay. Geotech. Eng. 1997, 28, 89–119. [Google Scholar]
  24. Lee, F.H.; Lee, Y.; Chew, S.H.; Yong, K.Y. Strength and modulus of marine clay-cement mixes. J. Geotech. Geoenviron. Eng. 2005, 131, 178–186. [Google Scholar] [CrossRef]
  25. Lorenzo, G.A.; Bergado, D.T. Fundamental Characteristics of Cement-Admixed Clay in Deep Mixing. J. Mater. Civ. Eng. 2006, 18, 161–174. [Google Scholar] [CrossRef]
  26. Ren, R.B.; Geng, L.T.; Qi, W.Y. Analysis of the Dynamic Response for Saturated Asphalt Pavement under Moving Vehicle Loads by Three-Dimensional Finite Element Method. Appl. Mech. Mater. 2011, 97, 305–310. [Google Scholar] [CrossRef]
  27. Kuhlmeyer, R.L.; Lysmer, J. Finite element method accuracy for wave propagation problems. ASCE Soil Mech. Found. Div. J. 1973, 99, 421–427. [Google Scholar] [CrossRef]
  28. Cui, X.Z. Dynamic Numerical Analysis of Antimoisture-Damage Mechanism of Permeable Pavement Base. Int. J. Geomech. 2010, 10, 230–235. [Google Scholar] [CrossRef]
  29. Liu, P.F.; Wang, D.W.; Otto, F.; Oeser, M. Application of semi-analytical finite element method to analyze the bearing capacity of asphalt pavements under moving loads. Front. Struct. Civ. Eng. 2018, 12, 215–221. [Google Scholar] [CrossRef]
  30. TB 10001-2016; Code for Design of Railway Earth Structure. China Communications Press Co., Ltd.: Beijing, China, 2016.
  31. Wadi, A.; Pettersson, L.; Karoumi, R. Flexible culverts in sloping terrain: Numerical simulation of avalanche load effects. Cold Reg. Sci. Technol. 2016, 124, 95–109. [Google Scholar] [CrossRef]
  32. DBJT45-T 014-2020; Technical Guide for Design and Construction of Highway Steel Corrugated Pipe Culverts. Guangjsih Bouxcuengh Swcigih Guauhdungh Yinsuh Dingh: Nanning, China, 2020.
  33. GB 50017-2017; Standard for Design of Steel Structures. Ministry of Housing and Urban-Rural Development of the People’s Republic of China: Beijing, China; China Architecture Publishing & Media Co., Ltd.: Beijing, China, 2017.
Figure 1. Road section diagram.
Applsci 13 09441 g001
Figure 2. Schematic diagram of culvert and strata distribution across lake section.
Applsci 13 09441 g002
Figure 3. Schematic diagram of foundation treatment plan across lake section.
Applsci 13 09441 g003
Figure 4. Site mixing pile reinforcement of foundation profile.
Applsci 13 09441 g004
Figure 5. Schematic of plane model.
Applsci 13 09441 g005
Figure 6. Distribution of soil stress (unit: Pa).
Applsci 13 09441 g006
Figure 7. Distribution of pore pressure (unit: Pa).
Applsci 13 09441 g007
Figure 8. Three-dimensional finite-element model.
Applsci 13 09441 g008
Figure 9. Standard load value of first-class highway vehicle.
Applsci 13 09441 g009
Figure 10. The time–history curve of a single vehicle load.
Applsci 13 09441 g010
Figure 11. Data recording points: (a) Road surface, subgrade, and foundation; (b) Steel corrugated pipe construction.
Applsci 13 09441 g011
Figure 12. Settlement contour (unit: mm).
Applsci 13 09441 g012
Figure 13. Horizontal displacement contour (unit: mm).
Applsci 13 09441 g013
Figure 14. Vertical stress recording curve (unit: Pa).
Applsci 13 09441 g014
Figure 15. Post-construction vertical stress contour (unit: Pa).
Applsci 13 09441 g015
Figure 16. Post-construction pore pressure contour (unit: kPa).
Applsci 13 09441 g016
Figure 17. Post-construction vertical deformation contour of structure (unit: mm).
Applsci 13 09441 g017
Figure 18. Post-construction horizontal deformation contour of structure (unit: mm).
Applsci 13 09441 g018
Figure 19. Post-construction contour of maximum principal stress of steel corrugated pipe.
Applsci 13 09441 g019
Figure 20. Displacement contour of steel corrugated pipe (unit: mm, PB represents the number of wheel load passing the arch culvert): (a) PB700 vertical deformation; (b) PB700 horizontal deformation.
Applsci 13 09441 g020
Figure 21. Profile of 5-hole steel corrugated pipe before and after deformation (magnification: 50 times).
Applsci 13 09441 g021
Figure 22. Vault settlement curve: (a) Numerical simulation results; (b) Fitting results.
Applsci 13 09441 g022
Figure 23. Deformation curve of the arch’s shoulder (upper): (a) Settlement; (b) Lateral displacement.
Applsci 13 09441 g023
Figure 24. Fitting curve of lateral displacement of arch’s shoulder.
Applsci 13 09441 g024
Figure 25. Arch’s shoulder (lower) deformation curve: (a) Settlement; (b) Lateral displacement.
Applsci 13 09441 g025
Figure 26. Structure internal force contour: (a) PB700 circumferential stress; (b) PB700 maximum principal stress.
Applsci 13 09441 g026
Figure 27. The variation curve of internal forces in the vault: (a) Moment: Mx, My; (b) Axial force: Nx, Ny.
Applsci 13 09441 g027
Figure 28. Curve of axial force variation around pipe.
Applsci 13 09441 g028
Figure 29. Mises stress curve.
Applsci 13 09441 g029
Figure 30. Settlement of road surface and vault: (a) Numerical simulation; (b) Polynomial fitting.
Applsci 13 09441 g030
Table 1. Parameters of steel corrugated pipe (unit: m).
TypeThicknessHigh × SpanSteel TypeH1H2R1R2R3
See Figure 3 for Parameter Meanings
Other holes0.007756.21 × 8.7Q345 steel0.4412.8054.4712.00710.667
4–9 holes0.009757.77 × 11Q345 steel0.5613.5255.6152.52712.617
Table 2. Physical and mechanical parameters of foundation.
Foundation Name (ID)Unit Weight γ (kN/m3)Cohesion C (kPa)Internal Friction Angle φ (°)Poisson Ratio vCompression Modulus Es (MPa)Deformation Modulus E0 (MPa)
Fill (①)18.820100.43.5-
Mud (②1)16.56.83.40.352.4-
Silty clay (②2)19.724.711.20.325.7-
Medium sand (②3)19.2030.00.2515.012.0
Mealy sand (②4)18.8026.00.25-8.0
Silty clay (③1)19.535.013.00.326.57.0
Medium-coarse sand (③2)19.8032.00.25-13.0
Fully weathered shaly sand (④1)19.835.020.00.358.060.0
Fully weathered sandstone (④2)20.015.035.00.35-60.0
Strong weathering muddy sand (⑤1)21.040.025.00.2812.080.0
Strong weathering sand (⑤2)21.220.040.0--80.0
Strong weathering tuff rock (⑤3)21.030.035.0--80.0
Table 3. Equivalent parameters of composite foundation.
Stratat (m)Es (kPa)vE0 (MPa)Ei (MPa)αi (%)E0c (MPa)E0m (MPa)
Ar A ¯ rAr A ¯ rAr A ¯ r
15.02.40.41.14907259353287338275
26.45.70.42.72457259177144
32.815.00.37.09457259682556
Note: t is the average thickness; Es is the compression modulus; v is the Poisson ratio; E0 is the deformation modulus; Ei is the deformation modulus of mixing pile; αi is the replacement rate; E0c is the Comprehensive deformation modulus of treated layer; Ar is the metro-reinforced areas; A ¯ r is the non-metro-reinforced areas.
Table 4. Physical and mechanical parameters of natural and composite strata.
StrataDry Density
ρd (g/cm3)
Cohesion
C (kPa)
Internal Friction Angle
φ (°)
Compression Modulus
Es (MPa)
Deformation Modulus
E0 (MPa)
Poisson Ratio
v
Permeability Coefficient
K (cm/s)
Porosity
n
Natural strata
1.6020.010.03.5/0.402.0 × 10−30.33
11.106.83.402.4/0.351.0 × 10−70.50
21.5024.711.25.7/0.326.0 × 10−50.40
31.800.030.015.012.00.252.4 × 10−20.33
11.7840.025.0/80.00.281.0 × 10−30.30
Composite strata
11.2820920.0/2870.351 × 10−70.50
21.6810412.8/1440.321 × 10−70.50
31.8332434.0/5560.251 × 10−70.50
Note: Elastic modulus E is used in the finite-difference program calculation (FLAC3D), and E = 3Es is taken as a reference for engineering experience E = (2~5) Es. In the calculation, a foundation with a permeability coefficient K ≤ 105 (cm/s) is regarded as an impervious layer.
Table 5. Parameters of arch culvert materials used in simulation.
Material TypeDensity
ρ (g/cm3)
Cohesion
C (kP)
Internal Friction Angle
φ (°)
Deformation Modulus
E0 (MPa)
Elastic Modulus
E (GPa)
Poisson Ratio
v
C15 concrete protects masonry2400///220.2
C20 concrete foundation2400///250.2
Asphalt concrete pavement2400///1.40.35
Backfill or stratigraphic gravel soil1900030123E00.3
Note: Reference for value [26].
Table 6. Parameters of steel corrugated pipe and liner used in simulation.
Steel Corrugated Pipe TypeMaterial Density
ρ (g/cm3)
Equivalent Density
ρ1 (g/cm3)
Equivalent Thickness
t (mm)
Elastic Modulus
E (GP)
Poisson Ratio
v
4–9 holes7.851.411702060.3
Other holes7.851.171652060.3
Disclaimer/Publisher’s Note: The statements, opinions and data contained in all publications are solely those of the individual author(s) and contributor(s) and not of MDPI and/or the editor(s). MDPI and/or the editor(s) disclaim responsibility for any injury to people or property resulting from any ideas, methods, instructions or products referred to in the content.

