Abstract
Intrusion Detection Systems (IDS) still prevail as an important line of defense in modern computing environments. Cloud environment characteristics such as resource sharing, extensive connectivity, and agility in deploying new applications pose security risks that are increasingly exploited. New technologies like container platforms require IDS to evolve to effectively detect intrusive activities in these environments, and advancements in this regard are still necessary. In this context, this work proposes a framework for implementing an IDS focused on container platforms using machine learning techniques for anomaly detection in system calls. We contribute with the ability to build a dataset of system calls and share it with the community; the generation of anomaly detection alerts in open-source applications to support the SOC through the analysis of these system calls; the possibility of implementing different machine learning algorithms and approaches to detect anomalies in system calls (such as frequency, sequence, and arguments among other type of data) aiming greater detection efficiency; and the ability to integrate the framework with other tools, improving collaborative security. A five-layer architecture was built using free tools and tested in a corporate environment emulated in the GNS3 software version 2.2.29. In an experiment conducted with a public system call dataset, it was possible to validate the operation and integration of the framework layers, achieving detection results superior to the work that originated the dataset.
1. Introduction
The use of containers and other tools associated with Development and Operations (DevOps) has caused a cultural shift in the way IT teams work in the corporate environment [1]. To meet the needs resulting from this new process of building, deploying, and managing the life cycle of applications, container technology has grown in adoption not only among large cloud providers, but also in various companies and government agencies. Tools for task management and automation have also been introduced for the orchestration of a massive volume of containers running on multiple computers distributed in clusters with great computational power [2]. Thus, this change that ranges from the application development cycle to the technological infrastructure that supports this operation has made institutions adapt to become true providers of private cloud, which according to [3], provide services that have essential characteristics such as on-demand self-service; broad network access; resource pooling; rapid elasticity; and measured service.
Malware refers to a code segment crafted with the intention of inflicting damage upon or undermining the operations of a computer system. It serves as a broad term encompassing viruses, spyware, trojans, adware, and various other forms of malicious code [4]. According to IBM’s X-Force Threat Intelligence Index 2022 security report, malware is shifting its target from generic Linux systems to Docker containers and other container platforms [5]. In the ENISA Threat Landscape 2022 threat report, it was observed that the advent of COVID-19 has accelerated the adoption of cloud services in support of organizational business processes. As cybercriminals follow technology trends, it is not surprising that they are targeting cloud environments [6]. Furthermore, the same report states that attack vectors for cloud environments include the exploitation of misconfigured container images as well as misconfigured Docker containers and Kubernetes clusters. Another study published by [7] demonstrated that on average, over 180 vulnerabilities were found in versions of official and community container images hosted on DockerHub, one of the main repositories for container images available on the Internet. In addition, due to the sharing of resources on the same host operating system, the attack surface on hosts running multiple containers is expanded [2].
A computer system intrusion refers to any series of actions aimed at compromising the integrity, confidentiality, or availability of a resource [8]. By monitoring the events occurring in a computer system or network, an Intrusion Detection System (IDS) searches for signs of possible incidents that may be caused by malware, attackers gaining unauthorized access to systems from the Internet, or authorized users of systems who misuse their privileges [9]. IDS have been employed to ensure an adequate level of security for computational environments and are an important source of information for the Security Operations Center (SOC) team. However, with the evolution of these environments and the use of new technologies, security flaws, threats, and risks of attacks targeting these technologies emerge as new challenges for intrusion detection. In this sense, approaches focused on container platforms have been neglected and advances in this context are still sparse [10,11,12]. Moreover, the high computational cost of host-based intrusion detection remains a challenge in the face of the large volume of system calls generated [13]. Additionally, the main known datasets have numerous deficiencies such as obsolescence due to age, lack of volume, absence of complementary data, and most are not focused on container system calls [14,15,16,17,18]. Finally, False Positive Rate (FPR) and Detection Rate (DR) need to be improved in host-based intrusion detection systems based on system calls [13,19].
Given this scenario, cybersecurity precautionary measures are necessary and require network administrators and security teams to propose current solutions to detect and remediate possible security breaches in a heterogeneous and constantly evolving computational environment. In this work, a framework containing a reference architecture for implementing a HIDS (Host-based Intrusion Detection System) focused on container platforms is proposed. The choice to use a HIDS architecture (rather than antivirus) is due to its non-invasive approach in containers, as it assesses the normality or abnormality of the communication between the container and the operating system through system calls. We aimed (1) to reduce the processing overhead caused by intrusion detection on the nodes of a Kubernetes cluster; (2) to develop a reference architecture for implementing a distributed HIDS targeting container orchestration platforms with free or open-source tools; (3) to enable the generation of datasets with system calls from containerized applications; and (4) to provide alerts for SOC decision-making in the event of anomalies in containerized applications detected through machine learning techniques.
It should be noted that, as an Intrusion Detection System, no automated actions are taken when an alert occurs. Therefore, as an improvement to the framework, automated response actions can be developed to interrupt the propagation and continuation of an attack in the containerized environment. Additionally, an anomaly in a sequence of system calls invoked by a container does not provide high-level information that immediately leads to the origin of the access causing such anomaly in the application. Moreover, it is also important to state that a trained machine learning model for anomaly detection is typically specific to the behavior of a single application. Therefore, if multiple applications are desired to be monitored, a specific machine learning model must be trained and used for the behavioral analysis based on system calls for each application.
2. Related Works
Over the last years, several studies have been conducted aiming at improving Intrusion Detection Systems and the security of cloud computing environments. However, many challenges still lack a definitive solution and require advances that address the existing gaps in this research field. Due to the ability to detect new attacks by anomaly-based IDSs, the state-of-the-art literature on anomaly detection techniques used in HIDSs will be addressed in this work.
In the literature review works [16,20], as well as in the intrusion detection study [21], it was found that current cloud environment IDSs suffer from low Detection Rate (DR), high False Positive Rate (FPR), and False Alarm Rate (FAR), as well as operational costs. According to [20], one of the main limitations of current intrusion detection technology is the need to reduce the FAR so that security teams are not confused with this type of information. According to [16], the evolution of malware and the increasing sophistication of attacks aimed at circumventing existing protection mechanisms represent a critical challenge in the design and implementation of IDSs. In accordance with [21], the detection of zero-day attacks, True Negative Rates (TNR) and FPR, computational overhead, and real-time detection remain a problem for IDSs. Thus, ref. [21] highlights that it is important for researchers to continue working to develop better systems and algorithms to minimize the effects of these problems, as well as ensuring good performance. Similarly, ref. [15] emphasizes that research to optimize IDSs for increased security and reduced overhead is necessary.
Corroborating the understanding of [15,20,21] states that the main disadvantage of anomaly detection is precision, notably, these techniques suffer from a higher number of false alarms. Ref. [13] also highlights that speed and accuracy in detection are generally difficult to balance well. Another aspect raised by [13,17] is that the performance evaluation metrics of techniques used in many studies are not consistent. In other words, different metrics and datasets are used, making it difficult to compare results between studies since there is no standardization.
In the literature review article on system call-based HIDS, ref. [13] does not specifically address the intrusion detection scenario in container environments. However, important contributions and directions can be obtained from the study. Among them, a discussion on the main limitations and indications of future work in this research area are raised. As the main research trends in the context of HIDS, ref. [13] lists the following issues: reducing FAR, improving DR, and enhancing collaborative security.
Regarding container environments, ref. [10,11] state that intrusion detection has been widely used in multiple contexts, however, its application to containers is still sparse and has been neglected. The same observation is highlighted by [12], who states that while many IDSs have been introduced to ensure the security of VM-based cloud environments, few efforts have been directed towards container security in the cloud. According to [22], the dynamic nature of the development and operation of containerized applications makes it difficult to secure these environments. Thus, ref. [22] considers the development of intrusion detection systems with ML techniques for active container detection and analysis systems as an area for future research.
In two studies, [23,24], published by the same authors, it was demonstrated that factors such as the difficulty of altering a container to monitor it, especially when critical applications are running, make an HIDS the most appropriate detection system for containers. Additionally, multi-tenancy characteristics of container environments, where the kernel of the same OS is shared by multiple containers, make the host a potential target for attacks. As a result of these studies, an HIDS was implemented to detect anomalies in the behavior of containers by monitoring the system calls between the container process and the host kernel. To do so, the technique known as Bag of System Calls (BoSC), proposed by [25], was used for anomaly detection.
The study presented by [24] was continued in [12], where a Resilient IDS (RIDS) was developed for container-based clouds. The RIDS uses an intelligent real-time behavior monitoring mechanism to detect malicious containers and a defense approach that can migrate containers at runtime to a quarantine zone, aiming to minimize the spread of an attack. Results showed that this RIDS efficiently detected and migrated containers of malicious applications, ensuring secure container operation. The Moving Target Defense (MTD) approach, which is a novel contribution of this study, makes it possible to defend the target while it is moving.
In [10], an analysis of anomaly detection algorithms in containerized environments was carried out using the Sequence Time-Delaying Embedding (STIDE) and BoSC algorithms. Both algorithms showed potential for intrusion detection. However, the analysis was limited to the learning performance of the algorithms, and the authors recommended evaluation tests of state-of-the-art intrusion detection algorithms for future work. According to the authors of [10], “These experiments are still in their infancy since there are no available datasets for intrusion detection in containers.”
One recurring problem mentioned in many works such as [13,18,26,27,28,29] is the processing overhead associated with anomaly detection. The high volume of data and complexity of the techniques involved in the analysis often results in a performance penalty for monitored systems or compromises detection effectiveness.
According to [13], due to the rapid development of techniques and data center facilities, HIDS have recently faced the well-known Big Data challenge. High FPR poses a challenge for HIDS, and new system call records are being generated with the emergence of new applications. Thus, traditional mining methods and database management systems on a single host may not be able to handle the massive amount of system calls efficiently. As per [13], most traditional HIDS perform intrusion analysis on an independent host with a standalone detection software installed, and there is no interaction between HIDS installed on different hosts. Since HIDS only have databases of normal or known behaviors, new sets of normal system calls that do not conform to databases or models may be mistakenly reported as anomalies.
In the study conducted by [19], several impediments to implementing a standalone IDS were found. According to the research, high FPR left the system unable to detect zero-day attacks in real-time. According to [13,19], traditional HIDS based on system calls cannot achieve robust performance as expected. Thus, several works in this area are in progress and have ample scope for future development.
Another limitation in the field involves the outdated datasets currently available for IDS development. According to [14,15,16,17,18,29], the main known datasets have numerous deficiencies such as obsolescence due to age, lack of volume, absence of complementary data, and most of them are not focused on container system calls. In the work developed by [15], some of the main public datasets available with useful host data for a HIDS were listed and organized. The description, characteristics, and limitations of each dataset were compiled to facilitate use and research in the field. In order to address this gap involving datasets, ref. [14] proposes a methodology for generating new datasets that may be useful in the context of intrusion detection.
Among the most recent works on HIDS focused on anomalies in system calls, there are many approaches used for intrusion detection. Intrusion detection through the sequence of system calls was first presented in 1996 by [30] and is still used in conjunction with probabilistic analysis techniques in works such as [28], as well as neural networks in [18]. Other works such as [12,26,27,31] use approaches based on the analysis of system call frequency, and joint use with neural networks is also possible, as in [32].
In the study conducted by [28], a real-time HIDS was proposed for detecting malicious applications running in Docker containers. For detection, system call analysis was also used, but using an approach with system call n-grams and their probability of occurrence. In this research, sequential analysis of system calls was preferred over frequency-based analysis used by BoSC, with the belief that the latter would be less accurate. In the experiments conducted in this study, anomaly detection accuracy ranged from 87 to 97%.
The BoSC algorithm uses an approach based on the analysis of system call frequency and requires less computational effort. However, general trends indicate that although sequence-based system call models are computationally more expensive, they offer better detection [15]. It is also noteworthy that with the popularization of labeled datasets, several researches have emerged comparing IDSs and testing many machine learning algorithms [15]. Different machine learning techniques have been applied in HIDSs to improve detection performance, aiming at increasing precision and reducing FPR. However, less emphasis is given to the practical implementation of a HIDS for real-time detection [26].
Regarding scenarios where container orchestration platforms are used as production environments, there are few studies on the implementation of HIDS based on system call anomalies developed so far [33]. In the work of [32], a distributed learning framework was developed aiming at building application-based detection models through neural networks. However, it is known that the system implemented on each host of the container platform generates computational overhead that competes with the actual workload of applications, and this overhead was not considered [33].
In [34], a HIDS focused on a Kubernetes cluster was proposed with anomaly detection through supervised learning neural networks and four categories of system calls. Although the system is capable of monitoring the various hosts of the cluster and performing detection in an external component, filtering rules based on a limited set of system calls may restrict the scope of attack detection [33]. Another aspect concerns the limitation regarding the lack of analysis of reported anomalies and the need for developing own subcomponents such as a web portal and a Restful API service for IDS implementation [33].
In comparison to existing works in the area, the proposed framework enhances the IDS implementation in container platforms with regards to a distributed and scalable architecture built using open-source tools. The layered architecture is feasible to changes and integration with other security systems. Additionally, detailed information on how the implementation can be done in conjunction with the related configuration and codes are made available through a public repository.
The Table 1, summarizes the related works on Intrusion Detection Systems and the security of cloud computing environments topics with the key contributions and limitations in comparison to this paper.

Table 1.
Related works on Intrusion Detection Systems and the security of cloud computing environments topics and our new contributions.
3. Materials and Methods
The methodology used to conduct this work began with a bibliographic survey of the state of the art regarding Intrusion Detection Systems and their application to containerized environments. From the related literature, limitations and gaps not yet explored by studies were identified and some of them were defined as research targets to be addressed by this work. The main IDS implementations and intrusion detection techniques from the state of the art were studied and served as a reference for the design of a framework containing an architecture for a HIDS based on the analysis of anomalies in system calls with a focus on container orchestration platforms, addressing some of the existing limitations in the research field.
For the implementation of the framework, the software used for emulating GNS3 networks was used and the topology of a corporate environment was built containing a cluster of orchestration of Kubernetes containers, multiple VLANs, in addition to a firewall, routers and switches. The proposed architecture presents a HIDS with distributed components that enables the elasticity of the system according to the need and was implemented using open-source and free tools. A pipeline was then built comprising five layers and starting with data collection to generating alerts of detected anomalies and data analysis in the last layer. Each layer of pipeline was built with tools configured for specific purposes and that allow the integration between adjacent layers.
Preliminary tests were performed with a public dataset of system calls for training and evaluating machine learning algorithms in the anomaly detection layer. This approach allowed the operation of the framework and the architecture to be tested with minimal changes to the pipeline in the data capture layer, simulating an application running in the monitored cluster Kubernetes. Based on the test results of some state-of-the-art machine learning algorithms using the test dataset, the model that presented the best performance in detecting anomalies was selected for emulating the operation of HIDS and implemented in layer four machine learning module in the proposed architecture.
To validate the functioning of the built IDS, machine learning models were trained with different parameters using a public dataset of system calls with normal behavior of a given application. A subset of the public dataset containing selected attacks was then used to simulate the exploitation of security holes and attacks targeting the application running on cluster Kubernetes. For each dataset representing an attack, the detection effectiveness was measured and evaluated by comparing the trained machine learning algorithms. In the event of anomaly detection, alerts are generated and displayed on a cluster dashboard built for monitoring by the SOC team, which can then proceed with the analysis of any incident and apply the appropriate actions as recommended by the security policy.
4. Proposed Framework
The proposed framework comprises a set of tools and processes integrated into a reference architecture for implementing an Intrusion Detection System based on Host in a cluster of container orchestration. To implement the framework, the GNS3 network emulator software was used in version 2.2.29. A topology of a corporate network environment was then built containing a Kubernetes container orchestration cluster at version 1.18, vlans, a firewall, routers and switches, according to the Figure 1.
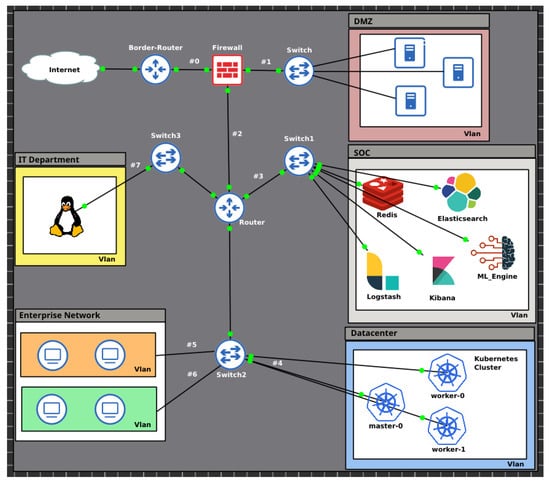
Figure 1.
Network topology implemented in the GNS3 software.
A possible intrusion or attack on a containerized system can be identified by detecting anomalies in the system calls invoked by the containers to the kernel of the Operating System of the host of the container platform. Thus, the framework aims to improve Intrusion Detection Systems on container platforms and was designed with the aim of contributing to the resolution of problems exposed by related works such as: the computational overhead caused in container platforms across HIDS, the absence of current datasets, and the need for improvements in anomaly detection in system calls.
Figure 2, Figure 3 and Figure 4 show respectively the flowcharts that describe the operation of framework in three stages of operation: training (Figure 2), testing (Figure 3), and production (Figure 4), in five processing layers: layer 1 (data capture), layer 2 (feature engineering), tier 3 (indexing and searching), tier 4 (anomaly detection), and tier 5 (alert generation and data analysis). Thus, the operation of the IDS begins in the training phase, followed by the test phase and, finally, the production phase. Eventually, the IDS operation cycle may be reset in view of the need to train the model with new data or parameter adjustments.
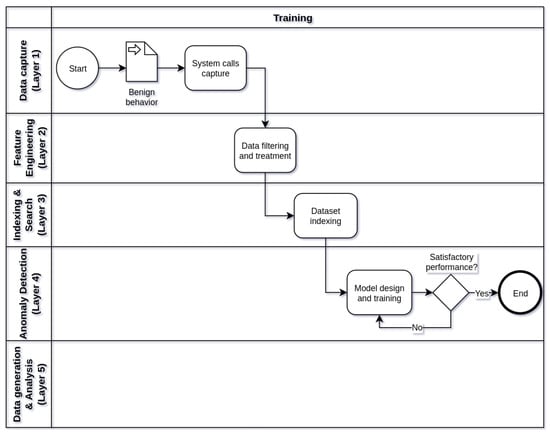
Figure 2.
Flowchart describing how the framework works during the training phase.
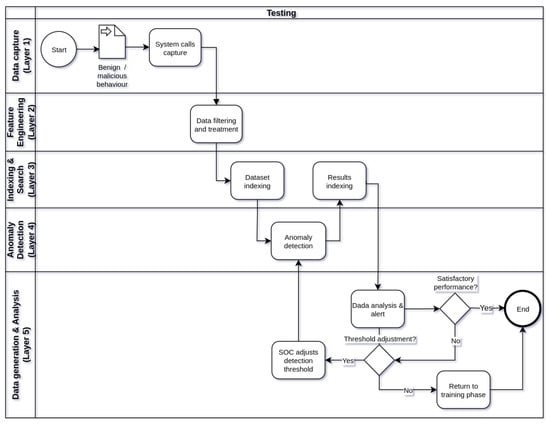
Figure 3.
Flowchart describing how the framework works during the testing phase.
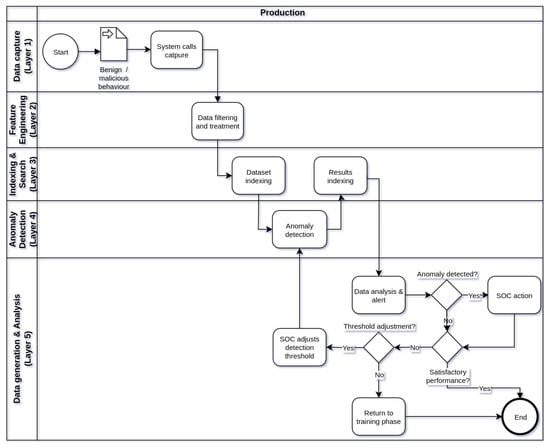
Figure 4.
Flowchart describing how the framework works during the production phase.
Due to the fact that the machine learning model used performs batch learning, its learning is carried out offline [35]. That is, the model trained and in use in the production phase is used only for detection and does not learn simultaneously with the data being analyzed. Although training a new model has to be done offline, this requirement does not prevent the IDS from working while new models are being trained or tested. That way, after training and testing a model with new parameters or datasets, it can be deployed for production operation to replace another model in use.
In the framework training phase (Figure 2), the main objective is to train a machine learning model through benign behaviors of a containerized application. The model trained with normal behaviors will be able to identify anomalies through the discrepancy between the system calls invoked in normal use and malicious use of the system. To do so, it is necessary to ensure that no attack or malicious activity occurs while capturing the system calls that make up the dataset with benign behavior. Data processing in this phase starts at layer 1 of the framework and proceeds through the intermediate layers to layer 4, where the model is trained and terminated when the model reaches satisfactory levels of detection using the data of training. In addition to the trained machine learning model that can be used in the test and production phases of the framework, another by-product of the training phase is the datasets stored in Elasticsearch in layer 3, after treatment and filtering performed in layer 2.
After training the machine learning model, in the testing phase of the framework (Figure 3), different datasets from the one used in the training phase are used to evaluate the performance of the trained model in anomaly detection. These datasets should contain benign or malicious behaviors of the same containerized application. Its construction should ensure the systematic capture of system calls in behaviors identified as normal and/or anomalous in the usage of the application. In this operational phase, the processing of the data begins at layer 1 and extends to the last layer of the framework. Differently from the training phase, in layer 4, the trained machine learning model is used solely to detect anomalies in the test datasets. In layer 4, performance metrics of the model can be visualized, as detailed in Section 5 of this work. The detection results of the model are also stored in Elasticsearch and can be queried and analyzed later on. In layer 5, it is possible to analyze the detection results of the model and the alerts generated in case of detected anomalies through a web interface of Kibana. If necessary, depending on the performance of the model, the choice of a new value of threshold for anomaly detection by the model can be adjusted. If the performance of the model in anomaly detection is unsatisfactory, the operation of the framework can return to the training phase for the construction of a new model of machine learning. It is worth noting that in both the training and testing phases of the framework, once the training and testing datasets are already indexed in Elasticsearch, the processing of layers 1 and 2 does not need to be repeated for each training or testing of a new model with indexed datasets. In this scenario, the execution of the processing flow can start at layer 3.
During the production phase of the framework (Figure 4) the main objective is to detect anomalies in the behavior of the target application using the machine learning model trained and tested in the phases of previous operations. The capture of system calls occurs in layer 1 at application runtime and data processing follows the processing and indexing flow through layers 2 and 3, respectively. The indexing of system calls in Elasticsearch is done on indexes that are created in a fixed and adjustable time interval. At each defined time interval, a new index is created with a set of system calls executed in that period. Thus, the time window represented by an index introduces a delay between the occurrence of the system call and the analysis of anomalies by the model, being an important factor to be observed in the configuration of the framework. The frequency of creation of new indexes in Elasticsearch can be every day, hour or even smaller fractions of time, according to the detection time tolerance accepted by the IDS. After creating an index, it will be used as input for anomaly analysis by the machine learning model in layer 4. The indexes are read individually and sequentially, according to the creation time of each index. At layer 5, the SOC team will be able to track detection results by the IDS in a dashboard created in Kibana. In the event of an eventual anomaly, the SOC will be able to carry out a more in-depth analysis of the event, correlating it with other sources of information such as a SIEM, for example. In addition, the detection threshold can be adjusted to allow greater or lesser sensitivity in the detection of anomalies by the IDS. Even so, if the performance of the IDS is unsatisfactory, the framework operation may return to the previous phases to improve the machine learning model or make adjustments to other components.
The developed architecture presents a HIDS with distributed components, enabling the elasticity of the system as needed [33]. Segregation of the architecture into different layers allows for a clearer identification of functions and tools involved in data processing and serves the purpose of reducing processing overhead on the container platform. Thus, the data flow of the detection system permeates five layers, where free tools are used for specific purposes, as shown in Figure 5. According to the flowcharts illustrated in Figure 2, Figure 3 and Figure 4, different tasks can occur in layers 3, 4, and 5, depending on the operation phase from framework. However, in essence, the main functions performed in each layer are common to all phases of operation. Additional information about the integration between the tools of the layers of the proposed architecture and the topology implemented in software GNS3 can be consulted in [33] and in the following github repository [36]. Briefly, next, details of each layer of the proposed architecture will be provided.
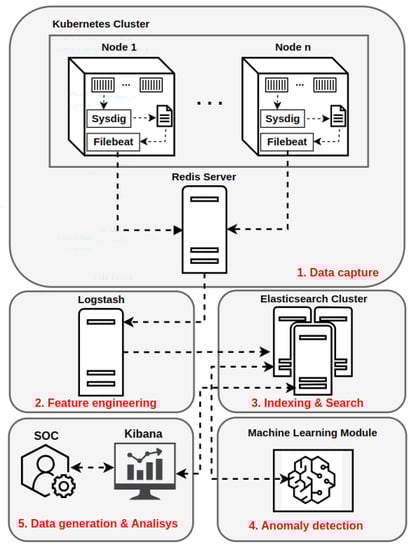
Figure 5.
Proposed architecture with five layers and it’s tools [33].
4.1. Layer 1—Data Capture
In the first layer of the architecture, called the data capture layer, the processing flow starts through an agent located in the Kubernetes cluster nodes responsible for running the application containers. This agent collects the system calls of the desired containers using the Sysdig tool and records them in a local file on the node’s file system, avoiding dependency on external services in this task [33]. When capturing system calls from a container through Sysdig, it is possible to specify which attributes of each system call invoked will be collected through filters. These attributes will later be used to build the features that will compose the dataset of system calls. Sysdig provides a list of filters available for use in its documentation [37] and for demonstrative purposes, the filters listed in Table 2 were used to capture the system calls of containers.
Table 2.
System calls attributes collected by Sysdig.
As system calls are written to a file, a service provided by the Filebeat tool reads each new line added to the file and sends them to Redis, an in-memory database external to the cluster [33]. To provide secure communication between Filebeat and Redis, a password is required to authenticate to Redis before data is received by this service. This password must be parameterized in the Filebeat configuration. Still in the data capture layer, Redis acts as a cache, giving resilience and high performance to the flow of system calls captured in real time from containers running [33]. Different queues containing system calls can be created in Redis for each monitored container. Queues remain in Redis until Logstash, a Layer 2 service in the architecture, reads and removes data from the queues. In this way, the data only persists in Redis in memory until it is consumed by layer 2, giving way to the entry of new system calls. To prevent this workload from running on cluster Kubernetes, Redis has been configured on a host dedicated to this service. If necessary, the Redis server can be scaled horizontally to work as a cluster, offering greater performance in the data stream.
4.2. Layer 2—Feature Engineering
The second layer, or feature engineering, takes its name because it is where raw data from system calls is processed into features (characteristics) that will compose the datasets of input to the machine learning model. According to [13,19], data preparation and features extraction are decisive factors and therefore need more attention when compared to choosing the best detection model. Thus, a critical part of a project involving machine learning is defining a good set of features data that will be used for training the [35] model. According to [16], the selection of features is useful to decrease the computational difficulty, eliminate data redundancy, improve the detection rate of machine learning techniques, simplify the data and reduce false alarms. Thus, it can be said that the selection of features in framework begins with determining which filters will be used in Sysdig to capture attributes of system calls.
Logstash is the tool used to consume Redis data and filter and process raw data from system calls [33]. Through Logstash, it is possible to manipulate and treat each attribute that makes up a system call, converting strings into numerical values, discarding unnecessary information and adding other information if necessary. To avoid an additional processing load on cluster Kubernetes, Logstash was configured on a host dedicated to this service. If necessary, multiple instances of Logstash can be configured, allowing the scalability of this service and greater capacity in processing the data flow. After data processing by Logstash, each event corresponding to an invoked system call is indexed as a document in Elasticsearch in indexes that can be created dynamically according to the number of documents indexed or at predefined time intervals. Indexes in Elasticsearch are the data structures that contain the datasets with the system calls and their features already encoded in numerical format, suitable for the processing done by the machine learning algorithms [33]. Just as communication between Logstash and Redis requires authentication, so does the integration between Logstash and Elasticsearch.
4.3. Layer 3—Indexing and Search
In the third layer, or indexing and search, the main component is Elasticsearch. Elasticsearch is a high-performance [38] indexing and search engine. Its use as a repository for storing system calls allows for high availability of data, in addition to enabling searches through useful metadata for filtering, aggregation, sorting, etc. [33]. In addition to containing the indexes created by Logstash representing the datasets, Elasticsearch integrates with the layer 4 machine learning module, with the layer 5 Kibana tool, and is also used to store the results of anomaly analyses. Thus, its operation takes place through the provision of data from queries to datasets or anomaly detection results, or simultaneously indexing new datasets and anomaly detection results by the machine learning module. For each index representing a dataset in the processing flow described in Figure 4, after its analysis, a new index is created in Elasticsearch with the anomaly score corresponding to the windows of system calls parsed by the machine learning module [33]. system calls windows consist of a data structure that stores sequences of system calls of multiple sizes and is a common approach for analyzing system calls [33]. Several operations can be done in Elasticsearch for manipulation and storage of datasets in conjunction with Kibana.
4.4. Layer 4—Anomaly Detection
The fourth layer (anomaly detection), contains the machine learning module represented in the architecture of Figure 5 and can run several state-of-the-art algorithms for detecting anomalies [33]. In order to reduce the processing overhead on cluster Kubernetes, the machine learning module was configured on a host dedicated to this type of workload. Due to the large number of operations with matrices performed by Deep Learning models and the high demand for computational power, graphics processors (GPUs) are indicated for training these models in a more acceptable time [17,39]. Thus, a host with one or more GPUs is recommended for running the machine learning module. In the host configuration used in this work, the GNU/Linux Operating System (Kernel 5.19.8) was used with Python and its dependencies installed to run the Neural Network models. For integration between the machine learning module and the cluster Elasticsearch in layer 3, the existing requirement is that the communication be performed through the Elasticsearch API for reading and writing data. In Python-based environments, there is a library that integrates with Elasticsearch [33]. Several Python libraries were used to implement the functions performed by the machine learning module in this layer. Among them, the following libraries stand out: Keras [40] and Tensorflow [41]. The joint use of Keras and Tensorflow libraries facilitated the implementation and training of DL models as well as the conduction of tests. Other libraries like Pandas and Scikit-learn were also used in the other processing steps of the pipeline executed by the machine learning module. Still, to make use of the computational power of the GPUs produced by the manufacturer NVIDIA, it is necessary to use the cuDNN library made available by the company for performance optimization in Deep Learning. In a study where the cuDNN library was presented, the authors achieved a 36% increase in the performance of a Neural Network model in addition to the reduction in [42] memory consumption.
According to the flowcharts represented by Figure 2, Figure 3 and Figure 4, the machine learning module can operate in two distinct modes: training (the training phase of the framework) and detection (the testing and production phases of the framework). In both training and detection modes, the machine learning module interacts with the Elasticsearch cluster to obtain the datasets via API. To facilitate the interaction between the machine learning module and the Elasticsearch cluster, a Python function called read_from_elastic (used in the INPUT lines in Algorithms 1 and 2) was developed using the elasticsearch_dsl library and made available through a custom functions file that is used in other operations in the machine learning module’s processing pipeline. Details of the file containing the developed functions can be found in the public github repository [36]. To facilitate understanding of the machine learning module’s operating modes, Algorithms 1 and 2 detail the training mode and detection mode of the machine learning module, respectively.
| Algorithm 1 Machine learning module processing (training mode) |
|
| Algorithm 2 Machine learning module processing (detection mode) |
|
The preprocessing of each dataframe involves operations such as data normalization and the creation of sliding windows containing sequences of system calls. The system call windows consist of a data structure that stores sequences of system calls of multiple sizes and is a common approach for system call analysis [33]. The choice of the size of the system call windows is a factor that directly influences the detection results, with the literature recommending window sizes in the range of 6 to 10 [13,15,43,44]. At the end of the processing performed in the machine learning module, the result of anomaly detection for each model prediction is recorded in an index created in Elasticsearch (OUTPUT line in Algorithm 2), where it can be graphically viewed and analyzed by the SOC team through the Kibana tool or through Python notebooks [33].
4.5. Layer 5—Data Generation and Analysis
In the fifth and final layer of the proposed architecture, data analysis and alert activities are concentrated, including performance evaluation of detections made by the machine learning module, adjustment of detection thresholds (acceptable error threshold), and SOC action in case of alerts. For the performance of these activities, the dataframes generated in the previous layer and Kibana are important tools to aid the SOC team. According to the flowcharts shown in Figure 2, Figure 3 and Figure 4, the actions performed in layer 5 are executed during the testing and production phases of the framework.
During the test phase, the SOC team does not act in the event of alerts and any anomalies detected. Thus, the main objective of framework operation in this phase is to evaluate the performance of the IDS before its entry into production. After indexing the datasets and detection results in Elasticsearch done in layer 3, you can analyze and inspect this data through Kibana. Kibana has native integration with Elasticsearch and provides a graphical interface for analyzing both datasets and anomaly indices generated by the IDS [33]. Still in the test phase, the performance of the IDS can be evaluated according to the analysis of the alerts generated by the machine learning module, in addition to the detection metrics calculated through the Equations (2)–(7). Depending on the performance of the machine learning module, it is possible to adjust the acceptable error threshold for other confidence intervals in order to improve performance in detecting anomalies. As the distribution of prediction errors resembles a normal distribution, most of the samples are concentrated in the center of the curve. In this way, the acceptable error threshold obtained is reduced as the confidence interval used is reduced, and the lower the acceptable error threshold, the more sensitive the model becomes to detect anomalies. Given the above, the detection sensitivity of the IDS can be adjusted by varying the confidence interval and the corresponding error threshold. Even so, if the performance of the IDS is still unsatisfactory after adjusting the acceptable error threshold, the test phase can be closed and the framework operation goes back to the training phase to improve the machine learning module.
In the operation of the framework in the production phase, the activity of the SOC team is inserted in layer 5 of the flowchart described in Figure 4. Therefore, the detection of anomalies and alerts produced by the IDS causes the SOC team to act to analyze the event. The preliminary analysis of alerts and anomalies detected by the IDS is performed through the Kibana interface, which allows system calls windows with an anomalous score to be identified. The anomaly detected at a given time must also be investigated using other security and environment monitoring tools, with a view to correlating the alert with other security events. As a HIDS usually cannot provide complete protection to systems, in today’s industry, a HIDS is usually integrated with other security mechanisms such as vulnerability analysis and management and incident response [13]. If the IDS performance is unsatisfactory, it is possible that the acceptable error threshold is adjusted to other confidence intervals, changing the IDS detection sensitivity. However, if the performance of the IDS is not adequate, the framework can go back to operating in the training phase to improve the machine learning model.
After analyzing and investigating an anomaly, the SOC team will be able to act with measures to contain the propagation of a possible attack through actions such as: restricting application communication to limited contexts (sandboxing), verifying changes in the configuration of the running application (e.g., recent deploy of a new version), contacting the team responsible for developing the application, or even interrupting the execution of the application container that generated the alert. Through layer 5 tools, it is possible for dashboards to be created with customized metrics and alerts in the event of anomalies in containerized applications. That said, the information generated by the container platform IDS offers greater visibility into the security of this environment, representing an additional relevant source of security events to support the monitoring of the SOC and perform correlation with events generated by other tools.
5. Results and Discussion
In this section, details of the execution of an experiment carried out with the framework implemented in an emulated environment will be provided, demonstrating its ability to function and integrate between the layers of the proposed architecture. To conduct the experiment, a public dataset of system calls was used as a data source for a containerized application and processed according to the pipeline in each operation mode of the framework. Subsequently, the detection results obtained in the experiment were analyzed and compared with the results of the work that originated the public dataset.
The work published by [29] utilized introspection tools and an unsupervised machine learning approach to enable non-intrusive monitoring of a containerized application. As a result of this research, a dataset was made available, containing system calls of both benign and anomalous behavior of an application. To generate this dataset, the Sysdig tool was employed, and the following attributes were collected for each system call:
- syscall—name of the system call invoked
- time—timestamp at the time of system call invocation
- process—name of the process that invoked the system call
- fields—number of arguments of the invoked system call
- length—number of characters of the arguments
- value—encoded value of arguments
In the dataset made available in a public repository by [29], the attributes of each system call are provided in pre-processed form, with their values already converted to numeric format. As explained by the author, to generate benign behavior data, a containerized MySQL database server was used as an example application, and random pairs of users and passwords were generated, inserted, and updated in randomly selected tables in the database through a MySQL client [29]. Seven attacks were selected and executed to generate the anomalous behavior of the application, which include: Brute Force Login, Simple Remote Shell, Meterpreter, Malicious Python Script, Docker Escape, SQL Misbehavior, and SQL Injection. A description of each attack performed, as well as more details of the tests conducted, can be found in the same publication.
To evaluate the proposed framework in this work, the dataset provided by [29] was copied to a node of a Kubernetes cluster as a representation of captured system calls performed by the Sysdig tool for an application running in the cluster. Since the public dataset was available on GitHub in multiple parts in CSV (Comma Separated Values) format, it was necessary to concatenate the different parts into a single file for each behavior (normal or attack). From that point onwards, the files representing the dataset could be read by the Filebeat tool, and the processing pipeline described in Figure 5 could be initiated from layer 1. For the indexing of data in Elasticsearch, each CSV file created was individually read by Filebeat, and Logstash created a separate index for each dataset in Elasticsearch.
A dashboard was then created to provide a better visualization of the characteristics of the benign behavior dataset. Figure 6 displays this dashboard, which allows user interaction through filtering, aggregation, and the creation of other graphs for data inspection and understanding. The dashboard shown in Figure 6 consists of the following graphs: total number of system calls in the dataset, distribution of system calls by process, distribution of the number of arguments, histogram displaying the distribution of system calls by timestamp, line graph illustrating the histogram of the number of arguments by timestamp, map indicating the main system calls by process, and a proportional map showcasing the most invoked system calls.
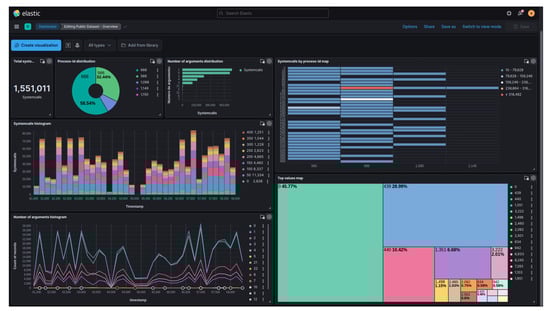
Figure 6.
Dashboard for viewing the public dataset with benign behavior.
With the data already stored in Elasticsearch, the machine learning module was trained by reading the benign dataset represented by the index proc-public-benign, which consisted of 1,551,011 indexed documents (system calls). The training process of the machine learning module followed the Algorithm 1. The Python code executed in a Jupyter Notebook format is available in the GitHub repository [36].
In addition to the model training, an additional task was performed, which involved creating a database containing the calculation of the hash of system calls windows from the benign dataset. This database contains a list of unique hashes computed from all system calls windows along with their attributes, collected during normal application behavior using the defined window size. Similarly, by calculating the unique hashes of the system calls windows from the dataset with malicious behavior, it was possible to generate labels for the attacks dataset. Therefore, sequences of system calls with all their attributes that form a window and have a hash calculation equal to one of the constant hashes based on the benign hashes are considered benign. This approach enables measuring the performance of the machine learning model in predicting the data by comparing the model’s prediction with the corresponding label for a given system call window.
This procedure was necessary to complement the dataset, as the malicious dataset provided by [29] includes a mixture of normal application behaviors and anomalous behaviors, but does not provide label information indicating the class (benign or anomalous) of system calls. It is acknowledged that there are different techniques available to classify and label a dataset. However, the approach used in this work benefits from its ease of implementation and presents an alternative to more computationally expensive techniques, allowing for a preliminary analysis of the results.
As shown in the Figure 7, the data structure df_benign_data_hash contains the hashes of system calls windows from the benign dataset, and it consists of 1,551,006 records. Among these records, there are 395,138 unique hashes, which form the base of benign hashes. In this experiment, a window size of six system calls was used. Consequently, the total number of windows is six less than the total number of system calls in the benign dataset.

Figure 7.
Benign hashes data structure details.
The model used in the experiment was obtained through Hyperopt from a range of possible models. Hyperopt is a Python library used for hyper-parameter optimization in machine learning algorithms [45]. Using this library, it was possible to test various combinations of hyper-parameters that form a model, in order to find the combination that achieved the best performance. Other parameter combinations, such as window size for system calls, activation functions, data normalization functions, etc., were empirically tested to determine the final model used in this experiment.
Several Python libraries were used to implement the functions performed by the machine learning module. In addition, to reduce the time needed to train the models, a GeForce RTX 3060 video card was used. In Deep Learning. In a work where the cuDNN library was presented, the authors achieved a 36% increase in the performance of a Neural Network model, in addition to the reduction in [42] memory consumption.
As in the machine learning model employed by [29], a DAE-type Neural Network with LSTM units was the base structure used to arrive at the final model of this experiment. From this framework, a Convolutional Neural Network (Conv1D) layer was added to the sequential model before the layers in the Autoencoder framework. This Conv1D layer has the ability to extract the most representative features from complex data, eliminating the least significant features for [46] classification. For the dataset used in this experiment, this layer provided a performance gain in the prediction of data by the model. The Figure 8 presents the definition of the model that obtained the best results in the search performed with Hyperopt.
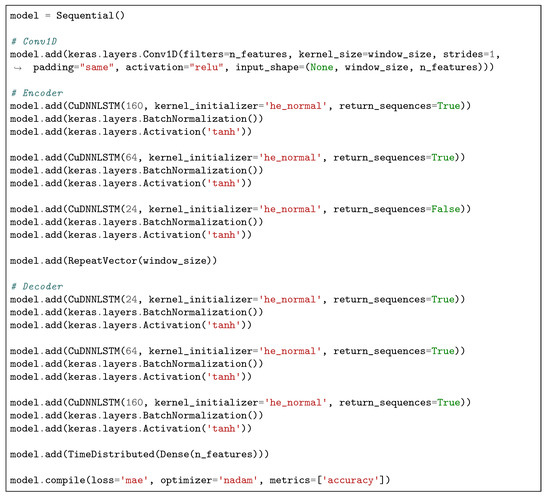
Figure 8.
Model definition obtained by using the Hyperopt library.
Table 3 provides detailed information on the values of acceptable error thresholds (Loss thresholds) obtained using the model defined above for each confidence interval during the tests conducted with the benign dataset. Once the model was trained and the error thresholds were determined, the machine learning module operated in detection mode, where it read each attack index from Elasticsearch and executed the remaining processing steps, following the Algorithm 2 presented above. The code executed in the Jupyter Notebook format for detecting anomalies in the performed attacks is also available in the GitHub repository [36].
Table 3.
Loss threshold for each confidence interval.
As a result of the anomaly detection performed for each attack, an index was created in Elasticsearch to store the detection information and the obtained results. Figure 9 showcases a Kibana dashboard designed to visualize the indexed data, specifically the anomalies detected during the Brute Force attack. This dashboard allows for interactive analysis of the results through its graphical interface. The components of the dashboard depicted in Figure 9 include: the total number of analyzed system call windows, a pie chart displaying the percentage of anomalous and normal windows, the confidence interval and loss threshold used, a graph illustrating the error obtained in each system call window by timestamp in comparison to the defined loss threshold, a distribution histogram of anomalous and normal windows by timestamp, and a table providing detailed information about each analyzed system call window.
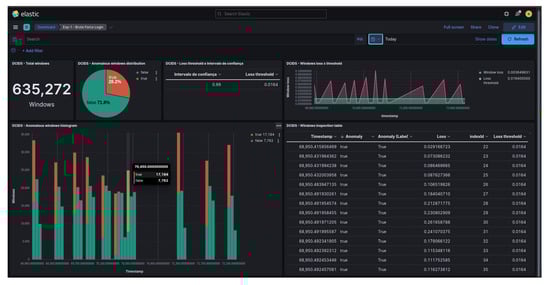
Figure 9.
Dashboard for viewing anomalies detected during the Brute Force attack.
In binary classification problems (normal or anomaly class) normally, primary results of algorithm evaluation are used and other metrics can then be obtained based on these results. These results can be represented through a confusion matrix, demonstrating the prediction capacity of the algorithm’s classes, according to Table 4.
Table 4.
Confusion matrix with classification results of an algorithm.
- Negative Predicted Value (NPV): Ratio of items correctly predicted as not being of a class over total items predicted as not being of this class (correctly or not).
- Accuracy (Acc): Success rate in the classification of all results of the confusion matrix.
- True Negative Rate (TNR), Coverage (COV), or Specificity: Rate of items correctly predicted to not be of a class over all items not belonging to that class class.
For performance analysis in attack detection, the following evaluation metrics were adopted by [29] in their work:
In total, forty-two models were tested in the experiment conducted by [29], which involved different combinations of window sizes for system calls, sets of features, data normalization methods, and confidence intervals. Figure 10 showcases the results obtained by [29] for six out of the seven attacks present in the dataset. The figure also presents the results for six models that utilized different data normalization functions and sets of features from the dataset.
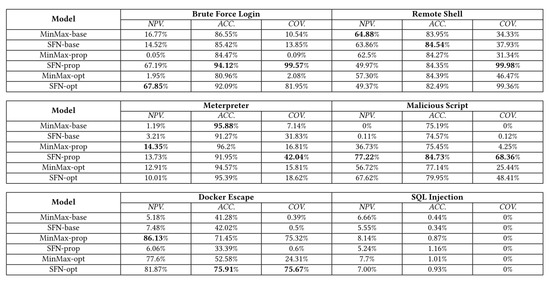
Figure 10.
Attack detection performance metrics obtained by [29].
Although the metrics shown in Figure 10 are useful for analyzing the effect of different combinations of parameters on model performance, in practice, the same model compiled with its parameters should be used to detect anomalies in the application to any of the attacks. Thus, it is expected that the model used in a real scenario simultaneously offers acceptable performance for different attacks.
For purposes of comparison with the results obtained in this experiment, the Table 5 as well as the graph in Figure 11 were generated by gathering the results obtained by [29] for each attack using only the model called SFN-opt from Figure 10 and the results obtained using the framework proposed in this work.
Table 5.
Comparison table of the performance metrics of Figure 10 SFN-opt model and the results obtained in this work.

Figure 11.
Comparison graph of the performance metrics of Figure 10 SFN-opt model and the results obtained in this work.
The SFN-opt model in Figure 10 makes use of a custom function for data normalization and includes as features of dataset the number of arguments (fields) and the number of characters of the arguments (length) of system calls, just like in this experiment.
In Table 5, the values obtained by this work that surpassed the performance of the study carried out by [29] using the model SFN-opt were highlighted in bold, which corresponds to 80.95% of all metrics collected.
To summarize the results obtained in this experiment, the Table 6 contains the metrics obtained for all attacks with the confidence interval (CI) set to 99%, which is equivalent to a loss threshold equal to 0.0164. In addition to NPV, ACC and COV values, other metrics such as Precision, TPR, FPR, F1-Score shown respectively in Equations (4)–(7), as well as the ROC-AUC metric were calculated for better comparison of results with possible future work.
Table 6.
All attack detection performance metrics obtained in this work.
- Precision (Pre): Ratio of items correctly predicted to be of a class over the total of items predicted to be of this class (correctly or not).
- True Positive Rate (TPR), Recall (Rec) or Sensitivity: Rate of items correctly predicted to be of a class over all items belonging to that class class.
- False Positive Rate (FPR) or False Alert Rate (FAR): Rate of items incorrectly predicted to be of a class over all items not of that class.
- F1 Score or F-Score: Harmonic mean between Precision (Pre) and True Positive Rate (TPR).
According to [29], the experiment carried out in their study failed to detect SQL Injection and SQL Misbehavior attacks. However, the model trained in this work achieved significantly better results for these attacks. For instance, the Coverage metric (COV) had values equal to or greater than 99%, indicating the model’s ability to correctly classify a system call window as negative (benign). This indicates the negative rating model (TNR) capability of a system call window. According to Table 6, it is also worth noting the high Precision (PRE) obtained in this experiment with values greater than 98% for all attacks, with the exception of the SQL Injection attack. Furthermore, a low FPR is noted for all attacks, with values less than or equal to 1%. On the other hand, metrics such as Accuracy (ACC) and TPR have room for improvement. This result can probably be achieved with more samples of malignant and benign behavior of the application, complementing the dataset used for training the model. The improvement of the dataset used in this experiment is among the authors’ future goals, since the available version serves as a baseline [29].
The authors of the study presented in [29] state that the work carried out is not aimed at developing a new machine learning technique for unsupervised introspection, but rather making use of state-of-the-art techniques to investigate its feasibility of implementation. Likewise, this work does not present revolutionary techniques or techniques that no longer exist today. But it primarily aims at using state-of-the-art tools and methodologies to demonstrate the applicability of the framework proposed in this work. Finally, this first experiment attested through the use of a public dataset that it is possible to make use of the proposed framework to provide an additional layer of security for detecting anomalies in containerized applications.
6. Conclusions
The developed work presented a framework comprising a reference architecture for the implementation of a HIDS focused on container platforms. The main contributions of this framework are highlighted as follows:
- Remote collection of system calls from different nodes of a cluster of container orchestration, enabling collaborative learning of anomalies;
- Reduction of processing overhead caused by intrusion detection in the nodes of a container orchestration cluster through a HIDS architecture with distributed components;
- Scalable architecture implemented with free tools in an emulated corporate environment;
- Ability to build own datasets of system calls and possibility of sharing with the community;
- Generation of anomaly detection alerts in applications to support the SOC through the analysis of system calls;
- Data analysis through web interface containing datasets and indexed anomalies;
- Possibility of implementing different machine learning algorithms and approaches for detecting anomalies in system calls (frequency, sequence, arguments and other data) aiming at greater detection efficiency;
- Ability to integrate framework with other tools, improving collaborative security.
Through experimentation with a public dataset of system calls it was possible to validate the feasibility of implementing and functioning the proposed framework with free tools in a functional architecture composed of five layers. Techniques and approaches used in state-of-the-art studies in the field of research were studied and applied for the development of the framework. More than the theoretical proposition of a framework, the main objective of this work was to guarantee the real functioning of an architecture and integration between its tools, for this reason, the topology emulated in the software GNS3 containing a functional environment.
The results obtained by this work for seven different attacks achieved values equal to or greater than 99% for the COV metric and less than or equal to 1% for the FPR. Also, 80.95% of all metrics collected surpassed the performance of the study that originated the dataset with model SFN-opt. The unsupervised machine learning approach achieved promising performance, demonstrating to be an alternative to supervised techniques.
The possibility of visualizing datasets through an analytical graphical interface is a differential of the framework, facilitating the understanding and analysis of data through filtering, aggregation, searches, and other functionalities that can contribute to the activities of experts and improvement of detection methods. Additionally, through the analysis of detected anomaly alerts, the SOC team will be provided with additional information about the security of containerized environments for correlation with data from other tools and support in decision-making and response.
Regarding the machine learning algorithms and anomaly detection, many optimizations can be performed in a universe of parameters and possible fine-tuning. Thus, time becomes a limiting factor when it comes to model optimization and training.
Initially, there was an understanding that the research gap related to real-time intrusion detection could be addressed without in-depth knowledge of the criteria and complexity inherent in this problem. Such aspiration can be seen in the publication [33], which, as of the writing of this work, could not be addressed. This limitation, along with other issues encountered during the study, were addressed as scope for future work in the framework. Furthermore, at the end of this study, the obtained perception points out that one of the main challenges related to intrusion detection in container platforms is related to the large volume of data involved, presenting itself as a Big Data problem.
Similarly to what has been found in several works in the related literature, the research field involving intrusion detection in containerized environments is vast and lacks many advancements and experiments that generate inputs for further research. The contribution of previously conducted works served as the basis for the development of the proposed framework and was essential to achieve the results obtained in this study. In this sense, it is expected that the developed work can be used as an additional reference for the implementation of Intrusion Detection Systems focused on container environments. Furthermore, it is expected that future works will bring improvements to the proposed framework through the implementation of new algorithms, modifications to the architecture, and tests in production environments.
7. Future Work
Although contributions resulting from this work have been presented, due to the complexity and scope of the addressed subject, limitations and possible optimizations have been observed. It should be noted that, as an Intrusion Detection System, no automated actions are taken when an alert occurs. Therefore, as an improvement to the framework, automated response actions can be developed to interrupt the propagation and continuation of an attack in the containerized environment.
An anomaly in a sequence of system calls invoked by a container does not provide high-level information that immediately leads to the origin of the access causing such anomaly in the application. In other words, it is not possible to inform the user responsible for the anomalous behavior in the application, the source IP, or data that would allow the identification of the agent causing the anomaly without cross-referencing data from other information sources such as request logs or network traffic for this association. This capability to analyze and correlate detection data with other sources of information for high-level access tracing can be implemented for more effective action against an intrusion.
A trained machine learning model for anomaly detection is typically specific to the behavior of a single application. The difficulty of achieving good detection performance for a limited context is already a non-trivial task. However, approaches involving the analysis of behavior and anomaly detection in multiple interacting containerized applications are an area that needs to be researched, considering this as a characteristic of current container environments. Furthermore, for optimizing the training process and improving detection by machine learning models, distributed processing tools can be studied in conjunction with federated learning techniques.
According to the current classification used to categorize existing IDS (Intrusion Detection Systems), a hybrid IDS combines features of both signature-based IDS and anomaly detection. Thus, the identification of anomalous sequences of system calls can provide input for building attack signatures and contribute to studies aiming at constructing a hybrid IDS. In this type of IDS, a signature-based detection step occurs before the anomaly analysis, enabling the detection of known attacks with lower computational cost. Another trend that can be studied is the construction of a collaborative IDS, where the capabilities of a HIDS (Host-based IDS) and NIDS (Network-based IDS) can be combined to enhance intrusion detection.
The proposed architecture in five layers and its tools aims to serve as a reference for implementing a HIDS aimed at container orchestration platforms, and its configuration is not limited to the proposed architecture. It is expected that from this initial version other tools and processes can be inserted in the processing pipeline aiming at improving the IDS in each applied scenario. Improvements can be made to the agent used to collect system calls and to the other components of each layer to increase performance, high availability and process automation.
Another research idea is left to explore in this paper for additional work, such as the role of blockchain within the pipeline of the IDS adding extra features and capabilities to create a large-scale Distributed Container IDS and integrate it with other security systems.
Finally, other experiments can also be carried out in the topology built for applications running in the configured cluster Kubernetes. New datasets can be generated and penetration tests and attacks executed to evaluate the performance of the IDS. This ongoing evaluation and testing process, conducted within the pipeline of the IDS, will contribute to the continuous improvement and enhancement of the IDS, ensuring its effectiveness in detecting and mitigating intrusions in containerized environments. The results obtained from these experiments can serve as valuable input for future research and development in the field of intrusion detection in container orchestration platforms.
Author Contributions
Conceptualization, G.D.A.N. and S.L.R.; Methodology, R.R.N. and S.L.R.; Data curation, R.S.P. and G.D.A.N.; Writing—original draft, S.L.R.; Writing—review & editing, R.R.N.; Supervision, F.L.L.d.M. and G.D.A.N. All authors have read and agreed to the published version of the manuscript.
Funding
The APC was funded by FUNAPE-Fundação de Apoio à Pesquisa, Universidade Federal de Goiás.
Institutional Review Board Statement
Not applicable.
Informed Consent Statement
Not applicable.
Data Availability Statement
The data presented in this study are available in the following public repository [36].
Acknowledgments
This work is supported in part by CNPq-Brazilian National Research Council (Grant 310941/2022-9 PQ-1D), in part by FAPDF-Brazilian Federal District Research Support Foundation (Grant 625/2022 SISTeR City), in part by the University of Brasilia (Grant 7129 UnB COPEI), in part by the Ministry of Justice and Public Security (Grant MJSP 01/2019), in part by the Administrative Council for Economic Defense (Grant CADE 08700.000047/2019-14), in part by the General Attorney of the Union (Grant AGU 697.935/2019), in part by the Institutional Security Office of the Presidency of Brazil (Grant ABIN 008/2019), in part by the Department of Federal Police (Grant DPF 03/2020), and in part by the General Attorney’s Office for the National Treasure (Grant PGFN 23106.148934/2019-67).
Conflicts of Interest
The authors declare no conflict of interest.
References
- Ebert, C.; Gallardo, G.; Hernantes, J.; Serrano, N. DevOps. IEEE Softw. 2016, 33, 94–100. [Google Scholar] [CrossRef]
- Souppaya, M.; Morello, J.; Scarfone, K. NIST-SP-800-190-Application Container Security Guide; NIST: Gaithersburg, MD, USA, 2017. [Google Scholar] [CrossRef]
- Mell, P.; Grance, T. The NIST Definition of Cloud Computing; NIST: Gaithersburg, MD, USA, 2011. [Google Scholar] [CrossRef]
- Ali, R.; Ali, A.; Iqbal, F.; Hussain, M.; Ullah, F. Deep Learning Methods for Malware and Intrusion Detection: A Systematic Literature Review. Secur. Commun. Netw. 2022, 2022, 2959222. [Google Scholar] [CrossRef]
- IBM Security. X-Force Threat Intelligence Index 2022 Full Report; IBM: Armonk, NY, USA, 2022. [Google Scholar]
- ENISA. ENISA Threat Landscape 2022; European Union Agency for Cybersecurity: Attiki, Greece, 2022. [Google Scholar] [CrossRef]
- Shu, R.; Gu, X.; Enck, W. A study of security vulnerabilities on docker hub. In Proceedings of the CODASPY 2017—Proceedings of the 7th ACM Conference on Data and Application Security and Privacy, Scottsdale, AZ, USA, 22–24 March 2017; Association for Computing Machinery, Inc.: Rochester, NY, USA, 2017; pp. 269–280. [Google Scholar] [CrossRef]
- Biermann, E.; Cloete, E.; Venter, L. A comparison of Intrusion Detection systems. Comput. Secur. 2001, 20, 676–683. [Google Scholar] [CrossRef]
- Scarfone, K.; Mell, P. Guide to Intrusion Detection and Prevention Systems (IDPS). NIST Spec. Publ. 2007, 800, 94. [Google Scholar]
- Flora, J.; Antunes, N. Studying the applicability of intrusion detection to multi-tenant container environments. In Proceedings of the 2019 15th European Dependable Computing Conference, EDCC 2019, Naples, Italy, 17–20 September 2019; pp. 133–136. [Google Scholar] [CrossRef]
- Flora, J.; Goncalves, P.; Antunes, N. Using Attack Injection to Evaluate Intrusion Detection Effectiveness in Container-based Systems. In Proceedings of the IEEE Pacific Rim International Symposium on Dependable Computing, PRDC, Perth, Australia, 1–4 December 2020; pp. 60–69. [Google Scholar] [CrossRef]
- Kashkoush, M.; Clancy, C.; Abed, A.; Azab, M. Resilient intrusion detection system for cloud containers. Int. J. Commun. Netw. Distrib. Syst. 2020, 24, 1. [Google Scholar] [CrossRef]
- Liu, M.; Xue, Z.; Xu, X.; Zhong, C.; Chen, J. Host-Based Intrusion Detection System with System Calls: Review and Future Trends. ACM Comput. Surv. 2018, 51, 1–36. [Google Scholar] [CrossRef]
- Rohling, M.M.; Grimmer, M.; Kreubel, D.; Hoffmann, J.; Franczyk, B. Standardized container virtualization approach for collecting host intrusion detection data. In Proceedings of the Federated Conference on Computer Science and Information System, Leipzig, Germany, 1–4 September 2019; pp. 459–463. [Google Scholar] [CrossRef]
- Bridges, R.A.; Glass-Vanderlan, T.R.; Iannacone, M.D.; Vincent, M.S.; Chen, Q. A survey of intrusion detection systems leveraging host data. ACM Comput. Surv. 2019, 52, 128. [Google Scholar] [CrossRef]
- Khraisat, A.; Gondal, I.; Vamplew, P.; Kamruzzaman, J. Survey of intrusion detection systems: Techniques, datasets and challenges. Cybersecurity 2019, 2, 20. [Google Scholar] [CrossRef]
- Berman, D.S.; Buczak, A.L.; Chavis, J.S.; Corbett, C.L. A survey of deep learning methods for cyber security. Information 2019, 10, 122. [Google Scholar] [CrossRef]
- Byrnes, J.; Hoang, T.; Mehta, N.N.; Cheng, Y. A Modern Implementation of System Call Sequence Based Host-Based Intrusion Detection Systems. In Proceedings of the Second IEEE International Conference on Trust, Privacy and Security in Intelligent Systems and Applications (TPS-ISA), Atlanta, GA, USA, 28–31 October 2020; pp. 218–225. [Google Scholar] [CrossRef]
- Taj, R. A Machine Learning Framework for Host Based Intrusion Detection Using System Call Abstraction. Master’s Thesis, Dalhousie University, Halifax, NS, Canada, 2020. [Google Scholar]
- Bharathy, A.M.V.; Umapathi, N.; Prabaharan, S. An Elaborate Comprehensive Survey on Recent Developments in Behaviour Based Intrusion Detection Systems. In Proceedings of the 2019 International Conference on Computational Intelligence in Data Science, Chennai, India, 21–23 February 2019. [Google Scholar]
- Adeleke, O. Intrusion detection: Issues, problems and solutions. In Proceedings of the 3rd International Conference on Information and Computer Technologies (ICICT), San Jose, CA, USA, 9–12 March 2020; pp. 397–402. [Google Scholar] [CrossRef]
- Hickman, A.; Vandeven, S. Container Intrusions: Assessing the Efficacy of Intrusion Detection and Analysis Methods for Linux Container Environments. SANS White Paper, 2018. Available online: https://sansorg.egnyte.com/dl/ySCI2LpMC3 (accessed on 25 March 2021).
- Abed, A.S.; Clancy, C.; Levy, D.S. Intrusion Detection System for Applications Using Linux Containers. In Proceedings of the Security and Trust Management: 11th International Workshop, STM 2015, Vienna, Austria, 21–22 September 2015; Volume 9331. [Google Scholar] [CrossRef]
- Abed, A.S.; Clancy, T.C.; Levy, D.S. Applying Bag of System Calls for Anomalous Behavior Detection of Applications in Linux Containers. In Proceedings of the 2015 IEEE Globecom Workshops, San Diego, CA, USA, 6–10 December 2015. [Google Scholar]
- Kang, D.K.; Fuller, D.; Honavar, V. Learning Classifiers for Misuse and Anomaly Detection Using a Bag of System Calls Representation. In Proceedings of the Sixth Annual IEEE SMC Information Assurance Workshop, West Point, NY, USA, 15–17 June 2005. [Google Scholar]
- Zhang, X.; Niyaz, Q.; Jahan, F.; Sun, W. Early Detection of Host-based Intrusions in Linux Environment. In Proceedings of the 2020 IEEE International Conference on Electro Information Technology (EIT), Chicago, IL, USA, 31 July–1 August 2020; pp. 475–479. [Google Scholar] [CrossRef]
- Subba, B.; Biswas, S.; Karmakar, S. Host based intrusion detection system using frequency analysis of n-gram terms. In Proceedings of the 2017 IEEE Region 10 Conference (TENCON 2017), Penang, Malaysia, 5–8 November 2017; pp. 2006–2011. [Google Scholar] [CrossRef]
- Srinivasan, S.; Kumar, A.; Mahajan, M.; Sitaram, D.; Gupta, S. Probabilistic real-time intrusion detection system for docker containers. In Security in Computing and Communications: 6th International Symposium, SSCC 2018, Bangalore, India, 19–22 September 2018; Springer: Singapore, 2019; Volume 969, pp. 336–347. [Google Scholar] [CrossRef]
- Cui, P.; Umphress, D. Towards Unsupervised Introspection of Containerized Application. In Proceedings of the 2020 10th International Conference on Communication and Network Security, Tokyo, Japan, 27–29 November 2020; pp. 42–51. [Google Scholar] [CrossRef]
- Forrest, S.; Hofmeyr, S.A.; Somayaji, A.; Longstaff, T.A. A Sense of Self for Unix Processes. In Proceedings of the IEEE Symposium on Security and Privacy, Washington, DC, USA, 6–8 May 1996. [Google Scholar]
- Haider, W.; Hu, J.; Moustafa, N. Designing anomaly detection system for cloud servers by frequency domain features of system call identifiers and machine learning. In Mobile Networks and Management: 9th International Conference, MONAMI 2017, Melbourne, Australia, 13–15 December 2017; Springer: Cham, Switzerland, 2018; Volume 235, pp. 137–149. [Google Scholar] [CrossRef]
- Lin, Y.; Tunde-Onadele, O.; Gu, X. CDL: Classified Distributed Learning for Detecting Security Attacks in Containerized Applications. In Proceedings of the Annual Computer Security Applications Conference, Austin, TX, USA, 7–11 December 2020; pp. 179–188. [Google Scholar] [CrossRef]
- Rocha, S.L.; Daniel Amvame Nze, G.; Lopes de Mendonça, F.L. Intrusion Detection in Container Orchestration Clusters: A framework proposal based on real-time system call analysis with machine learning for anomaly detection. In Proceedings of the 2022 17th Iberian Conference on Information Systems and Technologies (CISTI), Madrid, Spain, 22–25 June 2022; pp. 1–4. [Google Scholar] [CrossRef]
- Tien, C.; Huang, T.; Tien, C.; Huang, T.; Kuo, S. KubAnomaly: Anomaly detection for the Docker orchestration platform with neural network approaches. Eng. Rep. 2019, 1, e12080. [Google Scholar] [CrossRef]
- Geron, A. Hands-On Machine Learning with Scikit-Learn, Keras, and TensorFlow: Concepts, Tools, and Techniques to Build Intelligent Systems, 2nd ed.; O’Reilly Media, Inc.: Sebastopol, CA, USA, 2019. [Google Scholar]
- Rocha, S.L. s4vio/dcids-public: DCIDS—Distributed Container IDS, 2023. Available online: https://github.com/s4vio/dcids-public (accessed on 7 August 2023).
- Sysdig. Home · draios/sysdig Wiki, 2023. Available online: https://github.com/draios/sysdig/wiki/ (accessed on 7 August 2023).
- Elasticsearch Elasticsearch: The Official Distributed Search & Analytics Engine|Elastic, 2023. Available online: https://www.elastic.co/elasticsearch/ (accessed on 7 August 2023).
- Xin, Y.; Kong, L.; Liu, Z.; Chen, Y.; Li, Y.; Zhu, H.; Gao, M.; Hou, H.; Wang, C. Machine Learning and Deep Learning Methods for Cybersecurity. IEEE Access 2018, 6, 35365–35381. [Google Scholar] [CrossRef]
- Keras Team. Keras: The Python Deep Learning API; Keras: Mountain View, CA, USA, 2022. [Google Scholar]
- Abadi, M.; Agarwal, A.; Barham, P.; Brevdo, E.; Chen, Z.; Citro, C.; Corrado, G.S.; Davis, A.; Dean, J.; Devin, M.; et al. TensorFlow: Large-Scale Machine Learning on Heterogeneous Systems. arXiv 2016, arXiv:1603.04467. [Google Scholar]
- Chetlur, S.; Woolley, C.; Vandermersch, P.; Cohen, J.; Tran, J.; Catanzaro, B.; Shelhamer, E. cuDNN: Efficient Primitives for Deep Learning. arXiv 2014, arXiv:1410.0759. [Google Scholar]
- Tan, K.; Maxion, R. “Why 6?” Defining the operational limits of stide, an anomaly-based intrusion detector. In Proceedings of the 2002 IEEE Symposium on Security and Privacy, Berkeley, CA, USA, 12–15 May 2002; pp. 188–201. [Google Scholar] [CrossRef]
- Laszka, A.; Abbas, W.; Sastry, S.; Vorobeychik, Y.; Koutsoukos, X. Optimal Thresholds for Intrusion Detection Systems. In Proceedings of the Symposium and Bootcamp on the Science of Security, Pittsburgh, PA, USA, 19–21 April 2016. [Google Scholar] [CrossRef]
- Bergstra, J.; Yamins, D.; Cox, D. Hyperopt: A Python Library for Optimizing the Hyperparameters of Machine Learning Algorithms. In Proceedings of the 12th Python in Science Conference, Austin, TX, USA, 24–29 June 2013; pp. 13–19. [Google Scholar] [CrossRef]
- Raut, M.; Dhavale, S.; Singh, A.; Mehra, A. Insider threat detection using deep learning: A review. In Proceedings of the 3rd International Conference on Intelligent Sustainable Systems, ICISS 2020, Thoothukudi, India, 3–5 December 2020; pp. 856–863. [Google Scholar] [CrossRef]
- Buczak, A.L.; Guven, E. A Survey of Data Mining and Machine Learning Methods for Cyber Security Intrusion Detection. IEEE Commun. Surv. Tutorials 2016, 18, 1153–1176. [Google Scholar] [CrossRef]
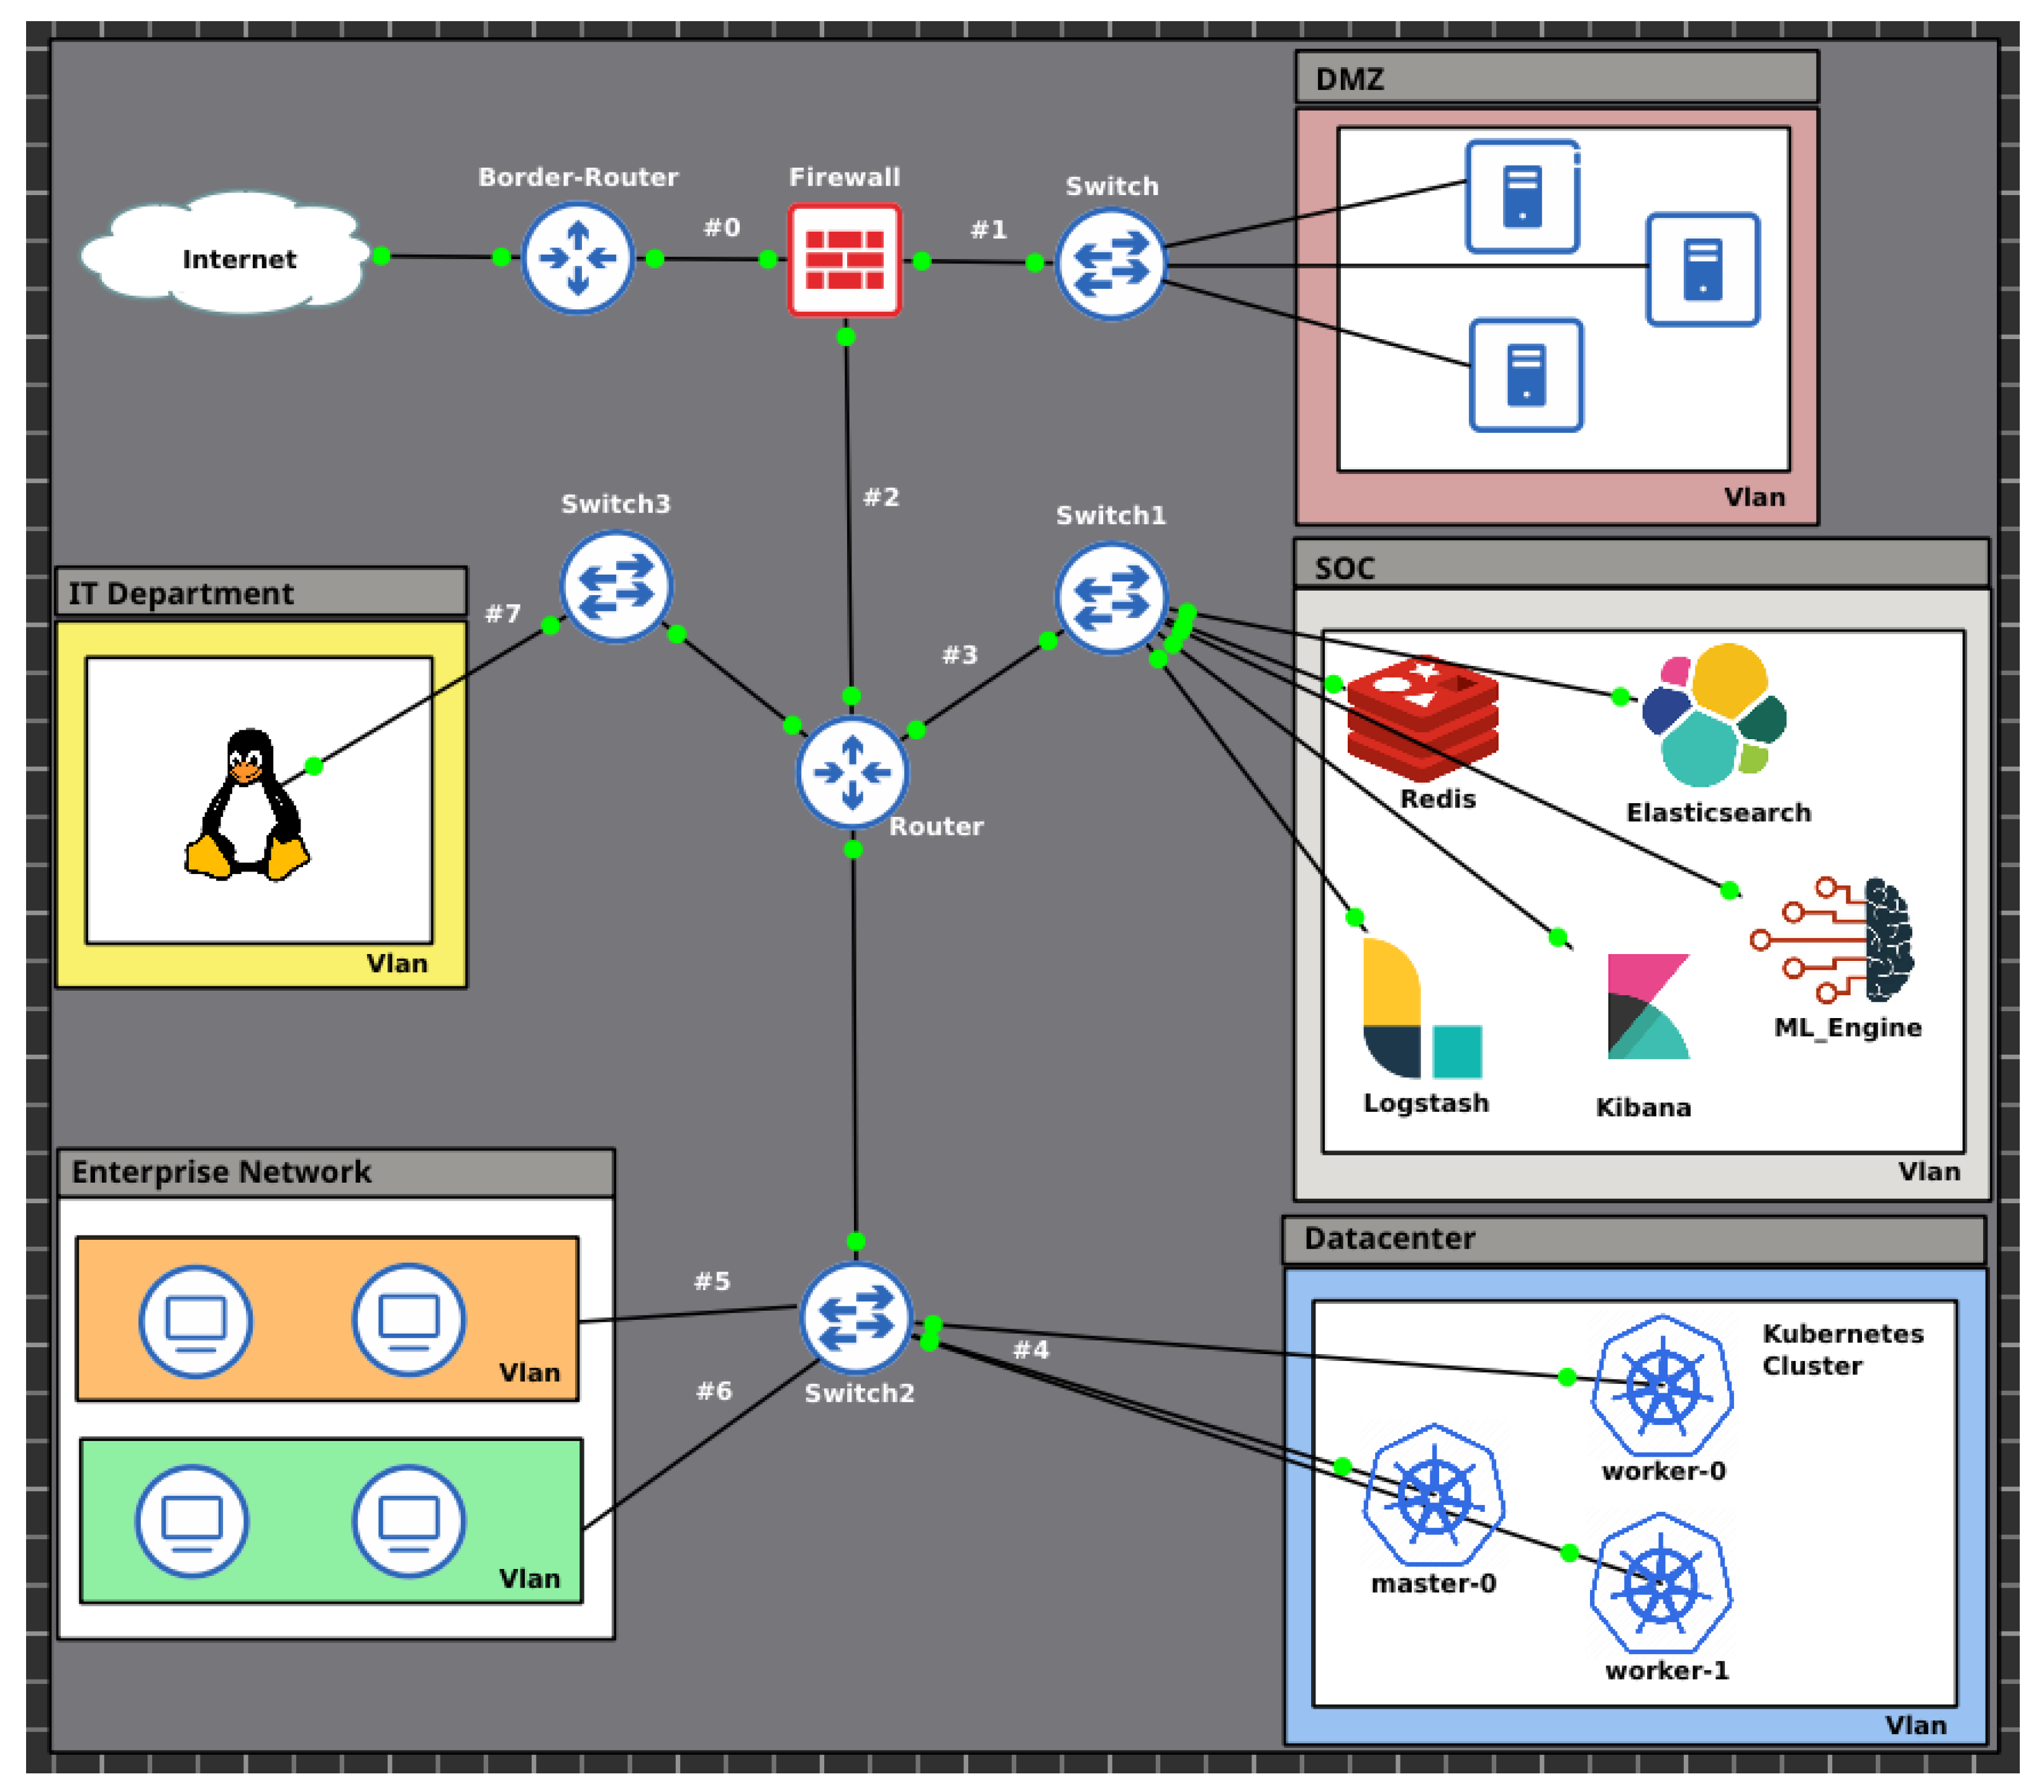
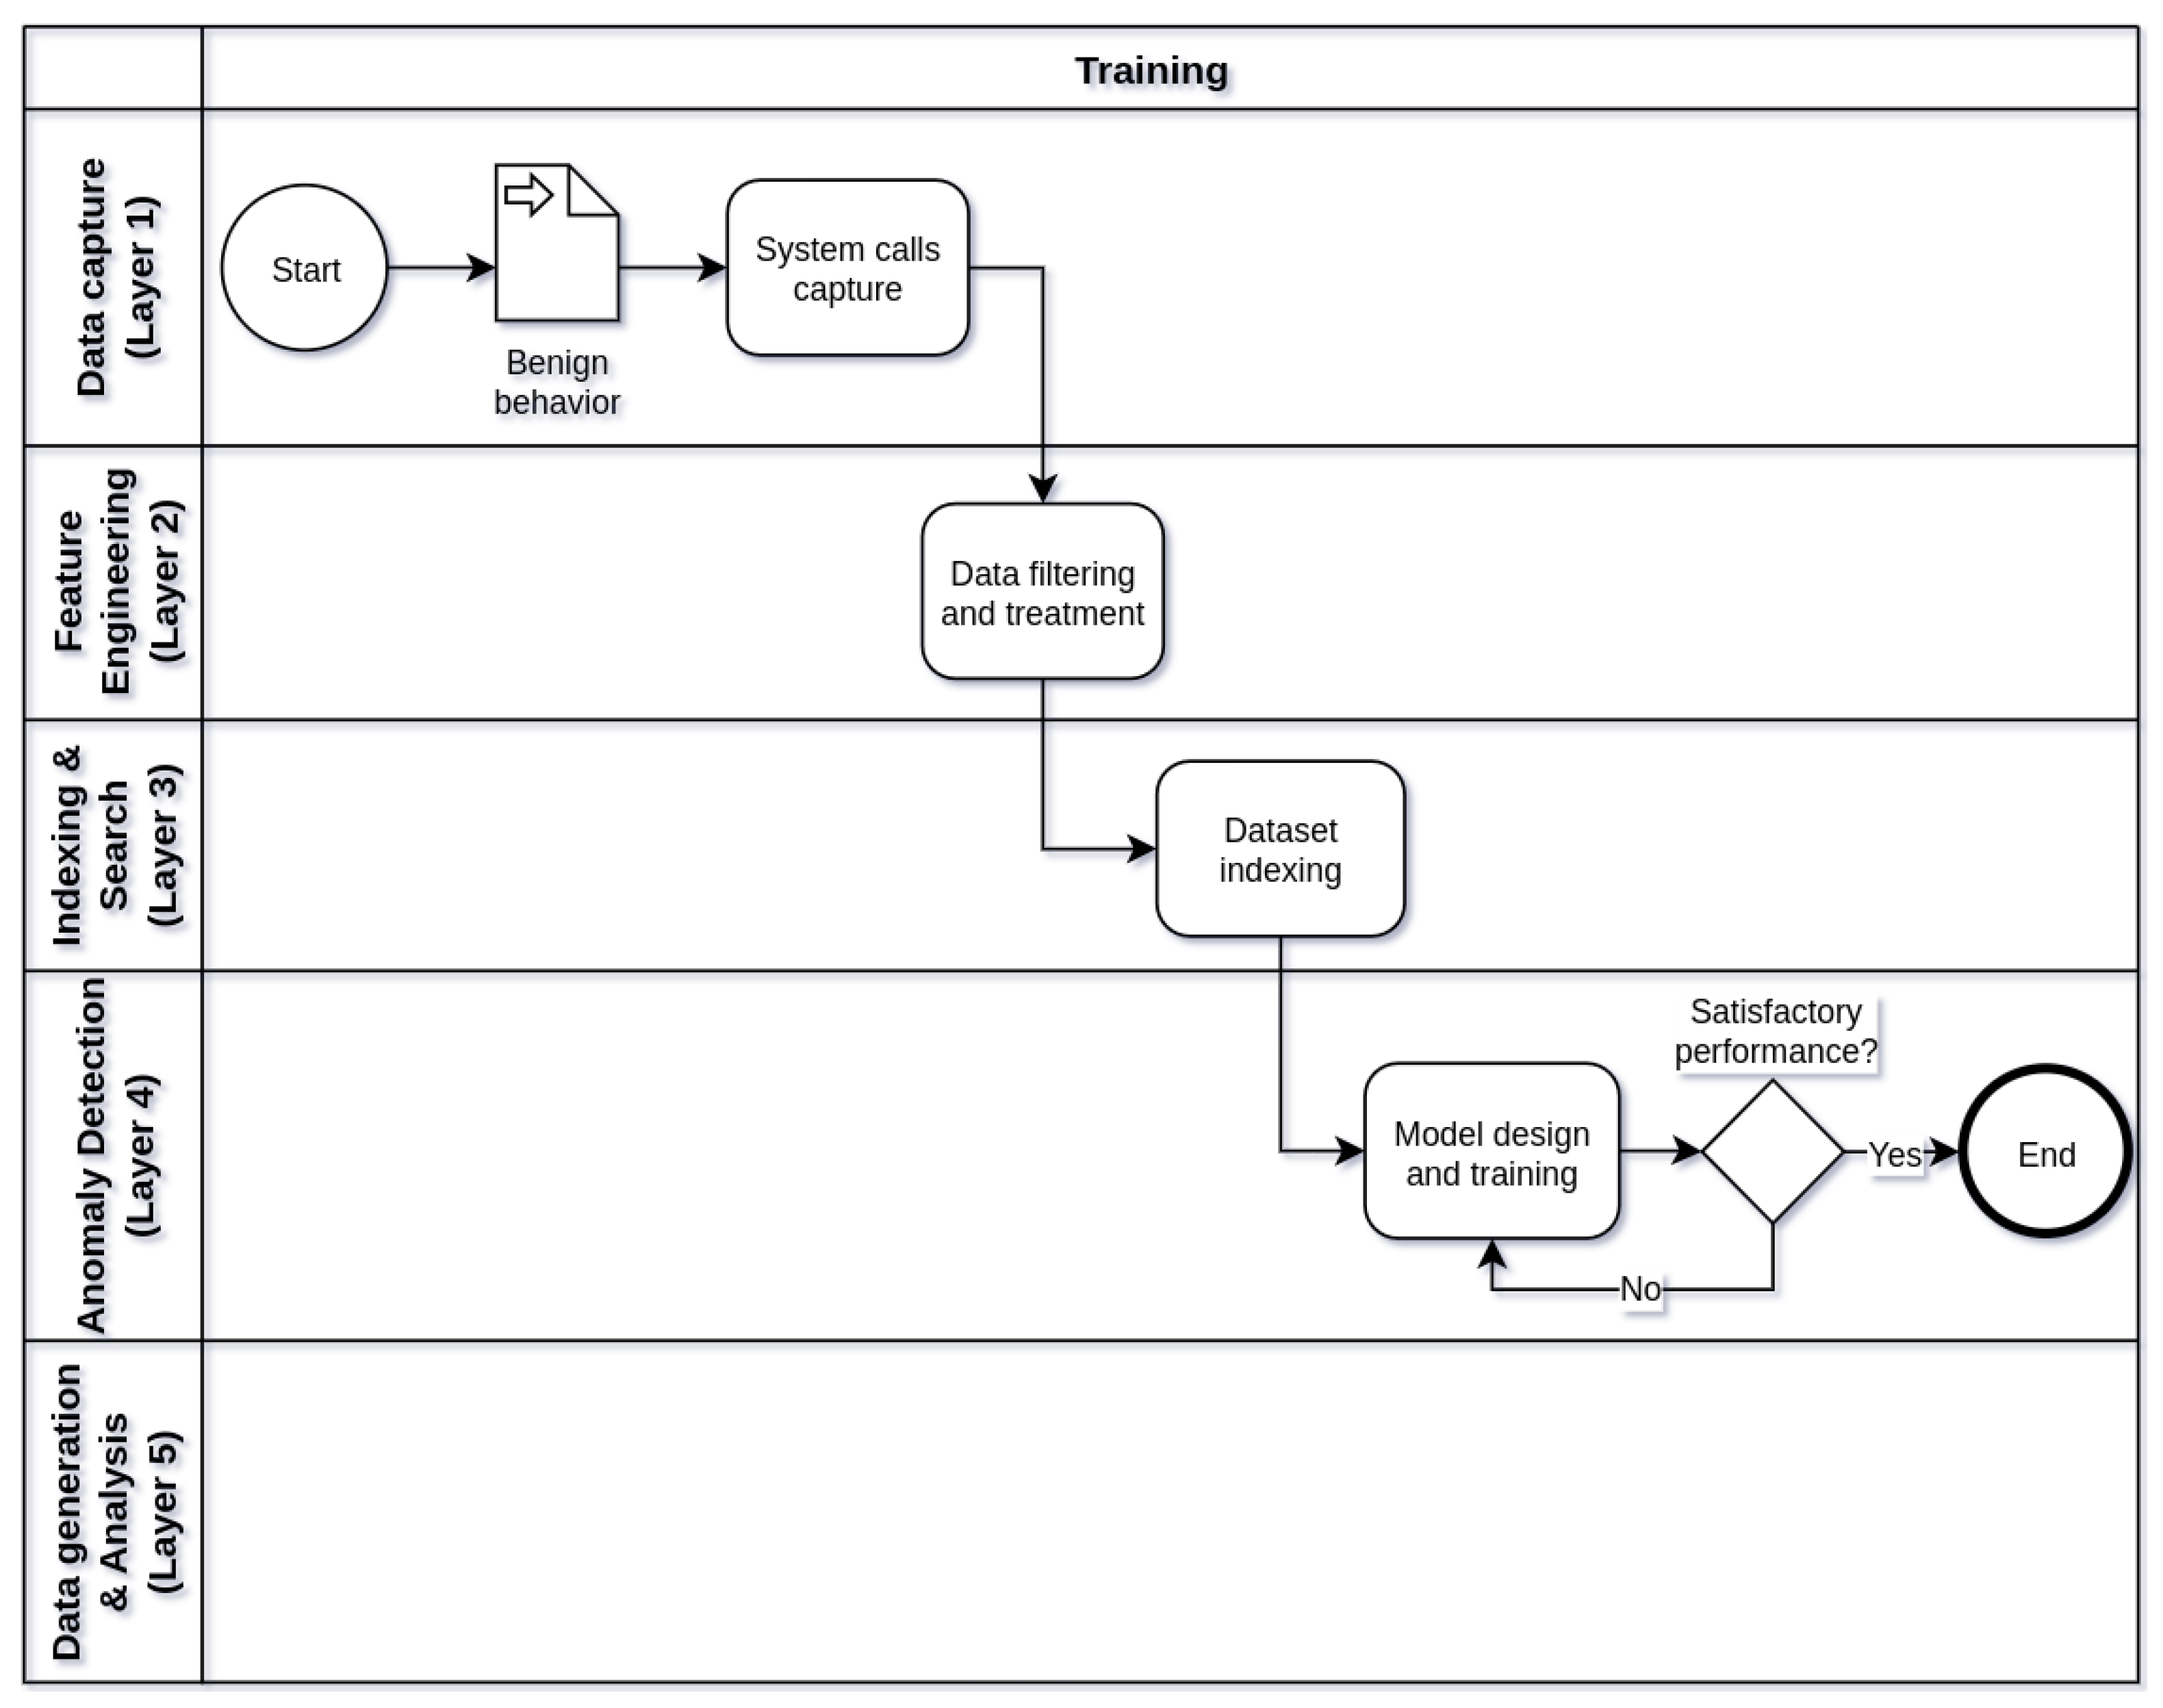
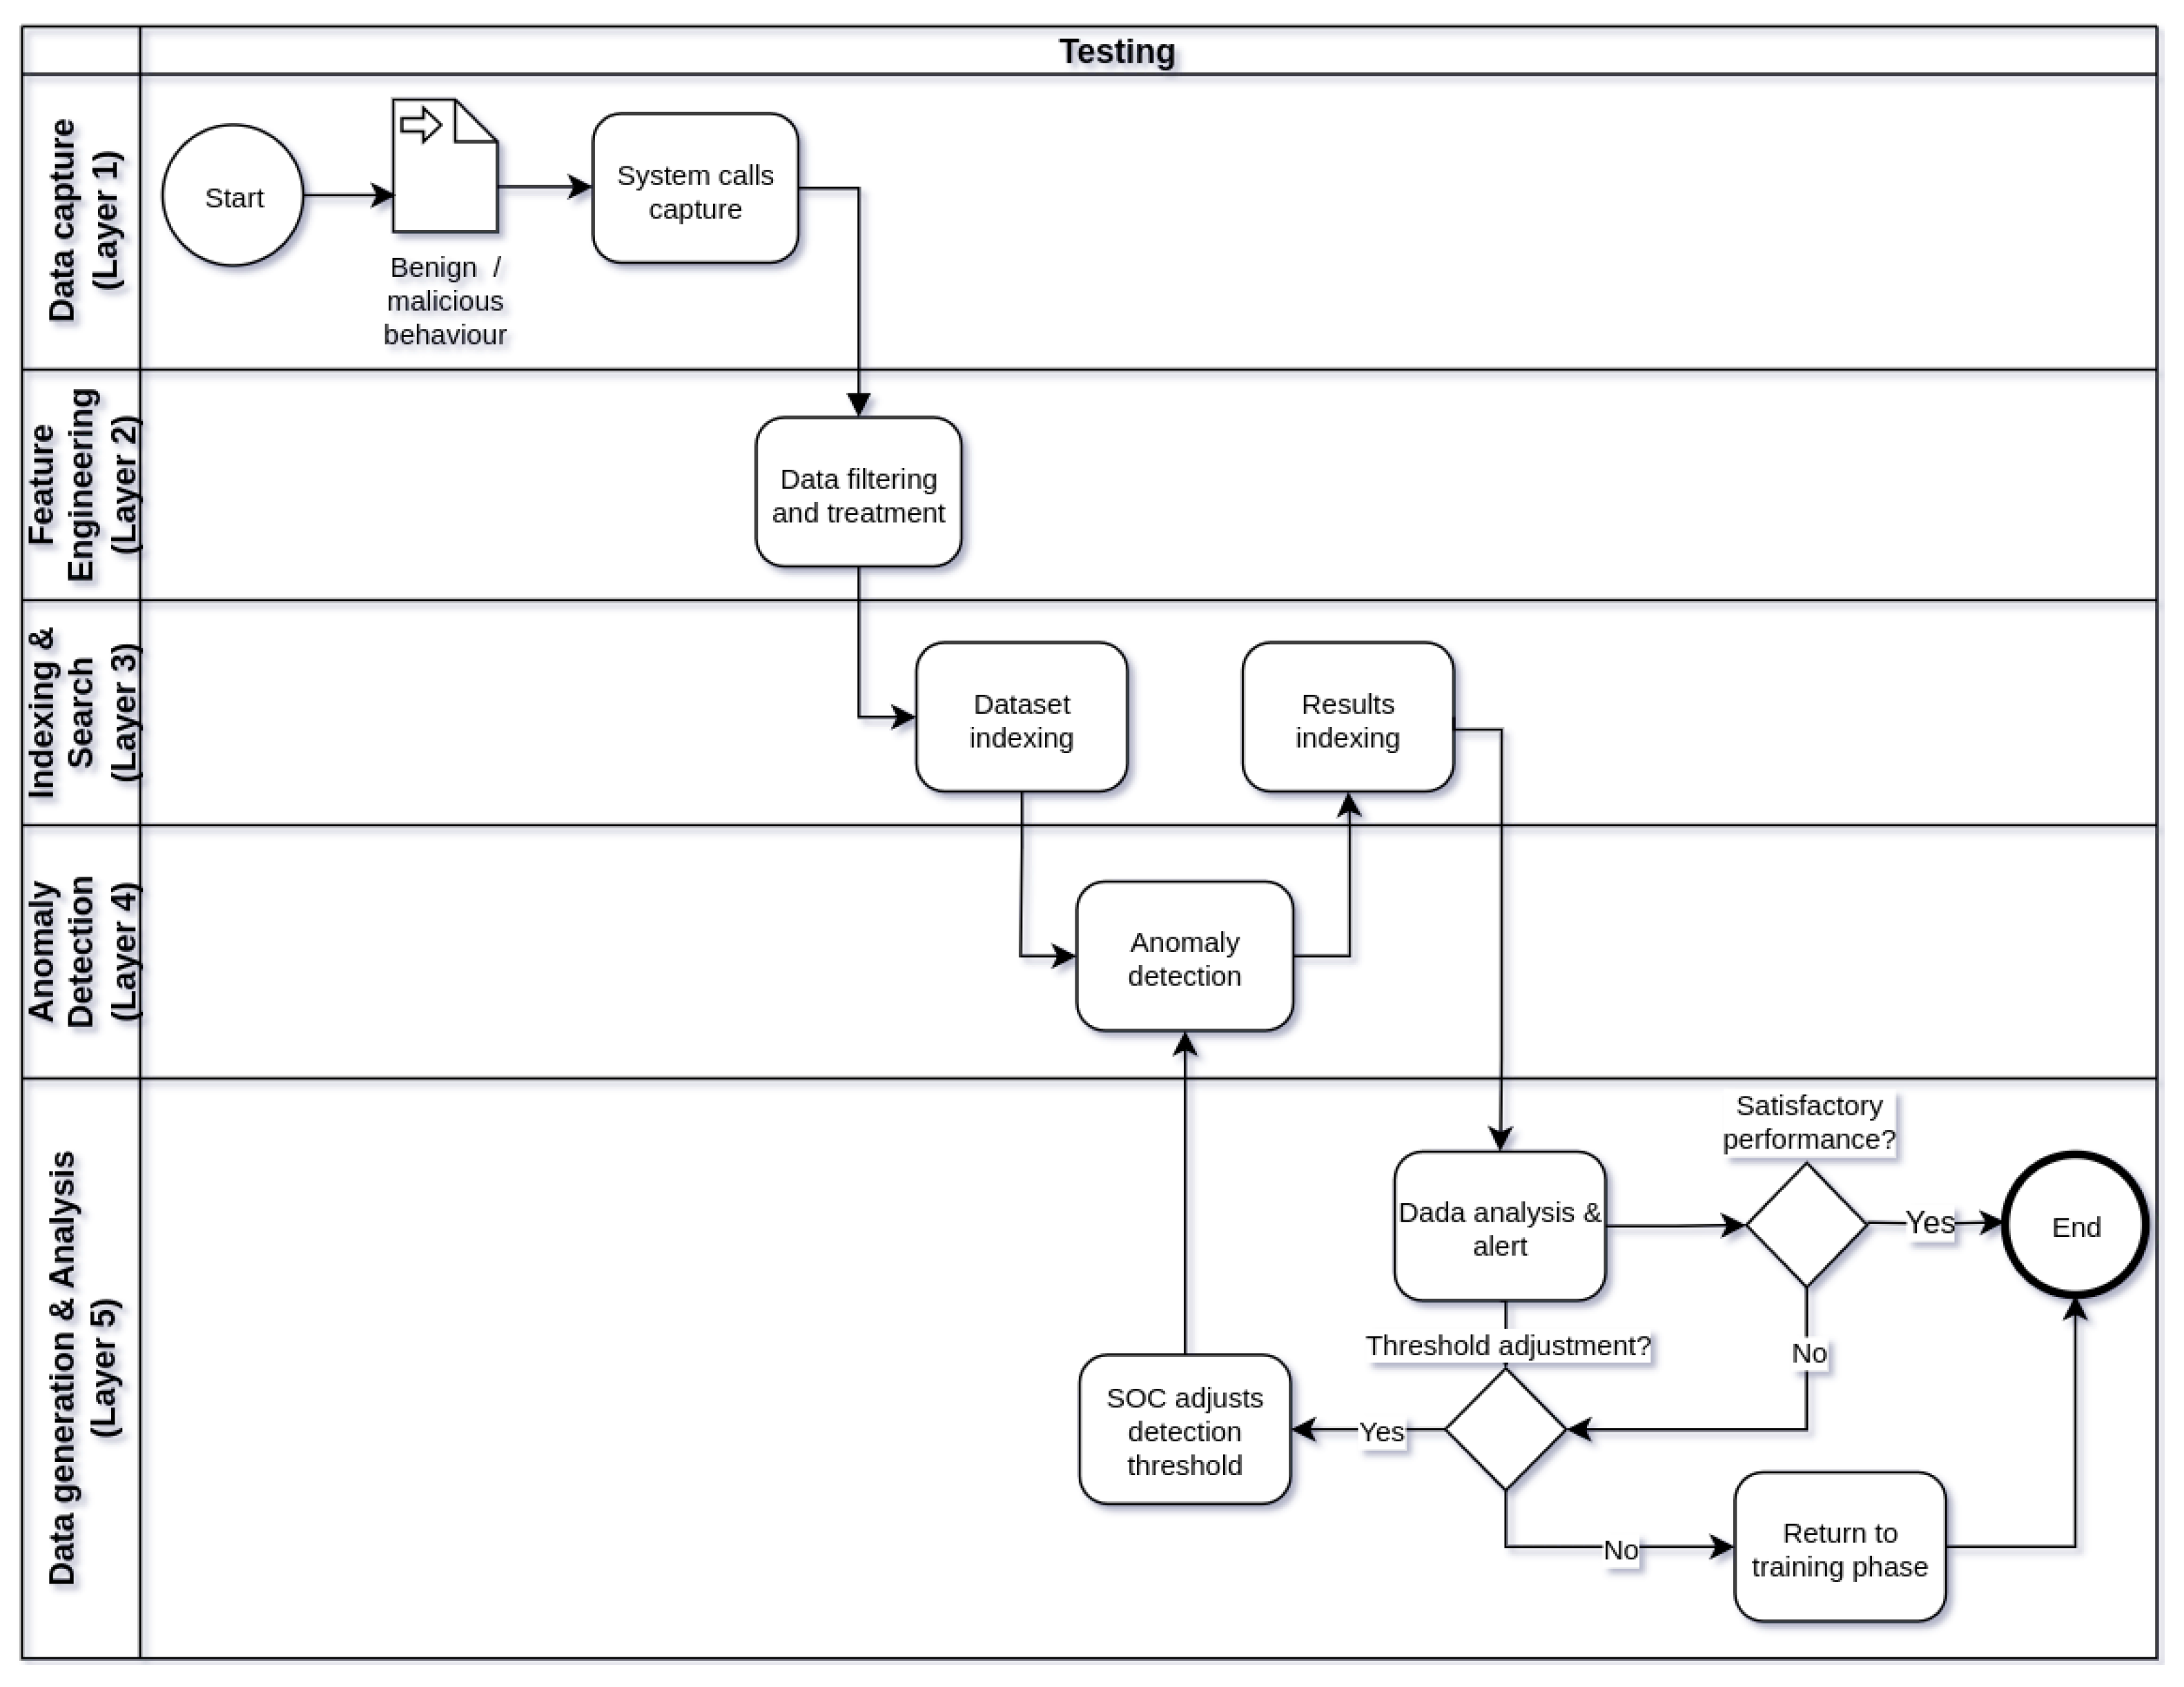
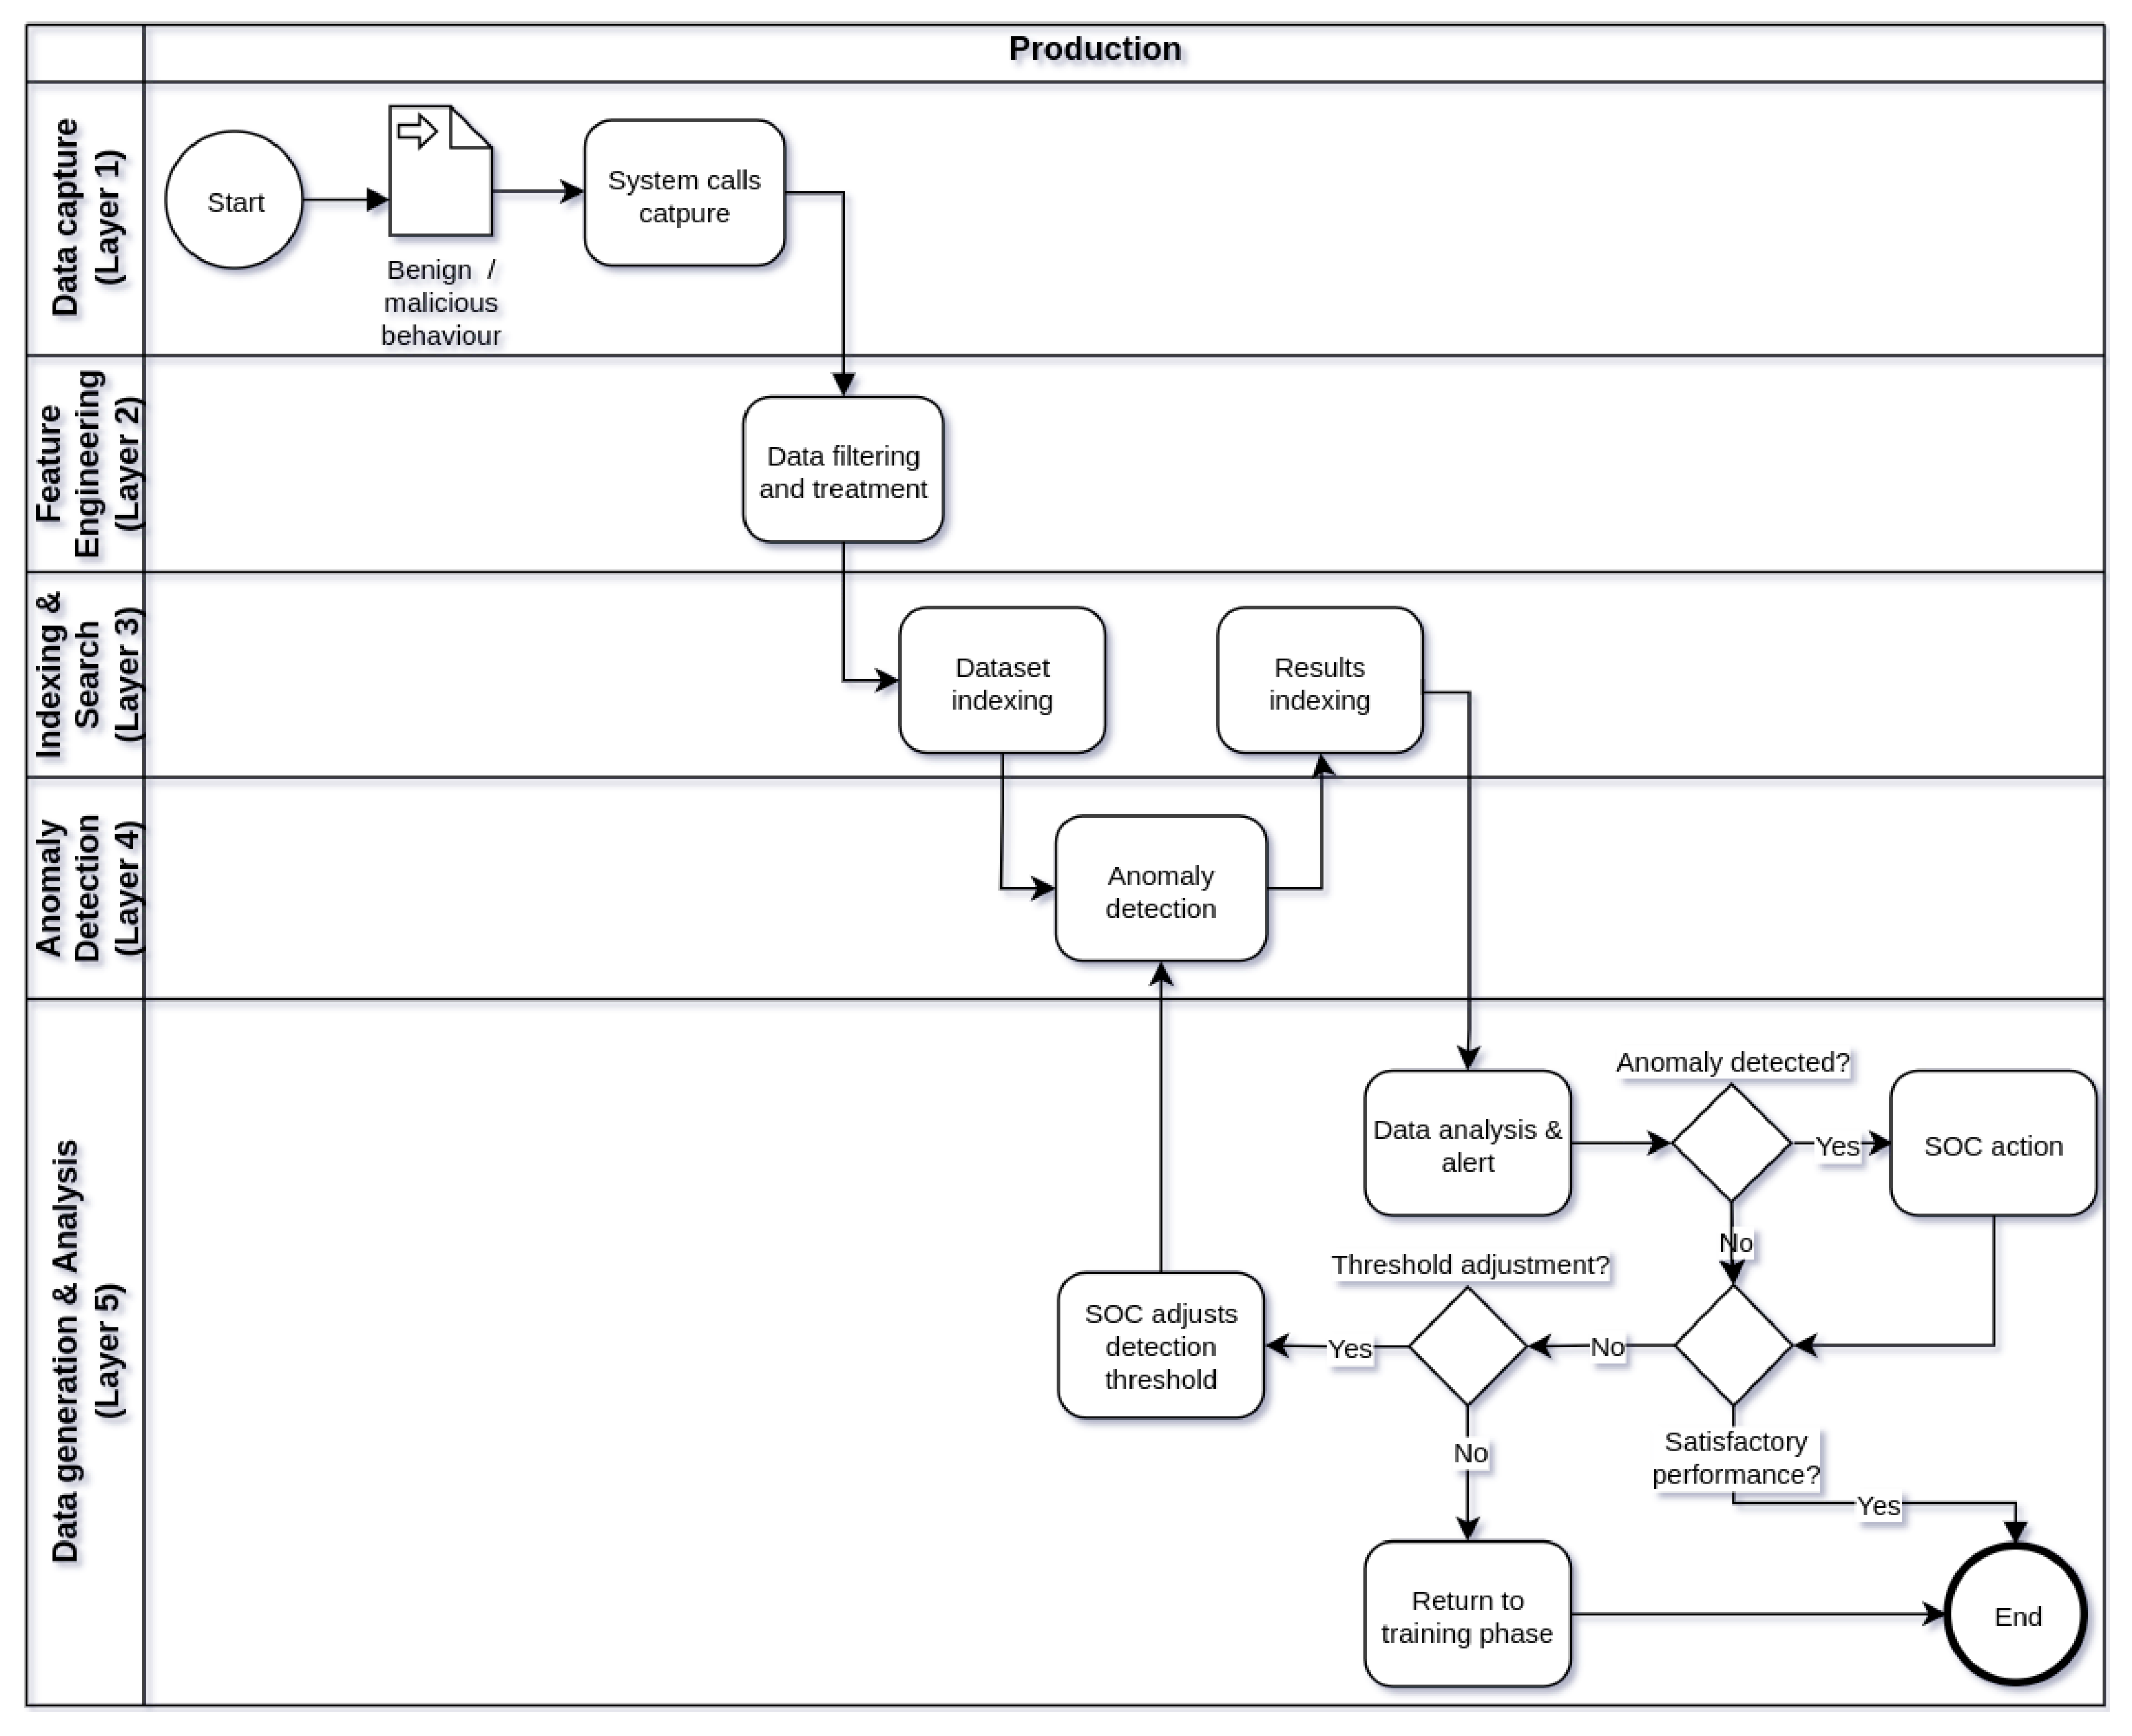
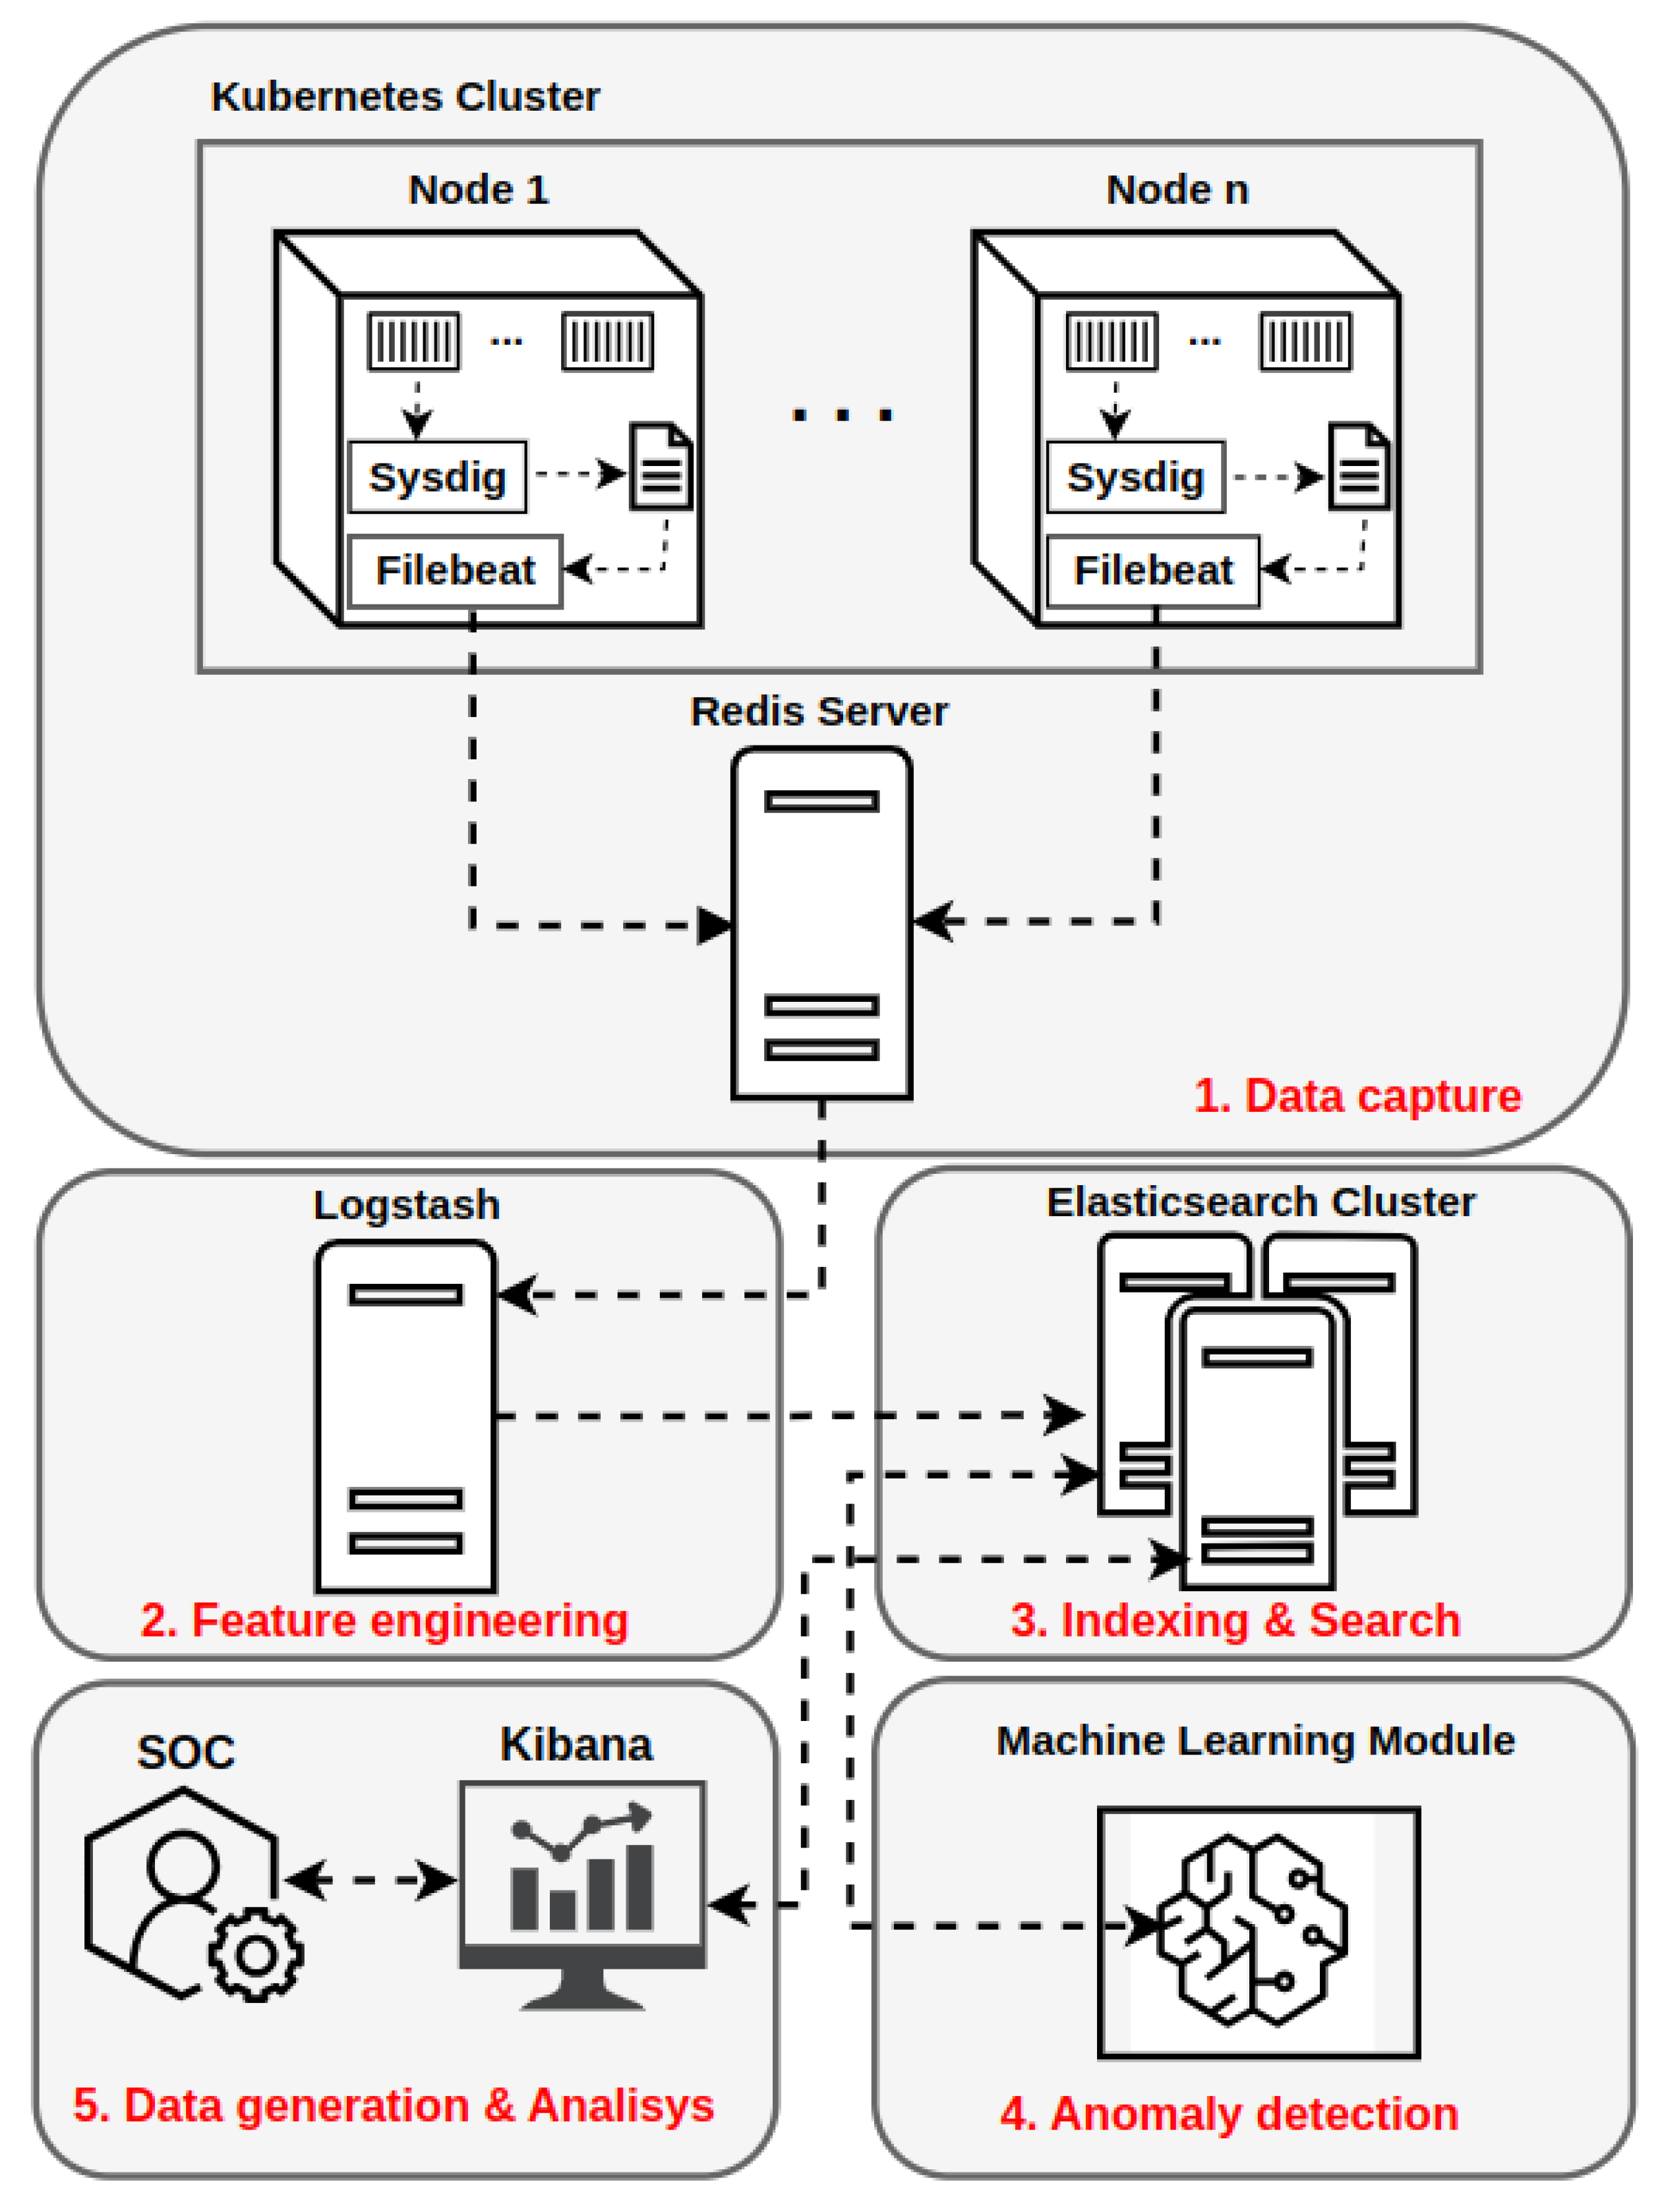
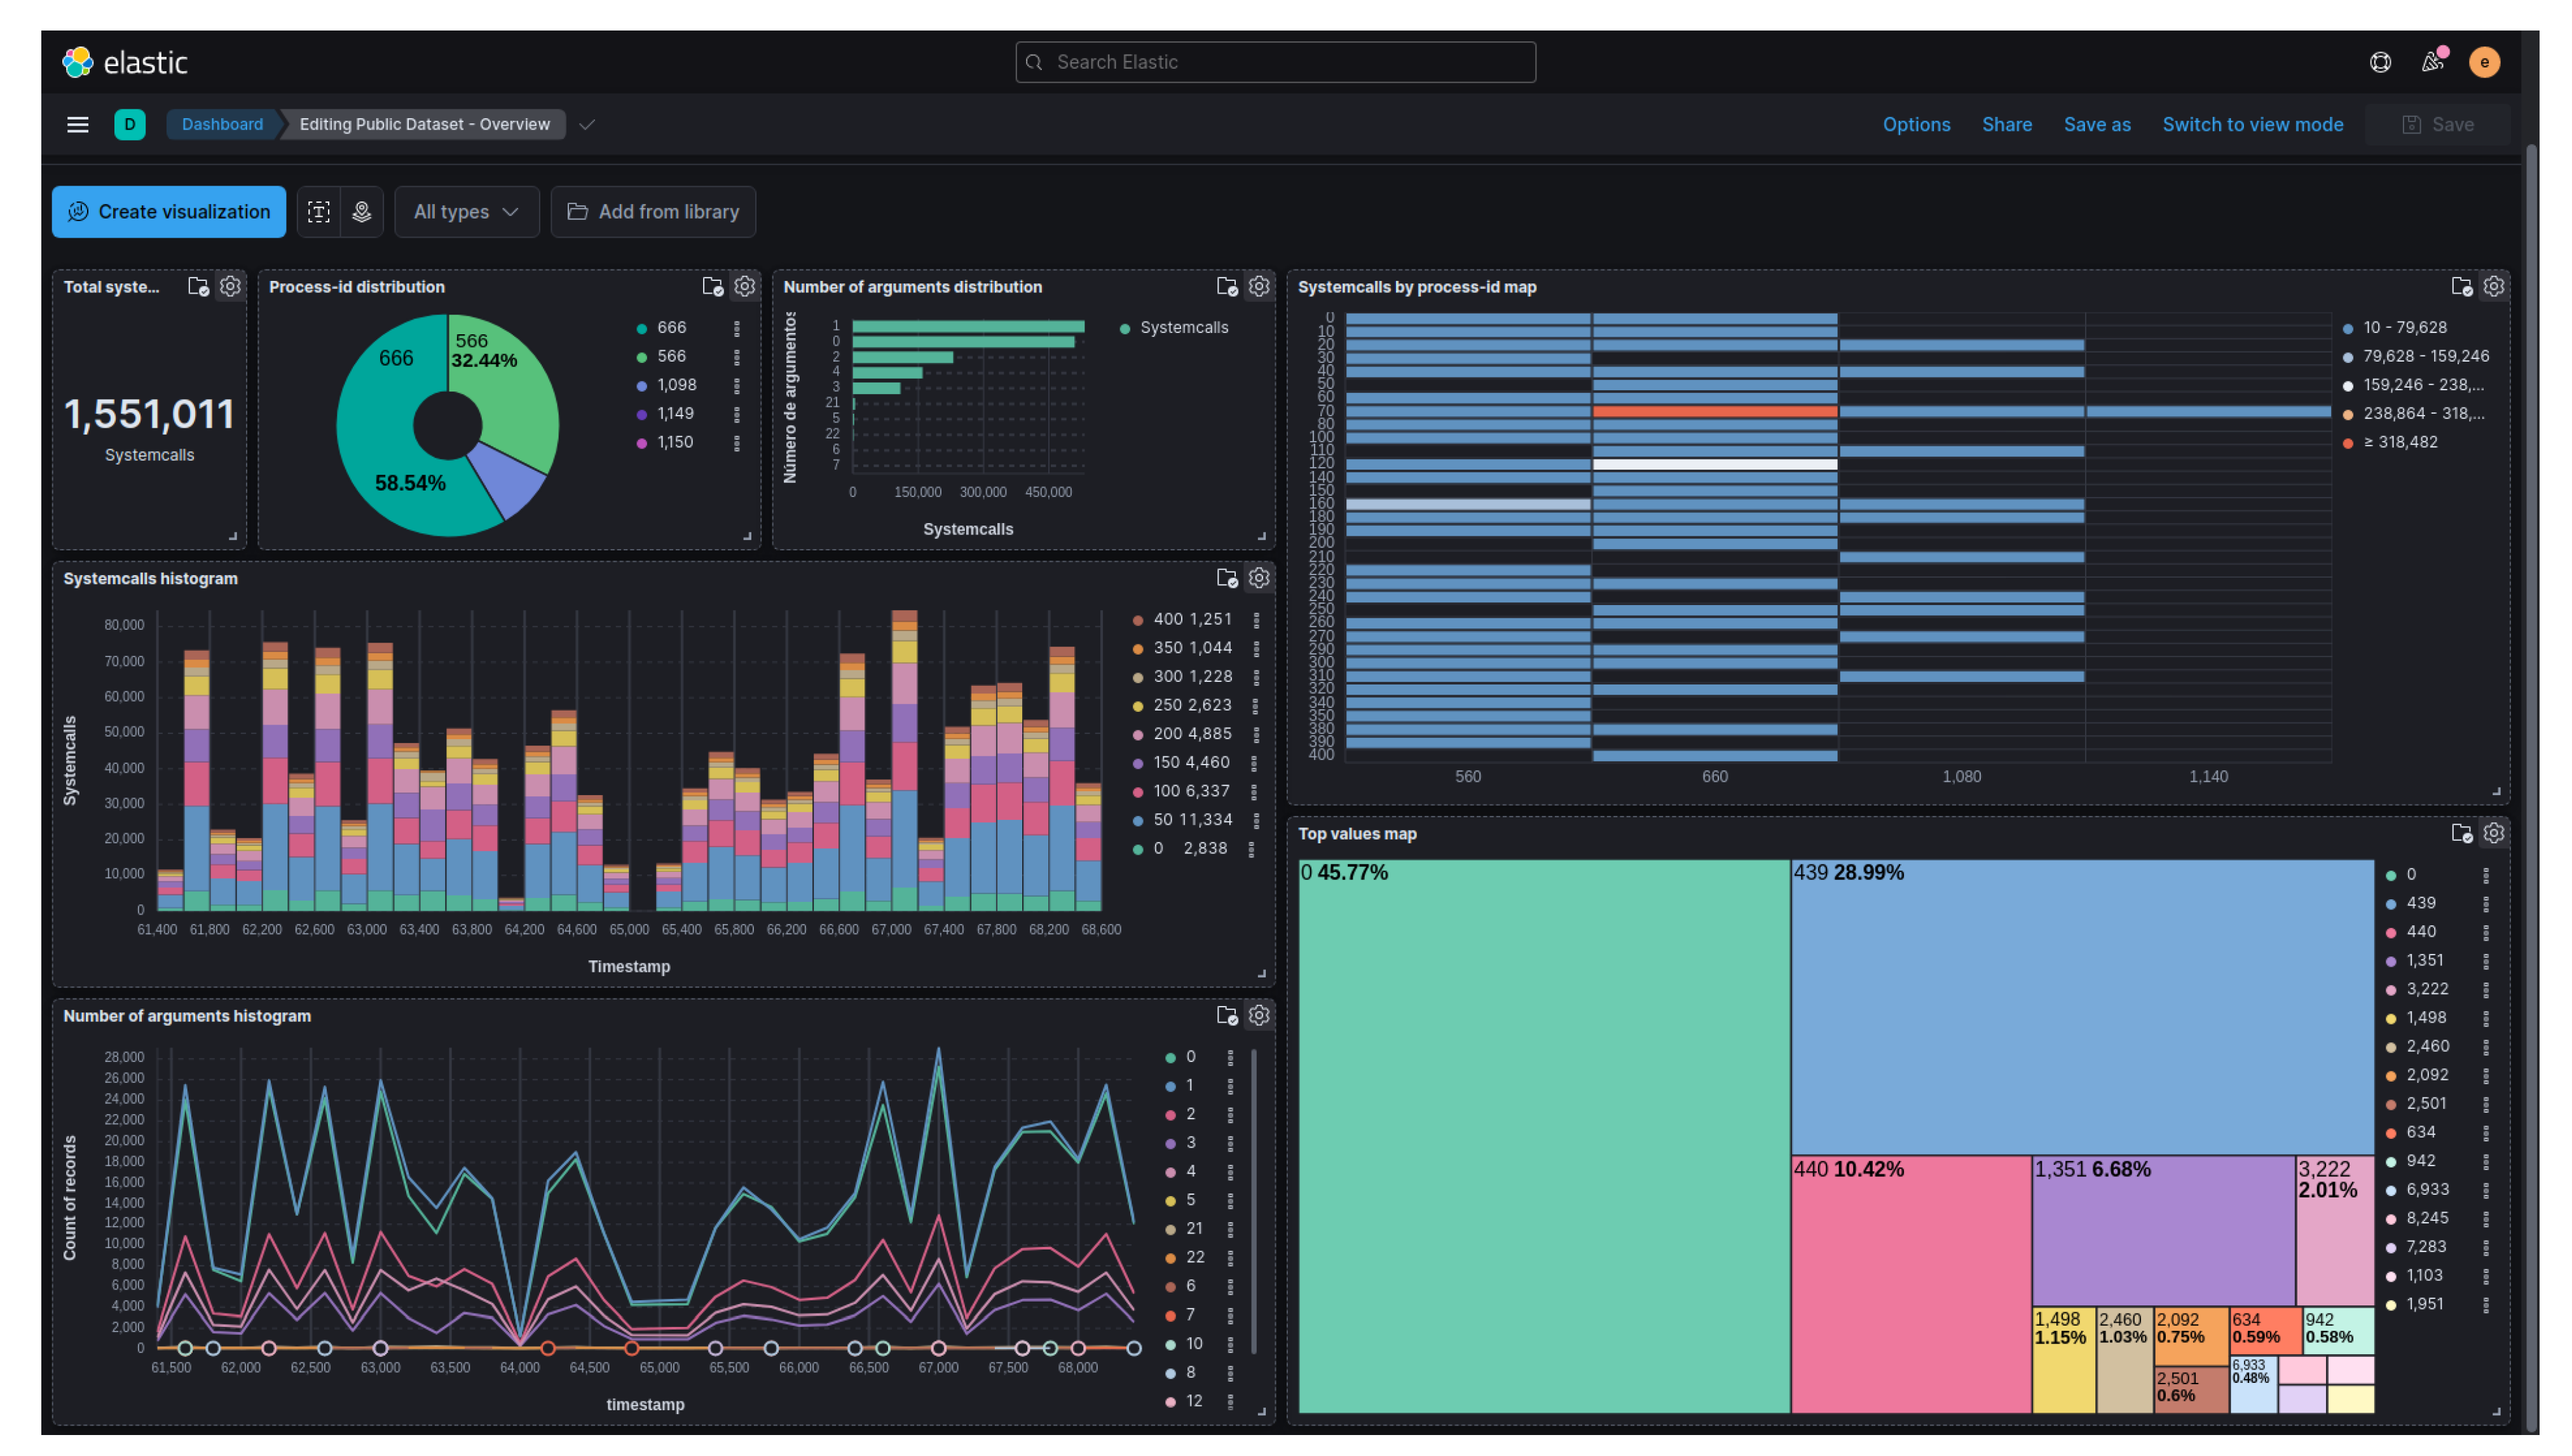
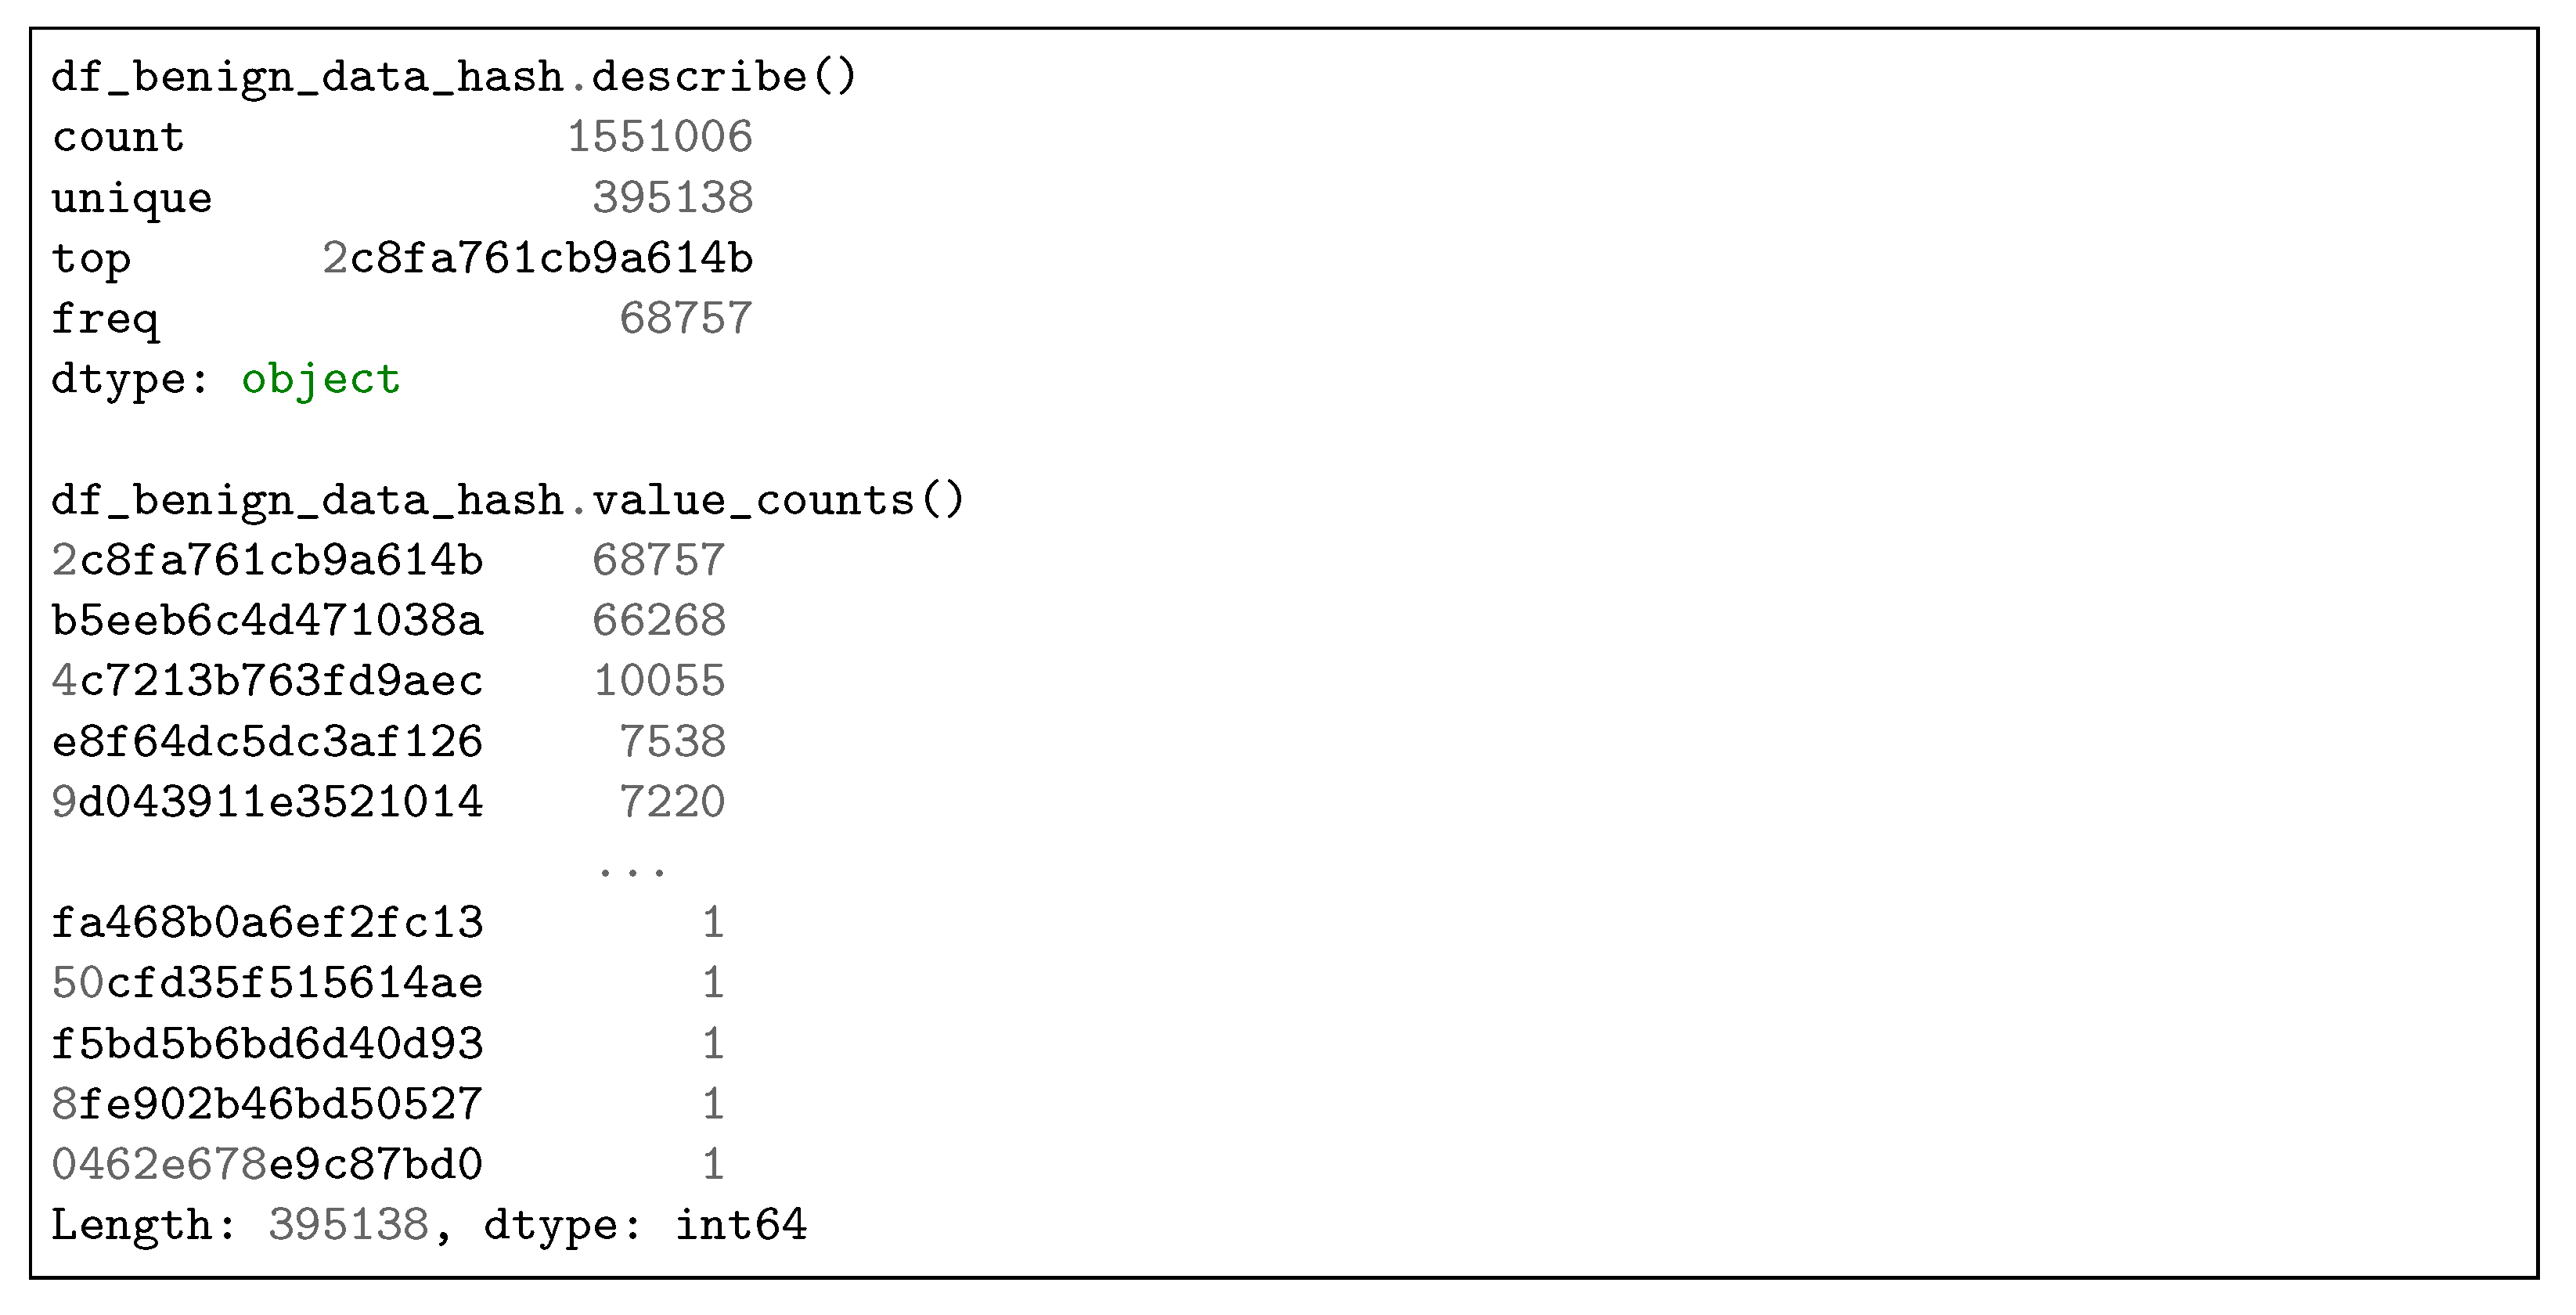
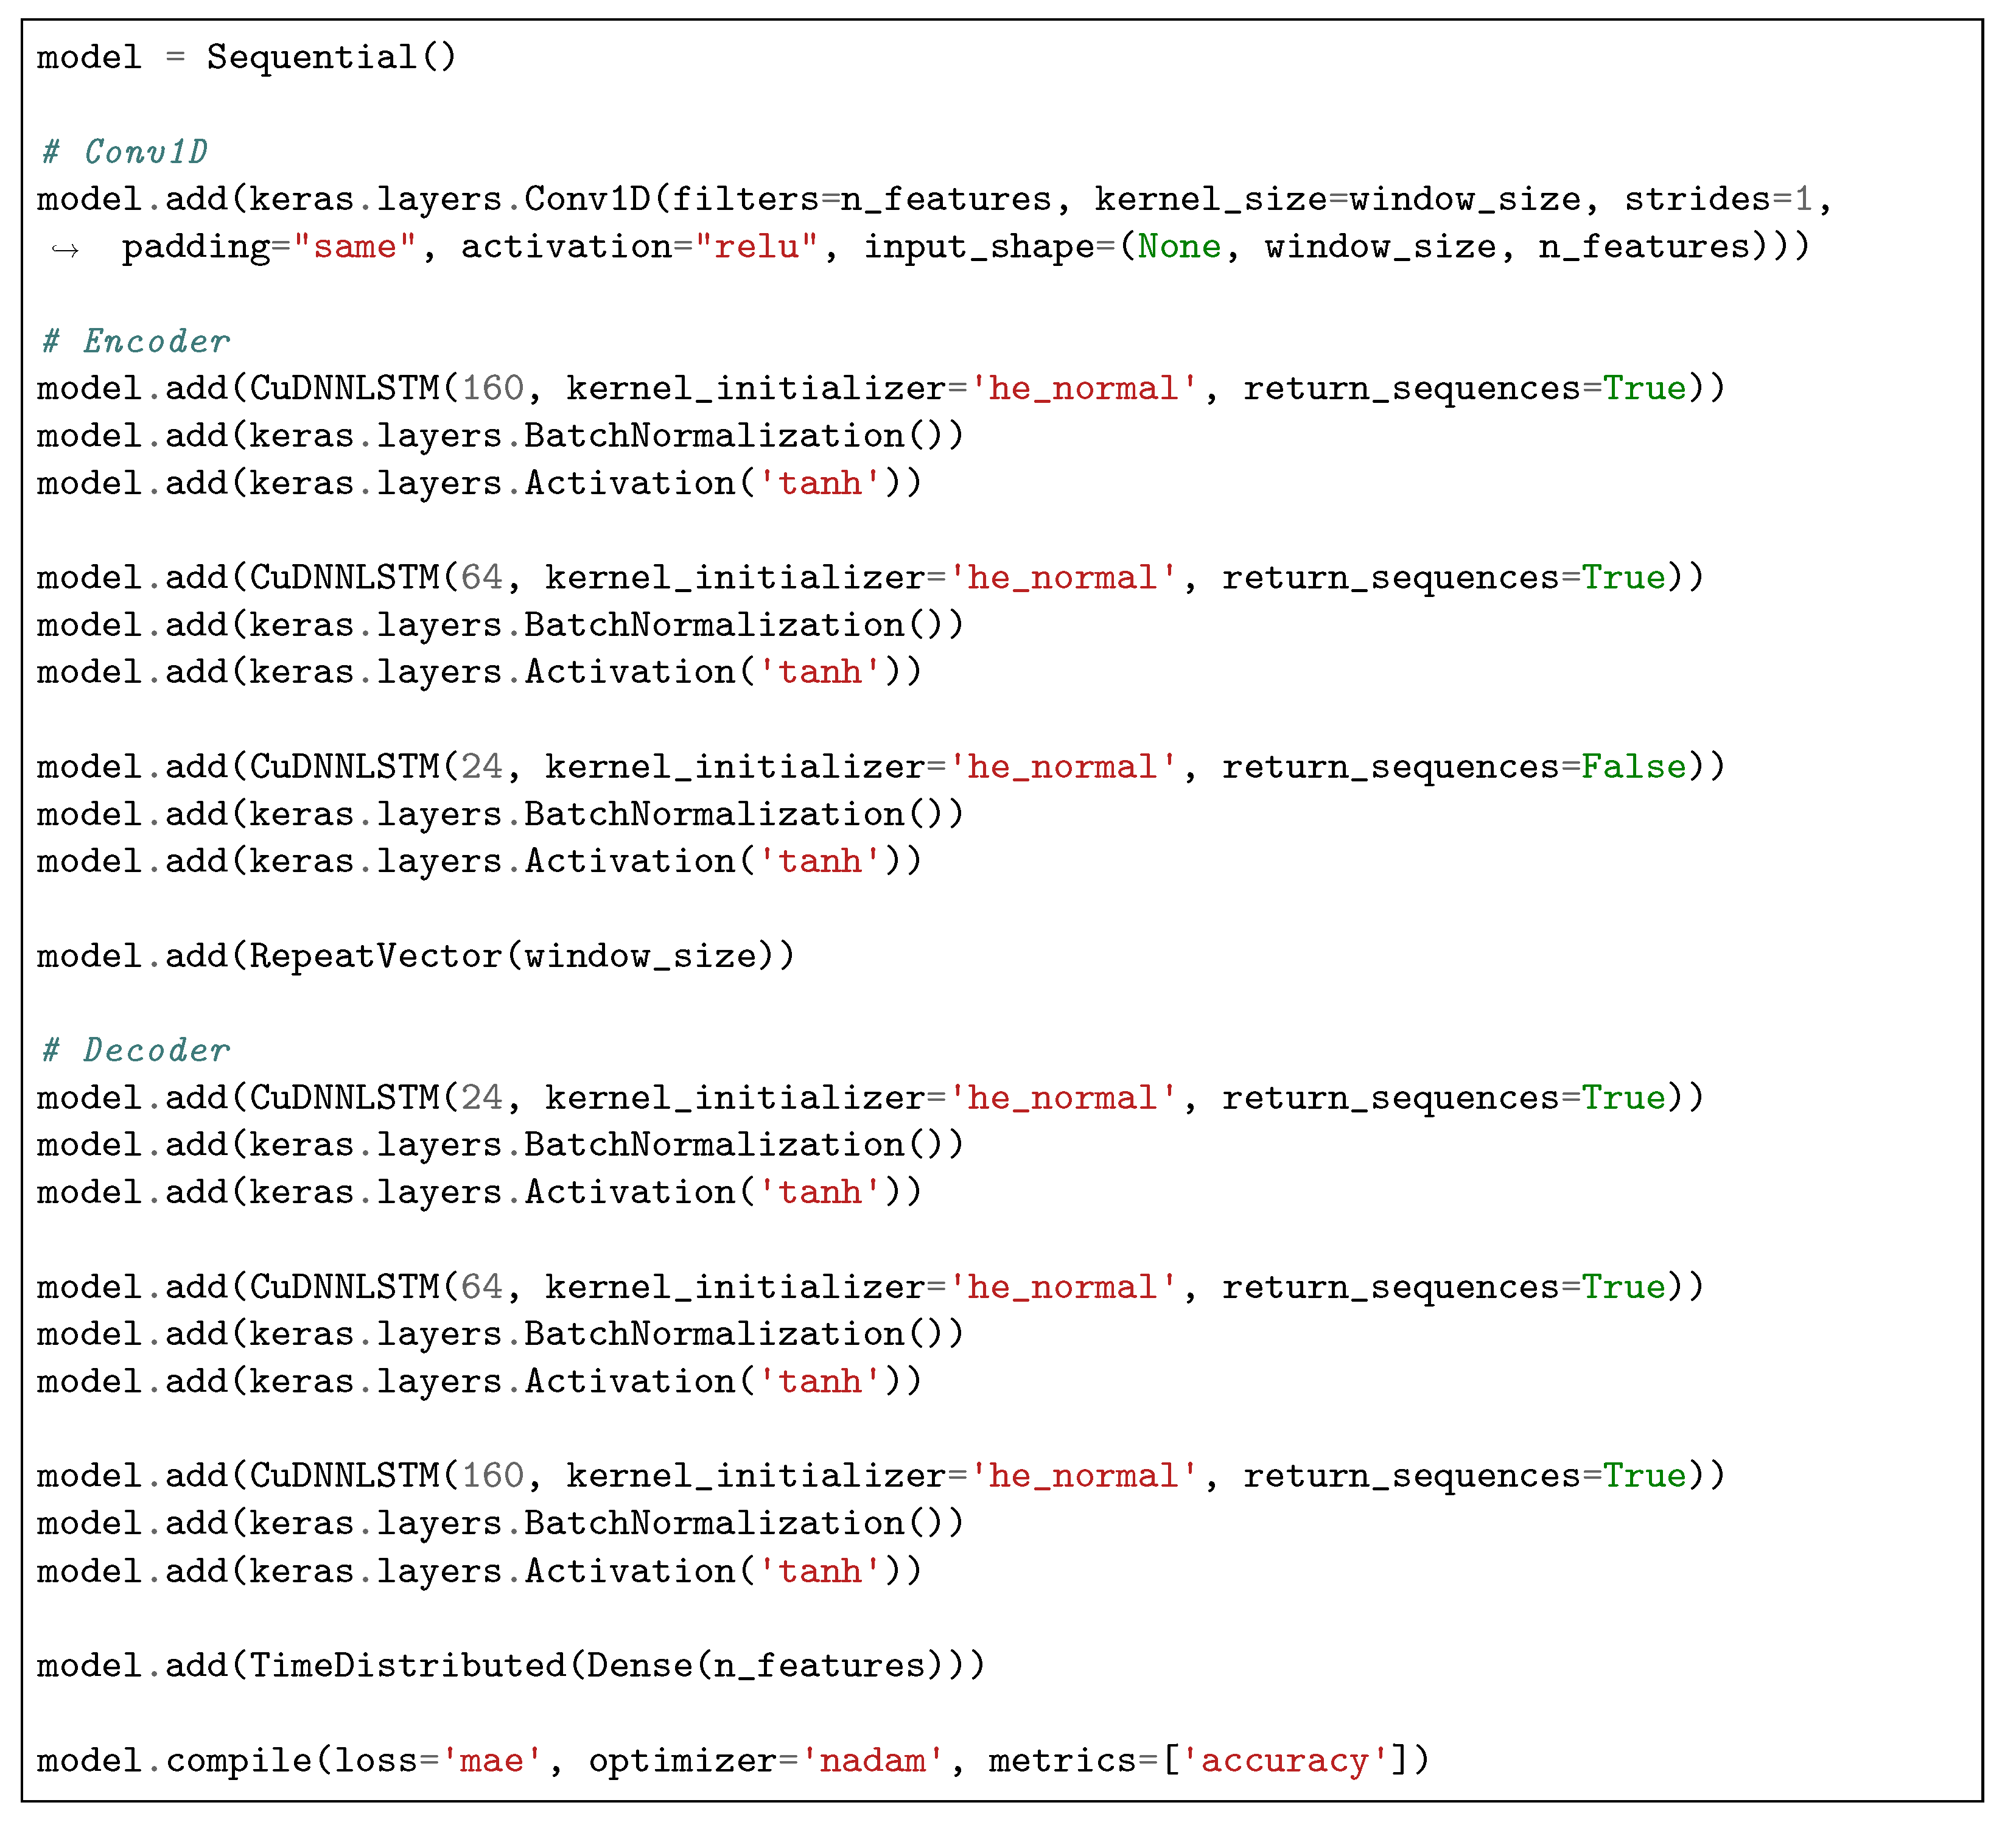

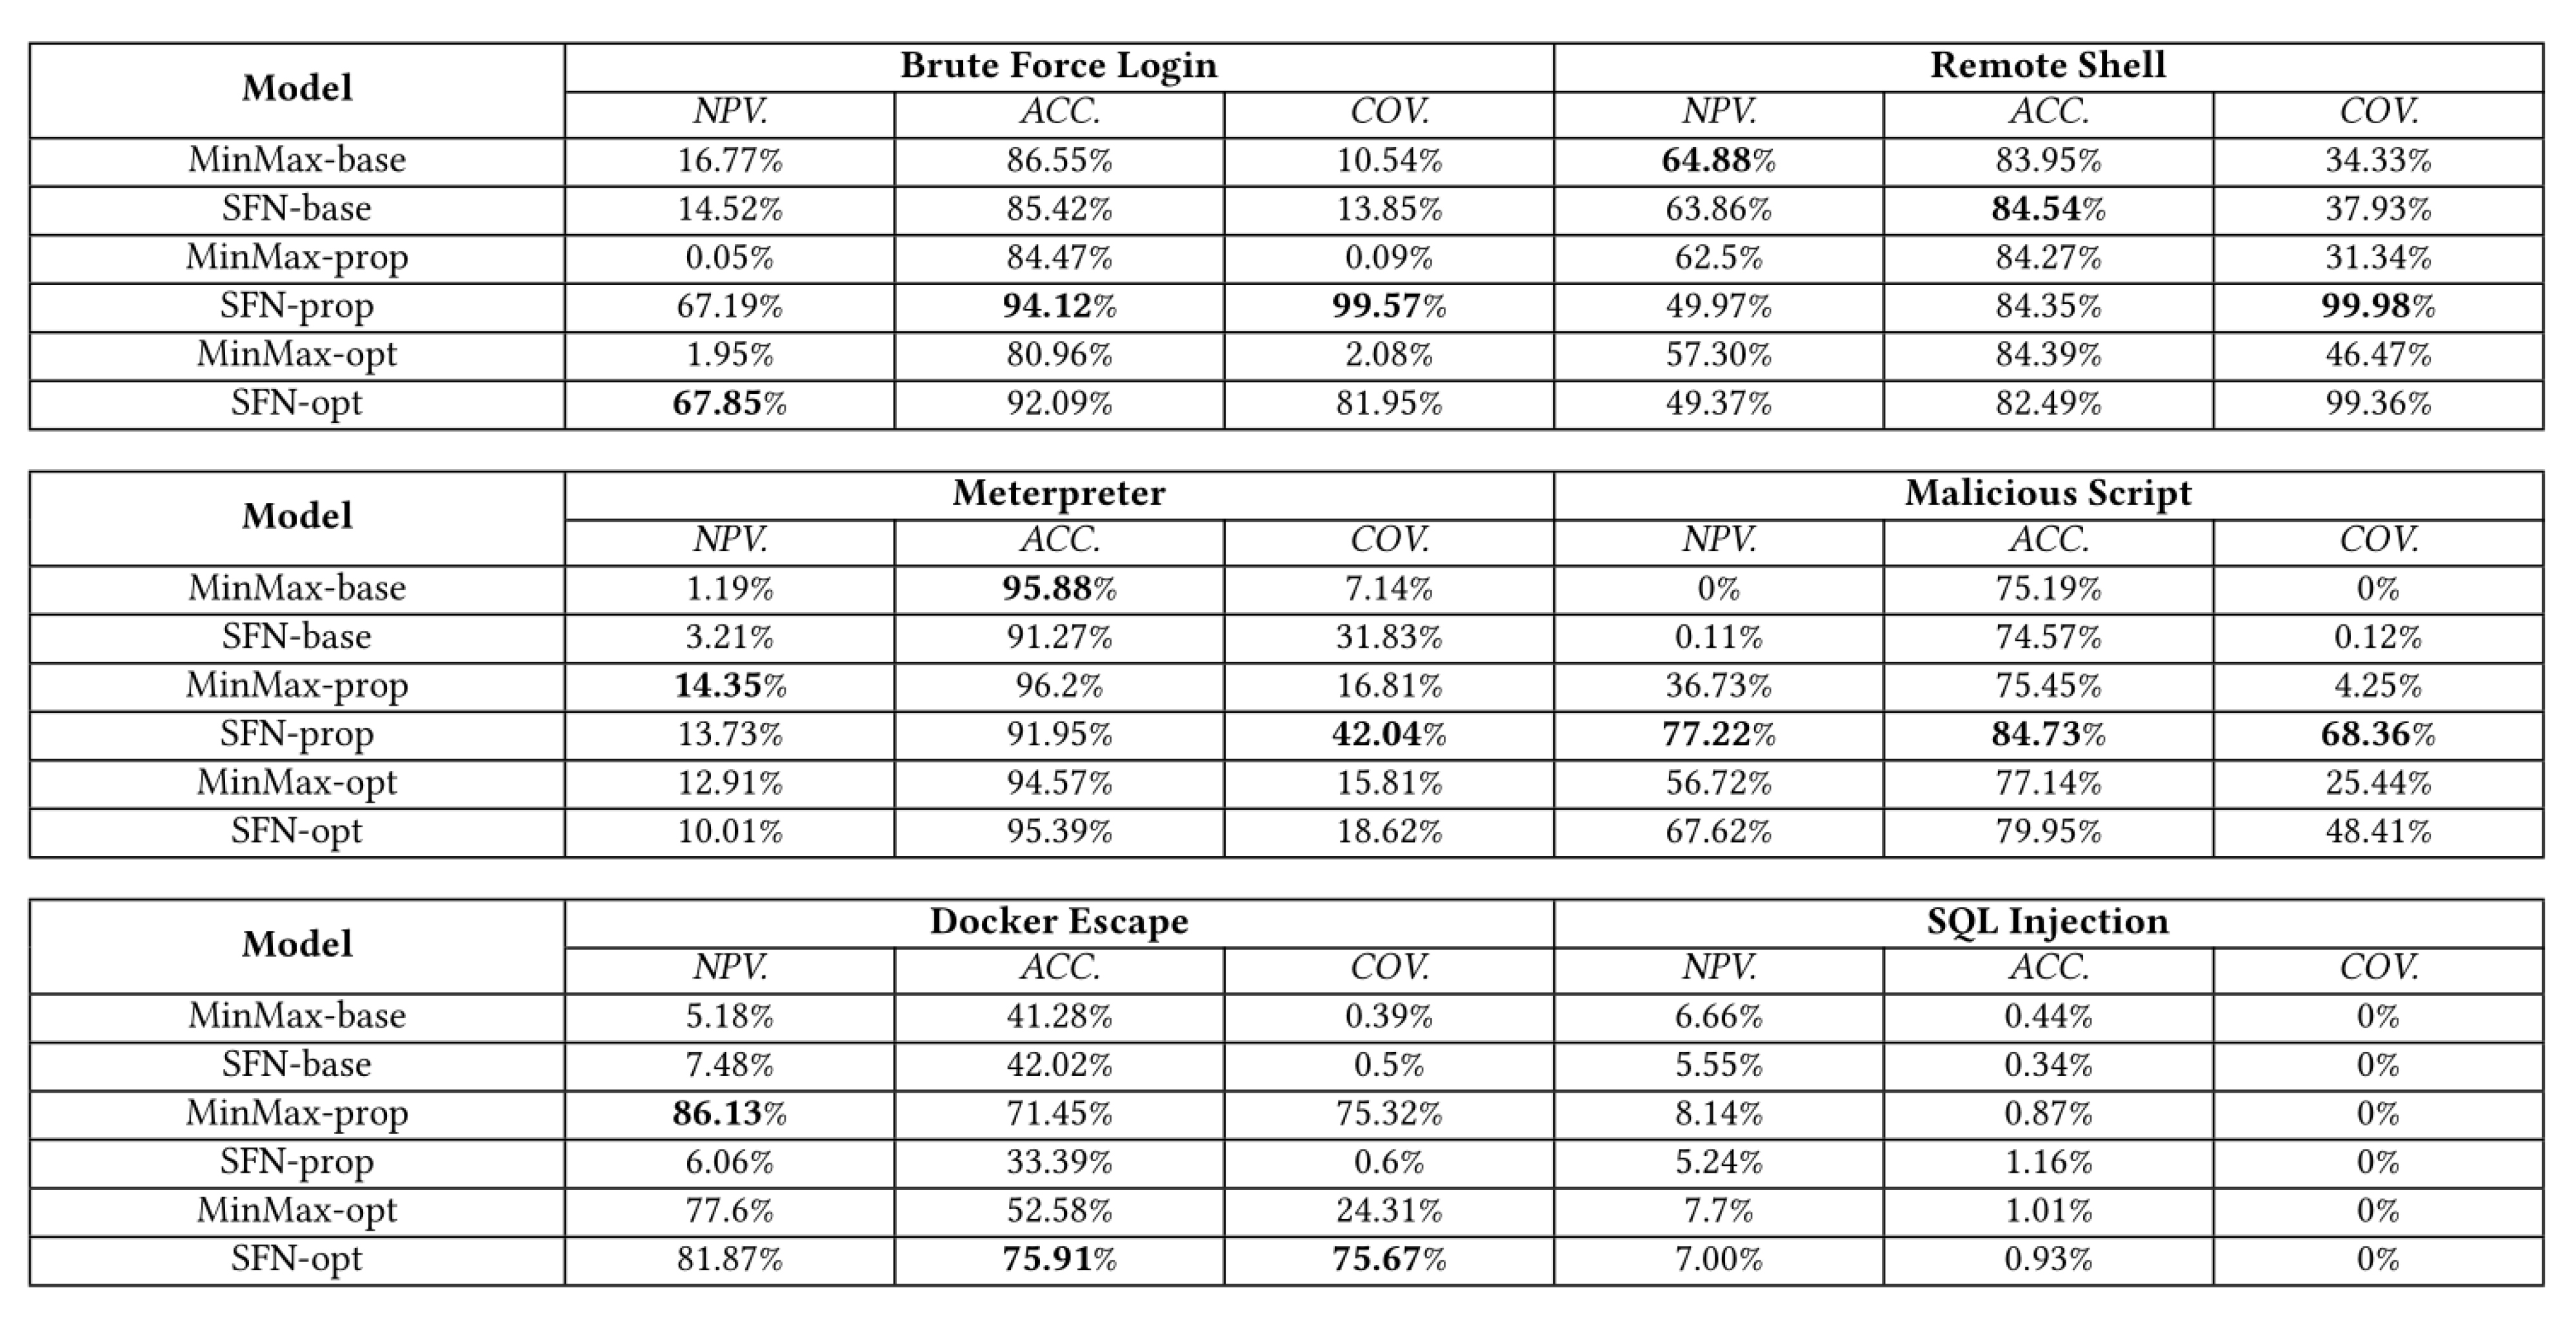
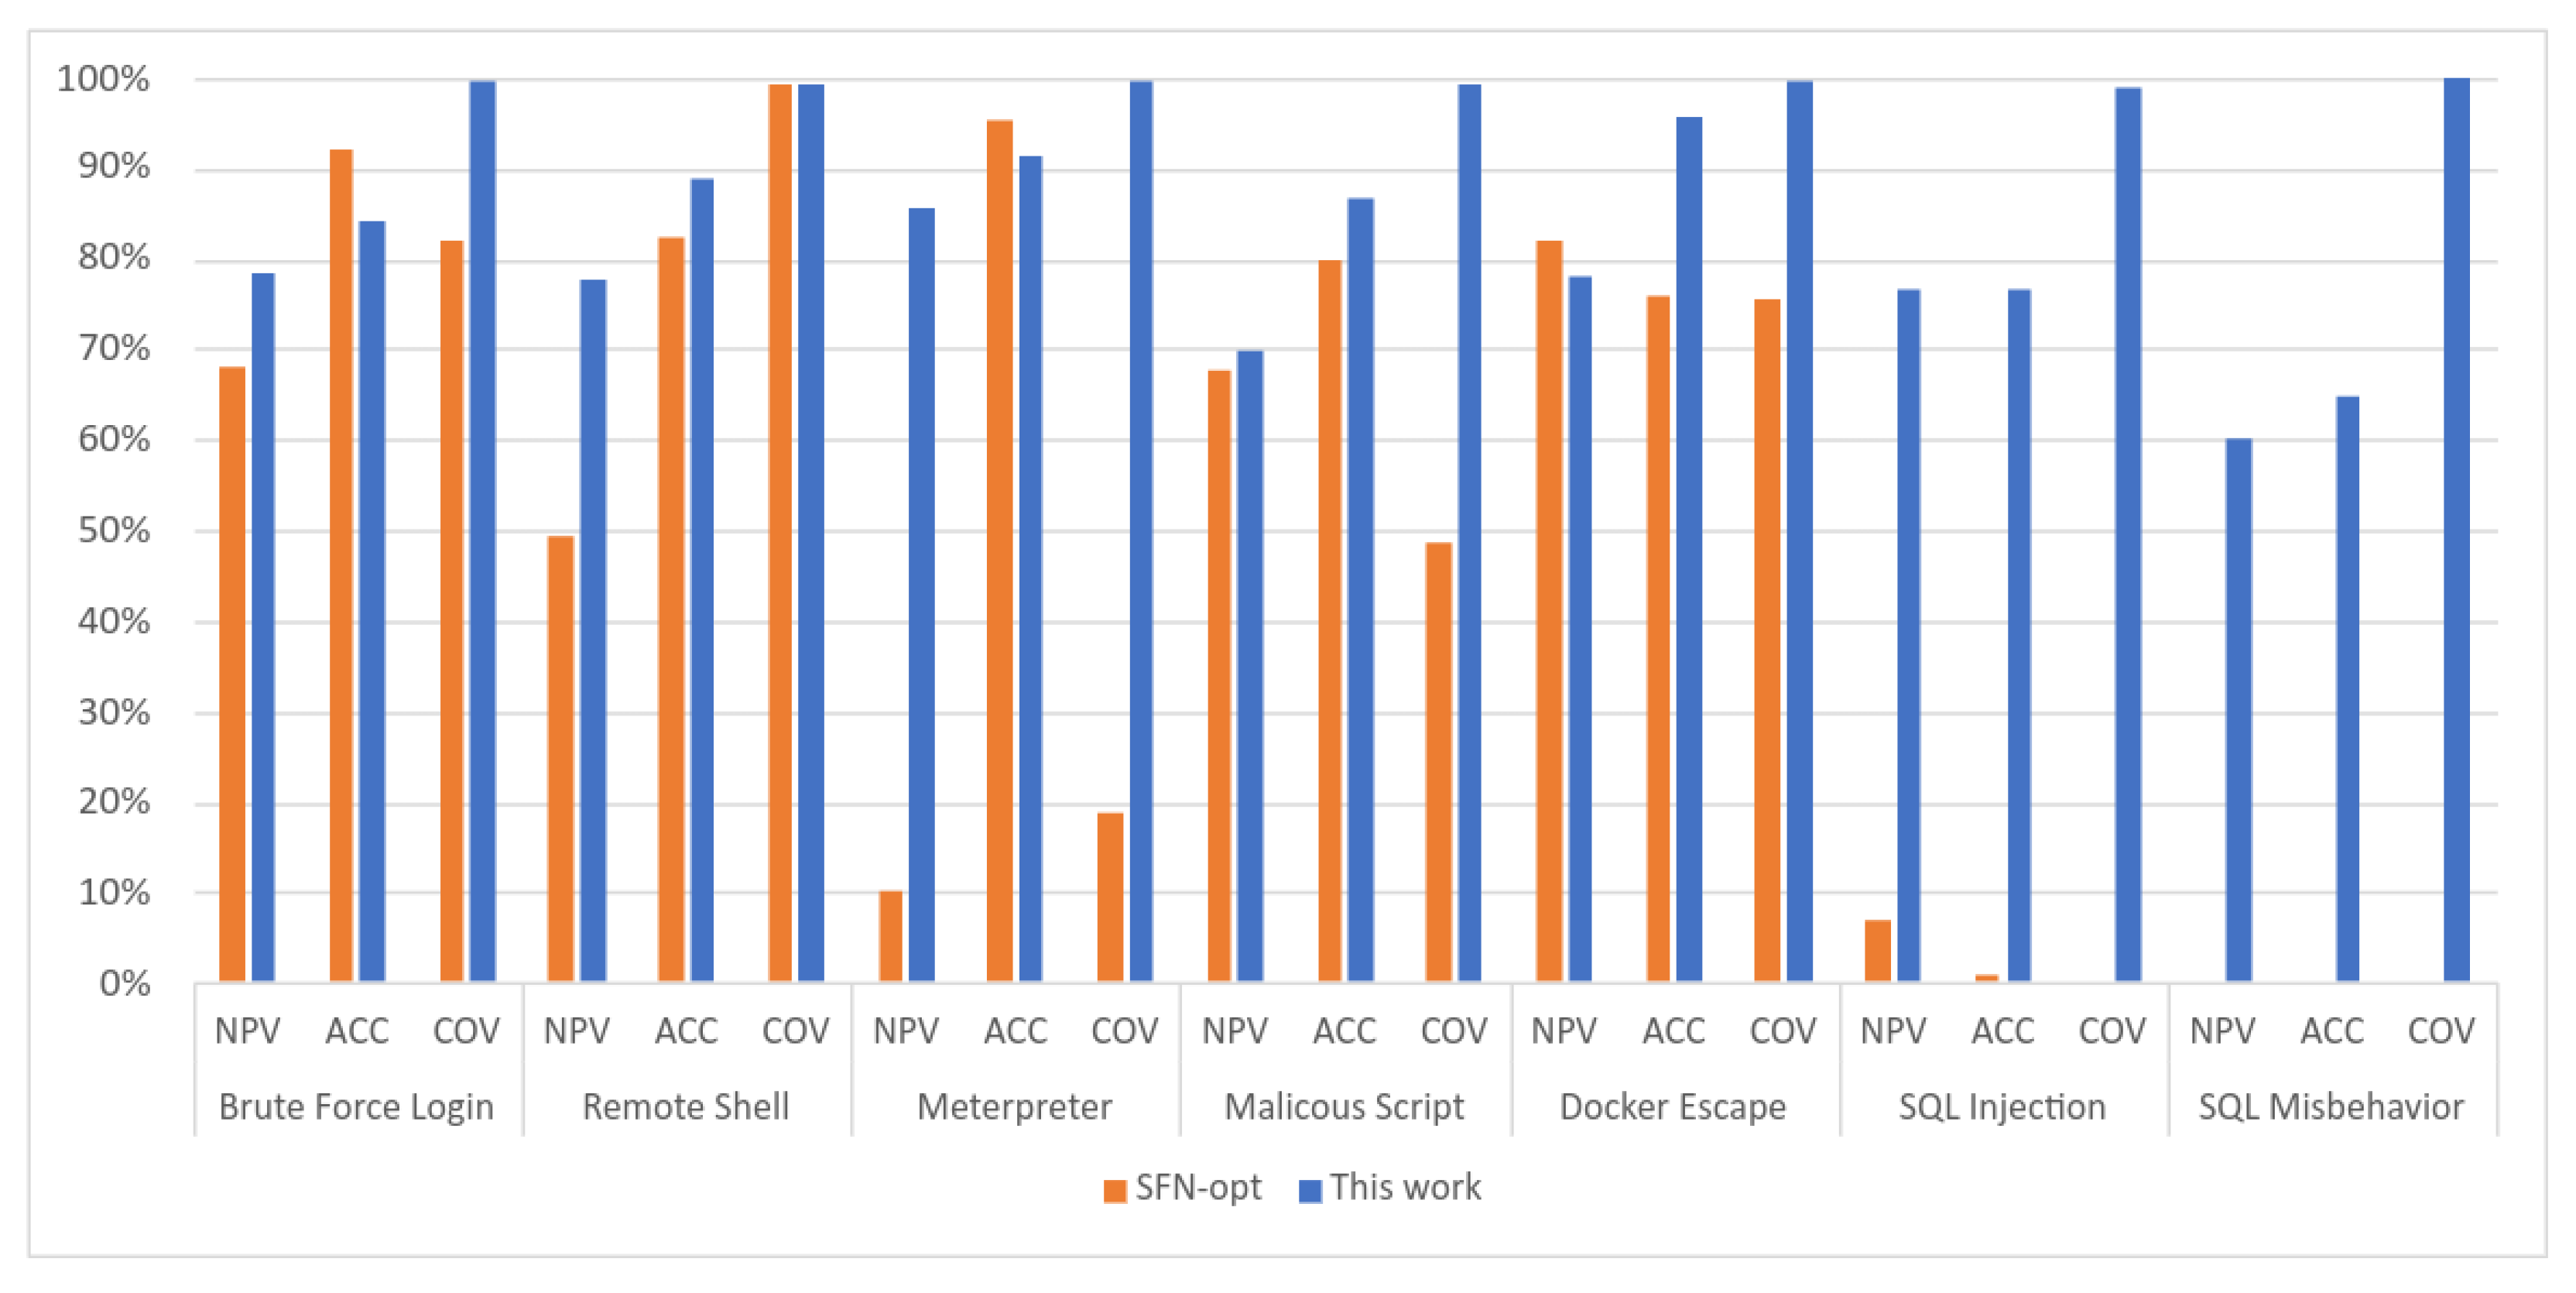
Disclaimer/Publisher’s Note: The statements, opinions and data contained in all publications are solely those of the individual author(s) and contributor(s) and not of MDPI and/or the editor(s). MDPI and/or the editor(s) disclaim responsibility for any injury to people or property resulting from any ideas, methods, instructions or products referred to in the content. |
© 2023 by the authors. Licensee MDPI, Basel, Switzerland. This article is an open access article distributed under the terms and conditions of the Creative Commons Attribution (CC BY) license (https://creativecommons.org/licenses/by/4.0/).