Article

Construction of an Accurate Wheat-Grain Model Based on X-ray Tomography and Bonding Parameters by Discrete Element

1
College of Mechanical and Electrical Engineering, Henan University of Technology, Zhengzhou 450001, China
2
Key Laboratory of Grain Information Processing and Control, Henan University of Technology, Ministry of Education, Zhengzhou 450001, China
*
Authors to whom correspondence should be addressed.
These authors contributed equally to this work.
Appl. Sci. 2023, 13(16), 9265; https://doi.org/10.3390/app13169265
Submission received: 1 July 2023 / Revised: 26 July 2023 / Accepted: 11 August 2023 / Published: 15 August 2023
(This article belongs to the Section Agricultural Science and Technology)

Abstract

:
There will be great damage in the process of harvesting, transporting, and storing after grain matures. The injury rate is as high as 8% to 12%. After damage, the germination rate of the grain becomes lower, the quality decreases, and it is easily infected with pests and molds. This study of the grain-crushing characteristics is of great significance to ensure grain quality, and an accurate crushing model is a prerequisite for effectively simulating crushing characteristics. This paper studies the shattering characteristics of wheat grains. Two-dimensional slices of wheat grain were obtained using X-ray tomography technology. Then, an accurate three-dimensional outer contour model of the wheat particle was constructed using image filtering and segmentation algorithms. The particle filling process was conducted using EDEM 2018 software to establish a wheat particle simulation model based on the Hertz–Mindlin with a Bonding contact model. Using the DOE experimental design method, single-factor experiments, Plackett–Burman experiments, steepest-climb experiments, and Box–Behnken were designed to study the fragmentation characteristics of wheat particles combined with parameter calibration and physical experiments. The test results show that the normal stiffness per unit area is 7.392 × 10¹⁰ N/m3, critical normal stress is 5.293 × 10⁶ Pa, critical tangential stress is 5.001 × 10⁶ Pa, and the relative error about 3%, which verifies the reliability of the simulation parameters in the discrete-element crushing model of wheat grain. This study focuses on two essential aspects: 1. establishing an accurate wheat-grain contour model; and 2. calibrating the bonding parameters of the discrete-element simulation model of wheat grain. The wheat grain discrete-element crushing model and the calibration of its bonding parameters are constructed to provide a foundation for the study of wheat-grain crushing characteristics. It is of great significance to study the situation of wheat grains and where cracks are produced. In this paper, an accurate model of the wheat-grain contour is established, and the bonding parameters of the discrete-element simulation model of the wheat grain are calibrated. The calibration of the model of the discrete elements of wheat-grain fragmentation and its bonding parameters will provide a basis for studying the crushing characteristics of wheat grain. Understanding the condition of wheat grains and the causes of cracks carries significant academic significance.

1. Introduction

As one of the three major grains in China, wheat is prone to breakage and damage due to collisions, transportation, extrusion, vibrations, impacts, and other factors [1]. Broken grains can cause various problems, such as changes in taste, nutrient loss, and even mold growth. At present, Gheorghe [2], Gabriela [3], Feng [4], and other cases mainly studied the crushing of wheat grain under different moisture contents. But these studies are all based on physical crushing tests; there is no specific study on the form of wheat-grain crushing, which could not accurately reflect the process of wheat-grain crushing. Yulai Cheng [5] obtained relationships between shear force values and physical parameters, such as protein content and bulk density, by placing two electronic universal testing machines in different positions but did not analyze the mechanical crushing characteristics of wheat when broken. Dong Li [6] observed rice stress cracking and damage phenomenon through scanning electron microscopy, but scanning electron microscopy could only observe the stress crack in rice when broken at a static moment and could not dynamically display cracks during the rice crushing process. Keping Zhang [7] studied the relationships between different placement methods and the critical load of wheat through a finite-element method. However, the wheat model was simplified as an ellipsoid, which had low accuracy and could not accurately represent the external characteristics of the wheat grain and the specific situation of its crushing. Fei Peng [8] and Kang Zhu [9] obtained seed models of barley and wheat through three-dimensional scanning technology and studied the crack location and crushing process during the crushing process. However, the filling particles were relatively small, the accuracy was not high, and no scientific design method was adopted.
The discrete-element method was initially employed in mechanical fields such as rock mechanics and subsequently extended to various sectors including agriculture, food, and chemical industries. In recent years, it has found extensive applications in agricultural engineering, grain storage, and related areas [10,11,12]. With continuous advancements and refinements in the discrete-element method, the discrete-element software EDEM has gained widespread adoption. It is now extensively employed to investigate the mechanical properties of crops through simulation experiments [13,14]. Currently, the calibration of model parameters using EDEM software mainly relies on the measurement of the angle of repose for various crops, including soybean [15], rice [16], corn [17], spinach main-root [18], and rape stalk [19]. This parameter serves as a key indicator for evaluating and refining the simulation models. However, most of these calibration parameters are contact parameters, and there is less calibration for bonding parameters. Huibin Zhu [20], Wenhang Liu [21], and Lintao Chen [22] calibrated the binding parameters of cornstalk, but their discrete-element simulation models were relatively simple and not accurate enough.
This paper mainly establishes an accurate model of wheat grain through CT scanning, which is a prerequisite for establishing a simulation model of wheat fragmentation in the future. Then, taking the critical load of wheat-grain crushing as the target value, the single-factor test, the Plackett–Burman test, the steepest-climbing test, and the Box–Behnken test are designed for bond parameter calibration. Eventually, the optimal calibration parameters are obtained to provide the parameter basis for studying the internal crushing characteristics of wheat grain.

2. Materials and Methods

2.1. Experimental Materials

FengdeCunmai No.5, a high-gluten wheat and the most widely planted crop in Henan, was provided by the Henan Fengdekang Seed Industry Co., Ltd. (Zhengzhou, China). It has strong adaptability, strong inversion resistance, high yield, 13% moisture content, and a bulk density of 780 g/L.

2.2. Reconstruction of Three-Dimensional Model of Wheat Grain

2.2.1. Image Acquisition

This study employed advanced X-ray computed tomography (CT) scanning technology to construct a highly accurate model of wheat. BRUKER’s state-of-the-art SKYSCAN1275 CT scanner, as the scanning device, is known for its exceptional precision and reliability. Wheat grains were fixed in paraffin on a carrier table and scanned using a voltage of 48 KV, a current of 70 µA, and a rotation angle of 180° with a resolution of 6 µm. The scanning time was approximately 12 min, resulting in 1300 images of 2D slices of wheat seeds.

2.2.2. Image Processing

Two-dimensional slices were processed for noise reduction using a non-local mean filtering algorithm. By utilizing the distinctive characteristics of various wheat grains and the differing brightness levels of the images obtained, the outer epidermis, endosperm, embryo, inner grain cracks, and other tissue structures can be clearly distinguished [23]. The epidermis, endosperm, and embryonic tissue of wheat were reconstructed by volume mapping. The model was reconstructed for hole filling, smooth processing, and domain division. The specific process is shown in Figure 1.
This section constructs an outer contour model of wheat and separates the embryo and endosperm of wheat grains. The accuracy of the proposed model is very high. For different varieties of wheat, there are significant differences in grain morphology and physical properties. So, the model is required to be re-extracted. However, the way of building the model is the same. Similarly, this model-building approach can also be applied to other grains, such as corn, soybeans, etc.

2.3. Construction of Discrete-Element Simulation Model of Wheat Grain

2.3.1. Discrete-Element Contact Model

The Hertz–Mindlin with Bonding (HWB) contact model in EDEM was used. Bonded contacts were used to simulate fracture effects, which could resist both tangential and normal displacements. When the external force exceeds the interaction force between the Bond bonds, the Bond bonds will break. Before the particle is generated, the Hertz–Mindlin contact model is employed to form a bonding connection between the particles at time t. The force Fn and torque Tn on the particles are set to zero and incrementally increased at each time step. The expressions are as follows [24]:
δ F n = v n S n A δ t
δ F t = v t S t A δ t
δ M n = ω n S n J δ t
δ M t = ω t S t 1 2 δ t
A = π R B 2
J = 1 2 π R B 24
In these equations, R B is the connection radius, S n is the normal stiffness, S t is the tangential stiffness, δ t is the time step, v n and   v d are the normal and tangential velocities of the particles, and ω n   and   ω t are the normal and tangential angular velocities of particles, respectively.
Fracture occurs when the normal and tangential stresses are at their maximum:
σ max < F n A + 2 M t J R B
τ max < F t A + 2 M n J R B
In these equations, F n and F t represent the normal and tangential bonding forces, respectively, and M n and M t represent the normal and tangential bond moments, respectively.

2.3.2. Discrete-Element Simulation Model of Wheat Grain

The 3D model of the constructed wheat grain is imported into the EDEM discrete-element software. An important aspect of this simulation is to determine the appropriate materials and contact law parameters. Generally, these parameters must be calibrated because they are difficult to measure or, such as the rolling friction, have no physical analogue [25]. By reviewing the literature, Zhu and Liu [26,27] summarized these parameters through a combination of parameter calibration and experiment. Since wheat varieties have no differences, these parameters are experimental parameters for wheat, as shown in Table 1. The parameters for the filling particle radius and contact radius are shown in Table 2. After stabilizing the particles and filling the entire model, the number of filled particles is approximately 4500, as shown in Figure 2a. An HWB model was added after filling, where the bond radii of the endosperm tissue particles were 0.1 mm, 0.05 mm, and 0.1 mm between the embryo and endosperm. Bonds were generated for bonding, as shown in Figure 2b.

2.4. Uniaxial Compression Experiment

FengdeCunmai No.5 with full grains, intact appearance, and no cracks with a water content of 13% was randomly selected for the uniaxial compression test. The TMS-Pro Texture Analyzer (FTC Corporation of America) was used for this experiment, with a cylindrical flat-bottom probe positioned at a height of 10 mm from the sample surface. The detection speed was set at 60 mm/min, with an initial force of 0.75 N. The selected wheat was divided into 3 groups with 15 compression tests. The maximum and minimum values of the 15 experiments were removed, and the average value of the other 13 experiments was the crushing load force of wheat, calculated as 118.821 N.

2.5. Test Factors

A key step in ensuring the precision of the model is to input accurate simulation parameters [28]. However, the precise bonding parameters are not used. This paper establishes an accurate outer contour model of wheat seeds and fills the wheat model with particles to construct a discrete-element simulation model of wheat. The four parameters of normal stiffness per unit area, shear stiffness per unit area, critical normal stress, and critical shear stress were selected as the required bonding parameters.

2.6. Experimental Design

In this paper, the calibration of binding parameters was performed using the single-factor test, the Plackett–Burman test, the steepest-ascent experiment, and the Box–Behnken test.

2.6.1. Single-Factor Test Design

The single-factor test has several advantages, including its simplicity and intuitive nature, as well as its ability to save time and costs. However, it should be noted that this test focuses on examining the impact of only one factor at a time. Consequently, it was chosen as the starting point for this experimental study, which can systematically explain the effects of individual factors before proceeding with more complex designs.
Using the relative error of the critical load of wheat-grain crushing in simulation experiments and physical experiments, single-factor experiments on four bonding parameters were performed to study the influence of each factor on the relative error. After a large number of pre-experiments, fixed parameters for the single-factor tests were obtained, and the shear stiffness per unit area was 9.0 × 10¹⁰ N/m3, the critical normal stress was 5.0 × 10⁶ Pa, and the critical shear stress was 5.0 × 10⁶ Pa.

2.6.2. Plackett–Burman Test Design

The Plackett–Burman test is an experimental design method that can evaluate multiple factors simultaneously while minimizing the number of experiments required. It is particularly useful for screening experiments to determine the most significant factors affecting the test results. The Plackett–Burman test efficiently explores a large parameter space by using a limited number of experiments, typically in a fractional factorial design. By systematically changing the levels of the surveyed factors, the test identifies the most influential factors and their main effects on the response variable. This approach is helpful for researchers to quickly identify key factors that significantly affect experimental results, thereby making subsequent optimization studies more focused and effective.
Significant factors were screened using the Plackett–Burman experimental design. Using the relative error as the experimental indicator, 12 simulation experiments were designed based on the single-factor experiments to screen the four parameters of normal stiffness per unit area, shear stiffness per unit area, critical normal stress, and critical shear stress.

2.6.3. Steepest-Ascent Experiment Design

The steepest test gradually approaches the optimal parameter value through iterations; the maximum or minimum value of the response variable could be found, thus achieving fast convergence.
According to the results of the single-factor and Plackett–Burman experiments, the value of the least significant experimental factor, the unit area shear stiffness, was fixed at 9.0 × 10¹⁰ N/m3. Meanwhile, the steepest-ascent experiment was designed to quickly approximate the best parameter range for each significant parameter. The corresponding step size was designed according to the normal stiffness per unit area, critical normal stress, and critical shear stress.

2.6.4. Box–Behnken Test Design

Box–Behnken experiment is a commonly used response surface experimental design method for optimizing three or more factors. It optimizes the response variables by selecting the center and boundary test sites in an orthogonal trial design, covering the parameter space, and building a quadratic polynomial model.
Based on the results of the single factor, Plackett–Burman, and the steepest-ascent tests, a three-factor three-level experiment was conducted. In this test, the independent variables were normal stiffness per unit area, critical normal stress, and critical shear stress, and the dependent variable was the critical load at the time of wheat fracture in the simulation experiment.

3. Results

3.1. Single-Factor Test

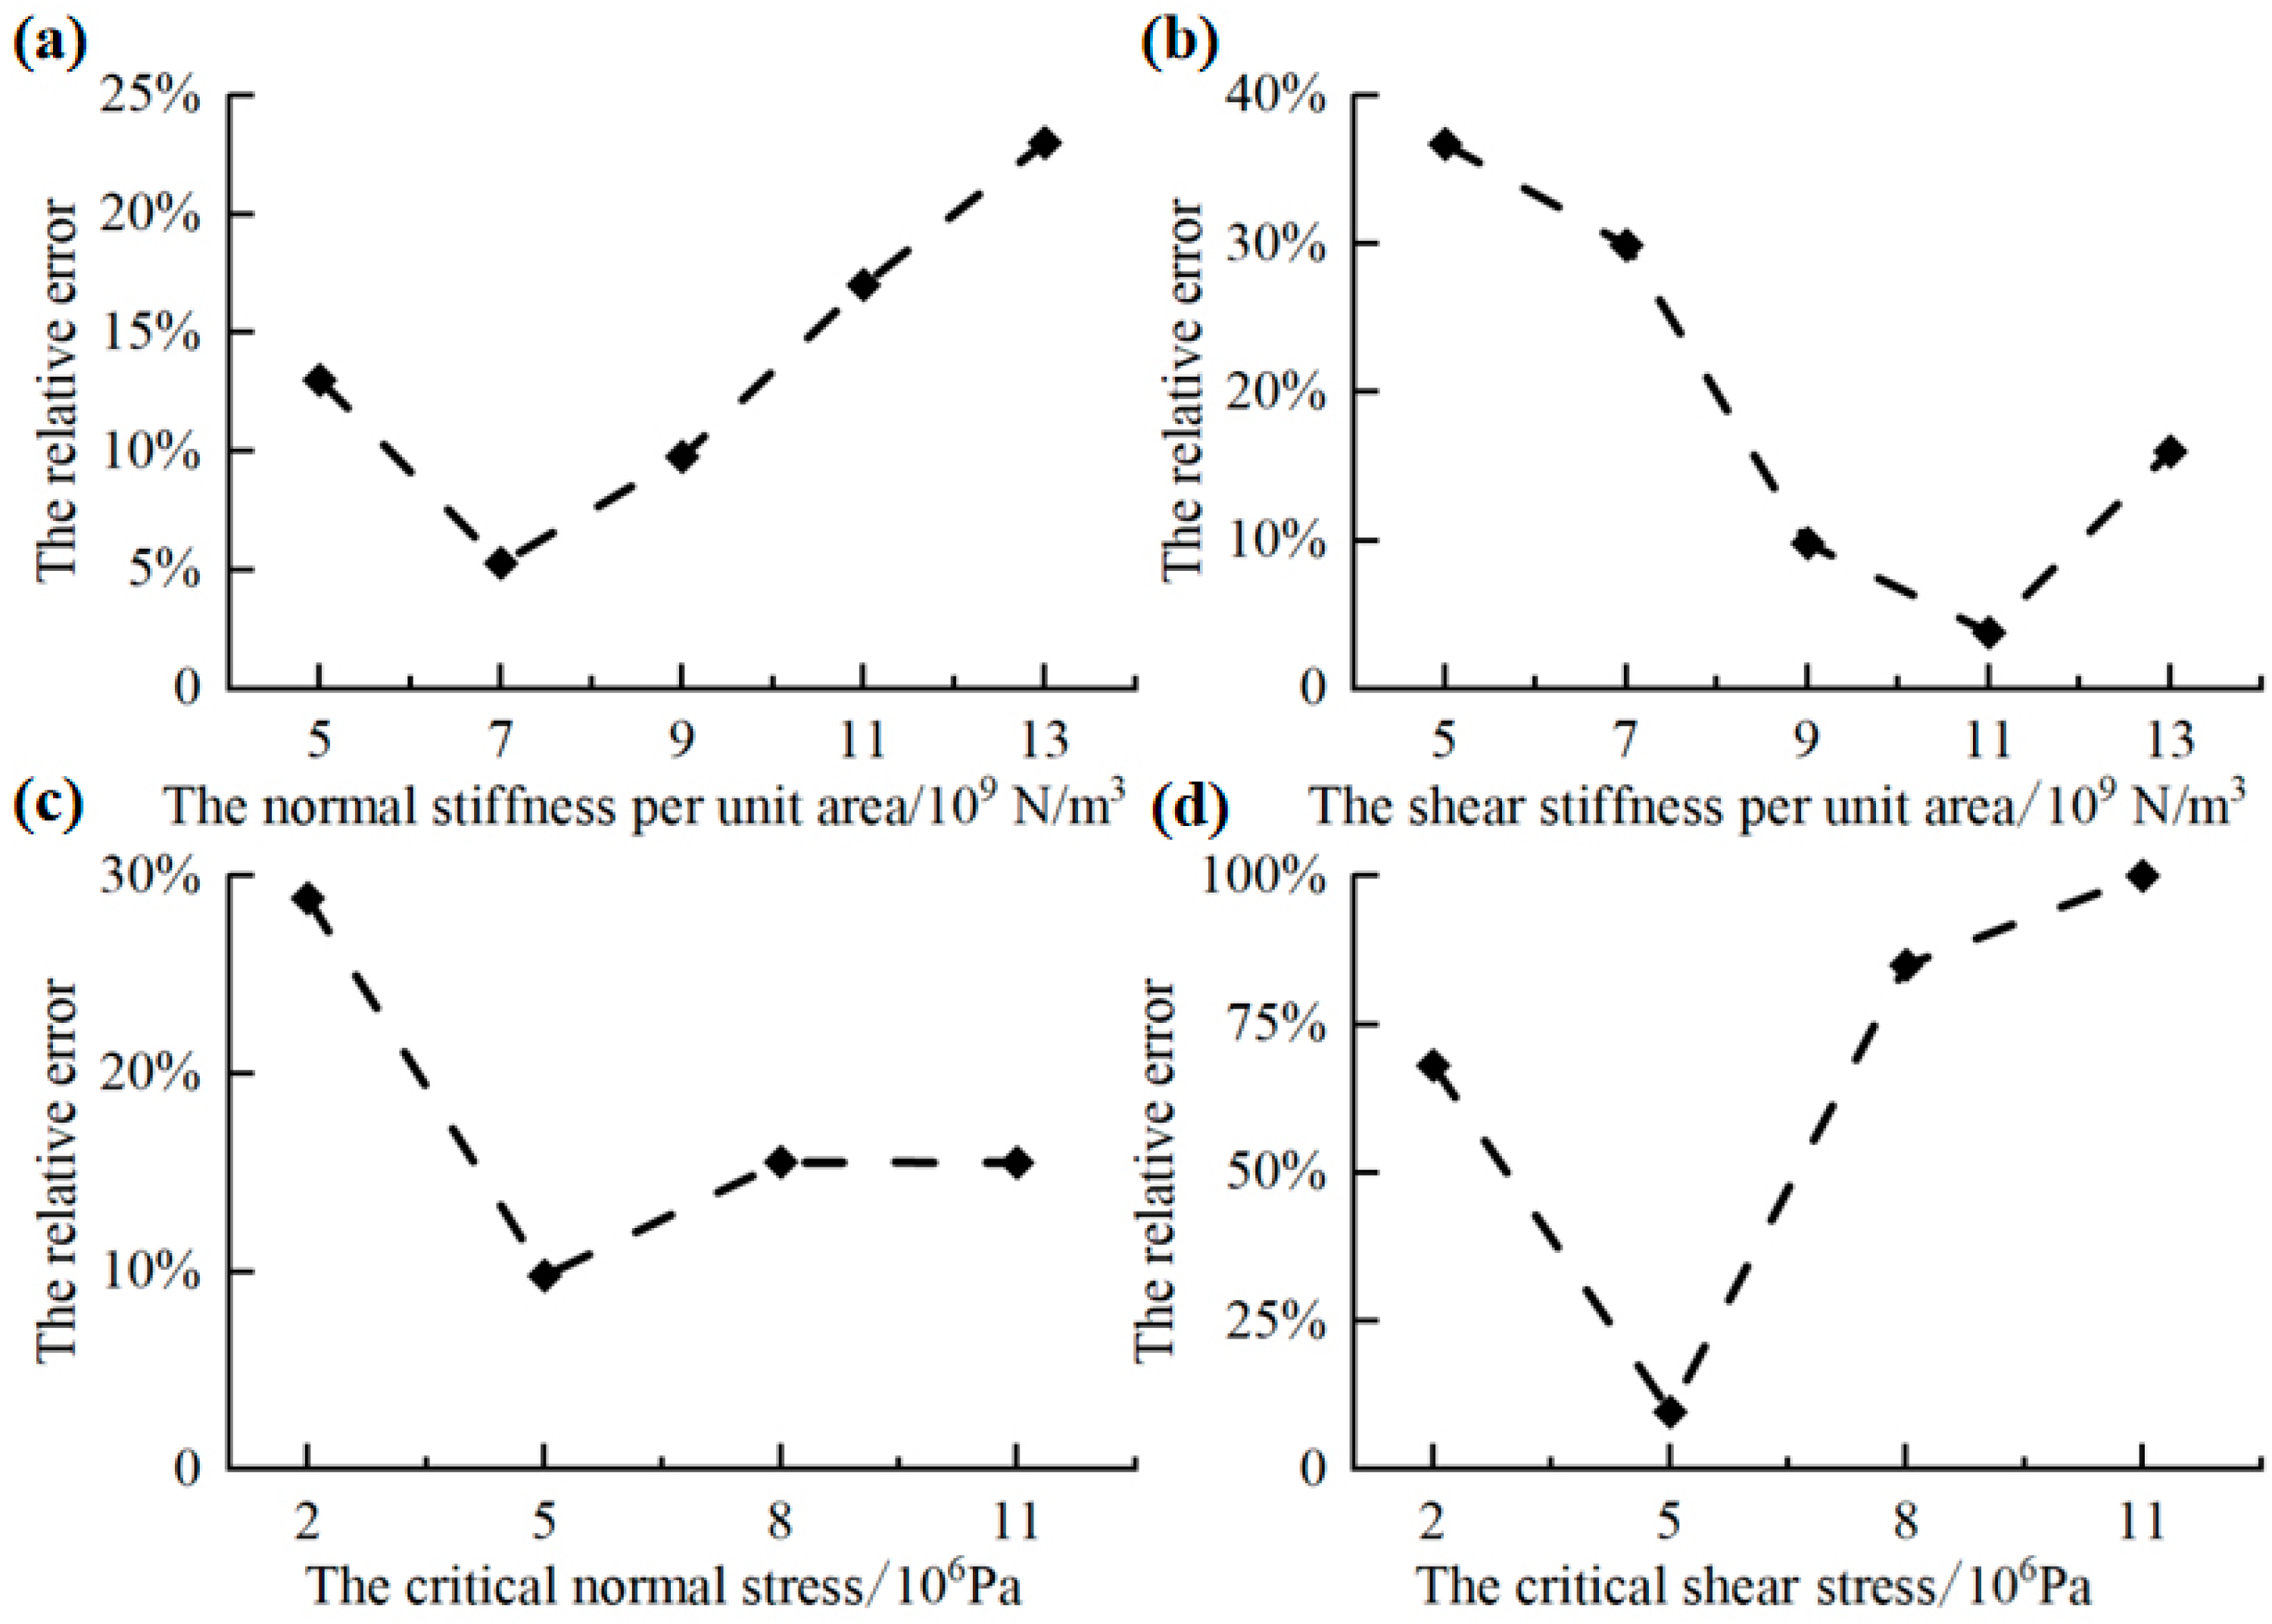
As the normal stiffness per unit area increases, the relative error first decreases and then increases. The increase in the normal stiffness per unit area increases the bonding force between the particles, leading to an increased crushing load (Figure 3a). The error is the smallest when the normal stiffness per unit area is 7.0 × 10⁹ N/m3.
As the shear stiffness per unit area increases, the relative error first decreases and then increases. The normal stiffness per unit area increases the bonding force between particles, resulting in the compressive load (Figure 3b). The error is the smallest when the normal stiffness per unit area is 11 × 109 N/m3.
As the critical normal stress increases, the relative error first decreases and then increases (Figure 3c). The minimum error under critical normal stress is 5.0 × 10⁶ Pa.
As the critical shear stress increases, the relative error first decreases and then increases, which has a large impact on the crushing effect (Figure 3d). When the critical shear stress is 5.0 × 10⁶ Pa, the error is the smallest.

3.2. Plackett–Burman Test

The Plackett–Burman test design and results are shown in Table 3. The results of the operation using the DOE test design software are shown in Table 4. The significance value p < 0.05 indicates a significant effect, while p < 0.01 indicates an extremely significant effect. According to the p values, the key factors affecting wheat crushing are critical shear stress X4 > critical normal stress X3 > normal stiffness per unit area X1 > shear stiffness per unit area X2. X4 (critical shear stress) is the most significant factor.

3.3. Steepest-Ascent Experiment

The results of the steepest-ascent test are shown in Table 5. According to the analysis of the test results, when the test number is 1, the test error is the smallest, and the test critical load value is lower than the critical load value of wheat crushing. Therefore, this group is selected as the low-level test. When the test number is 2, the error is relatively small and higher than the critical load value of wheat breaking. Therefore, this group was chosen as a high-level test for the response surface optimization test.

3.4. Box–Behnken Test

The Box–Behnken test design and results are shown in Table 6.
To obtain the optimal combination of discrete-element parameters, a regression analysis was performed on the experimental results. The regression equation was obtained with the critical load Y as the response value and the unit area normal stiffness X1, critical normal stress X3, and critical shear stress X4 as independent variables.
Y = 132.87 + 1.38X1 − 0.99X3 + 9.76X4 − 1.28X1X3 + 5.70X1X4 − 1.73X3X4 + 1.27X12 + 6.49X32 + 2.40X42
An ANOVA was performed on the regression models and the results are shown in Table 7. A p < 0.01 for the model indicates that the regression equation is very significant, indicating the relationship between the factors and the response values. The lack-of-fit F-value is more than 0.05, which implies the lack-of-fit term is not significant; the regression model is reliable and has a high degree of fit. According to the value of p, the influence of the first term X4 of the model is very significant, and the quadratic terms X1, X4 and X32 are significant. In addition, the coefficient of determination R2 = 0.9598 indicates a good correlation between the regression equation and the experimental data. The adjusted coefficient of determination, adjR2 = 0.9080, shows a high correlation between the predicted values and the actual values. The coefficient of variation (CV) is 1.9%, which indicates that the model is reasonable. In conclusion, this model can be used to analyze the factors affecting the critical load of wheat crushing.
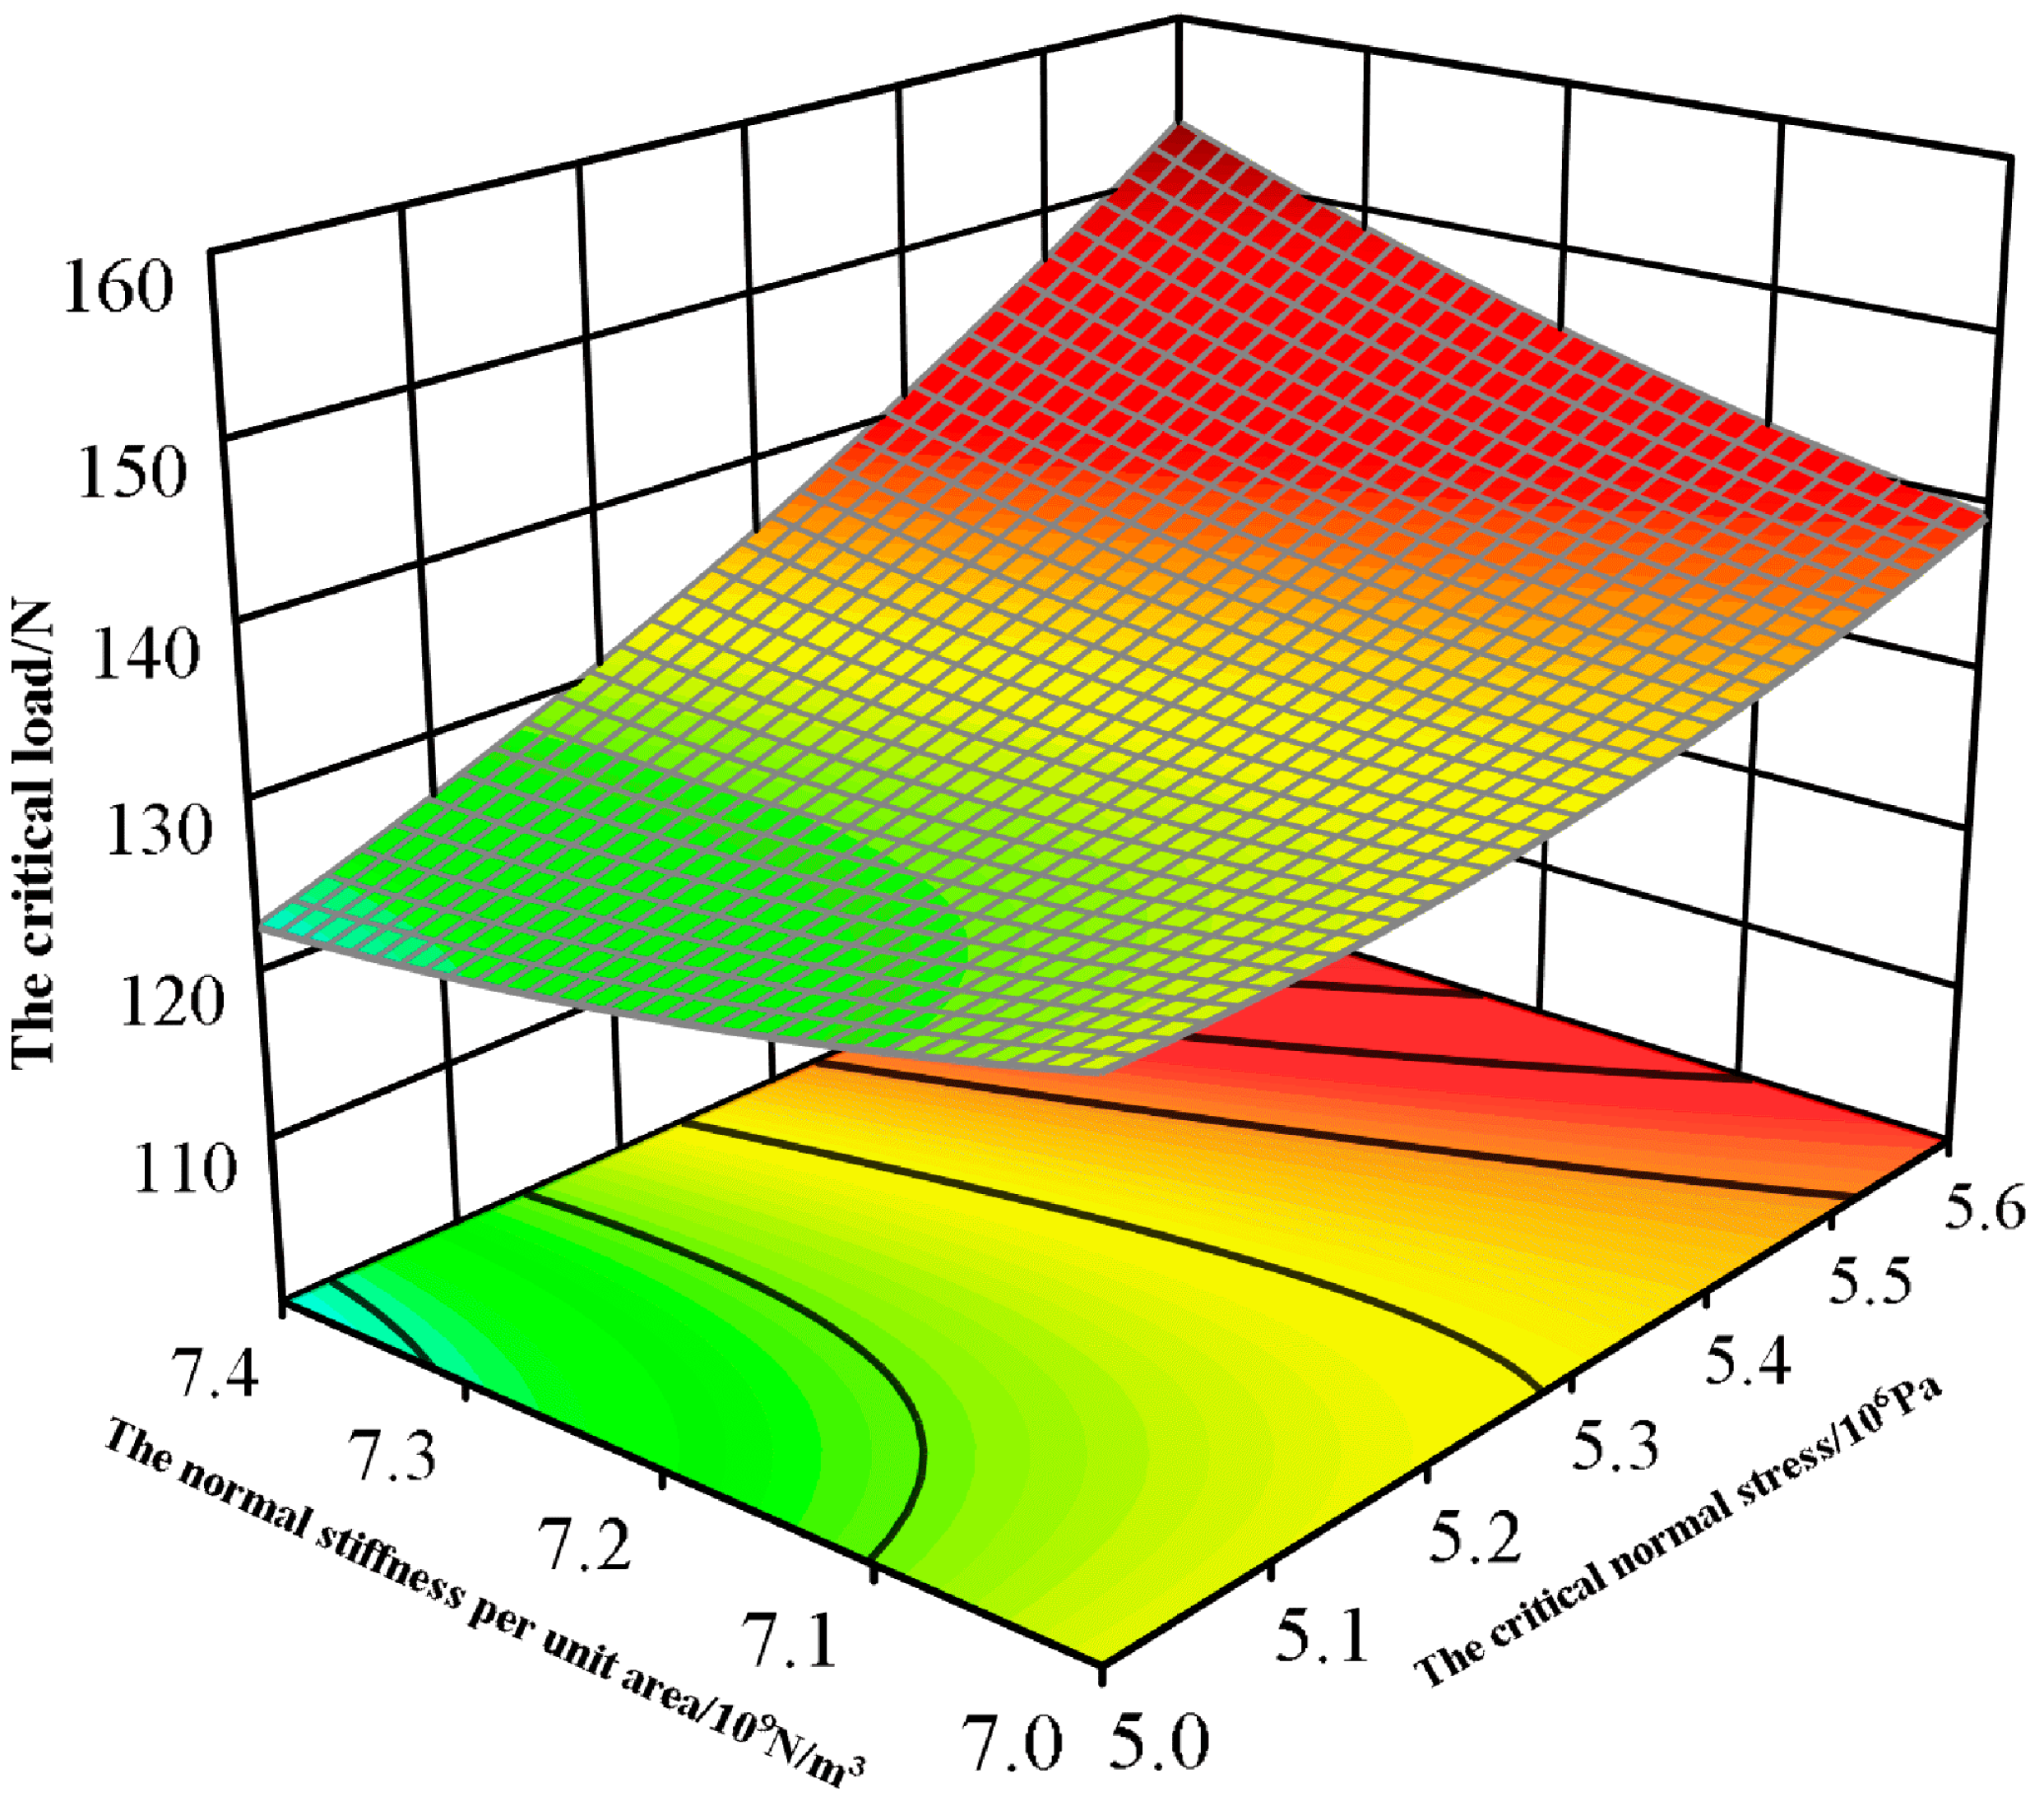
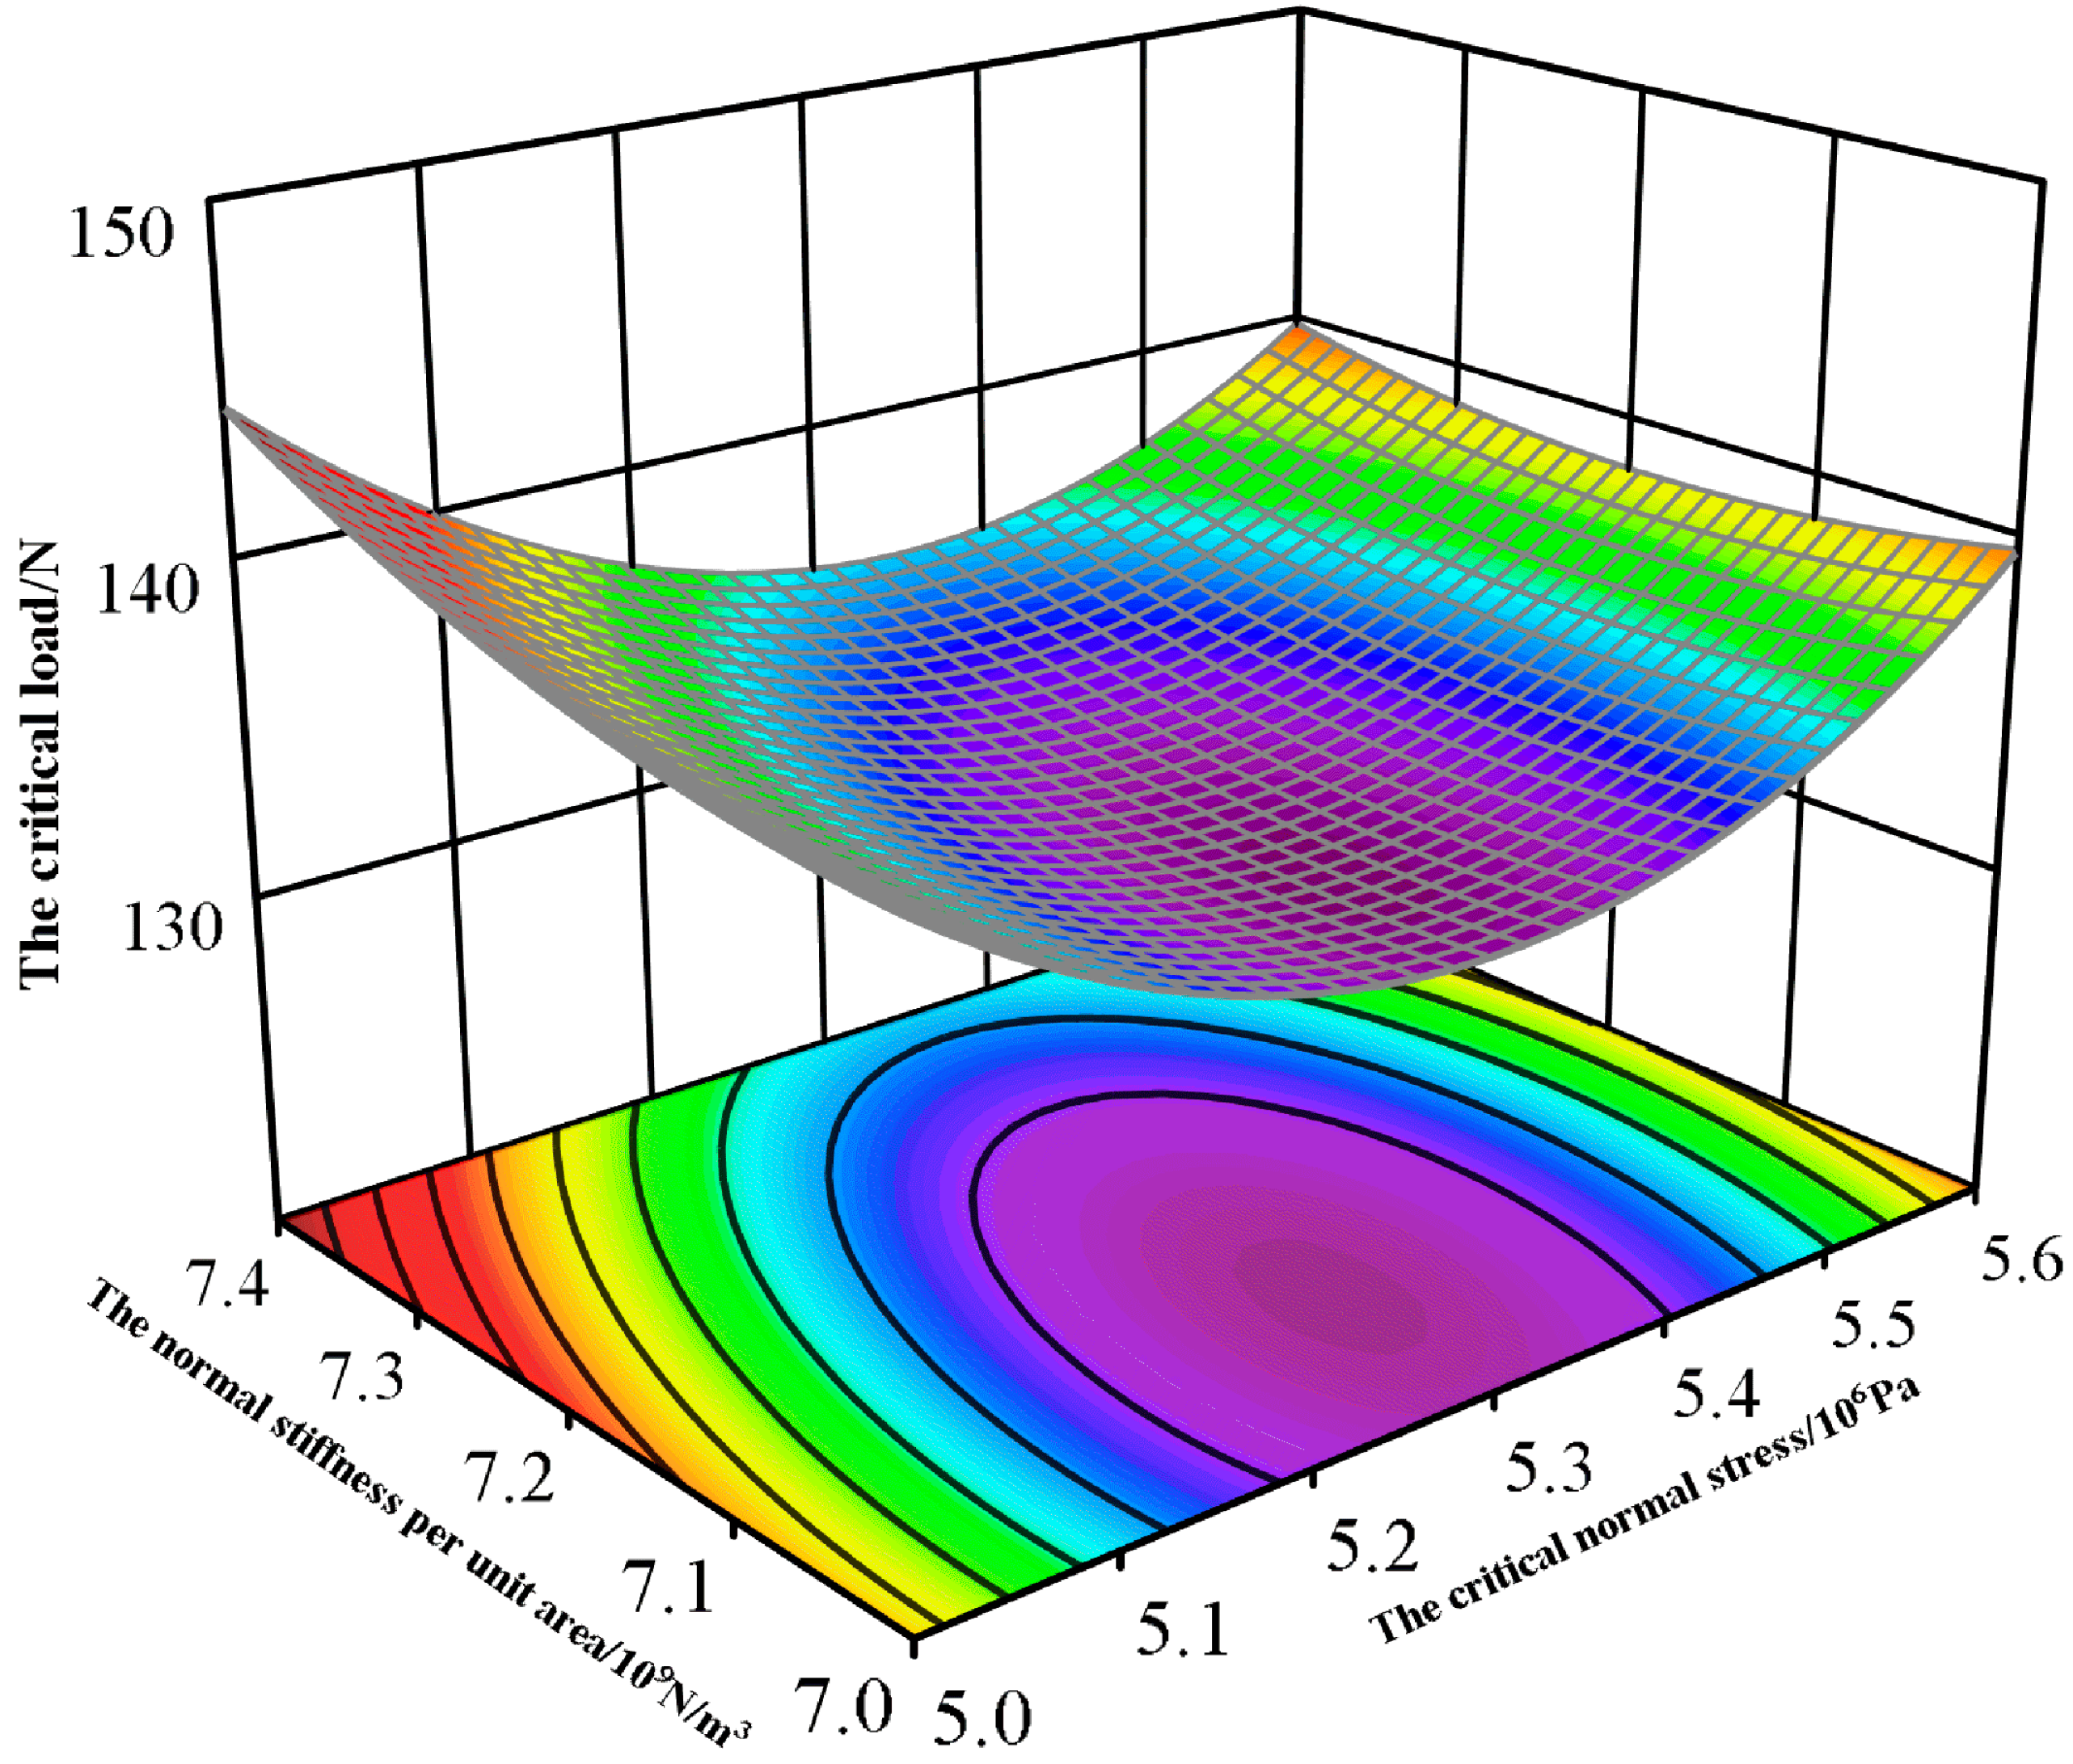
According to the regression equation, the response surface of the interaction effects of each factor to the critical load of the wheat crushing period is shown in Figure 4, Figure 5 and Figure 6.
When the normal stiffness X1 per unit area remains constant (Figure 4), the simulation experiments show that the critical load Y for wheat breakage first decreases and then increases with the variation in critical normal stress X3. In addition, Y increases as the critical tangential stress X4 increases, exhibiting a steep slope and indicating a more pronounced influence of X4 > X3 on Y.
When the critical normal stress X3 remains unchanged (Figure 5), the simulation experiments show that the critical load Y for wheat breakage first decreases and then increases with variations in the normal stiffness X1 per unit area. In addition, Y increases as the critical tangential stress X4 increases, demonstrating a steep slope and indicating a more significant impact of X4 > X1 on Y.
When the critical tangential stress X4 is fixed (Figure 6), the simulation experiments show that the critical load Y for wheat breakage initially decreases and then increases with variations in both the critical normal stress X3 and the unit area normal stiffness X1. By observing the slope of the response surface, it can be inferred that X1 > X3 and has a greater influence on Y.

3.5. Optimal Parameters and Model Validation

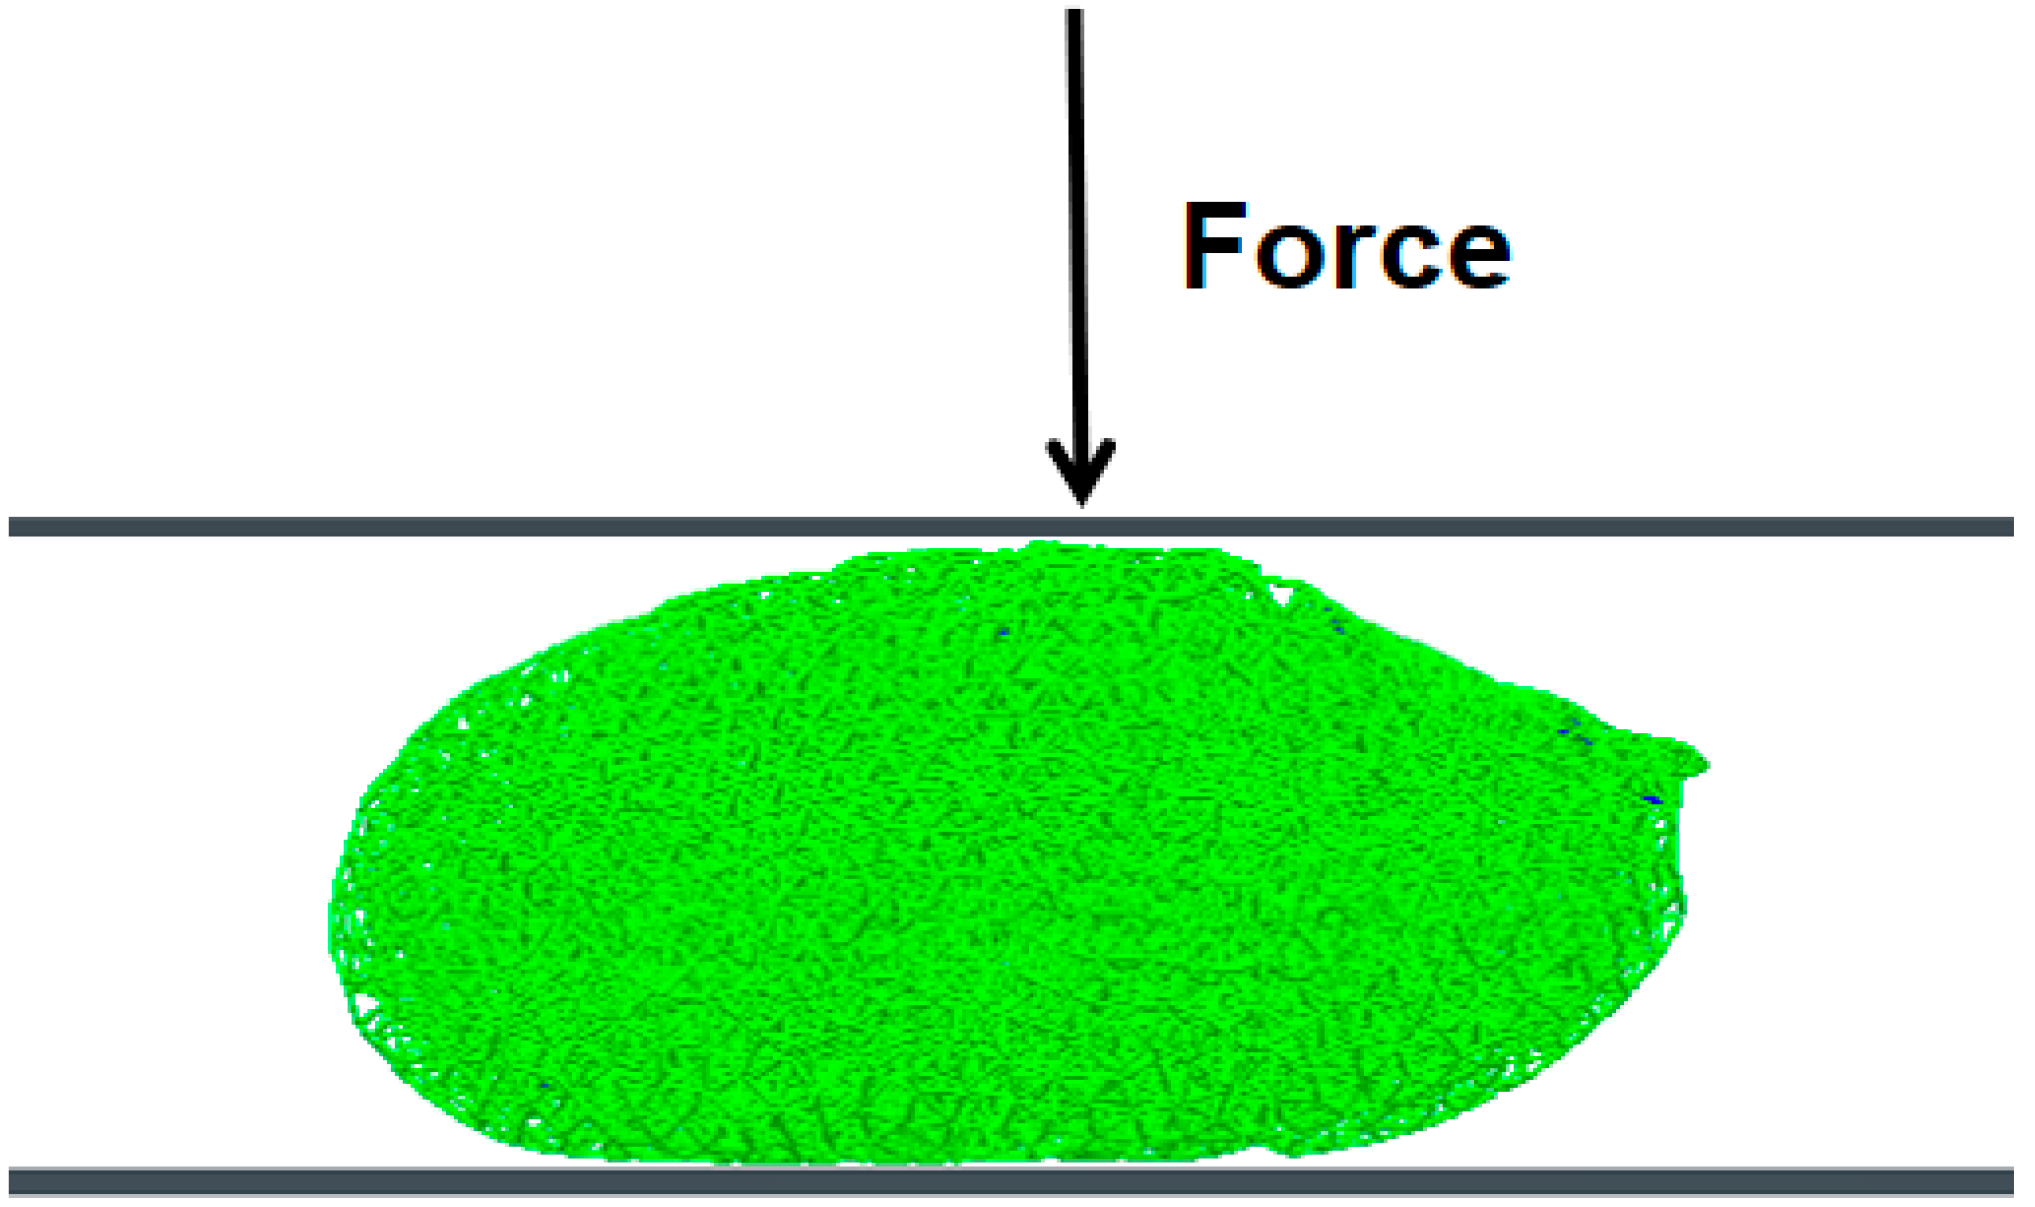
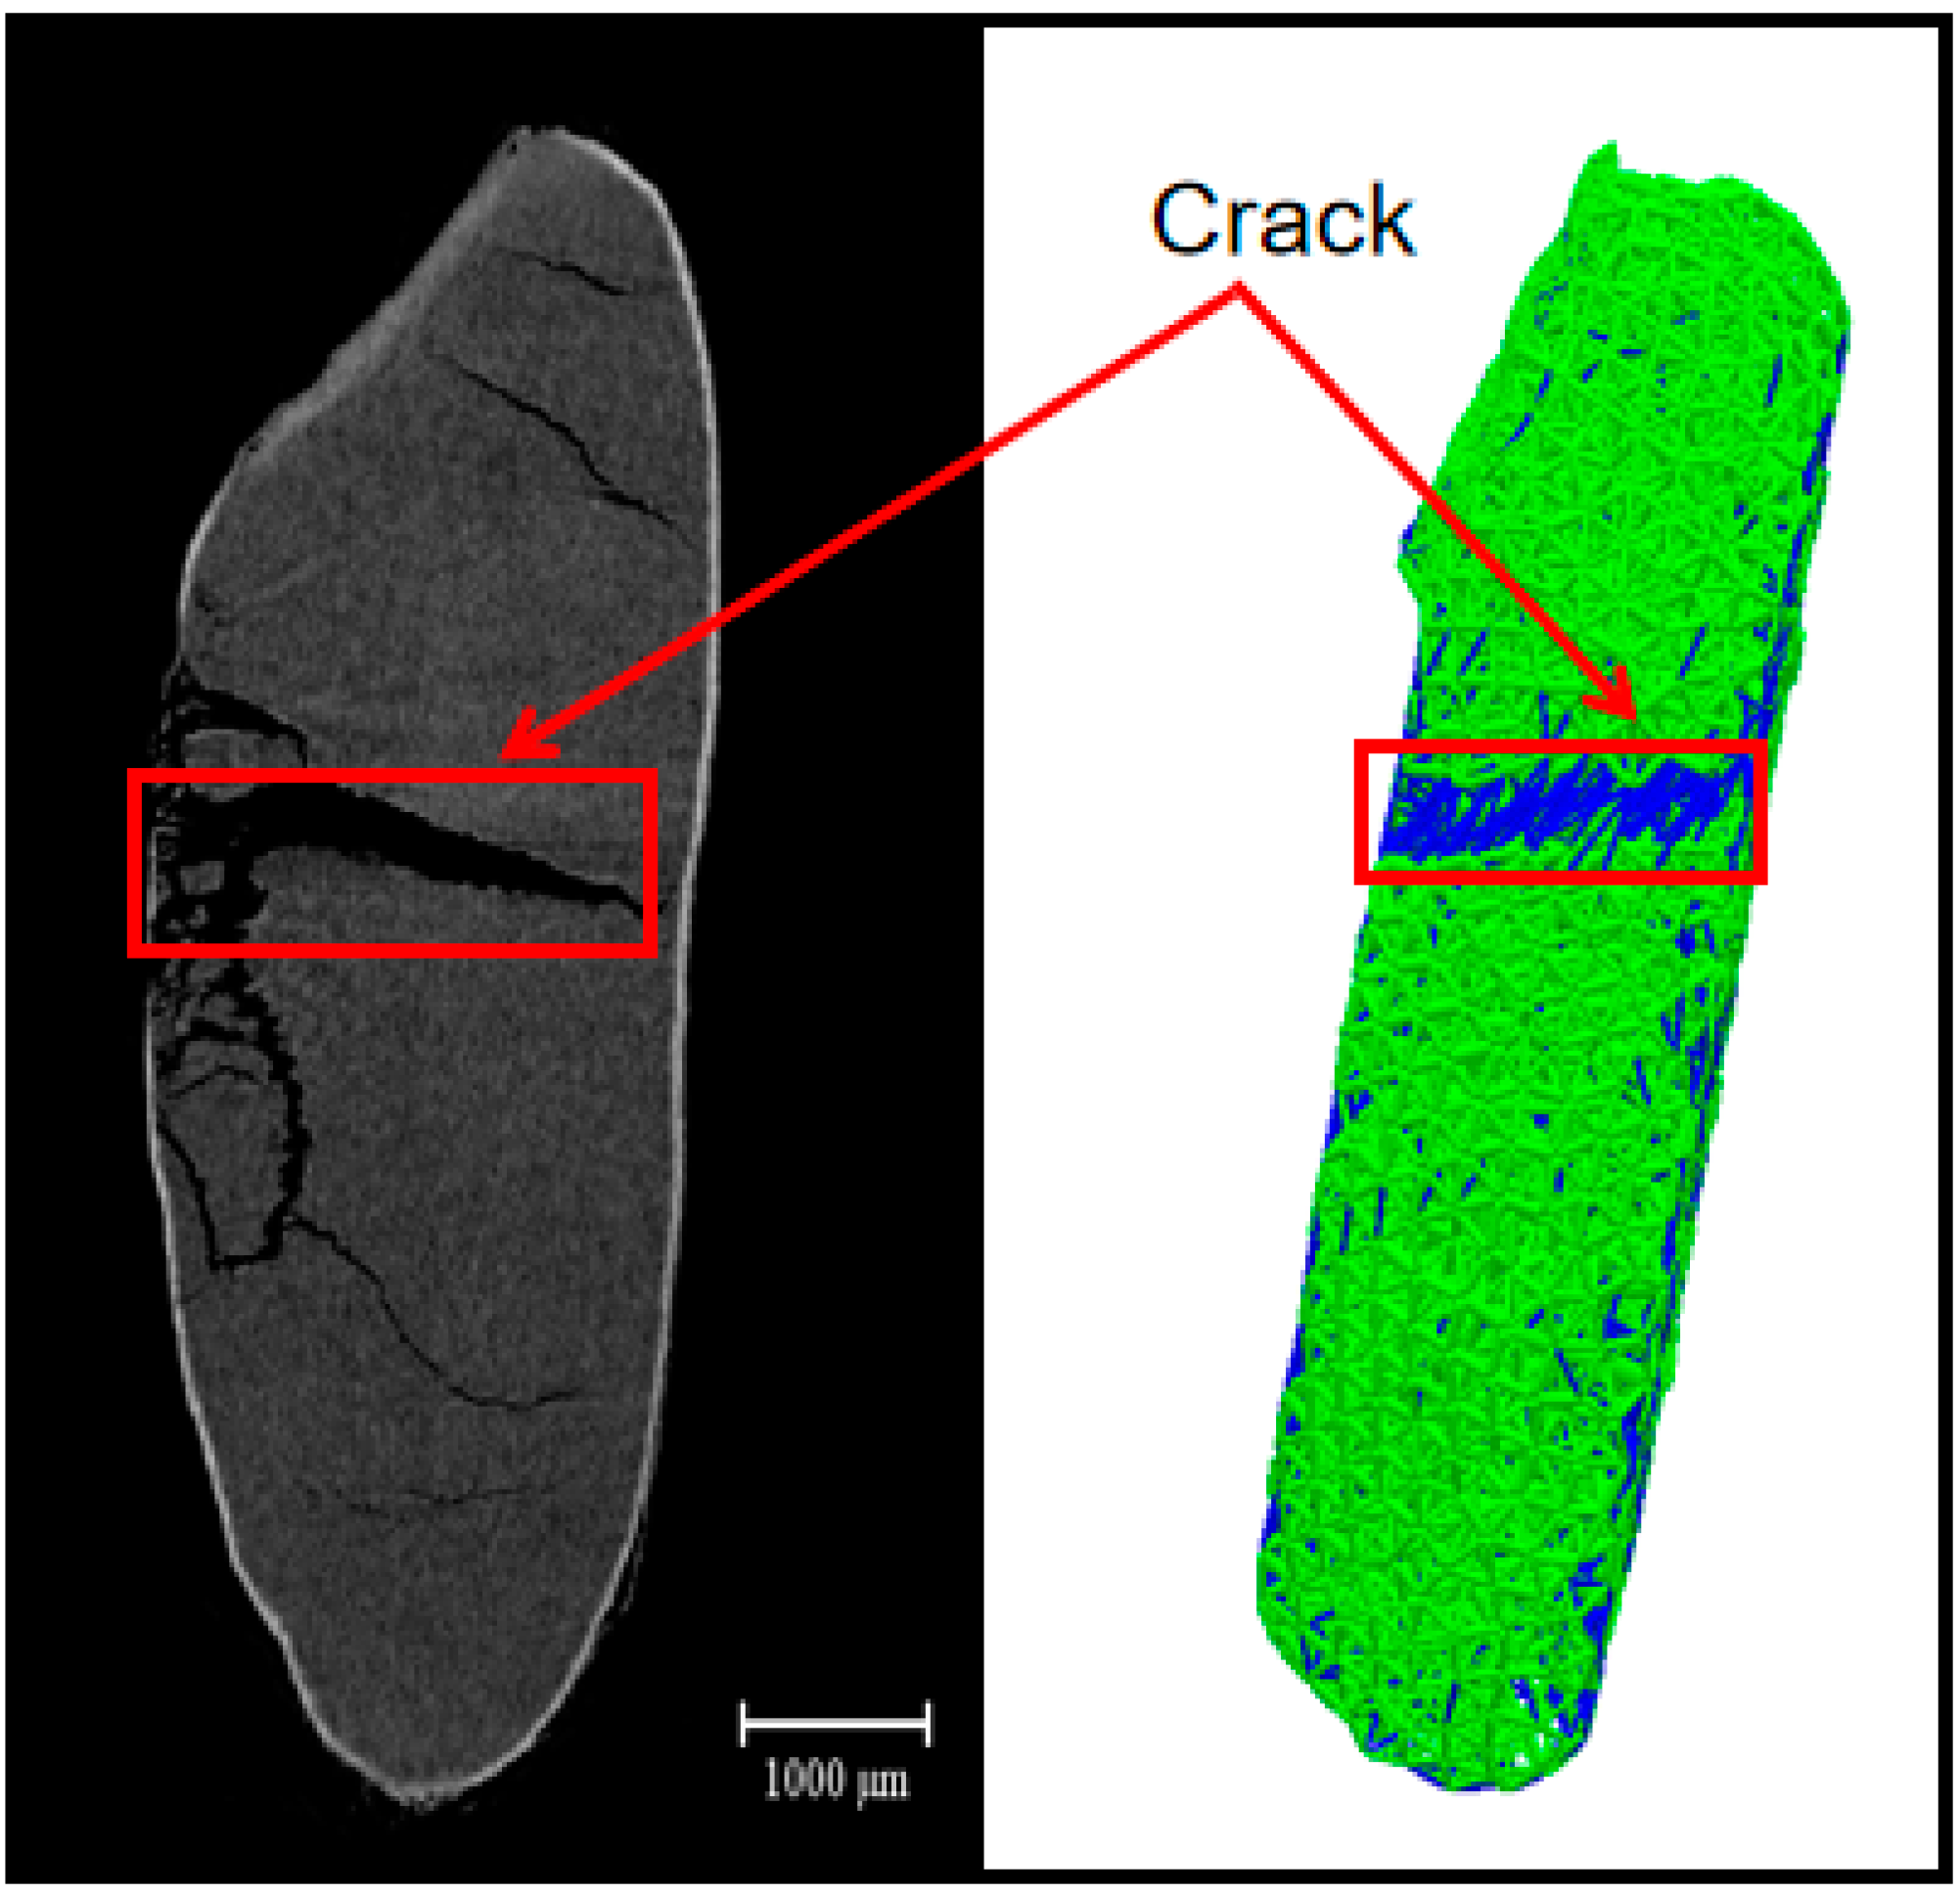
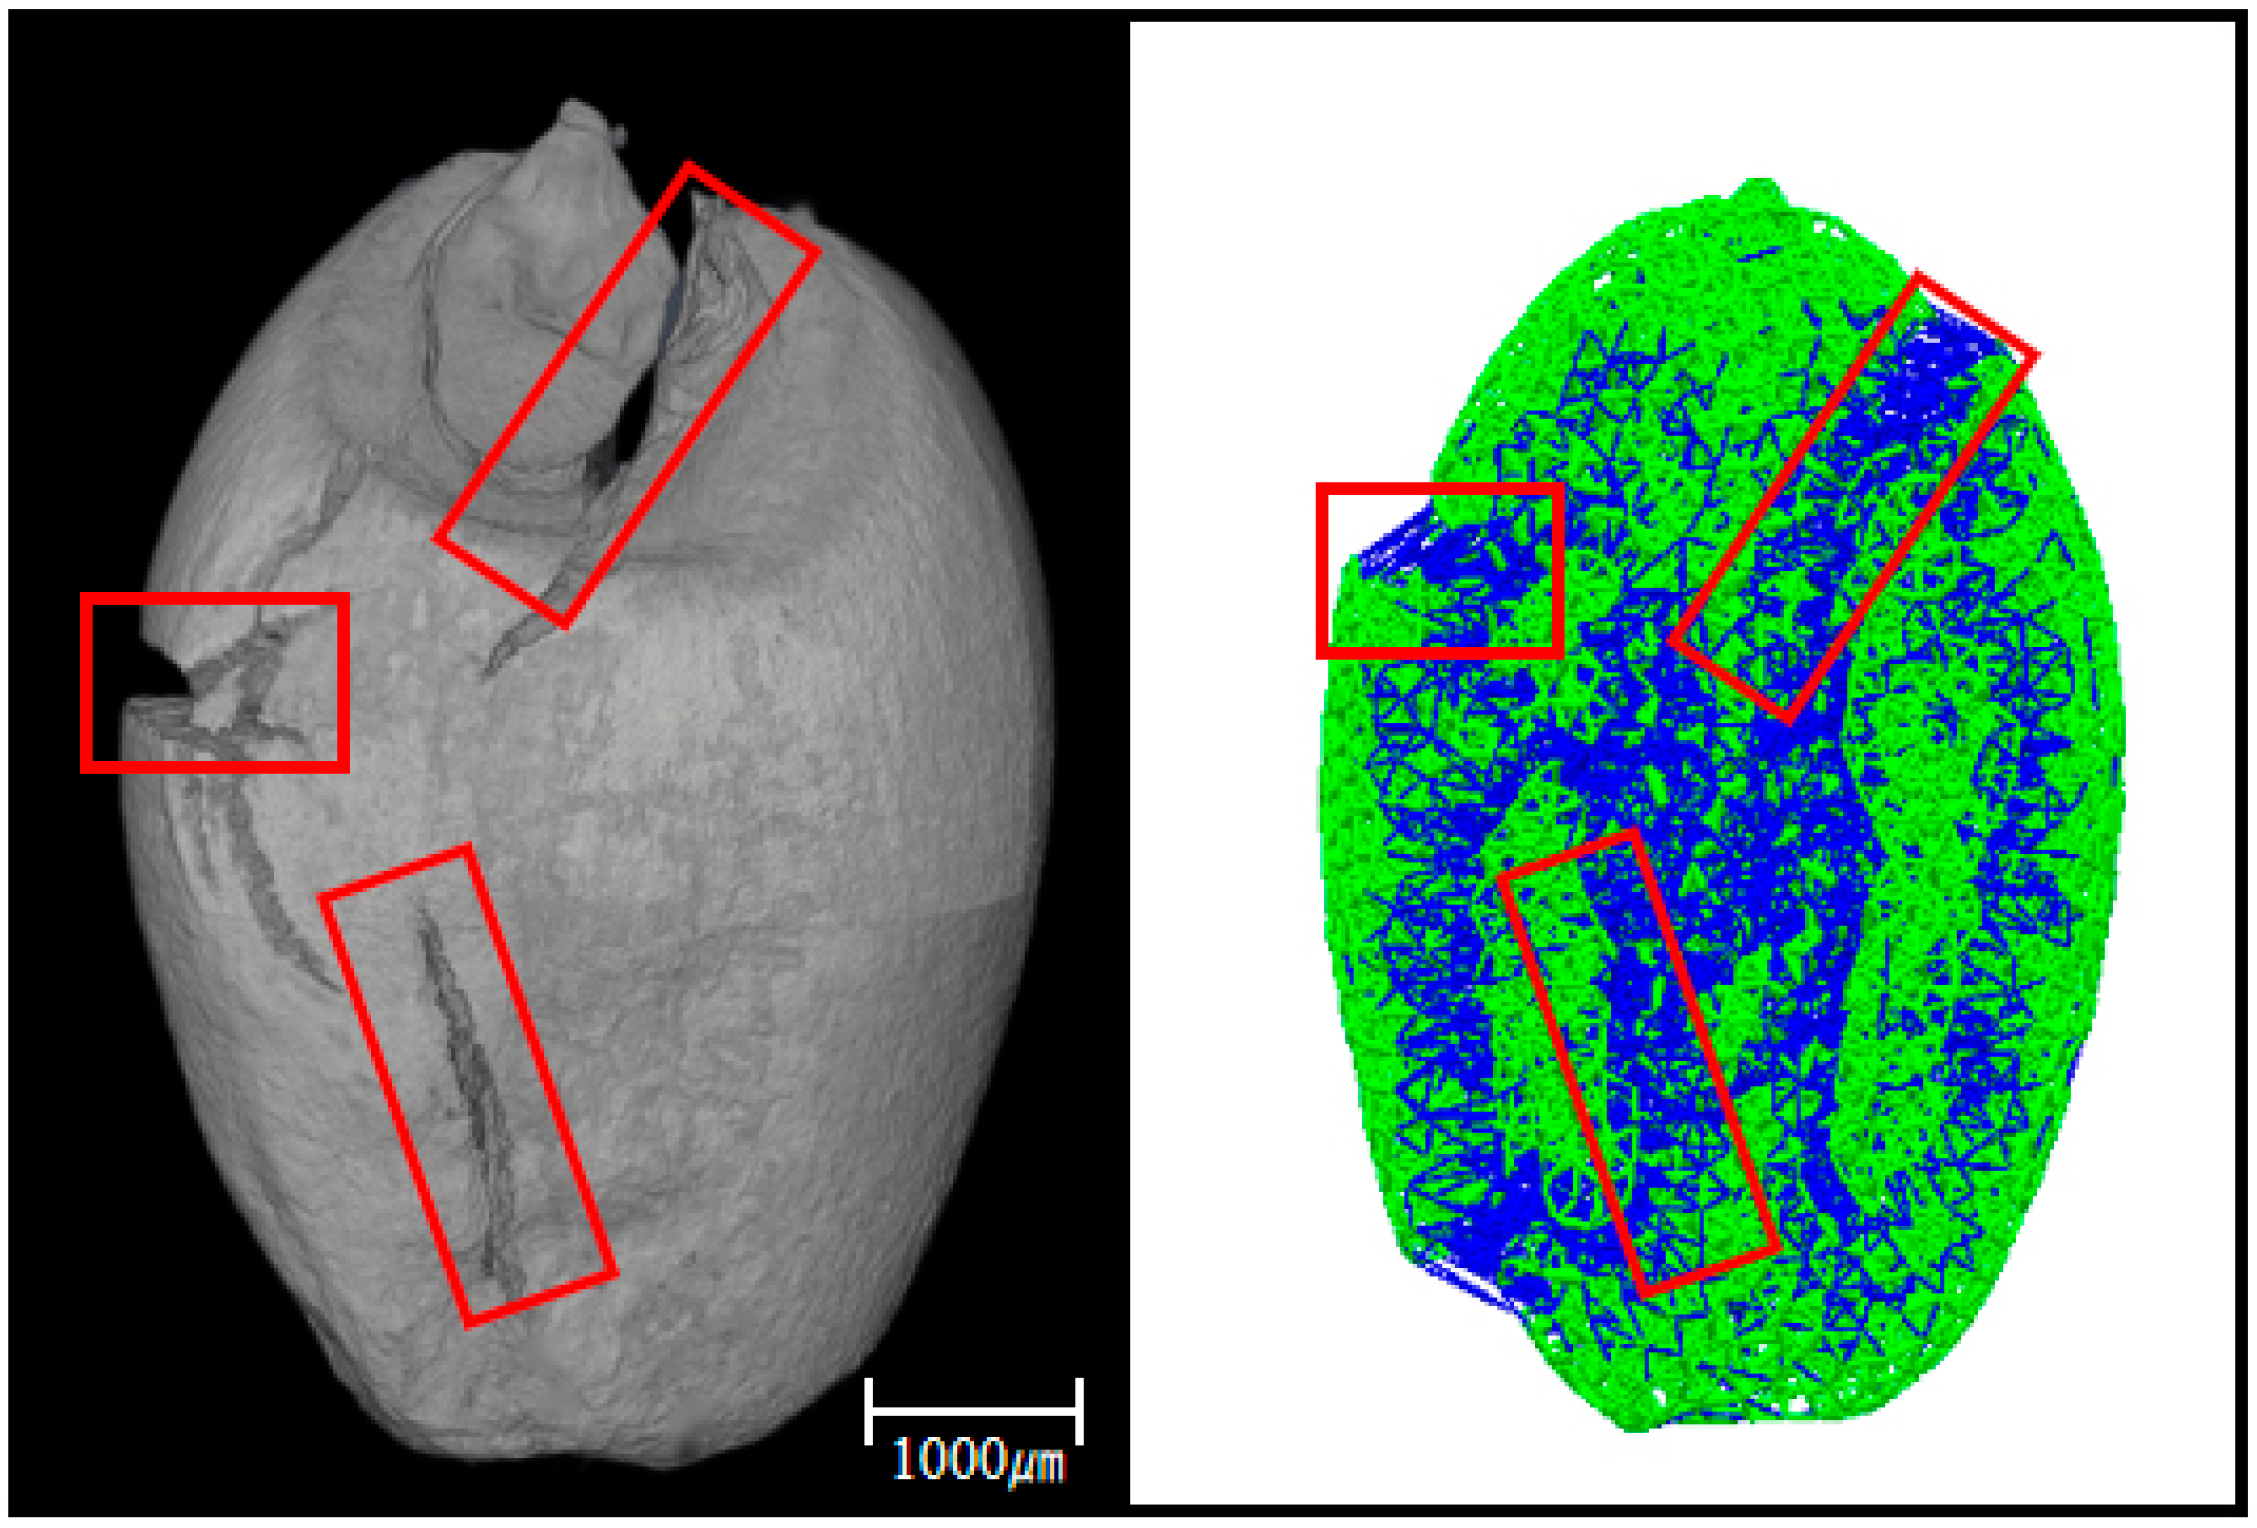
The regression model was optimized using DOE experimental design software and the optimal simulation parameters were obtained; the normal stiffness per unit area was 7.392 × 10¹⁰ N/m3, the critical normal stress was 5.293 × 10⁶ Pa, the critical tangential stress was 5.001 × 10⁶ Pa, and the predicted critical load of wheat crushing was 122.677 N. According to the optimal simulation parameters, the critical load for wheat crushing was 122.392 N, with a relative error of 3% compared to the physical test. The test results were consistent with the predicted value, which further confirmed the accuracy and reliability of the model. In addition, the wheat was compressed to obtain the actual crack of the wheat grain. In the discrete-element simulation software, the constructed discrete-element model and the calibrated bonding parameters for the extrusion simulation experiment, as shown in Figure 7 and Figure 8, were used. The actual cracks in wheat grains were compared with the cracks in the discrete-element simulation model we constructed, as shown in Figure 9 and Figure 10. It can be clearly observed that the location of the crack is approximately the same, proving the veracity of our model and parameters. These results provide an important basis for the subsequent study of wheat-grain crushing.
Through the scientific experimental design method, the discrete-element simulation bonding parameters of wheat grains were calibrated, with an error of only 3%. The actual crack location of wheat-grain cracks was compared with the crack location of the discrete-element simulation model, and they are roughly similar. This provides a basis for a subsequent study of wheat-grain shattered traits. However, it has the limitation of a single variety. This article is only based on FengdeCunmai No.5 as the research object. The discrete-element modeling parameters need to be recalibrated once the experimental subject changes.

4. Conclusions

(1)
An accurate outer contour model of wheat grain was established, and the various tissue models could be obtained by separating the embryo, endosperm, and other tissues in the model.
(2)
A discrete-element simulation model of wheat grains was constructed by filling the tissue models of various parts of wheat grains with particles of different radii.
(3)
In the uniaxial compression test, the critical load of wheat crushing was 118.821 N. Through the single-factor test and the Plackett–Burman test, the significant factors affecting the relative error between the critical load test value and the simulation value was identified: critical tangential stress. The influence of critical normal stress and unit area normal stiffness on both was relatively small.
(4)
The steepest-climbing test was used to reduce the horizontal range of significant factors, followed by the Box–Behnken response surface test. Through the analysis of the test results, a quadratic polynomial regression equation was obtained. An ANOVA showed that the regression equations have a highly significant and a high fit. The regression equation was optimized and solved to obtain the optimal parameters as follows: the normal stiffness per unit area was 7.392 × 10¹⁰ N/m3, the critical normal stress was 5.293 × 10⁶ Pa, and the critical tangential stress was 5.001 × 10⁶ Pa. The critical load of 122.392 N in the verification test and the physical error of 118.821 N was 3%, which verified the reliability of the simulation parameters of the wheat-grain crushing model.
In our article, two important contents have been addressed: (1) establishing the precise wheat grain outer contour model and its embryo can be separated from other tissues; and (2) calibrating the bonding parameters of the discrete-element simulation model of the wheat grain. In terms of model reconstruction, a large number of references have been to compare the accuracy of the proposed model, and the modeling method could also be applied to other grain grains, such as corn, soybean, etc. In terms of bonding parameter calibration, most of them are in corn straw and alfalfa bud stalks. We used this research method to calibrate the wheat grains, which can study the breaking situation of wheat grains, such as the generating the site of the crushing crack and how the crack expands, providing the basis for this study.

Author Contributions

Conceptualization, Y.Z. (Ying Zhou), W.S. and Y.H; methodology, Y.Z. (Ying Zhou), W.S., Y.H., C.S. and K.Z.; software, W.S.; validation, W.S., J.G., Y.Z. (Yongzhen Zhang), J.L. and D.C.; writing—original draft, W.S.; writing—review and editing, W.S. All authors have read and agreed to the published version of the manuscript.

Funding

This research was funded by the Open Fund Project of Key Laboratory of Grain Information Processing & Control, Ministry of Education, Henan University of Technology (Grant No. KFJJ2022007).

Institutional Review Board Statement

Not applicable.

Informed Consent Statement

Not applicable.

Data Availability Statement

The data presented in this study are available in the article.

Acknowledgments

The authors thank the members of the Key Laboratory of Grain Information Processing and Control (Henan University of Technology), for their contributions to this project. In addition, thanks to Huinan Sun, COFCO Engineering & Technology (Zhengzhou) Co., Ltd. for the software help.

Conflicts of Interest

The research was conducted in the absence of any commercial or financial relationships that could be construed as a potential conflict of interest.

References

  1. Zheng, W.; Peng, S. Research on the construction of safety management and operation mechanism of grain storage and transportation in China. Soc. Sci. Shandong Prov. 2014, 6, 179–183. [Google Scholar]
  2. Voicu, G.; Tudosie, E.-M.; Ungureanu, N. Some mechanical characteristics of wheat seeds Obtained by Uniaxial Compression Tests. UPB Sci. Bull. Ser. D Mech. Eng. 2013, 75, 265–278. [Google Scholar]
  3. Barrer, G.N.; Mendez-Mendez, J.; Arzate-Vazquez, I.; Calderón-Domínguez, G.; Ribotta, P.D. Nano- and micromechanical properties of wheat grain by atomic force microscopy (AFM) and nano-indentation (IIT) and their relationship with the mechanical properties evaluated by uniaxial compression test. J. Cereal Sci. 2019, 90, 102830. [Google Scholar] [CrossRef]
  4. Jia, F.; Zhou, X.; Chen, F. The Calculations and Simulation Testing on the Elastic Modulus of Wheat. Interdiscip. Sci. Comput. Life Sci. 2015, 7, 200–204. [Google Scholar] [CrossRef]
  5. Cheng, Y.; Sun, X. The relationship between the crushing resistance of wheat grain and its quality traits. Grain Oil Process. 2008, 12, 84–86. [Google Scholar]
  6. Li, D.; Mao, Z. Analysis of the microstructure of rice after natural air drying. J. Agric. Eng. 2003, 19, 156–159. [Google Scholar]
  7. Zhang, K.; Huang, J.; Yang, M.; Zhang, F.; Huang, X.; Zhao, C. Finite element analysis and experimental verification of winter wheat grain extrusion characteristics. J. Agric. Eng. 2010, 26, 352—356+391. [Google Scholar]
  8. Peng, F.; Fang, F.; Wang, H. Modeling and testing of barley kernels based on 3D laser scanning. J. Agric. Mach. 2018, 49, 342–348. [Google Scholar]
  9. Zhu, K.; Hui, Y.; Zhou, Y.; Wang, H.; Zhang, Y.; Li, H.; Chen, Y.; Zheng, J.; Bai, L. Construction of wheat grain model and discrete element parameter calibration based on X-ray tomography. Chin. J. Grain Oil 2022, 37, 218–223. [Google Scholar]
  10. He, Y.; Wu, M.; Xiang, W. Progress in the application of the discrete element method in agricultural engineering. China Agric. Bull. 2017, 33, 133–137. [Google Scholar]
  11. Zhao, H.; Huang, Y.; Liu, Z. Applications of Discrete Element Method in the Research of Agricultural Machinery: A Review. Agriculture 2021, 11, 425. [Google Scholar] [CrossRef]
  12. Chen, Y.; Zeng, X.; Wang, J. Harvest machine virtual environment model and simulation platform construction. J. Agric. Mach. 2019, 50, 159–166. [Google Scholar]
  13. Zeng, Z.; Ma, X.; Cao, X. Application status and prospect of discrete element method in agricultural engineering research. J. Agric. Mach. 2021, 52, 1–20. [Google Scholar]
  14. Zhang, N.; Cao, X.; Wang, X.; Sun, Y. Determination of simulation parameters of rice mill. Food Mach. 2023, 39, 95–100. [Google Scholar]
  15. Don, G.; Yang, Y.; Guo, Y.; Liu, X.; Yu, C.; Du, J.; Zhang, J. EDEM simulation analysis of seed filling characteristics of different soybean varieties. J. Henan Agric. Univ. 2019, 53, 93–98. [Google Scholar]
  16. Zhang, R.; Jiao, W.; Zhou, J.; Qi, B.; Liu, H.; Xia, Q. Calibration of discrete element model parameters for rice seeds with different filling particle radii. J. Agric. Mach. 2020, 51, 227–235. [Google Scholar]
  17. Wang, M.; Wang, W.; Yang, L.; Hou, M. The corn seed particle modeling method based on EDEM. J. Henan Agric. Univ. 2018, 52, 80—84, 103. [Google Scholar]
  18. Li, J.; Liu, X.; Zou, L.; Yin, R.; Yang, K.; Yuan, J. Discrete element modeling method and experimental verification of spinach main–root. Agric. Mech. Res. 2021, 43, 181–185. [Google Scholar]
  19. Shu, C.; Yang, J.; Wan, X.; Yuan, J.; Liao, Y.; Liao, Q. Simulation calibration and experiment of simulation parameters of discrete rapeseed seed extract. J. Agric. Eng. 2022, 38, 34–43. [Google Scholar]
  20. Zhu, H.; Qian, C.; Bai, L.; Li, H.; Mou, D.; Li, J. Optimizing the corn straw discrete element model based on Plackett-Burman test design and response surface method. J. China Agric. Univ. 2021, 26, 221–231. [Google Scholar]
  21. Liu, W.; Su, Q.; Fang, M.; Zhang, J.; Zhang, W.; Yu, Z. Parameters Calibration of Discrete Element Model for Corn Straw Cutting Based on Hertz-Mindlin with Bonding. Appl. Sci. 2023, 13, 1156. [Google Scholar] [CrossRef]
  22. Chen, L.; Xue, J.; Mou, X.; Ma, X.; Liu, W.; Liu, Y.; Xiang, J. Study on the parameter calibration method of cassava seed stem simulation based on discrete element. Jiangsu Agric. Sci. 2023, 51, 198–205. [Google Scholar]
  23. Zhou, Y.; Hui, Y.; Feng, L. Construction of a three-dimensional precision model based on X-ray. Chin. J. Grain Oil 2018, 33, 7–11. [Google Scholar]
  24. Fang, R. Numerical Analysis of Discrete Elements for Stress and Wear of Shield Disc Hob. Master’s thesis, Beijing Jiaotong University, Beijing, China, 2021. [Google Scholar]
  25. Rackl, M.; Hanley, K.L. A methodical calibration procedure for discrete element models. Powder Technol. 2017, 307, 73–83. [Google Scholar] [CrossRef] [Green Version]
  26. Zhu, K. Study on the Construction and Crushing Characteristics of Wheat Grain Morphology and Structure. Master’s Thesis, Henan University of Technology, Zhengzhou, China, 2021. [Google Scholar]
  27. Liu, F. Discrete Element Modeling of Wheat Particles and Short Stalks in the Cleaning Device. Ph.D. Thesis, Northwest A & F University, Xianyang, China, 2018. [Google Scholar]
  28. Yu, Y.; Ren, S.; Li, J.; Chang, J.; Yu, S.; Sun, C.; Chen, T. Calibration and Testing of Discrete Element Modeling Parameters for Fresh Goji Berries. Appl. Sci. 2022, 12, 11629. [Google Scholar] [CrossRef]
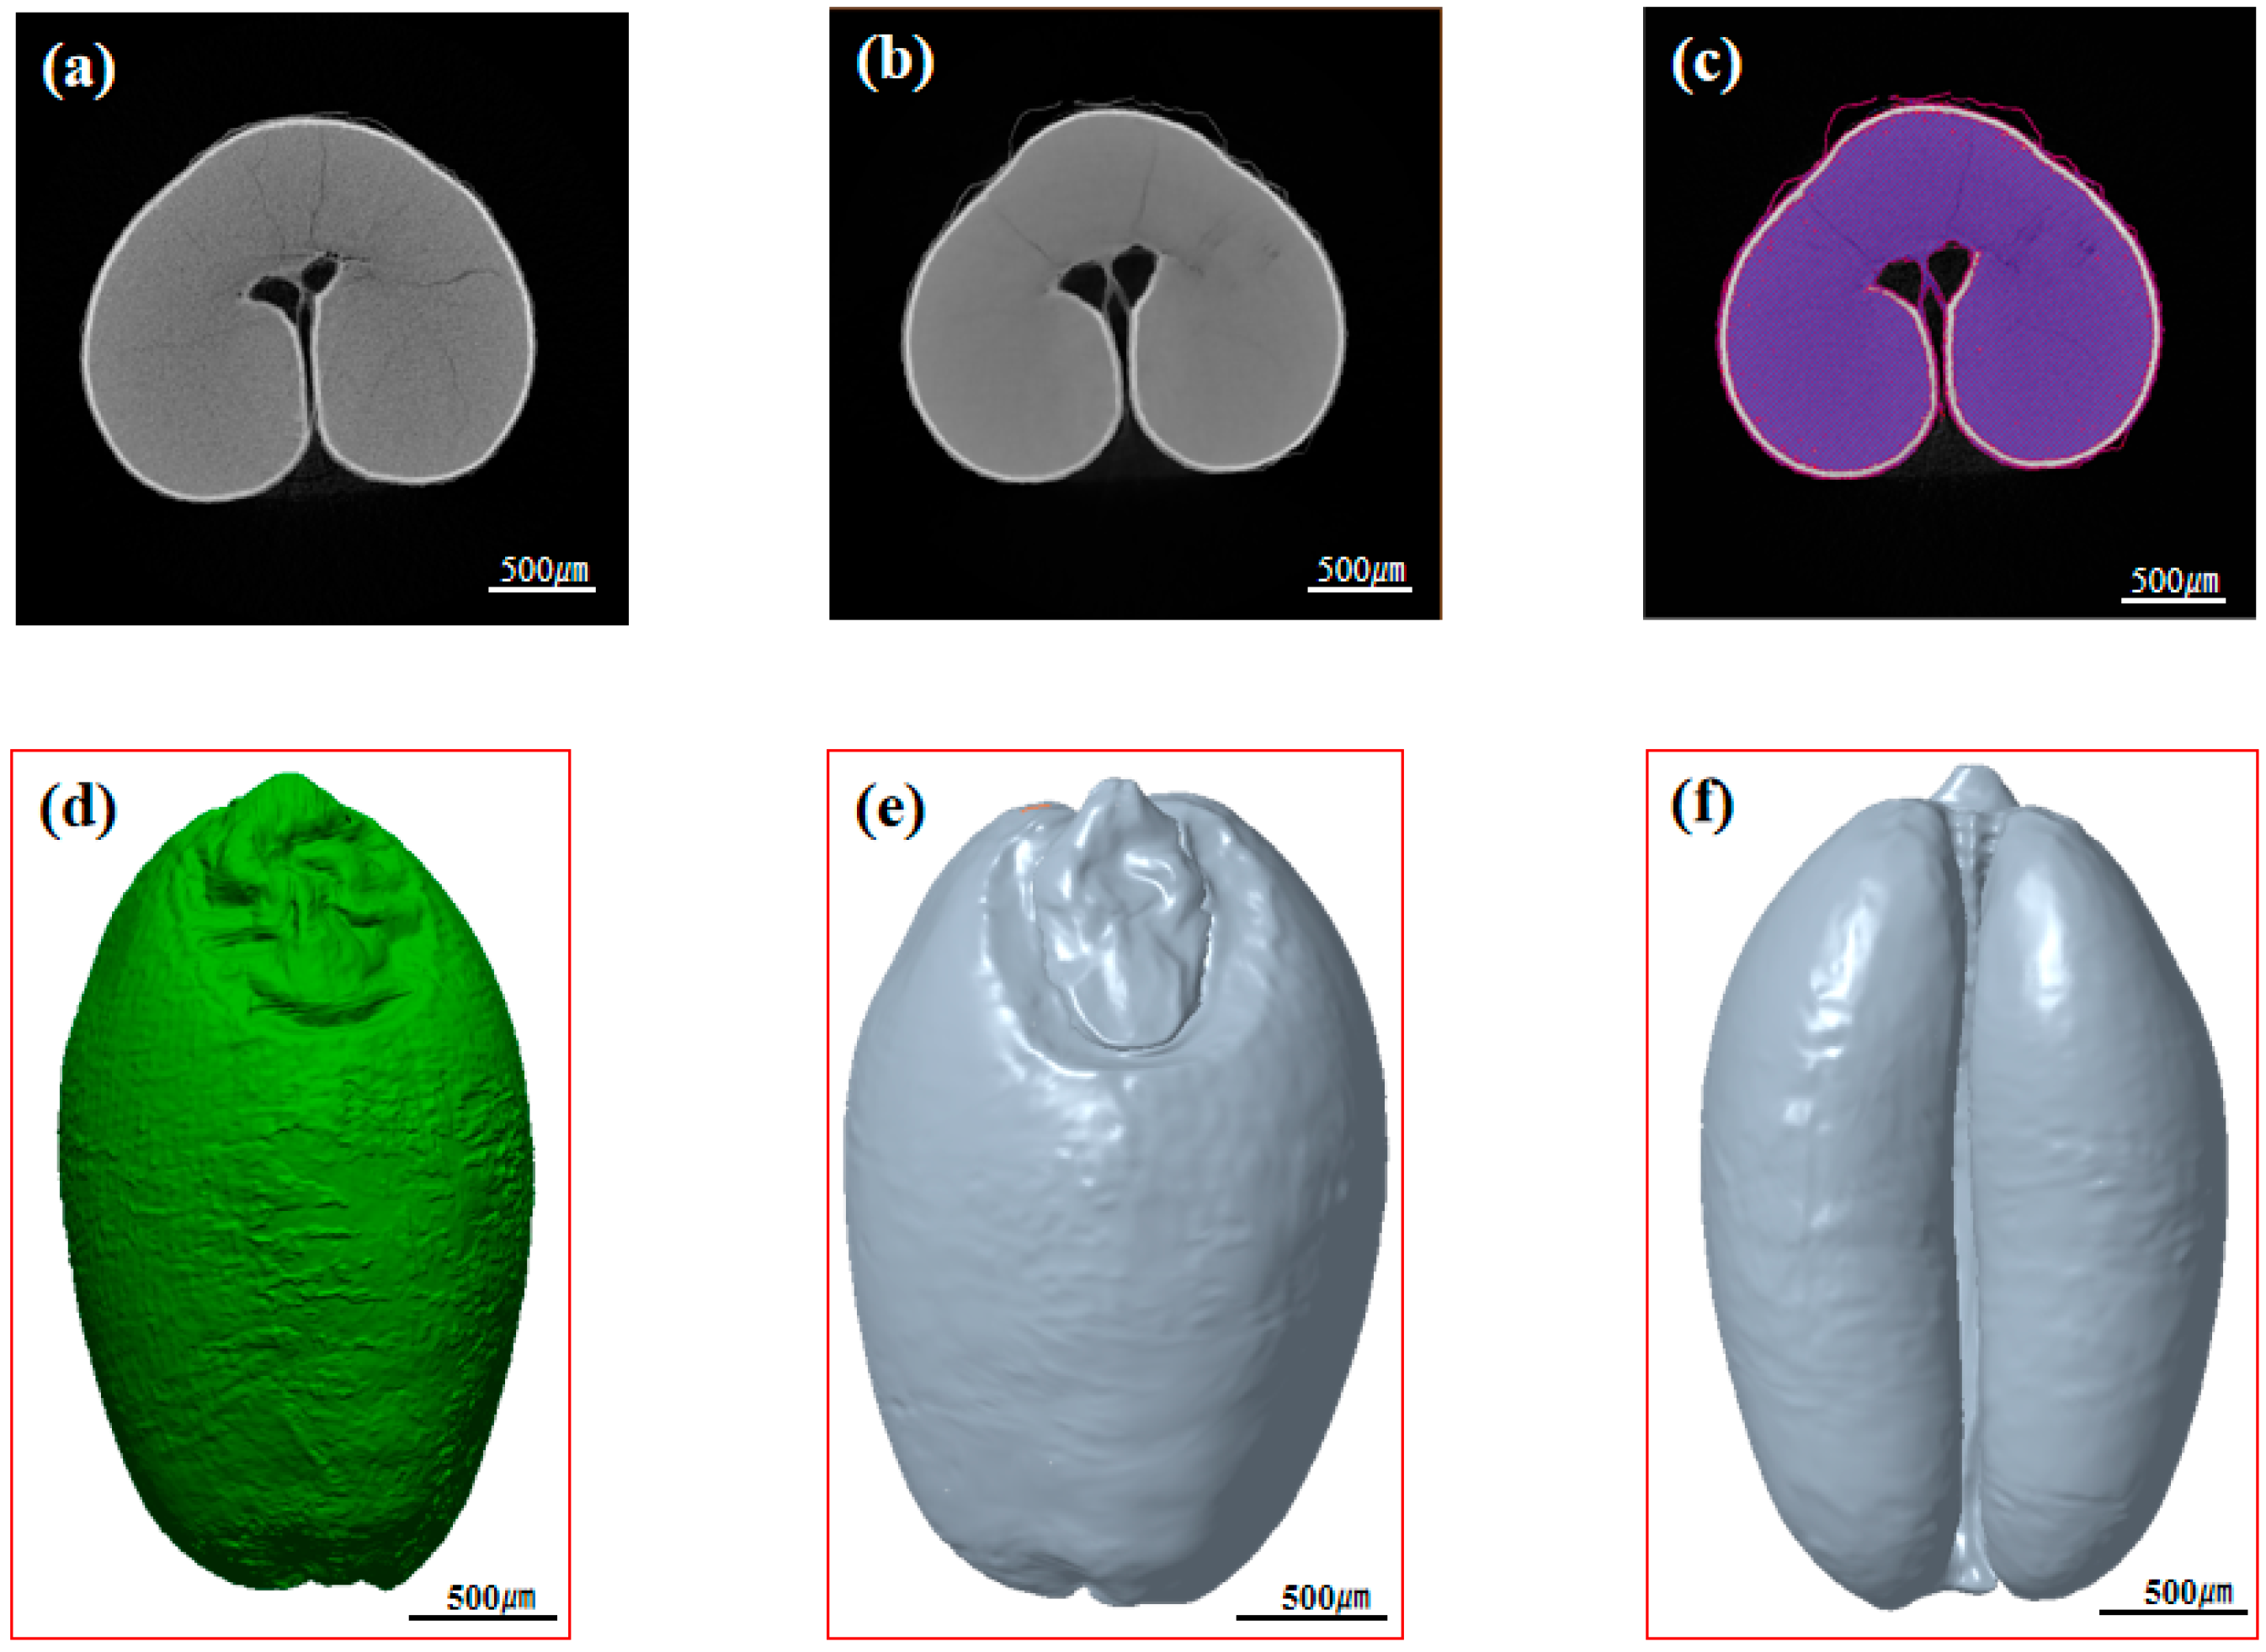
Figure 1. Reconstruction process of the 3D model of wheat grain. (a) 2D slices, (b) non-local mean filtering, (c) image segmentation, (d) model reconstruction, (e) front of the model, and (f) back of the model.
Applsci 13 09265 g001
Figure 2. The picture of particle and bonds. (a) particle filling, and (b) Bond key.
Applsci 13 09265 g002
Figure 3. Factors on the relative error. (a) The relationship of error and the normal stiffness per unit area, (b) the relationship of error and the shear stiffness per unit area, (c) the relationship of error and the critical normal stress, and (d) the relationship of error and the critical stress.
Applsci 13 09265 g003
Figure 4. Interaction effects of X3 and X4. X3 is the critical normal stress; X4 is the critical shear stress.
Applsci 13 09265 g004
Figure 5. Interaction effects of X1 and X4. X1 is the normal stiffness per unit area; X4 is the critical shear stress.
Applsci 13 09265 g005
Figure 6. Interaction effects of X1 and X3. X1 is the normal stiffness per unit area; X3 is the critical normal stress.
Applsci 13 09265 g006
Figure 7. Discrete-element simulation particle compression diagram.
Applsci 13 09265 g007
Figure 8. Discrete-element simulation bond compression diagram.
Applsci 13 09265 g008
Figure 9. YZ face crack contrast. (The left is the actual broken 2D slice, and the right is the discrete-element simulation fragmentation model).
Applsci 13 09265 g009
Figure 10. The 3D model crack contrast. (The left is the actual broken 3D model, and the right is the discrete-element simulation fragmentation model).
Applsci 13 09265 g010
Table 1. Contact parameters and bonding parameters for wheat grains.
ProjectParameterNumber
Material parameterWheat Poisson ratio0.4
Steel plate Poisson ratio0.3
Wheat Young’s modulus/Mpa244.24
Steel plate Young’s modulus/Mpa206,000
Wheat density/(kg/m3)1350
Steel plate density/(kg/m3)7500
Contact parameterWheat-wheat recovery coefficient0.46
Wheat-wheat static friction coefficient0.185
Wheat-wheat rolling coefficient of friction0.046
Wheat-steel plate recovery coefficient0.48
Wheat-static friction coefficient of steel plate0.23
Wheat-steel plate rolling friction coefficient0.05
Table 2. Parameters for filling particle radius and contact radius.
Wheat TissueFill the RadiusContact Radius
Embryo0.05/mm0.1/mm
Epidermal and endosperm0.1/mm0.12/mm
Table 3. Design and results of the Plackett–Burman test.
TestX1X2X3X4Test Relative Error/%
111−1170.53%
2−111−119.24%
31−111107.16%
4−11−1168.13%
5−1−11−15.11%
6−1−1−117.09%
71−1−1−15.48%
811−1−116.14%
9111−119.04%
10−111175.70%
111−111102.96%
12−1−1−1−14.65%
Table 4. Evaluation of the effects of each factor in the Plackett–Burman experimental design.
FactorSum of SquaresdfMean
Square
F
Value
p
Value
model1.4740.379.000.0068
X10.1710.174.070.0835
X20.01110.0110.270.6203
X30.2110.215.030.0599
X41.0911.0926.660.0013
Table 5. Experimental design and results of the steepest-ascent slope.
TestX1X3X4Critical Load/NRelative Error/%
1755110.447.05%
27.45.65.6158.42833.33%
37.86.26.2167.92141.32%
48.26.86.8205.09672.61%
58.67.47.4216.86982.52%
6988246.144107.16%
Table 6. Design and results of the Box–Behnken test.
TestX1X3X4Critical Load/N
1−1−10139.446
21−10144.169
3−110139.635
4110139.244
5−10−1130.844
610−1122.793
7−101138.881
8101153.638
90−1−1131.19
1001−1133.078
110−11153.902
12011148.864
13000127.358
14000135.727
15000135.272
16000134.104
17000131.865
Table 7. ANOVA for regression models.
SourceSum of SquaresdfMean
Square
F
Value
p
Value
model1142.349.00126.9318.550.0004
X115.231.0015.232.230.1793
X37.771.007.771.140.3218
X4748.461.00748.46109.41<0.0001
X1X36.541.006.540.960.3608
X1X4130.051.00130.0519.010.0033
X3X411.991.0011.991.750.2271
X126.781.006.780.990.3525
X32177.291.00177.2925.920.0014
X4224.341.0024.343.560.1012
Residual47.887.006.84----0.9921
Lack of Fit1.043.000.350.030.0004
Pure Error46.854.0011.71----0.1793
Cor Total1190.2216.00--------0.3218
CV = 1.9%, R2 = 0.9598, AdjR2 = 0.9098, PredR2 = 0.9246, Adep Precision = 15.755
Disclaimer/Publisher’s Note: The statements, opinions and data contained in all publications are solely those of the individual author(s) and contributor(s) and not of MDPI and/or the editor(s). MDPI and/or the editor(s) disclaim responsibility for any injury to people or property resulting from any ideas, methods, instructions or products referred to in the content.