1. Introduction
The use of mobile devices as a tool in our daily lives is universally widespread. This general use allows them to serve as a valuable source of information for the analysis of people’s performance in their daily activities [
1]. In their common usage, mobile devices and their applications can collect data about location, movement, battery usage, etc. Apart from sensor data, it is particularly interesting that interactions between users and their mobile devices also provide valuable information related to human behavior. Indeed, it has been shown that this analysis can support the diagnosis of diseases [
2] but should play a complementary role in the doctor–patient relationship. In regard to dementia, Blanka Klimova [
3] demonstrated the potential of mobile applications to facilitate diagnostic support, minimizing bias, with greater patient independence. Indirectly, such approaches can reduce healthcare costs and improve the overall quality of life of older people [
4]. This makes the analysis of smartphone interactions highly valuable, both in the general field of human–computer Interaction (HCI) and in healthcare, whether for diagnostic or treatment purposes.
This article is part of the project “Mobile computing-based Multitasking for Mild cognitive impairment Monitoring and early Screening (M
4S)”, which aims to contribute to the early diagnosis of cognitive decline by monitoring dual daily tasks in terms of interactions with mobile devices. One of the most common pre-dementia stages is known as mild cognitive impairment [
5] (MCI). It is defined as “cognitive decline greater than expected for an individual’s age and education level, but that does not interfere notably with activities of daily life” [
6]. One of the main motivations of this project is the increasing prevalence of MCI, with epidemiological studies estimating it to be between 3% to 19% in adults older than 65 years, and with a risk of it progressing to dementia (11–33% cases) after 2 years. The prevalence increases over time, being up to 50% for those who finally progress to dementia within 5 years [
7]. These statistics show that dementia is one of the most common disorders among older adults, and the number of people affected is projected to increase by up to three times by 2050 [
8].
The aim of this study is to determine which tasks performed with a mobile device show significant differences between population cohorts of different ages and whether this difference is more relevant when the tasks are performed while walking. This study is conducted with people who have no diagnosed dementia; therefore, the aim is to establish a ground truth regarding how the normal cognitive decline of aging affects the use of mobile devices, both while stationary and on the move.
This work is based on a previous study [
9] where we defined the HuSBIT-10 taxonomy for the main types of tasks performed with mobile devices (distinguishing between automatic, psychomotor, production, consumption, and exploration tasks). Based on this taxonomy, the cognitive load was studied by measuring it with electroencephalography (EEG), to extract those tasks with a more significant cognitive load. This study helped to determine the tasks to be monitored and analyzed in the current work.
After explaining the context, motivation, and objective of this work during the introduction section, the rest of the paper continues with a review of related works in the literature in
Section 2. Next, the description of the experimental protocol, materials, and methods (the BIPapp monitoring application and the generated dataset) is provided in
Section 3. The statistical method and results are explained in
Section 4. The user profiling model to classify people regarding the use of mobile devices and age is also developed in
Section 4.
Section 5 discusses the results’ scope, their meaning, and the possible limitations of the experiment. Finally,
Section 6 concludes the paper, discussing the goals accomplished and the contributions of this work.
2. Related Work
There are multiple diagnosis tools for MCI, such as neurological evaluation, cognitive tests, or physical examinations [
10], although none of them alone can provide high certainty in the results, so it is common to combine them. Within the neurological evaluation methods, there are tools such as EEG [
11] or fMRI [
12]. Regarding cognitive tests, two of the most used are the Mini-Mental State Examination (MMSE) [
13], which is a general test for dementia, and the Montreal Cognitive Assessment [
14], which is specific for MCI. Physical examination often refers to analyzing on-the-move activities, which represent a special focus of attention as they are commonly used as a tool in diagnosing cognitive decline. MCI is accompanied by other changes, such as balance and coordination [
15]. In particular, evidence of an association between cognitive impairment and gait has been found as soon as older adults are affected by MCI [
16,
17]. Thus, the ability to multitask has been said to be at the core of competency in everyday life [
18].
The term m-health refers to the usage of mobile devices to support medicine or improve people’s health. It can be used for treatment, as in [
19], where the authors proved that smartphones can be used to induce positive or negative affective states, or in [
20], where the authors developed an app to improve diabetes self-management. There are also applications to support the activities of health professionals [
21,
22]. The m-health usage on which this paper focuses is m-health for diagnosis [
4], and, more specifically, early diagnosis.
Research on smartphones as an early diagnosis tool has increased in the last few years and shows some promising results. In particular, for this paper, the focus is psychological and neurological disorders. For example, Kim et al. [
23] describes a mobile app for the gathering of self-reports of mental health ratings from breast cancer patients as a depression screening tool. In [
24], the authors propose a system for the detection of Parkinson’s disease, analyzing gait data from the smartphone, so that the doctor can obtain data that have been monitored continuously. In [
25], the authors implement into an app a modified version of the MMSE for the easy gathering of results using a voice recognition technique and automated scoring as an alternative to the paper version.
This paper is a preliminary study of the utility of smartphones as early diagnosis tools for the detection of MCI by combining ideas from traditional techniques of MCI diagnosis and modern mental disorder diagnosis using smartphones.
3. Materials and Methods
3.1. Experimental Protocol and Method
The experiment gathered evidence regarding mobile interactions in an empirical manner, with the data quantitatively analyzed. The twofold research question guiding this experiment was “Are there significant differences in mobile device use among groups of people of different ages and are they more characteristic when the interaction takes place on the move?”. This question resulted in two hypotheses to be tested through this experiment:
Hypothesis 1. Different tasks performed with a smartphone present different performance depending on the user’s age.
Hypothesis 2. The performance of mobile device tasks depends on whether the user is stationary or on the move.
The pilot study was conducted by the MAmI Research Group from the University of Castilla-La Mancha, a group focused on health informatics and HCI. The participants were informed about the scope and goals of this research and the collected data. The work was conducted with 45 participants, from 20 to 70 years old, who received and signed an information sheet and consent form, which provided detailed information about the study’s objective, procedures, and the types of data to be collected. All participants had the opportunity to consider their participation before making a final decision. Thereby, the preservation of the dignity and autonomy of the participants was ensured by their voluntary participation and the fact that they could leave the study at any time without any consequences.
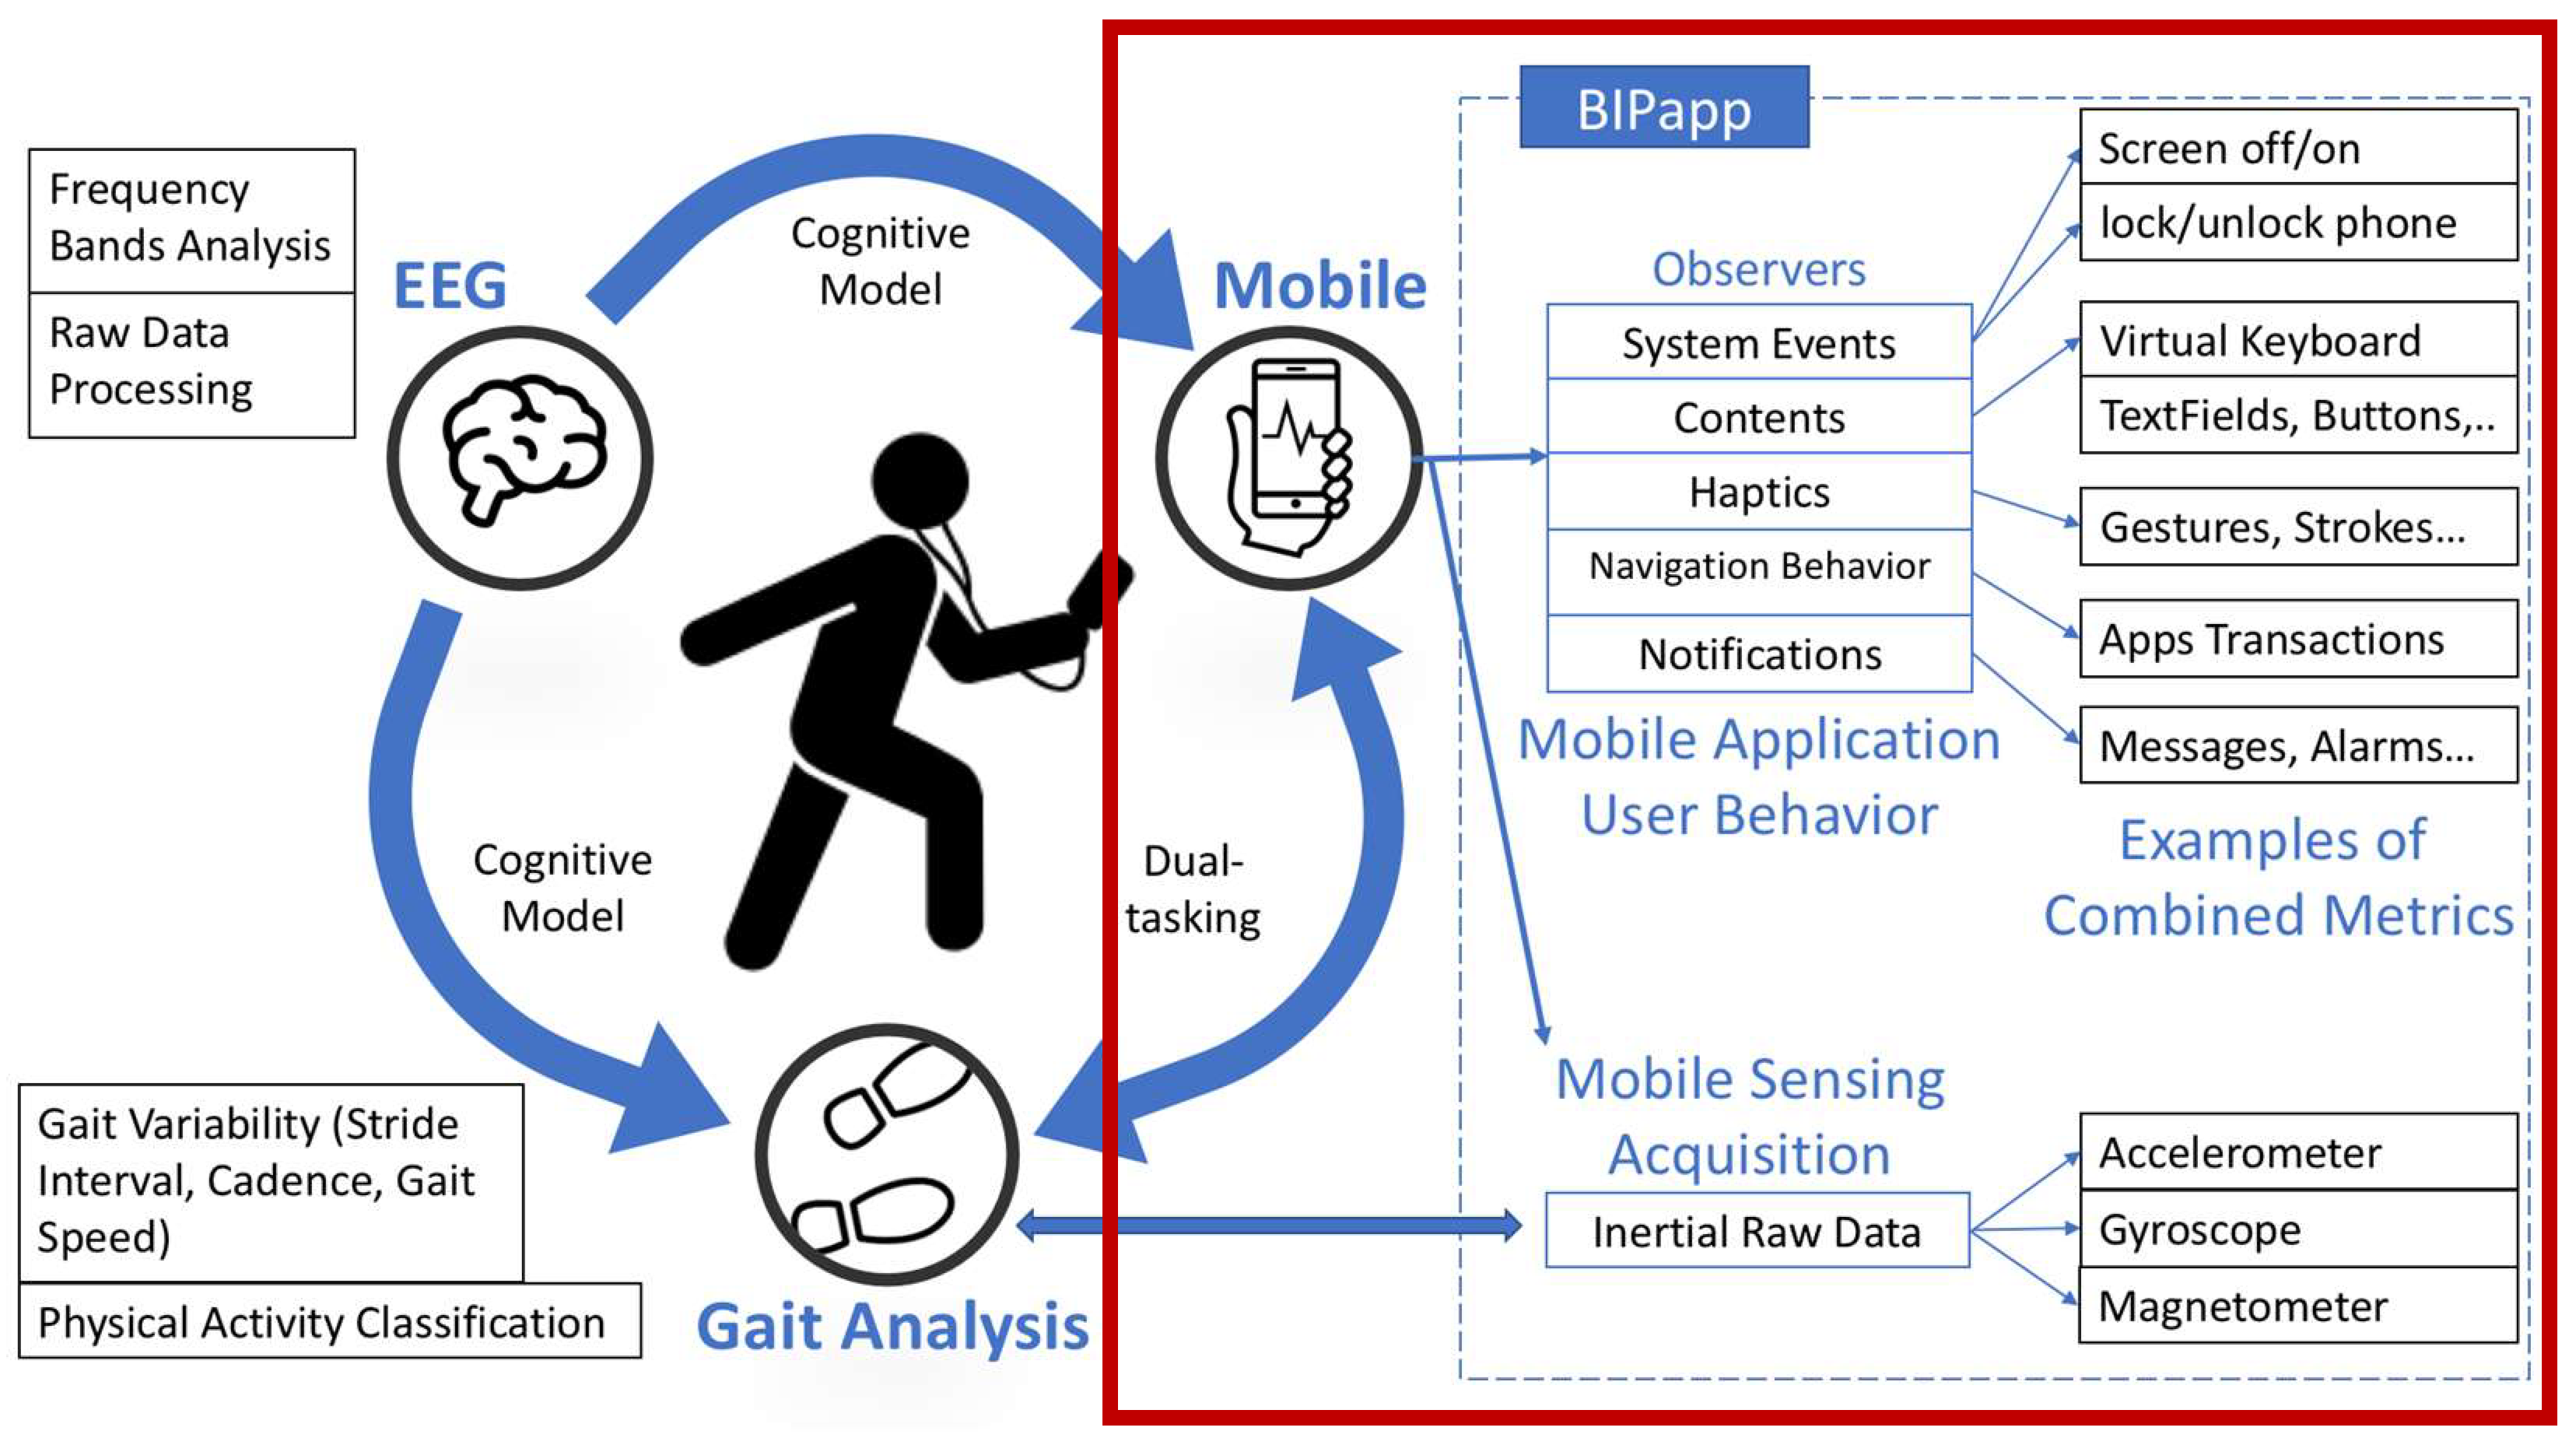
The overall context of the M
4S project presented above is described in
Figure 1. This work contributes to the characterization of the interactions with mobile devices. In the previous work [
9], the cognitive load of each task with the mobile device was studied to select the tasks to be considered in the present study. In parallel, a detailed analysis of gait variables while interacting with the mobile device was carried out using body tracking technology [
26]. The protocol employed within the experiment can be summarized as follows: (1) all participants were informed and signed the consent form; (2) the participants, with or without help, installed BIPapp (described in
Section 3.2) and configured it to activate the required permissions and services (i.e., accessibility and activity recognition services); (3) without receiving any additional instruction, they used their mobile devices for at least 7 days; and (4) users uninstalled BIPapp from their devices.
3.2. Material: BIPapp
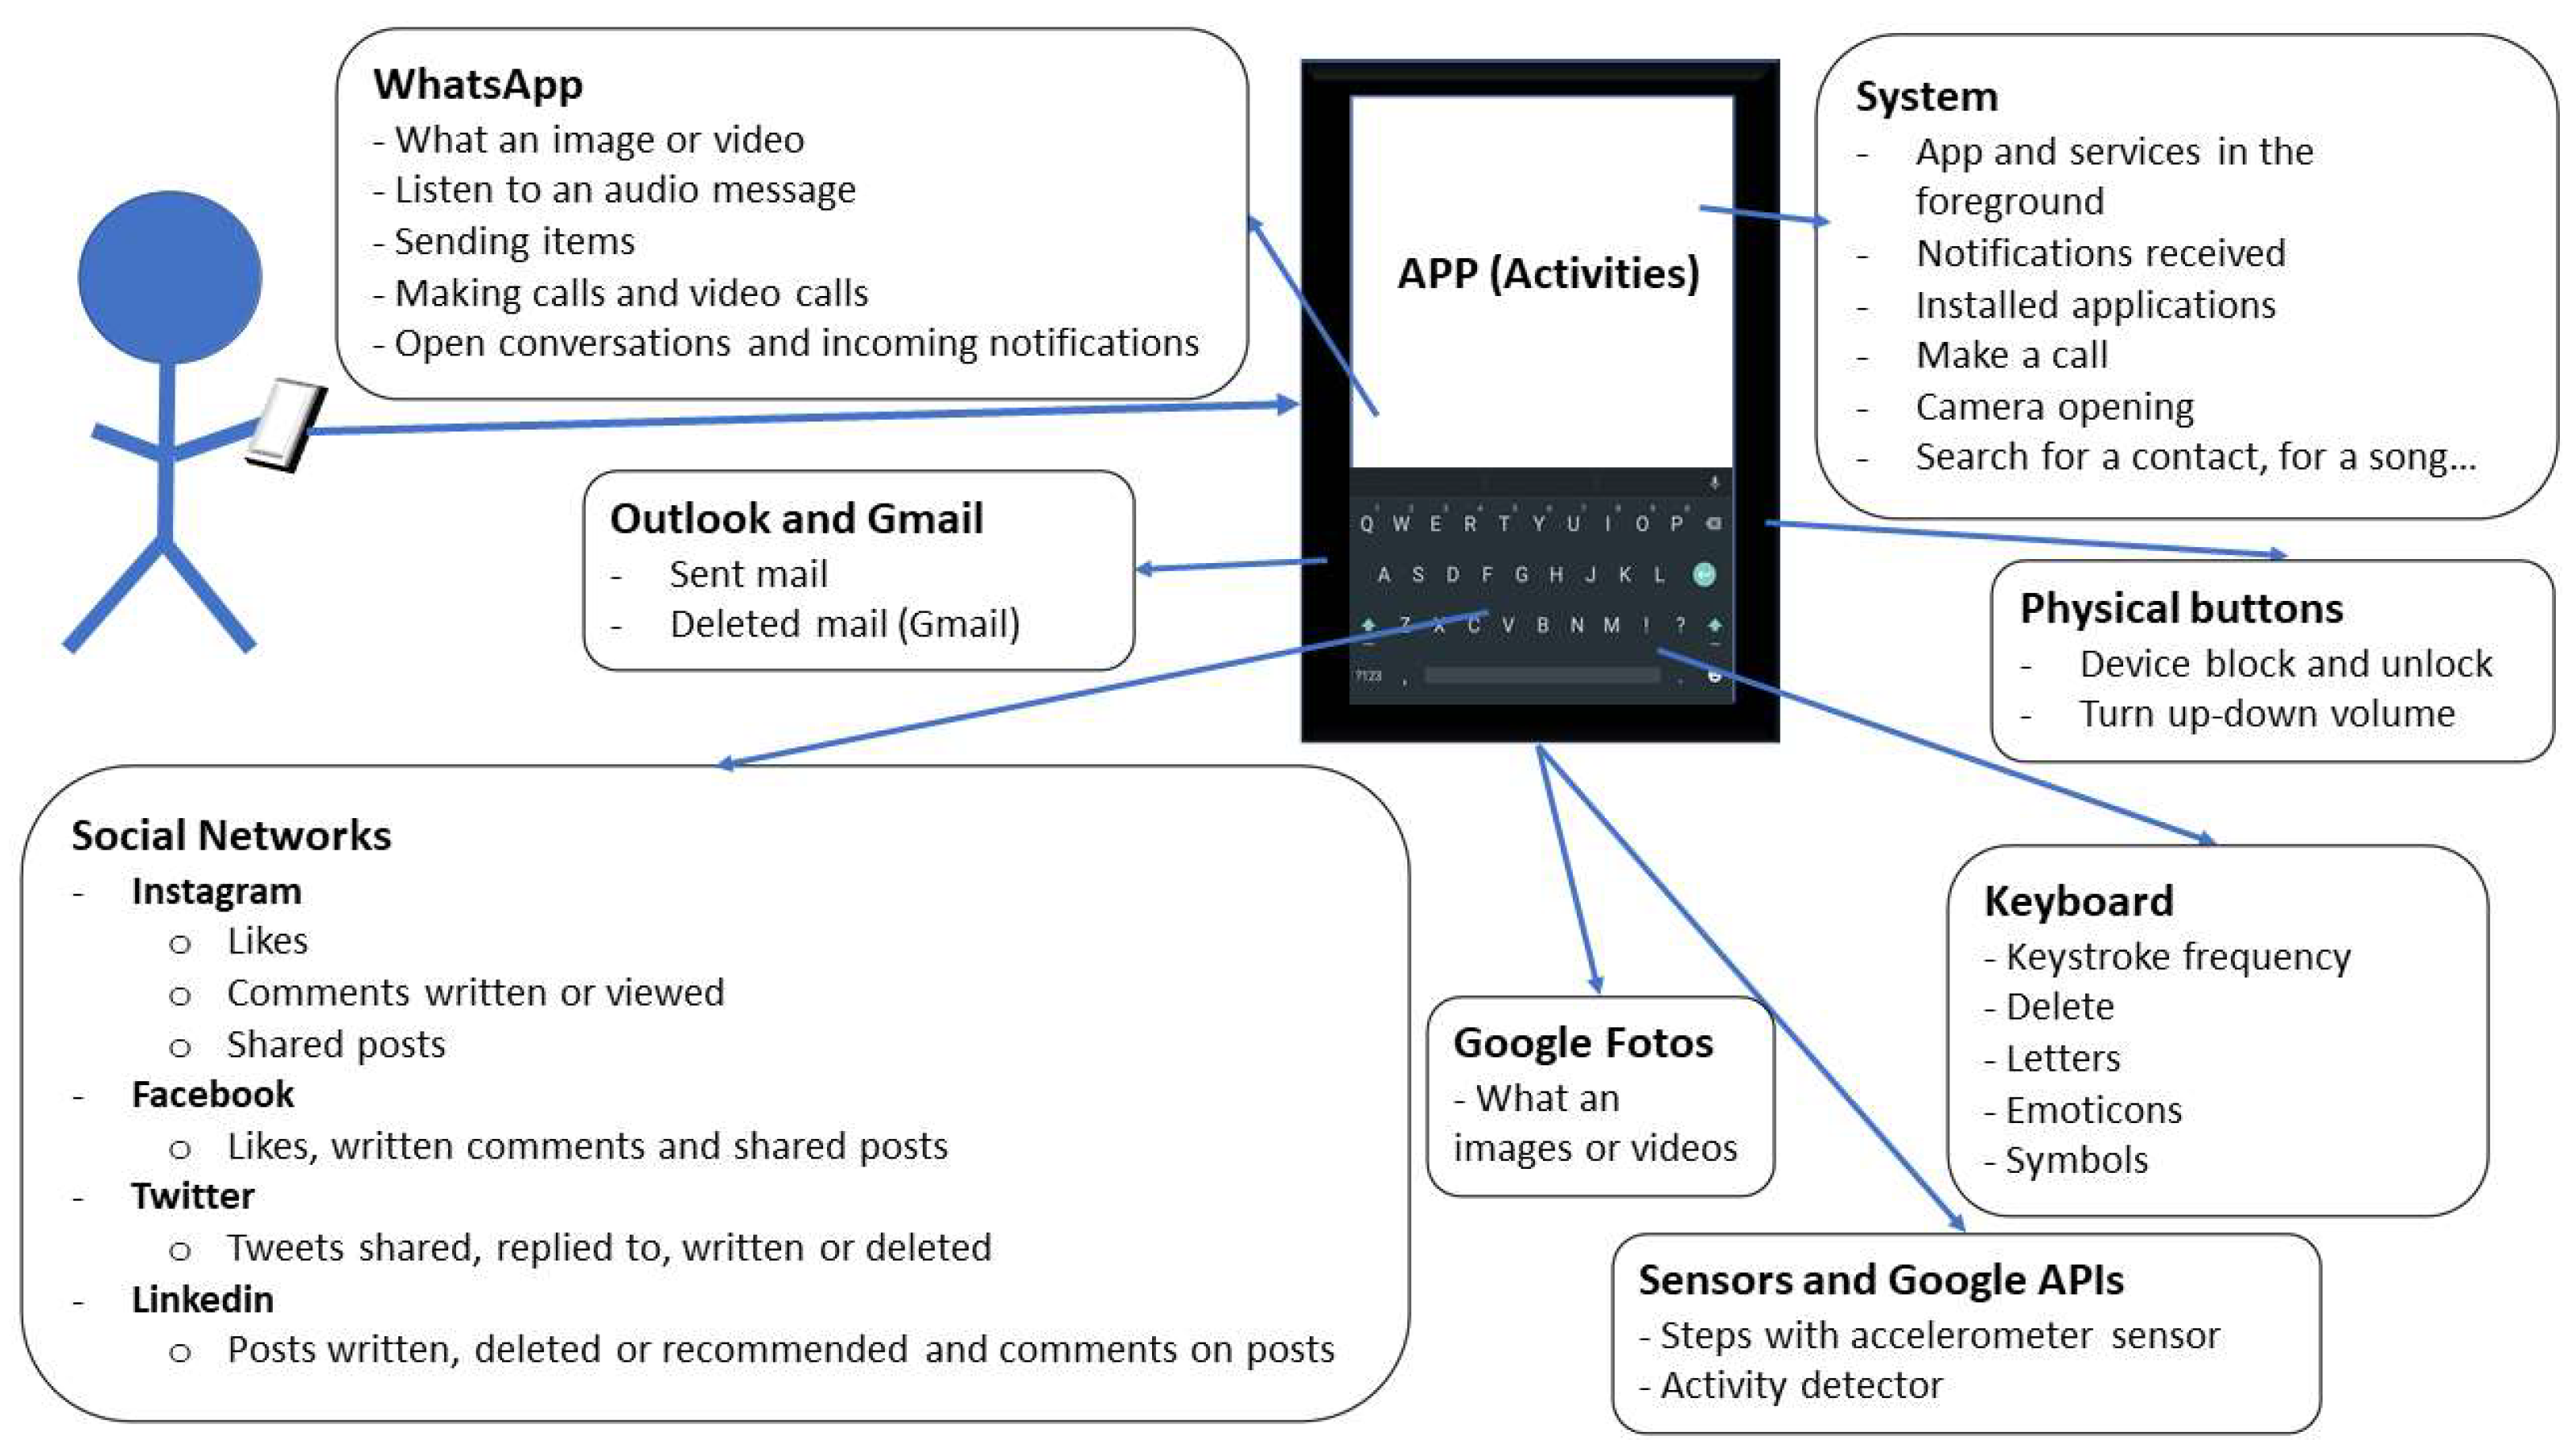
BIPapp is an Android mobile application that enables the monitoring of different actions and events performed by a user with a mobile device. Privacy and ethics are ensured in the collection of data by using a random unique identifier that prevents users from being recognized.
Figure 2 illustrates the different actions and events monitored.
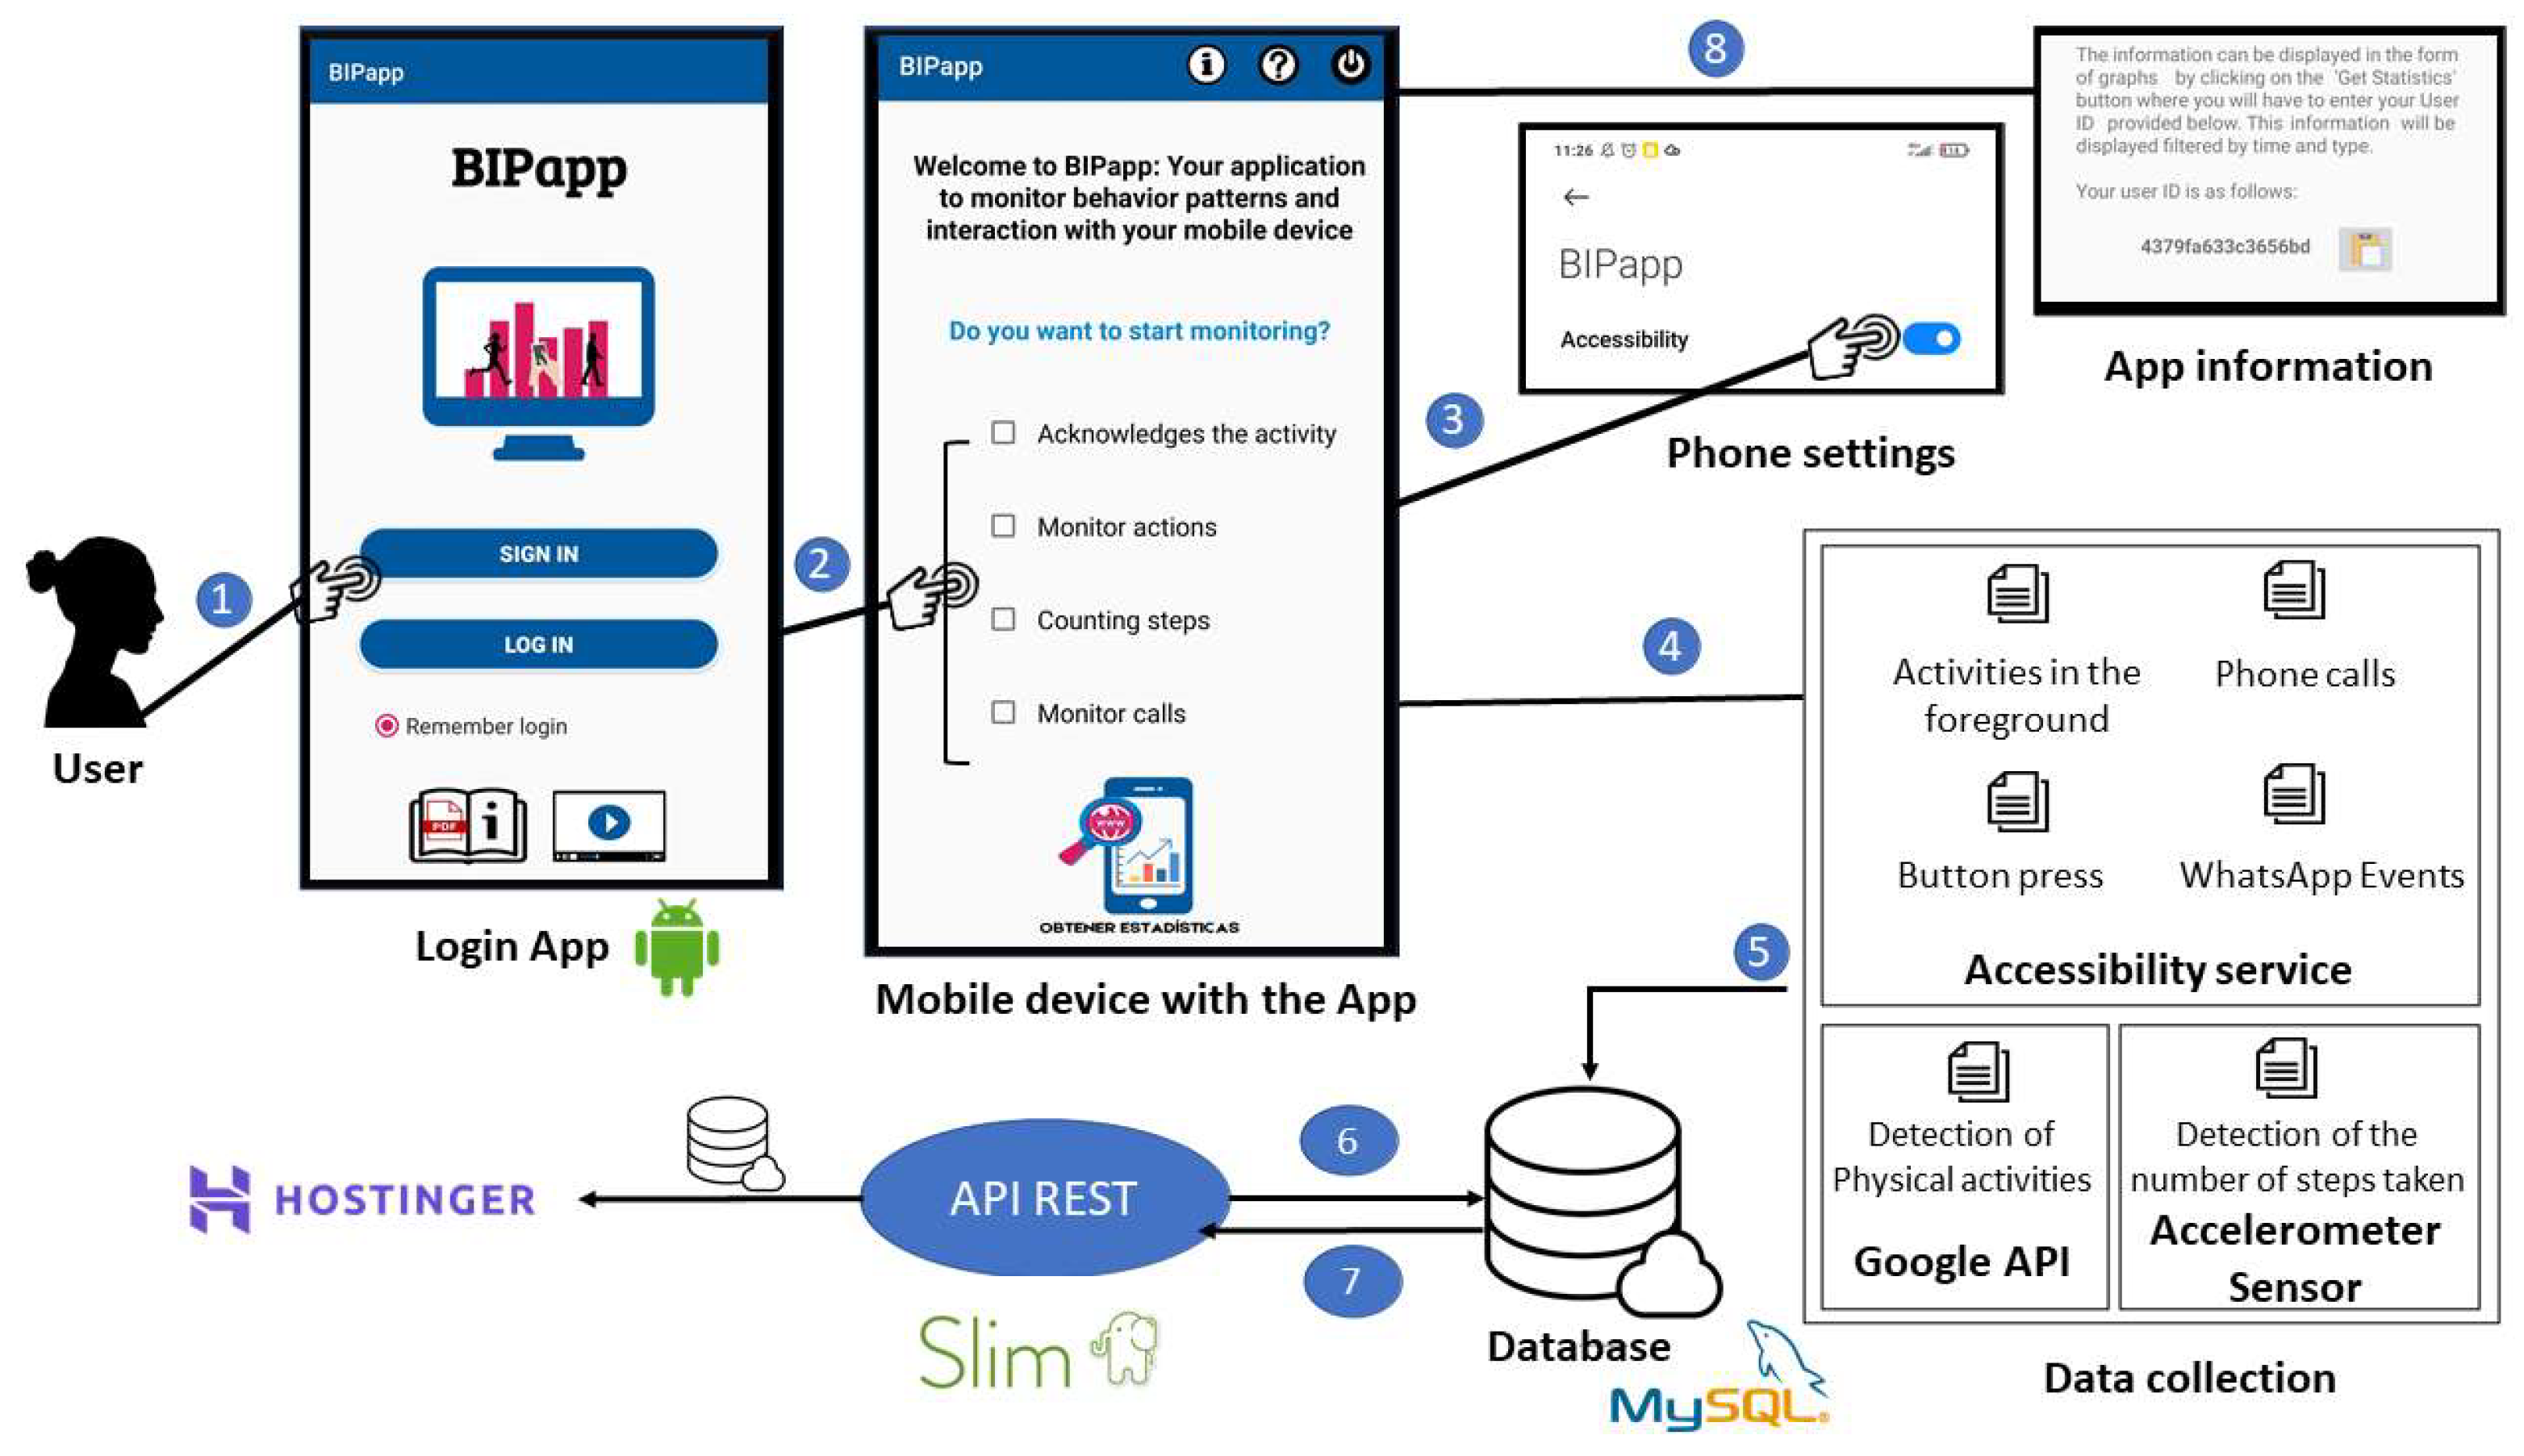
Once the user has registered and configured the app, all event data are stored in a relational database in the cloud (5). These data are accessed and processed via a REST API implemented with Slim (
https://www.slimframework.com/, accessed on 13 June 2023) (6) and (7). The “Application Information” section explains how the application works and shows the unique and anonymous user identifier assigned to it (8).
3.3. Obtained Data
The process of designing the database to store the data monitored by BIPapp was critical. For this purpose, a MySQL relational database hosted on a cloud server was used; this was due to the relationship between the tables, enabled by means of the unique identifier assigned to each user. The different tables created to store the collected data were as follows.
Apps. Stores specific events performed in certain applications. (e.g., sending an email, opening a WhatsApp conversation, liking a Facebook post, etc.).
AppsInstalled. These are records of the apps installed on each user’s device.
Lock. This stores the locking and unlocking events of the mobile device.
Buttons. This stores events related to pressing physical buttons, such as those to increase and decrease the volume.
ActivityDetect. This records the different physical activities performed by the user and related to the event performed with the device at that moment.
Calls. The numbers and dates of incoming, outgoing, and missed calls are recorded.
FirstPlane. This stores the use of a given application along with the event produced in that application.
Keyboard. This logs events performed with the keyboard, specifically metrics that measure the typing of letters, symbols, and emoticons (it does not store conversations).
Users. These are the distinct encrypted identifiers for users.
At the end of the experiment, there were approximately 4,500,000 records in the database. The criterion for inclusion in the experiments was that a full, uninterrupted week of data was available, so a subset of users had to be disregarded. In the end, 29 users were included in the dataset, with a total of 3,805,000 data records. The following section describes how the data were processed to obtain the final dataset.
3.4. Data Pre-Processing and Generated Dataset
Due to the number of records, as well as their nature, it was necessary to conduct several refinement processes in order to be able to effectively use these data.
The first step was to condense the different events into cycles to profile the users. To accomplish this, several approaches were considered, including grouping by time window, grouping by event typology, and grouping by locked/unlocked cycles. As the focus of the study was oriented towards the uses applied to the mobile device, the decision was made to use the lock/unlock cycle classification approach, which was achieved with the algorithm in Algorithm 1. As described, the filtering of the locked/unlocked events of all users was performed first. After this, they were sorted temporally, from oldest to newest. Finally, a loop was performed that checked the input or output of lock/unlock events and stored this information in a lexicon to then assign the type of cycle to each record.
| Algorithm 1 Locked/Unlocked cycles generation |
| 1: Let cycles = {} |
| 2: for user = 0, 1, 2,…, N from users do |
| 3: Assign user_events all the user events on smartphone that are |
| locked/unlocked events |
| 4: Let in_locked = False variable |
| 5: Let in_unlocked = False variable |
| 6: for user_event = 0, 1, 2,…, M from user_events do |
| 7: if user_event is the first then |
| 8: if user_event is an locked event then |
| 9: Assign in_locked = True variable |
| 10: Add a new register to cycles dictionary, with kind lock |
| and init with the timestamp of the event |
| 11: else |
| 12: Assign in_unlocked = True variable |
| 13: Add a new register to cycles dictionary, with kind unlock |
| and init with the timestamp of the event |
| 14: end if |
| 15: else |
| 16: if in_lock and user_event is a unlocked event then |
| 17: Access to the register of cycles variable and add the end |
| of the cycle with the last event timestamp |
| 18: Access in_lock = False |
| 19: Access in_unlock = True |
| 20: Add a new register to cycles dictionary, with kind unlock |
| and init with the timestamp of the current event |
| 21: else if in_unlock and user_event is a locked event then |
| 22: Access to the register of cycles variable and add the end |
| of the cycle with the last event timestamp |
| 23: Assign in_unlock = False |
| 24: Access in_lock = True |
| 25: Add a new register to cycles dictionary, with kind unlock |
| and init with the timestamp of the current event |
| 26: end if |
| 27: end if |
| 28: end for |
| 29: Use cycles to assign the kind of cycle of every user event |
| 30: end for |
The second step comprised combining the user event logs (classified into locked/unlocked cycles as explained above) with the physical activity logs. Here, we dealt mainly with the difference in the frequency of physical activity and user event collection. To solve this and perform an accurate matching process, an algorithm was designed and implemented that could assign to each event the physical activities closest in time and type; Algorithm 2 provides details of the algorithm. In this case, it was traversed event by event, using the time stamp. With this time stamp and a pre-determined time drift of seconds, a time window was established to locate physical activities. The activities that fell within the window were ordered temporally, and the one closest to the time stamp of the event (or the one with the least temporal drift) was searched.
| Algorithm 2 Combining smartphone events and physical activity |
| 1: Let time_drift = 3 |
| 2: Add action = NOT ACTION and confidence = 100 parameters to |
| user events dataset |
| 3: for user = 0, 1, 2,…,N from users do |
| 4: if first_timestamp_event of user < first_timestamp_physical then |
| 5: Assign events variable to the events collection with a timestamp |
| ≥ first_timestamp_physical of user |
| 6: Assign phyacts variable to all the physical activities of user |
| 7: else if first_timestamp_event of user > first_timestamp_physical |
| then |
| 8: Assign phyacts variable to the physical activities collection with |
| a timestamp ≥ first_timestamp_physical of user |
| 9: Assign events variable to all the events of user |
| 10: else |
| 11: Assign events variable to all the events of user |
| 12: Assign phyacts variable to all the physical activities of user |
| 13: end if |
| 14: for event = 0, 1, 2,…, M from events do |
| 15: Let timestamp_event variable the value of event timestamp |
| 16: Let phy_acts_coll all the physical activities between |
| timestamp_event-time_drift and timestamp_event + time_drift |
| 17: if phy_acts_coll size ≥ 0 then |
| 18: Checks all the candidates and select those that satisfy |
| Min ([timestamp_event-timestamp_phy]) |
| 19: if Selected candidates size ≥ 1 then |
| 20: Selected the candidate that satisfies Max (count(candidate∈ |
| candidates)) |
| 21: end if |
| 22: Assign the action and confidence parameter from the best |
| candidate find to the events dataset |
| 23: end if |
| 24: end for |
| 25: end for |
After combining physical activities as events captured by the mobile device, “summary cycles” were computed that grouped the counts of all events and actions given during a lock or unlock. During this process, several metrics were generated, such as the cycle time, number of production type events, and average typing time. In the following sections, we provide additional details about the mechanisms that utilize the generated dataset.
4. Results
4.1. Statistical Analysis
The data are studied from two perspectives, one statistical and one algorithmic. The objective of each approach is different. The defined hypotheses are investigated through the statistical approach (
Section 3). The user profiling model is applied to establish how people of different ages use mobile phones (
Section 4); this provides us with a method for the classification of users.
4.1.1. Theory and Calculation
To check the study’s hypotheses, a statistical analysis was developed from the data collected to identify correlations or associations between different metrics of mobile usage and users’ ages (e.g., comparing the number of characters deleted by each user, the frequency of typing, the amount of time spent using the mobile phone, etc.). These metrics were also linked to the physical activity performed at each moment.
A non-parametric statistical test was performed as the sample was small and did not follow a normal distribution. Due to the nature of the data as continuous quantitative variables, Pearson’s correlation coefficient [
27] was applied in order to measure the ordinal association between two measured quantities. Pearson’s correlation coefficient ranges from −1 to +1, indicating in both cases the degree of association between variables but in opposite directions. According to the suggestions given in [
28], the interpretation of the magnitude of Pearson’s correlation coefficient is shown in
Table 1. It represents the relationship between X and Y in absolute values but applies to any pair of variables.
The first step was to make certain assumptions about the parameters by establishing two opposite hypotheses: a null hypothesis and an alternative hypothesis. Then, depending on the coefficient obtained, a decision was made to accept or reject the hypothesis. This measure of inferential statistics made it possible to draw conclusions or general patterns for the whole population from the study of the sample and the degree of significance of the results obtained.
4.1.2. Results of the Statistical Approach
Based on the first hypothesis about verifying how people use their mobile devices differently depending on their age, a statistical analysis was performed using the data obtained.
The data of users who completed the experiment were organized into stages of adulthood according to Carl Jung’s theory [
29], in order to analyze changing trends in the use of mobile devices.
Table 2 describes each age range. To distinguish each user’s events, we used a variable named “identifier”. Participants also provided their subjective ability to use technology. A criterion for inclusion was that the participants typically used mobile devices in their daily tasks, including communication, shopping, managing finances, and searching for information on the internet.
The fixed variables were age and the type of physical activity (standing or moving). The rest of the variables were selected based on the information collected and those that differentiated the use of the device from one user to another. Sex/gender and the technological ability of the participants were variables that were collected, but, due to the limited population, they were not considered in the study as no meaningful statistical conclusions could be drawn. Inferential analysis of the data was then performed using Pearson’s correlation coefficient. Firstly,
Table 3 summarizes this correlation regarding mobile use and age.
To provide greater detail on the use of mobile devices, the applications utilized by users were classified by the type of content offered to users. Five types were distinguished: financial, commercial, shopping, entertainment, and utility. As
Table 4 depicts, the most frequently used applications were commercial, utility, and entertainment.
The significance of the analysis lies in differentiating the use of the mobile device while the user is standing or in motion. Therefore, starting from the previous classification, an exploration was performed of the applications utilized by users on the move and the degree of correlation that existed with respect to age (
Table 5).
Focusing on WhatsApp and Facebook, the two applications most often used,
Table 6 shows that the older the age of users, the fewer actions they performed on the application.
Studying the correlation index between the age of the users and the number of each type of call made (
Table 7), a low association was found, where, as the age increased, more calls were made.
Finally, the relationship between the user’s age and the number of elements written (letters, symbols, and emoticons) and between the age and the number of elements deleted was studied, as depicted in
Table 8.
4.2. User Profiling
4.2.1. Theory and Calculation
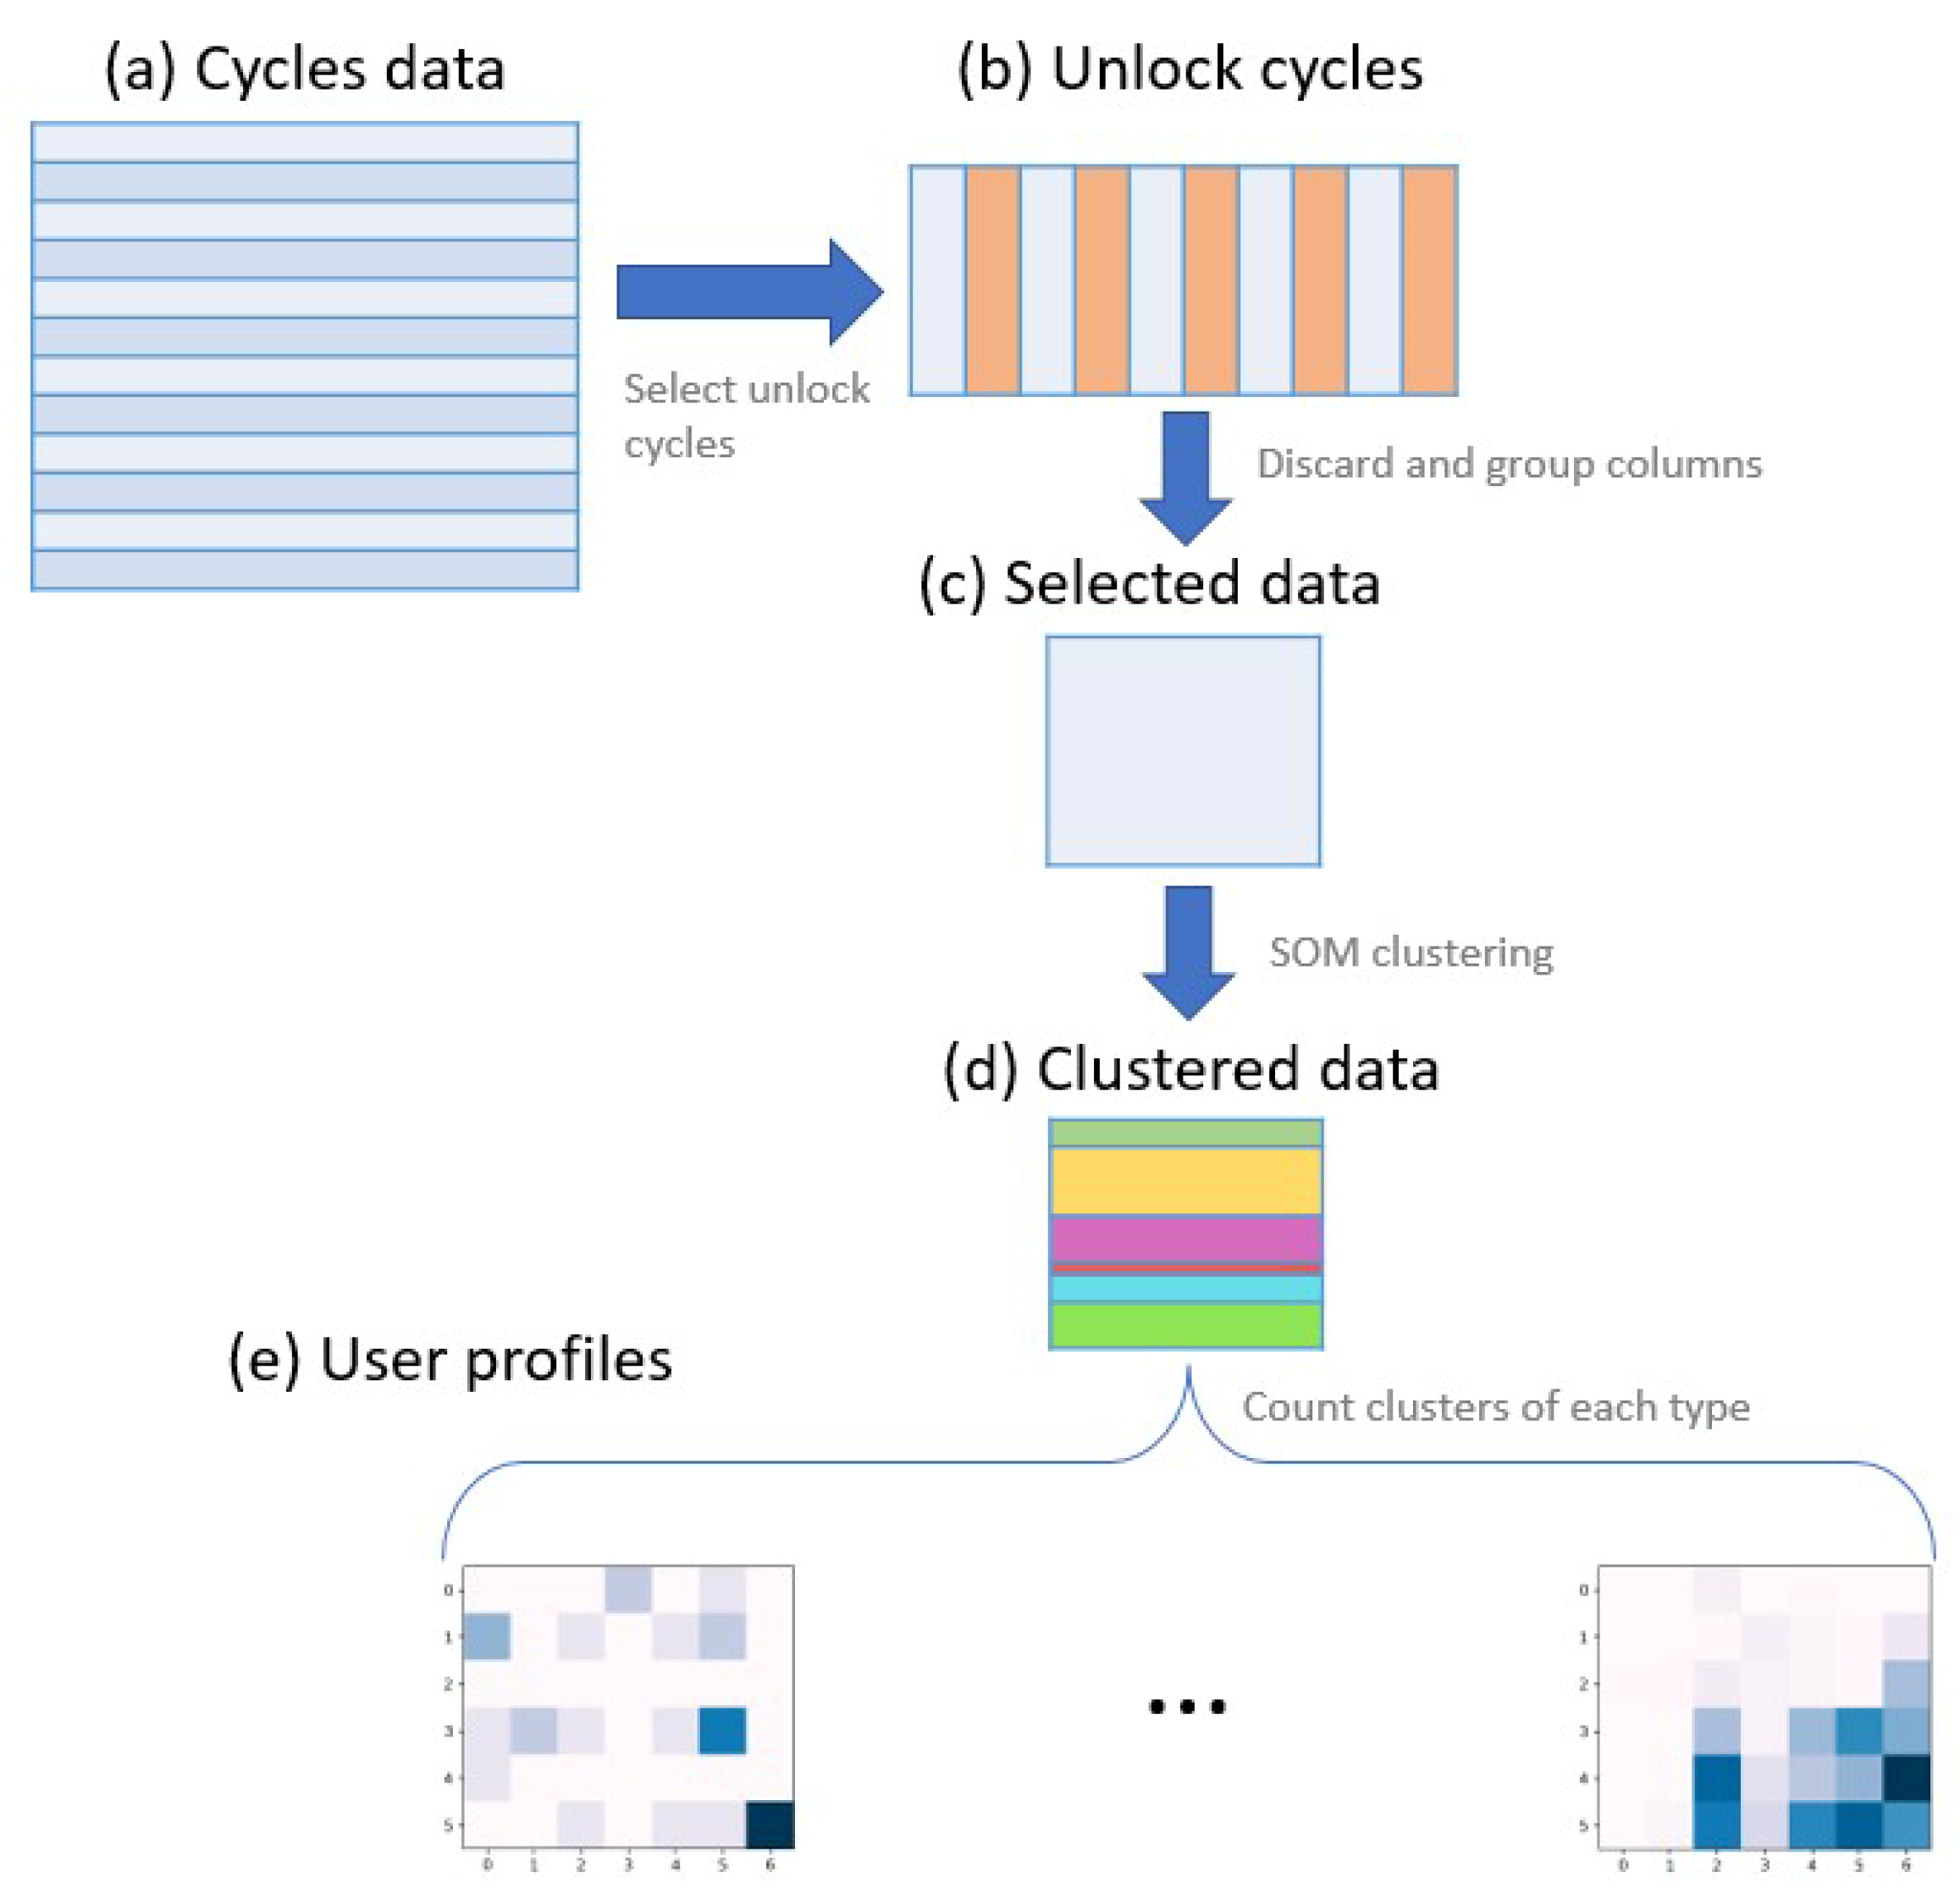
With the objective of building a method to determine how people use their mobile phones differently depending on their age, a model for the construction of a device interaction profile was developed. The proposed profiling method consists of counting how many cycles of each type each user has; therefore, this section explains how each cycle type is labeled.
The focus of this process is to characterize a user by the way in which she or he interacts with the mobile device, and, as the interaction when the mobile device is locked is minimal, as a first step, locked cycles are discarded. As a next step, to increase the interpretability of the data, a subset of features that are more appropriate to characterize each type of cycle is selected. This subset is further reduced by totaling the type of interaction following the HuSBIT-10 taxonomy [
9] and the physical activities’ durations that are highly related between them.
Once the data are simplified, the next step is to group the cycles according to their similarities, for which a clustering algorithm is an appropriate tool. The data have many samples, thus making the utilization of numerous clustering algorithms unfeasible because they require an excessive amount of time to be executed; thus, they are discarded. Moreover, these data present a distribution with varying density, and many samples are quite similar, which results in most of the clustering algorithms producing highly unbalanced groups. As a result, after testing a number of clustering algorithms, a self-organizing map (SOM) [
30] is chosen. An SOM is an unsupervised artificial neural network that projects the data to a low-dimensional (usually 2D) network while maintaining their topological structure. The SOM algorithm starts by creating a neural network and initializes its weights, which can be random, decided beforehand, or set by prior calculation (for example, principal component analysis). Then, each sample of the dataset is associated with a neuron based on its weights, and these weights, along with the weights of neighboring neurons, are modified to be closer to the sample. After repeating this process several times but decreasing how much the weights are affected, the weights of the neurons will converge, and the network will be trained. One of the main hyperparameters of an SOM algorithm is the topology and its dimensions. The other two main hyperparameters are the initial learning rate, which affects how much the weights of each neuron are modified, and the sigma, which represents the radius by which nearby neurons affect each other. For this case, a hexagonal topology is used with dimensions of 6 × 7, a learning rate of 1.5, and a sigma of 1.3. These specific values are established after performing a grid search. MiniSom (
https://github.com/JustGlowing/minisom, accessed on 25 June 2023) is the implementation of the algorithm that is employed in this paper.
Before applying the algorithm, the data are pre-processed in two ways. First, a logarithm is applied to the duration column, so that its distribution is similar to a Gaussian function, and its large scale has less impact on the clustering. Second, all the data are standardized using Z-score normalization, causing all of them to have the same scale, which is highly desirable for a clustering process. Once the clustering process is completed, the next step is to study each group of cycles by observing their distributions and the means, medians, and standard deviations of the different features. Lastly, profiles are built by counting the number of cycles of each type for each user. This process is illustrated in
Figure 4.
A decision tree is used to study the differences between these profiles for each age group. A decision tree [
31] is a supervised learning classifier that uses a tree structure to create recursive splits of the data, where each leaf represents a class, and each intermediate node represents a split. How the data are split depends on the functions used to determine the quality of a split, with the most used being entropy and Gini impurity. For the analysis, the scikit-learn [
32] implementation is used, which applies, by default, the Gini impurity function. This algorithm is usually less powerful than many other classifiers, but it is useful in visualizing how classes are assigned based on the data used to train the tree.
4.2.2. User Profiling Results
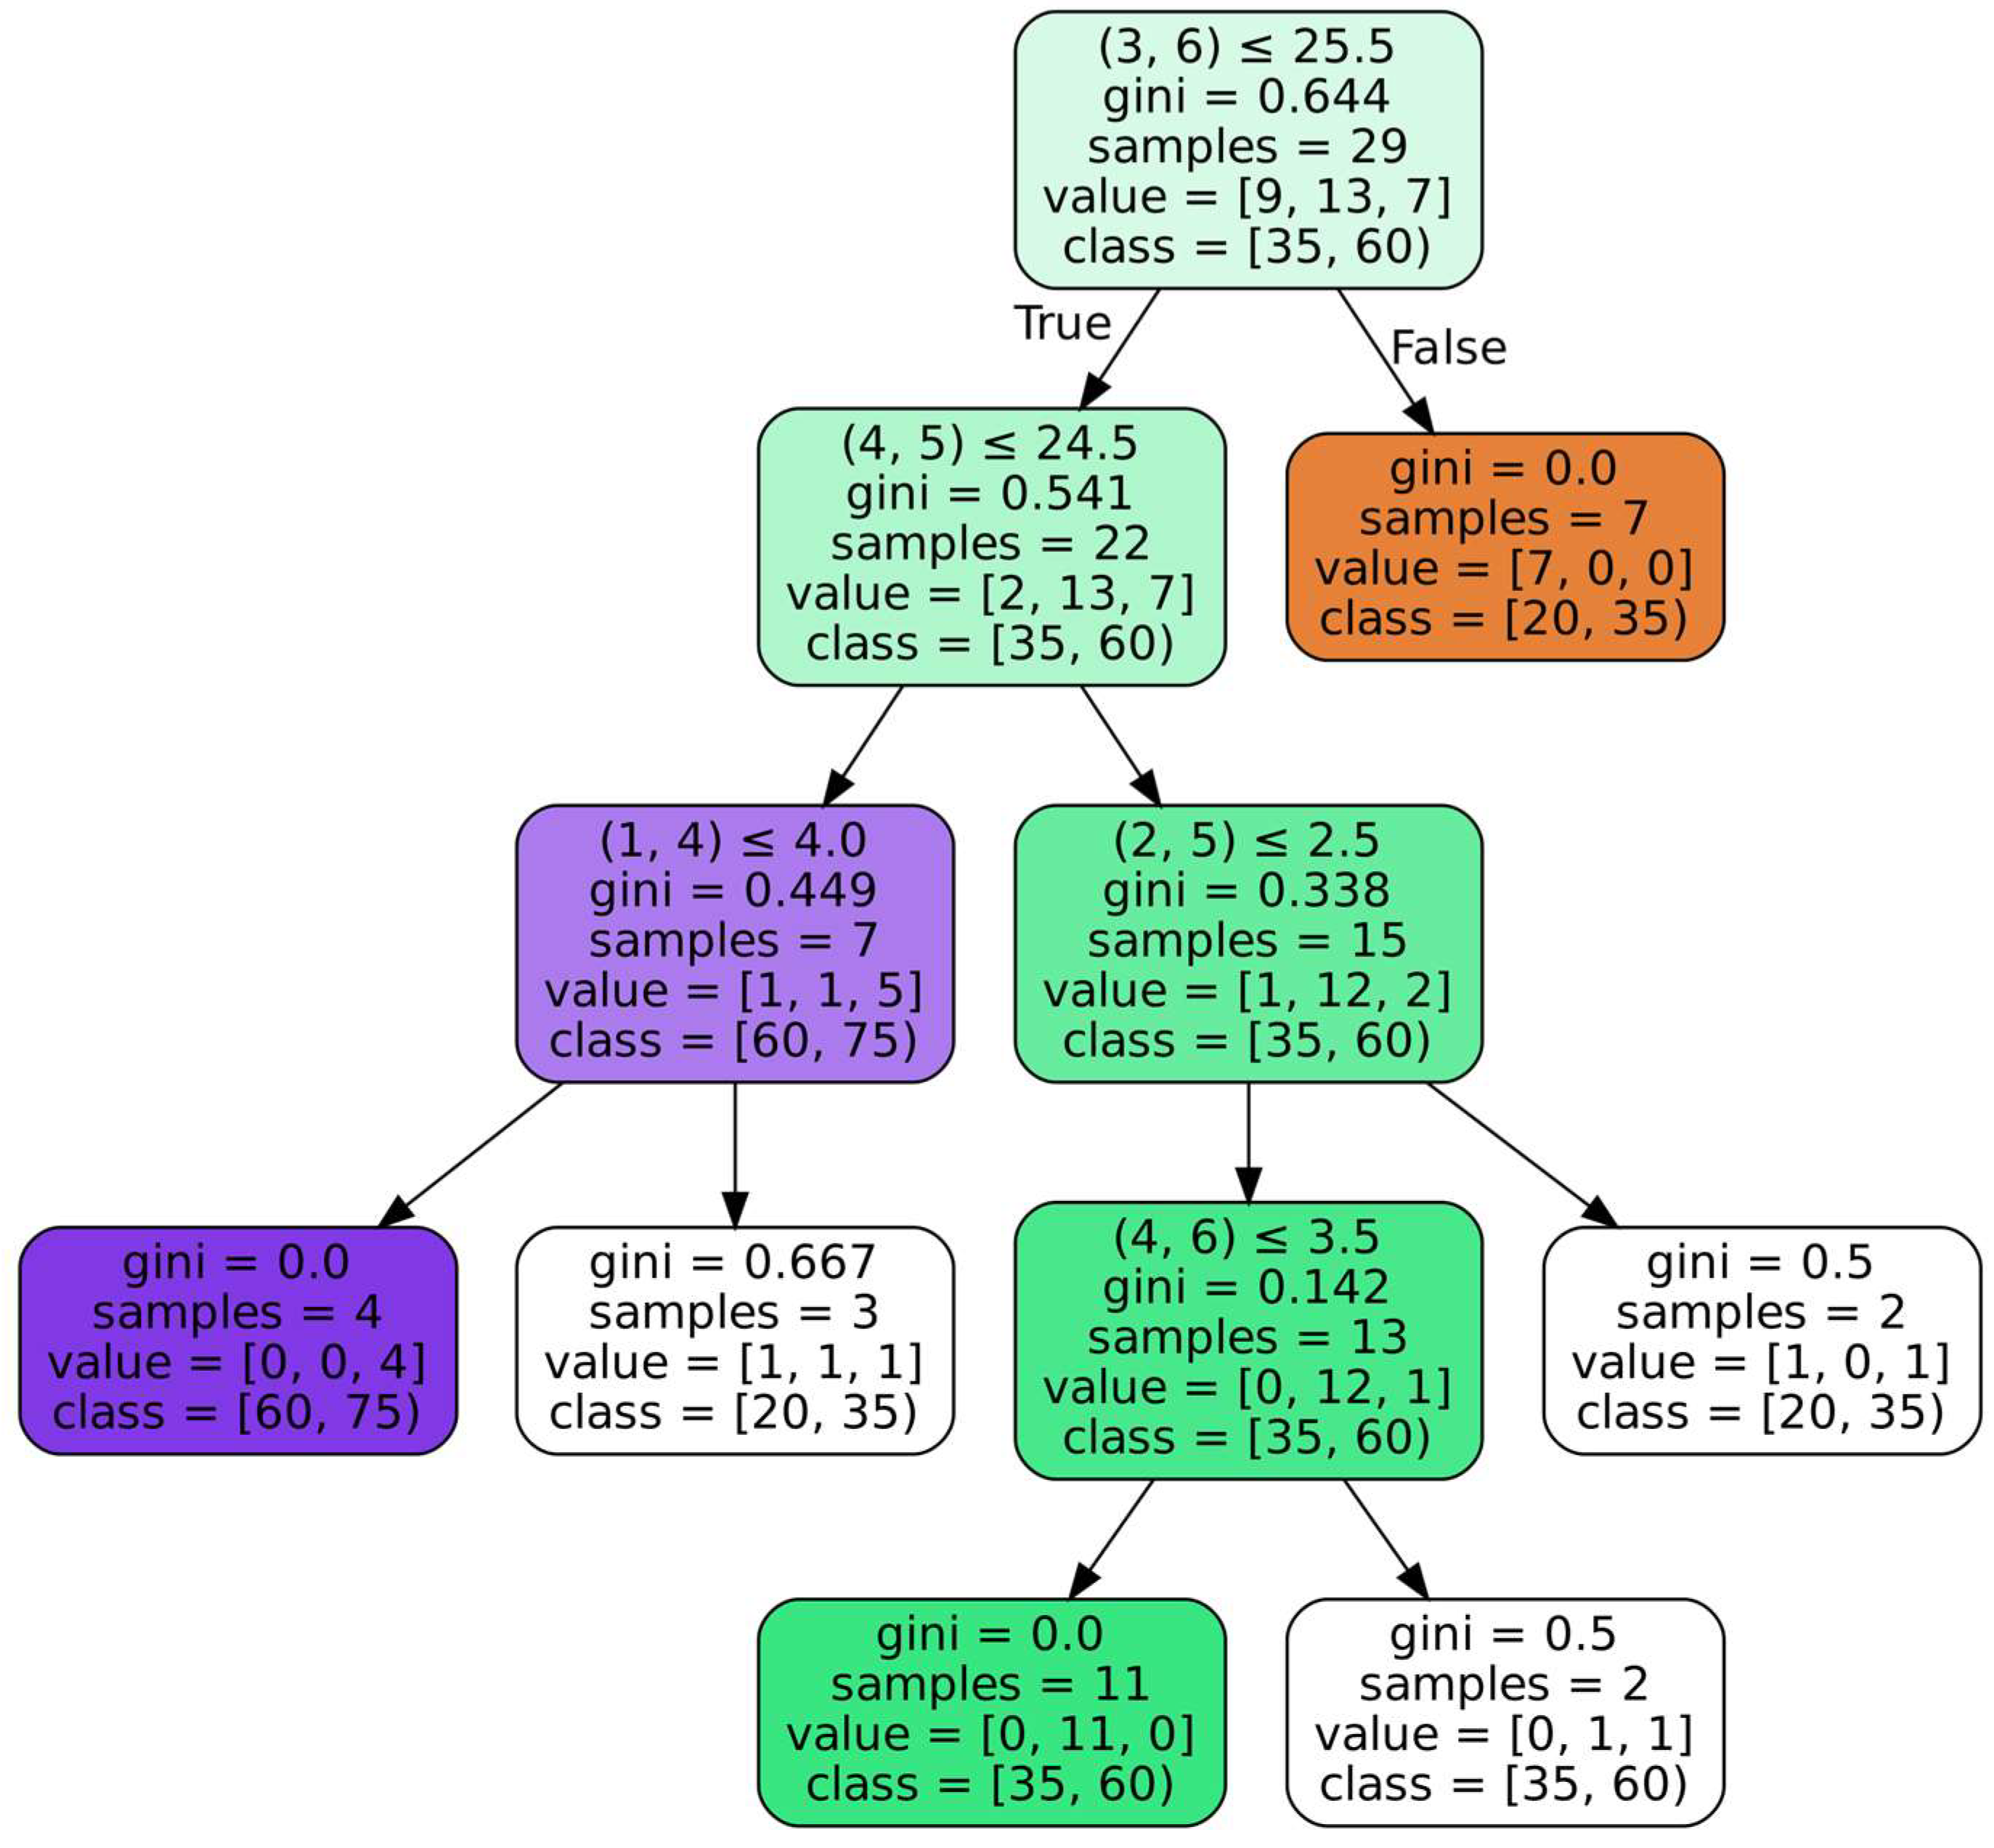
Figure 5 illustrates the decision tree that shows how profiles are associated with each age group. To improve the visualization in the paper, we limit the minimum samples on a leaf to 2, which makes the tree smaller. Young adults and middle-aged adults are grouped mostly into large and pure leaves, while older adults are more dispersed throughout the tree, which depicts more varied behavior. The first split corresponds to a type of cycle with an average duration of 3.5 min, low writing, and low physical activity and creates a leaf with most of the young adult users. The second greatest split is related to cycles with an average duration of 23 s, low physical activity, and very little writing.
In addition, this tree’s accuracy is tested using the leave-one-out cross-validation method, which consists of training the model with the data of every user except one and testing it with the remaining ones. After this cross-validation process, the model obtains average accuracy of 70%. The model mainly fails to classify a user within their age group, which is predictable. However, it works with a high level of accuracy in separating users of different age groups.
5. Discussion
After conducting the pilot study and analyzing the results, this work has demonstrated promising contributions as well as clear limitations. The contributions extracted from the results can be summarized as follows.
There exists a strong correlation between age and several monitored metrics.
A significant inverse correlation is found in the mobile’s time of use, the frequency of locking and unlocking the device, and the number of actions performed in each open app. Consequently, younger individuals exhibit more intensive use of the device. Additionally, younger people tend to use entertainment apps more frequently.
One of the most valuable findings is the strong inverse correlation in the use of the device while in motion. Generally, but particularly in applications such as WhatsApp and Chrome, the older the user, the fewer apps they use while moving. This finding is closely related to the dual-tasking test commonly used to diagnose cognitive decline.
Concerning the use of WhatsApp, there is a significant difference in the type of action performed depending on whether the user is in motion or stationary, as well as depending on their age. As individuals age, they use complex actions such as writing messages, viewing multimedia files, or sending images less frequently while walking. However, these actions do not correlate with age when the user is stationary; they perform these actions similarly and with a comparable frequency regardless of age.
Further analysis of the metrics related to messaging reveals that young adults write more than older users in both stationary and in-motion scenarios. There is a similar ratio between the number of deleted items and the number of typed items when the user is stationary. However, this correlation changes to the opposite direction when in motion, as older adults tend to correct more errors and write at a slower pace.
These findings provide valuable insights into the relationship between age and mobile device usage patterns, specifically in relation to cognitive decline and messaging behavior on WhatsApp. The work sheds light on the different ways in which age impacts mobile interactions and helps us to understand the potential implications of these findings.
However, it is essential to acknowledge the limitations of the study to guide future research and further explore this intriguing area of investigation. Comparisons between different users are always based on intrinsic differences in how people use their mobile devices, which makes it difficult to obtain statistically robust results. An important bias is that differences in use may be the result of generational differences, rather than normal cognitive decline. A typical example is the strong correlation between age and the deletion of characters when writing messages. Is this related to the fact that we make more mistakes as we get older or that the current generation of older adults is more concerned about writing correctly?
Another limiting aspect is the simple distinction between standing and moving activities. Based on existing studies showing the relationship between cognitive impairment and alterations in gait parameters [
16,
17], we are currently working on studying the interaction with mobile devices and specific gait parameters obtained through body tracking [
26].
Despite the limitations in the statistical results, both in terms of the population size and the nature of the correlations (which do not imply causation with age-related cognitive impairment), the identified differences can serve as valuable metrics for future studies on cognitive impairment. Specifically, these differences are particularly evident in actions such as writing, sending files, or engaging with multimedia content, especially while in motion. In fact, the data obtained from healthy adults can serve as a reliable baseline when studying cases of cognitive decline.
Moreover, the dataset itself contains a substantial amount of information, making it suitable for other studies aimed at characterizing interactions with mobile devices. An illustrative example of this is the second analysis explained in
Section 4.2 about user profiling. The profiling technique employed has proven to be useful and has some strengths. The first is that the profiles of each user can be easily compared between them, both visually and mathematically. They are also simple to understand because they are represented by counting the number of each type of cycle. This work also shows the possibility of using them for machine learning, which has shown good results and could be improved with more data and more powerful algorithms. Regarding the disadvantages, the main one is that they are expensive in terms of time and memory to compute, although some improvements in the pipeline could be made for implementation in production. The other major disadvantage is that these profiles can only be used to compare the usage between similar periods of time, although, with some modifications, the number of cycles could be converted into frequencies, avoiding this problem.
All these findings are related to the characterization, based on correlations and statistical inferences, of differences in mobile device use depending on age. This aspect is especially critical for the next steps of the M4S project, in which the present work is framed. Recognizing and understanding the differences produced by normal aging is critical in avoiding false positives when screening for cognitive deficits based on mobile device use.
6. Conclusions
The twofold research question that guided this experiment was “Are there significant differences in mobile-device use among groups of people of different ages, and are they more characteristic when the interaction takes place on the move?”. Two hypotheses were formulated on the basis of this question.
First, the aim was to check whether there are tasks performed on a smartphone that present different performance depending on the user’s age. Statistically, there is a strong correlation between age and lower mobile device usage, with older adults using financial apps to a greater extent and entertainment, communication, and shopping apps to a lesser extent.
The second hypothesis, regarding the characterization of usage taking into account differences while stationary and moving, showed that the difference in some communication tasks was particularly significant, with older adults characteristically performing significantly fewer actions on the move, such as opening conversations, viewing or sending multimedia items, or commenting on social network posts. In writing, older adults had a slower speed of writing and tended to correct more errors.
In addition to these findings, the article provides a user profiling model that is used to classify them based on their mobile phone usage and age. Currently, this model, although it has been proven to classify with some effectiveness, requires a larger dataset. In any case, it has been shown to be a powerful tool for the future goal of helping to screen for cognitive impairments.
Finally, an important contribution of this article is the dataset generated with more than 4.5 million interactions recorded for mobile phone use, from a total of 45 people. Considering only the data of people for whom a full, uninterrupted week was obtained, the dataset includes data from 29 users and more than 3.8 million records.
Future work will focus on intra-user and long-term studies in which changes in mobile device use can be observed in the same person. These would make it possible to study causality in terms of cognitive decline. The present work lays the foundations for such a future study, providing as contributions the validity of the tools and methods applied in the present work.
Author Contributions
Conceptualization, R.H. and L.C.; methodology, R.H. and L.C.; software, L.C. and A.B.; validation, L.V., T.M. and R.H.; formal analysis, L.C. and A.B.; investigation, R.H., L.C. and A.B.; resources, L.V. and T.M.; data curation, L.V. and A.B.; writing—original draft preparation, L.C. and R.H.; writing—review and editing, R.H., A.B. and L.C.; visualization, L.C. and A.B.; supervision, R.H. and T.M.; project administration, R.H.; funding acquisition, R.H. All authors have read and agreed to the published version of the manuscript.
Funding
This research was funded by the MINISTERIO DE CIENCIA, INNOVACIÓN Y UNIVERSIDADES, grant number RTI2018-098780-B-I00 (national research project); the SSITH project, under Proyectos Prueba de Concepto (PDC2022-133457-I00), and EQC2019-006053-P (WeCareLab), both funded by MINISTERIO DE CIENCIA, INNOVACIÓN; and the S1911001D predoctoral contract by JUNTA DE COMUNIDADES DE CASTILLA-LA MANCHA.
Institutional Review Board Statement
The authors assert that all procedures contributing to this work were accomplished in line with the ethical standards of the relevant national and institutional committees on human experimentation and with the Helsinki Declaration of 1975, as revised in 2008.
Informed Consent Statement
Informed consent was obtained from all subjects involved in the study.
Data Availability Statement
The dataset generated and analyzed for this study can be found in LINK WILL BE PROVIDED IN FINAL VERSION.
Acknowledgments
We would like to especially thank the people who helped us by participating in this experiment. Many thanks to Elena Díaz del Campo for the technical support in the development of BIPApp.
Conflicts of Interest
The authors declare no conflict of interest.
References
- Harari, G.M.; Lane, N.D.; Wang, R.; Crosier, B.S.; Campbell, A.T.; Gosling, S.D. Using Smartphones to Collect Behavioral Data in Psychological Science: Opportunities, Practical Considerations, and Challenges. Perspect. Psychol. Sci. 2016, 11, 838–854. [Google Scholar] [CrossRef] [PubMed]
- Lupton, D.; Jutel, A. “It’s like Having a Physician in Your Pocket!” A Critical Analysis of Self-Diagnosis Smartphone Apps. Soc. Sci. Med. 2015, 133, 128–135. [Google Scholar] [CrossRef]
- Klimova, B. Mobile Phone Apps in the Management and Assessment of Mild Cognitive Impairment and/or Mild-to-Moderate Dementia: An Opinion Article on Recent Findings. Front. Hum. Neurosci. 2017, 11, 461. [Google Scholar] [CrossRef] [PubMed]
- Bravo, J.; Hervás, R.; Fontecha, J.; González, I. m-Health: Lessons Learned by m-Experiences. Sensors 2018, 18, 1569. [Google Scholar] [CrossRef]
- Grundman, M.; Petersen, R.C.; Ferris, S.H.; Thomas, R.G.; Aisen, P.S.; Bennett, D.A.; Foster, N.L.; Jack, C.R.; Galasko, D.R.; Doody, R.; et al. Mild Cognitive Impairment Can Be Distinguished from Alzheimer Disease and Normal Aging for Clinical Trials. Arch. Neurol. 2004, 61, 59–66. [Google Scholar] [CrossRef]
- Gauthier, S.; Reisberg, B.; Zaudig, M.; Petersen, R.C.; Ritchie, K.; Broich, K.; Belleville, S.; Brodaty, H.; Bennett, D.; Chertkow, H.; et al. Mild Cognitive Impairment. Lancet 2006, 367, 1262–1270. [Google Scholar] [CrossRef]
- Ritchie, K. Mild Cognitive Impairment: An Epidemiological Perspective. Dialogues Clin. Neurosci. 2004, 6, 401–408. [Google Scholar] [CrossRef] [PubMed]
- Jeong, J. EEG Dynamics in Patients with Alzheimer’s Disease. Clin. Neurophysiol. 2004, 115, 1490–1505. [Google Scholar] [CrossRef] [PubMed]
- Cabañero, L.; Hervás, R.; González, I.; Fontecha, J.; Mondéjar, T.; Bravo, J. Characterisation of Mobile-Device Tasks by Their Associated Cognitive Load through EEG Data Processing. Future Gener. Comput. Syst. 2020, 113, 380–390. [Google Scholar] [CrossRef]
- Chen, Y.-X.; Liang, N.; Li, X.-L.; Yang, S.-H.; Wang, Y.-P.; Shi, N.-N. Diagnosis and Treatment for Mild Cognitive Impairment: A Systematic Review of Clinical Practice Guidelines and Consensus Statements. Front. Neurol. 2021, 12, 719849. [Google Scholar] [CrossRef]
- Schumacher, J.; Taylor, J.-P.; Hamilton, C.A.; Firbank, M.; Cromarty, R.A.; Donaghy, P.C.; Roberts, G.; Allan, L.; Lloyd, J.; Durcan, R.; et al. Quantitative EEG as a Biomarker in Mild Cognitive Impairment with Lewy Bodies. Alzheimer’s Res. Ther. 2020, 12, 82. [Google Scholar] [CrossRef] [PubMed]
- Hojjati, S.H.; Ebrahimzadeh, A.; Khazaee, A.; Babajani-Feremi, A. Predicting Conversion from MCI to AD Using Resting-State FMRI, Graph Theoretical Approach and SVM. J. Neurosci. Methods 2017, 282, 69–80. [Google Scholar] [CrossRef]
- Folstein, M.F.; Folstein, S.E.; McHugh, P.R. “Mini-Mental State”: A Practical Method for Grading the Cognitive State of Patients for the Clinician. J. Psychiatr. Res. 1975, 12, 189–198. [Google Scholar] [CrossRef] [PubMed]
- Nasreddine, Z.S.; Phillips, N.A.; Bédirian, V.; Charbonneau, S.; Whitehead, V.; Collin, I.; Cummings, J.L.; Chertkow, H. The Montreal Cognitive Assessment, MoCA: A Brief Screening Tool For Mild Cognitive Impairment. J. Am. Geriatr. Soc. 2005, 53, 695–699. [Google Scholar] [CrossRef] [PubMed]
- Franssen, E.H.; Somen, L.E.M.; Torossian, C.L.; Reisberg, B. Equilibrium and Limb Coordination in Mild Cognitive Impairment and Mild Alzheimer’s Disease. J. Am. Geriatr. Soc. 1999, 47, 463–469. [Google Scholar] [CrossRef]
- Ansai, J.H.; de Andrade, L.P.; Rossi, P.G.; Almeida, M.L.; Carvalho Vale, F.A.; Rebelatto, J.R. Association Between Gait and Dual Task With Cognitive Domains in Older People With Cognitive Impairment. J. Mot. Behav. 2018, 50, 409–415. [Google Scholar] [CrossRef]
- Bragatto, V.S.R.; de Andrade, L.P.; Rossi, P.G.; Ansai, J.H. Dual-Task during Gait between Elderly with Mild Cognitive Impairment and Alzheimer: Systematic Review. Fisioter. Mov. 2017, 30, 849–857. [Google Scholar] [CrossRef]
- Burgess, P.W. Strategy Application Disorder: The Role of the Frontal Lobes in Human Multitasking. Psychol. Res. Psychol. Forsch. 2000, 63, 279–288. [Google Scholar] [CrossRef]
- Cipresso, P.; Serino, S.; Villani, D.; Repetto, C.; Sellitti, L.; Albani, G.; Mauro, A.; Gaggioli, A.; Riva, G. Is Your Phone so Smart to Affect Your State? An Exploratory Study Based on Psychophysiological Measures. Neurocomputing 2012, 84, 23–30. [Google Scholar] [CrossRef]
- Tack, C.J.; Lancee, G.J.; Heeren, B.; Engelen, L.J.; Hendriks, S.; Zimmerman, L.; De Massari, D.; van Gelder, M.M.; van de Belt, T.H. Glucose Control, Disease Burden, and Educational Gaps in People With Type 1 Diabetes: Exploratory Study of an Integrated Mobile Diabetes App. JMIR Diabetes 2018, 3, e17. [Google Scholar] [CrossRef]
- Bravo, J.; Villarreal, V.; Hervás, R.; Urzaiz, G. Using a communication model to collect measurement data through mobile devices. Sensors 2012, 12, 9253–9272. [Google Scholar] [CrossRef] [PubMed]
- Bravo, J.; Hervas, R.; Fuentes, C.; Chavira, G.; Nava, S.W. Tagging for nursing care. In Proceedings of the Second International Conference on Pervasive Computing Technologies for Healthcare, Tampere, Finland, 30 January–1 February 2008; pp. 305–307. [Google Scholar] [CrossRef]
- Kim, J.; Lim, S.; Min, Y.H.; Shin, Y.-W.; Lee, B.; Sohn, G.; Jung, K.H.; Lee, J.-H.; Son, B.H.; Ahn, S.H.; et al. Depression Screening Using Daily Mental-Health Ratings from a Smartphone Application for Breast Cancer Patients. J. Med. Internet Res. 2016, 18, e216. [Google Scholar] [CrossRef] [PubMed]
- Lan, K.-C.; Shih, W.-Y. Early Diagnosis of Parkinson’s Disease Using a Smartphone. Procedia Comput. Sci. 2014, 34, 305–312. [Google Scholar] [CrossRef]
- Devos, P.; Debeer, J.; Ophals, J.; Petrovic, M. Cognitive Impairment Screening Using M-Health: An Android Implementation of the Mini-Mental State Examination (MMSE) Using Speech Recognition. Eur. Geriatr. Med. 2019, 10, 501–509. [Google Scholar] [CrossRef]
- Carneros-Prado, D.; Dobrescu, C.C.; González, I.; Fontecha, J.; Johnson, E.; Hervás, R. Analysis of Dual-Tasking Effect on Gait Variability While Interacting with Mobile Devices. Mathematics 2023, 11, 202. [Google Scholar] [CrossRef]
- Pearson, K. Contributions to the Mathematical Theory of Evolution. III. Regression, Heredity, and Panmixia. Proc. R. Soc. Lond. 1895, 59, 69–71. [Google Scholar]
- Hernández-Lalinde, J.; Espinosa-Castro, J.-F.; Peñaloza Tarazona, M.; Rodríguez, J.; Chacón, J.; Carrillo Sierra, S.; Pirela, V.; Toloza, C. Sobre El Uso Adecuado Del Coeficiente de Correlación de Pearson: Definición, Propiedades y Suposiciones. Arch. Venez. De Farmacol. Y Ter. 2018, 37, 587–595. [Google Scholar]
- Jung, C.G. Collected Works of C.G. Jung, Volume 8: Structure & Dynamics of the Psyche; Princeton University Press: Princeton, NJ, USA, 1970; ISBN 978-1-4008-5095-2. [Google Scholar]
- Kohonen, T. Self-Organized Formation of Topologically Correct Feature Maps. Biol. Cybern. 1982, 43, 59–69. [Google Scholar] [CrossRef]
- Breiman, L.; Friedman, J.H.; Olshen, R.A.; Stone, C.J. Classification and Regression Trees; Routledge: New York, NY, USA, 1984; ISBN 978-1-315-13947-0. [Google Scholar]
- Pedregosa, F.; Varoquaux, G.; Gramfort, A.; Michel, V.; Thirion, B.; Grisel, O.; Blondel, M.; Prettenhofer, P.; Weiss, R.; Dubourg, V.; et al. Scikit-Learn: Machine Learning in Python. J. Mach. Learn. Res. 2011, 12, 2825–2830. [Google Scholar]
| Disclaimer/Publisher’s Note: The statements, opinions and data contained in all publications are solely those of the individual author(s) and contributor(s) and not of MDPI and/or the editor(s). MDPI and/or the editor(s) disclaim responsibility for any injury to people or property resulting from any ideas, methods, instructions or products referred to in the content. |
© 2023 by the authors. Licensee MDPI, Basel, Switzerland. This article is an open access article distributed under the terms and conditions of the Creative Commons Attribution (CC BY) license (https://creativecommons.org/licenses/by/4.0/).


