1. Introduction
The Russian economy has been expanding exports to Asia–Pacific countries in recent years. As a consequence, the volume of rail traffic to the ports of the Russian Far East has continued to grow. By the end of 2017, the rail transportation volume exceeded 180 Mt and persisted rising [
1]. For the avoidance of deficient transportation, high investments are made in the infrastructure of the Baikal–Amur Mainline. One of the vulnerable spots in the planned setup toward the enhancement of the rail transportation capacity is the length of the rail tunnels. The Baikal–Amur Mainline has three tunnels longer than 3 km: the Kuznetsovsky Tunnel (3890 m), the Baikal Tunnel (6686 m) and the Severomuysky Tunnel (15,343 m). The most troublesome operating period of the tunnels is winter. In this period, owing to extremely low air temperatures, water permeates through the tunnel lining turns into ice mount, which endangers the movement of trains. The available ventilation installations at the tunnel faces fail to prevent ice coating on the lining because of two reasons. First, the absorption of heat in tunnels is an intermittent process. A cold train, when running in a tunnel, actively assimilates thermal energy from the tunnel air and spends this energy for self-heating. For instance, the heat-absorption rate of a freight train passing the Severomuysky Tunnel is 10–12 MW at the air temperature of −38–−44 °C [
2]. Second, the heat generated by the heat-and-fan units installed at the tunnel faces is used inefficiently. Air has an excessively high temperature at the tunnel faces, while its temperature in the middle of the tunnel is insufficient to prevent ice coating [
3]. Efficiently providing warm air along a tunnel requires combining the heat-and-fan units, the tunnel ventilation network and the piston effect. In order to achieve this, it is necessary to understand the dynamics of air distribution in the tunnel during train movements. A study of the piston effect in the long tunnels of the Baikal–Amur Mainline has been carried out in this study.
The research on the piston effect of moving trains and vehicles in tunnels [
4,
5,
6,
7,
8,
9,
10,
11,
12] was mostly studied in tunnels up to 1000 m long with vehicles and trains not exceeding 150–200 m in length. Throughout this article, we discuss freight trains that are 1200–1500 m long. It takes a long time for a train to pass an extended tunnel; for instance, travel through the Severomuysky Tunnel takes 25 min at the velocity of 40 km/h. Passage through the inlet and outlet portals of the tunnel takes 90.1 s. An excess of air pressure at the front face of the loco initiates air flow in the tunnel and in-between the train and the tunnel walls. After the whole train is inside the tunnel, air flow is additionally influenced by the rarefaction at the back face of the tail car. As the train continues moving, the air drag between the front face of the locomotive and the outlet tunnel portal decreases while the resistance to air flow between the tail car and inlet portal increases. Then, the locomotive exits the tunnel, and the high pressure at its front face has no longer influences the air flow in the tunnel. After the whole train leaves the tunnel, air flows remain there for some time because of the momentum. It is obvious that the air distribution in extra-long railway tunnels has complex dynamics. It takes into account the airflow around the moving train and influences the dynamics of heat-absorption in the tunnel. The mechanisms of these processes are necessary to develop efficient ventilation and heating circuits in tunnels. Thus, it is of current concern to analyze air distribution under the piston effect in extra-long traffic tunnels.
Krasyuk and Lugin [
13] proposed a modeling method for air distribution caused by the piston effect in subway tunnels. The method was trialed, and the calculated results agreed well with the in-situ measurements of the air flow rates in the subways of Novosibirsk and Yekaterinburg. Using this method in the network models of static air distribution makes it possible to take into account the piston effect dynamics, i.e., to apply the so-called quasi-dynamic calculation.
The aim of this study is to develop a quasi-dynamic mathematical model of air distribution caused by the piston effect in railway tunnels that can be used in network models.
2. Description
The key elements in a network mathematical model of air distribution in a railway tunnel are: the topology of the tunnel [
14,
15,
16], portals, the geometry and aerodynamic parameters of the tunnel, adit, ventilation shafts, crossings and other elements of the tunnel ventilation. Natural draft is modeled using fictitious pressure sources. The piston effect is taken into account in the model, including the fictitious pressure sources, to describe pressure changes ahead of and behind the train, resistance in the clearance space between the tunnel walls and the train, as well as dissipation resistance in front of the train. The dissipation resistance [
13,
17] is used to model a reduction (deceleration) of the air flow rate in front of the train. Owing to this, it is possible to solve the problems concerning air distribution under the piston effect in tunnels with simple models of static air distribution.
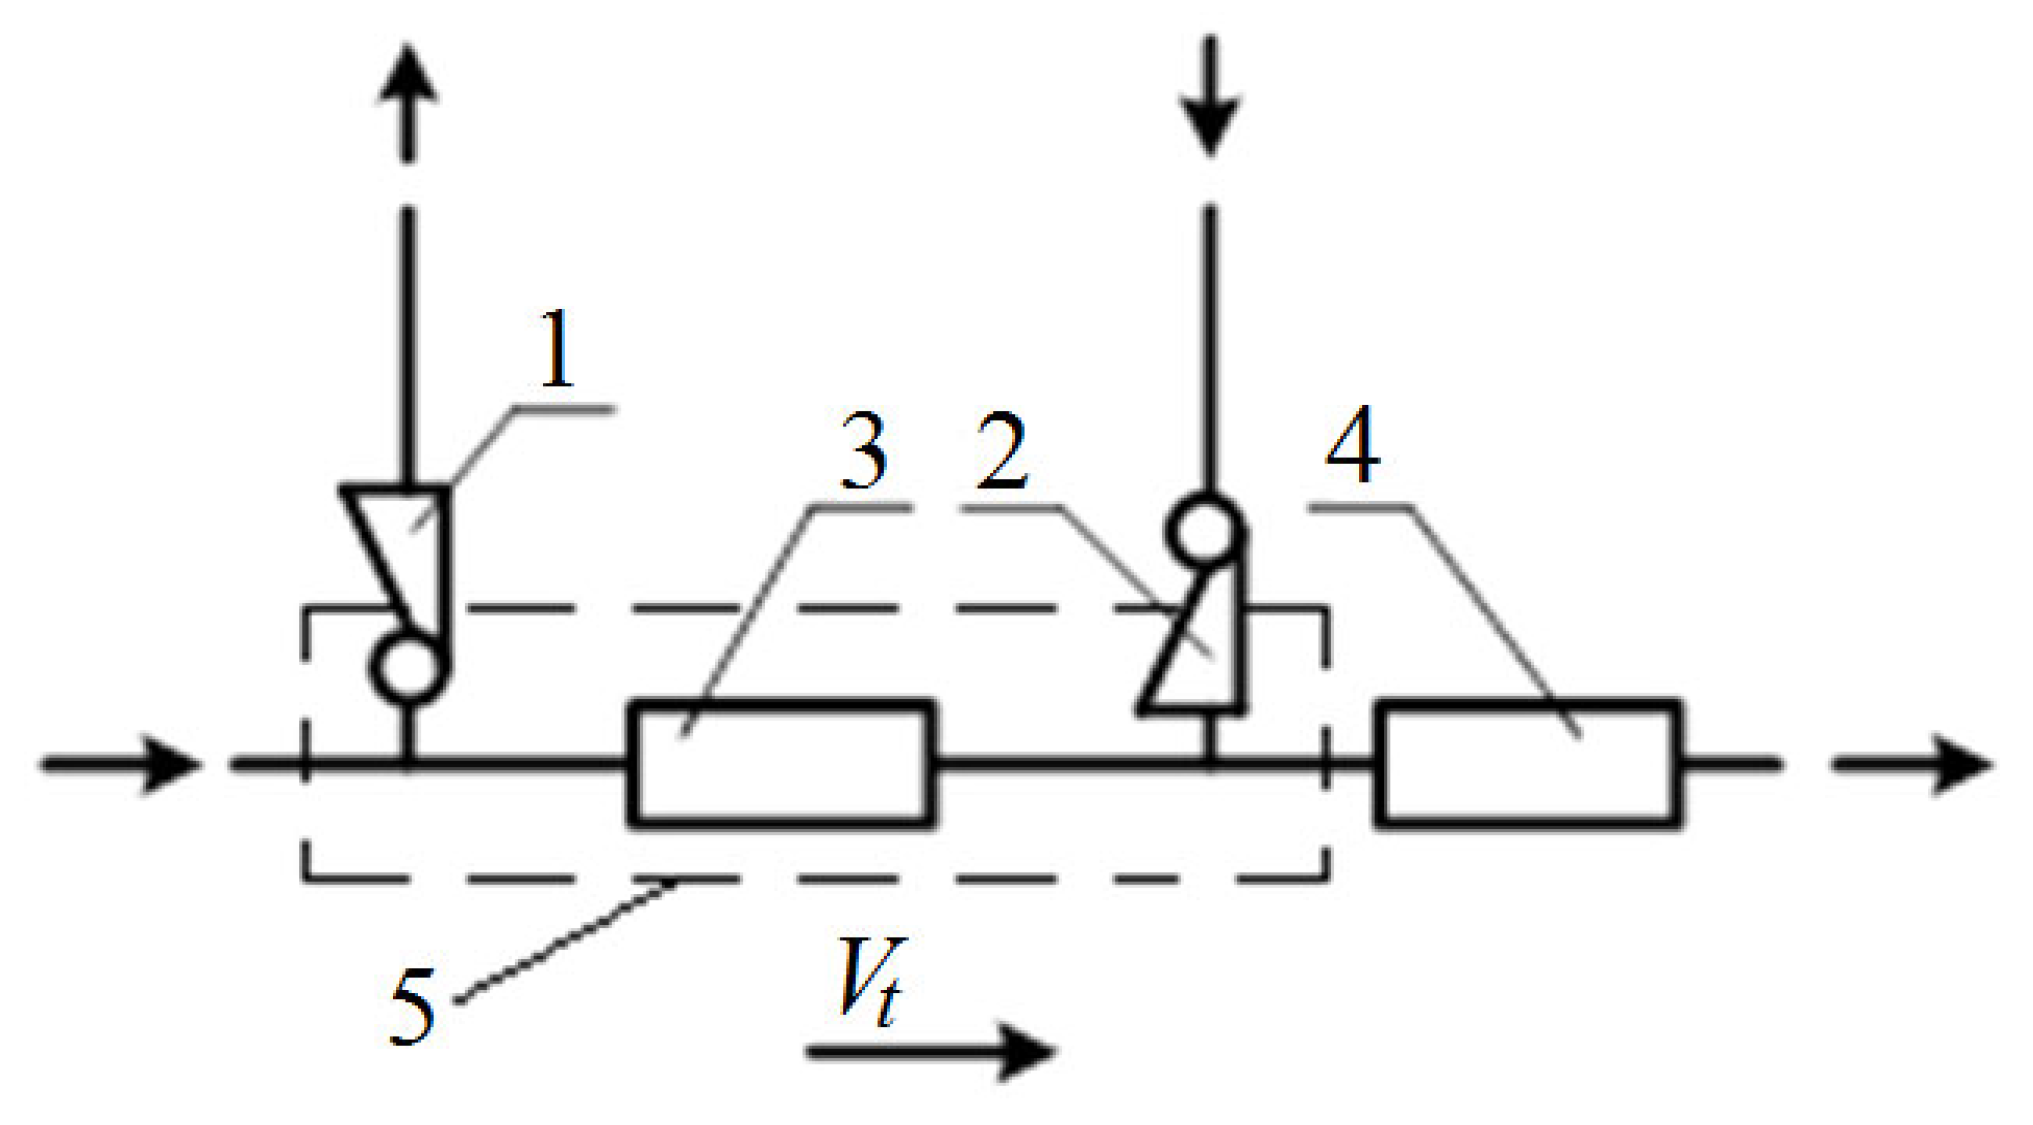
The piston effect in cases of static air distribution is modeled using the method of Krasyuk and Lugin [
13]. Different pressures ahead of and behind the train are represented by two fictitious pressure sources—constant pressure fans (
Figure 1). This allows for the adequate description of air pressure at the front face of the loco by fan 2 and the rarefaction behind the back face of the train by fan 1. There is also draught loss 3 matching air resistance in the tunnel clearance, and diffusion resistance 4.
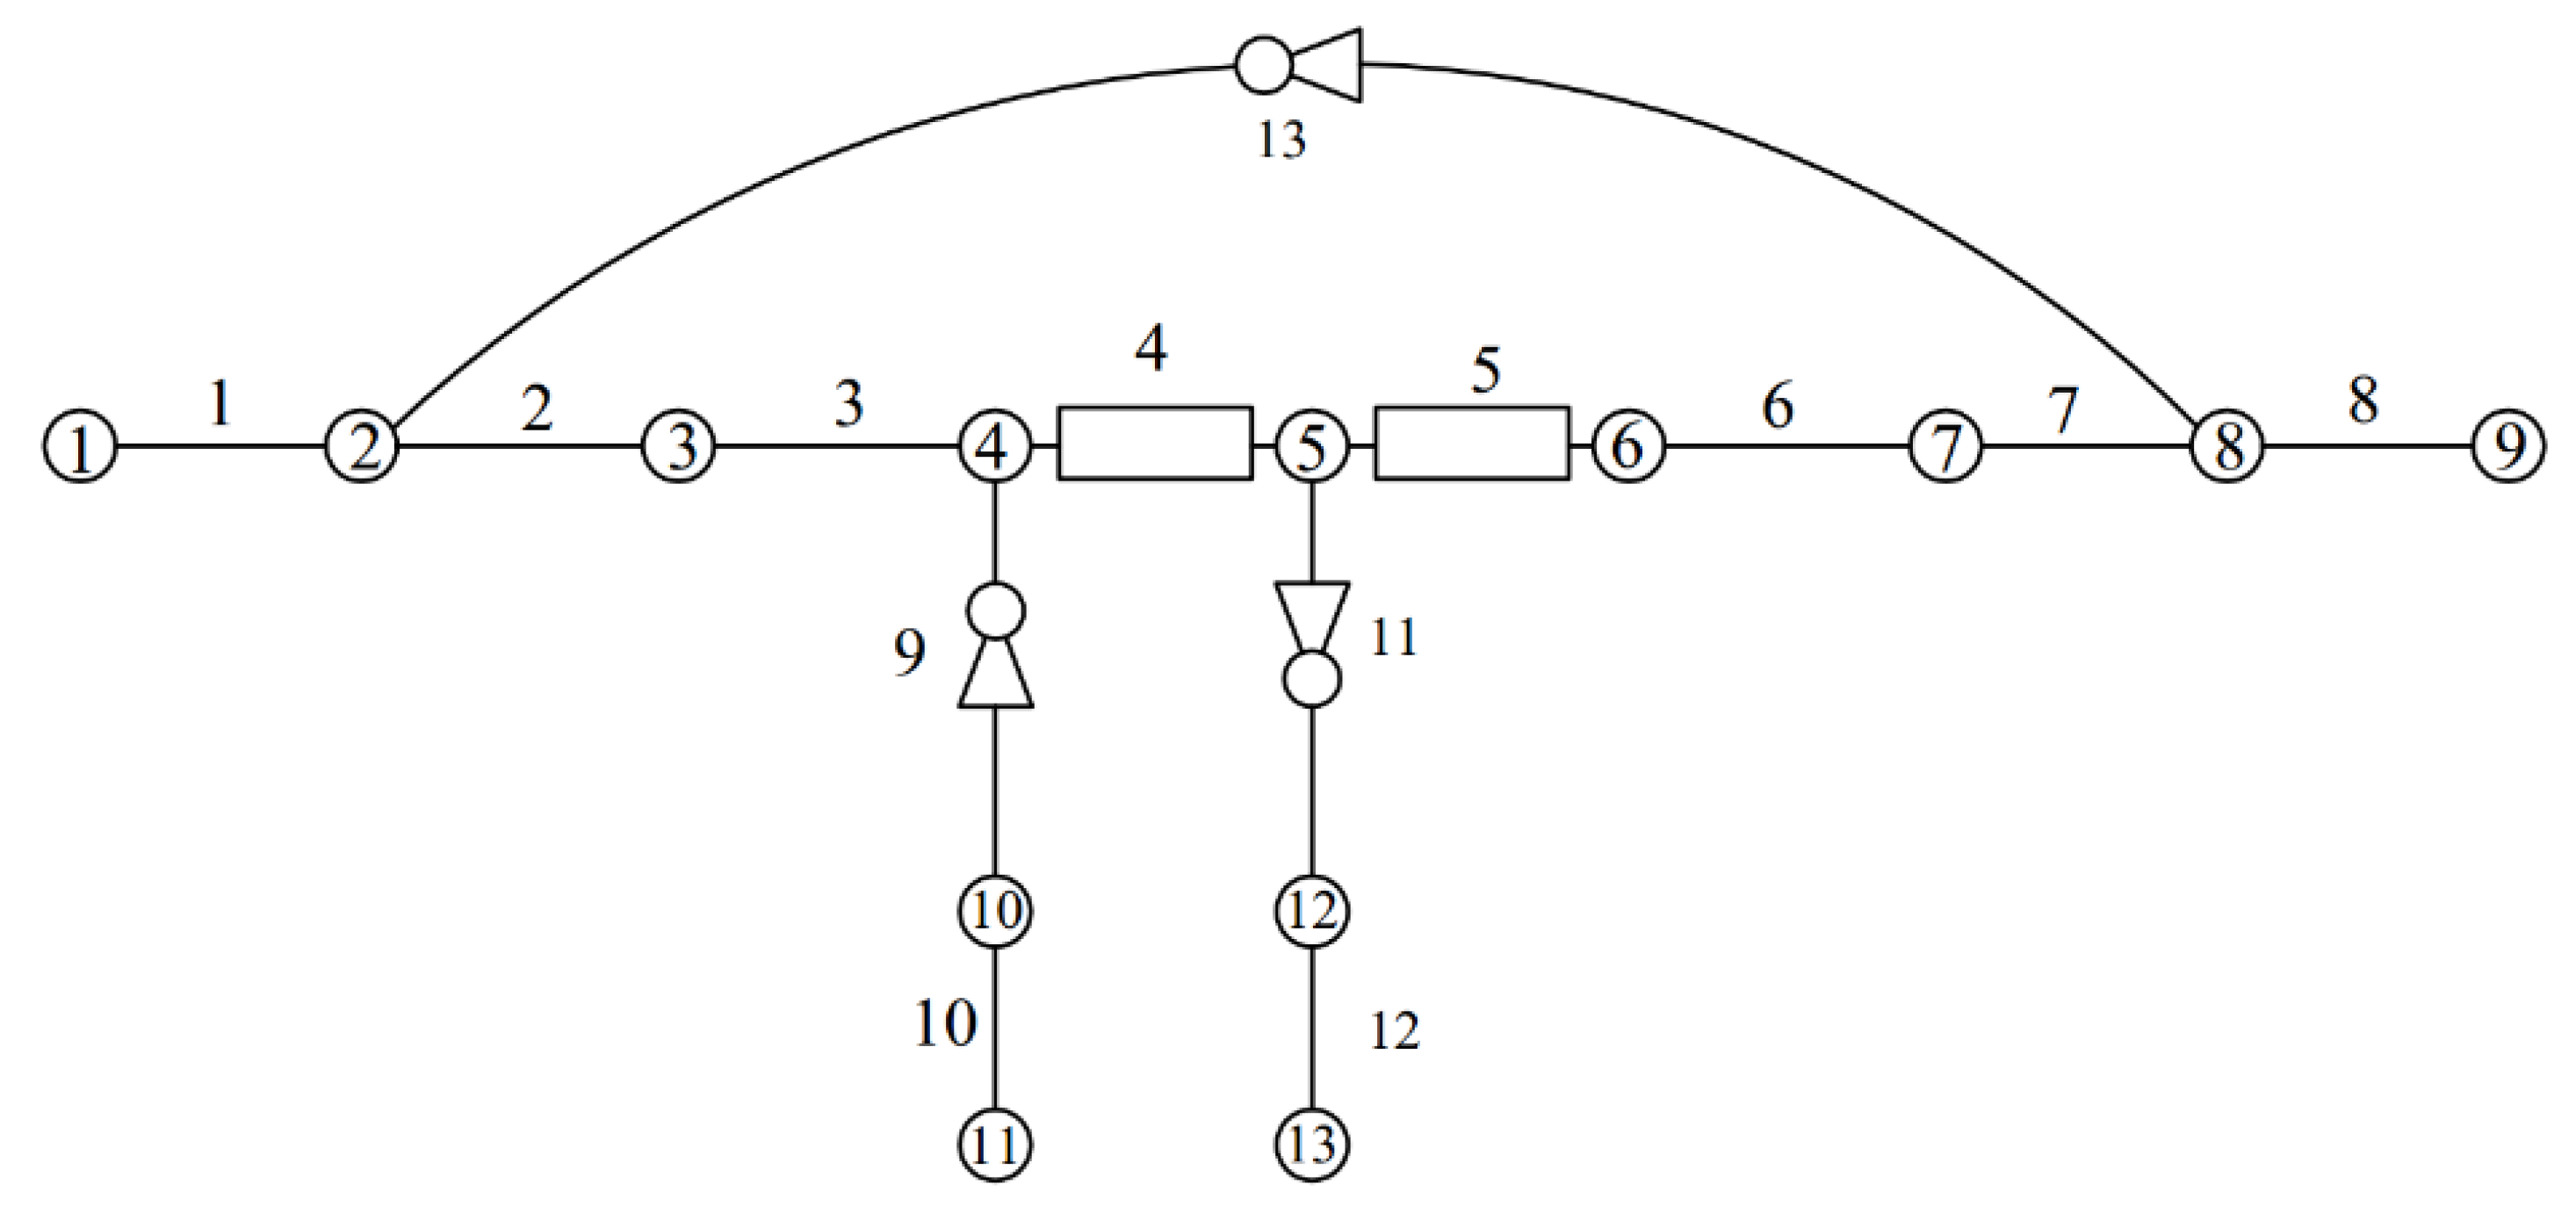
Figure 2 demonstrates the analytic model of integrating the piston effect model in the network model of the tunnel ventilation system.
The natural draught (ND)—fan 13 in
Figure 2—is modeled using the method with fictitious pressure sources [
18]. Based on the height differences Δ
h of the portals and the temperature of the atmosphere, the pressures of the fictitious sources of ND are calculated using the basic law of hydrostatics. The weather conditions are assumed as per the areas of the extra-long Baikal–Amur Mainline tunnels: Severomuysky Tunnel—settlement Bagdarin (Buryatia); Kuznetsovsky Tunnel—settlement Ayan (Khabarovsk Territory); Baikal Tunnel—town Kirensk (Irkutsk Region) [
19]. For cold and warm seasons (CS and WS), the monthly mean temperatures of the coldest month (January) and hottest month (July) are assumed, respectively. The pressures of the fictitious sources of ND are compiled in
Table 1.
The modeling of air flow governed by ND in a tunnel 6 km long, with a freight train 1000 m long inside it, shows that the air flow rate induced by the maximum ND of 354 Pa is not higher than 12.8 m3/s. It will be shown below that this value is approximately 10% of the air flow rate generated by the piston effect. On average, the ND-induced air flow rate is not higher than 4% of the air flow rate caused by the piston effect. For this reason, the effect of ND on the air exchange in the tunnel is insignificant and negligible.
For subway tunnels and railway tunnels, the parameters of the aerodynamic elements used in the piston effect models differ considerably. One such design variable is the ratio of tunnel and train car section areas. In subway tunnels, a car passes over half of the tunnel area, whereas in railway tunnels on the Baikal–Amur Mainline, this overlap is only 18%. The second variable is the freight train length, which is 10 times longer than in subways. Meanwhile, these differences have an essential influence on the draught loss in the tunnel clearance. Moreover, the value of the diffusion resistance under such parameters of railway tunnels is unknown. A computation experiment with ANSYS is implemented to determine the piston effect model parameters for the railway tunnel. The input data are determined from the analysis of statistics on the existing extra-long tunnels. The average train velocity in the Baikal–Amur Mainline tunnels is 37–41.6 km/h [
1,
20,
21]. The freight tonnage should not exceed 75 cars (on average 57 cars without regard to locomotive), an empty train should be 105 cars and a passenger train should be 24 cars. Cars for freight and passengers will have a length of 16.7 and 23.6 m, respectively. Similarly, the section area of the model tunnel was taken from BAM tunnels with similar structures, lengths and loads (Baikal, Kuznetsovsky, etc.). Based on these data, air distribution is modeled for tunnels 3000 and 6000 m long, with a hydraulic radius. To solve the plane axially symmetric problem, real dimensions have been converted into equivalent values. The atmospheric pressure is assumed to be 101,325 Pa, and the ambient air temperature is 25 °C. At the boundaries of the computational domain, unbounded with solid surfaces, the atmospheric pressure is accepted. The air velocity at the initial time is zero. Such a formulation of the problem sufficiently and adequately describes the geometry and physical processes in a tunnel with a moving train. At the same time, the finite-element mesh and the computation time are essentially reduced.
3. Modeling
The problems are solved in the nonstationary formulation, with a dynamically restructured network in the ANSYS Fluent 14.5 environment, using resources of the Siberian Supercomputer Sharing Center of the Siberian Branch of the Russian Academy of Sciences, on the G6-cluster in the multisequence mode (48 cores).
The k-epsilon Realizable turbulence model, near-wall treatment non-equilibrium and PISO algorithm recommended for unsteady flows were used in the simulation. To simulate the movement of the train, the dynamic mesh layering method was used with interfaces between the movable and stationary parts. The shape of the grid elements is mainly quadrangular; in the areas of the movable grid on the boundary of the calculated area, the cells have the shape of regular quadrangles. The dimensions of the elements of the calculated grid are accepted with the condition that the dimensionless parameter y+, which characterizes the quality of the grid for modeling the wall layer on the wall of the train and tunnel, does not exceed 100. This corresponds to the recommendations for the accepted turbulence model. The material is air with the properties of an ideal gas, taking into account the compressibility.
For the 3 km long tunnel, the total physical time in the model was 442 s at a time step of 0.0002 s. In the calculation, 9822 saves were made every 225 time steps (which totaled 0.045 s). One save containing the current state of the dynamic network and the calculated results had a volume of 65 Mbytes. The total number of time steps was 2,209,950. The finite element mesh contained 291,947 cells and 635,038 points.
For the 6 km long tunnel, the total physical time in the model was 703 s at a time step of 0.0002 s. During the calculation, 6390 saves were made every 550 time steps (in 0.11 s). The volume of a single save containing the current state of the dynamic network and the calculated results was 89 Mbytes. The total time steps were 3,515,000 in number. The finite element mesh contained 454,975 cells and 990,888 points.
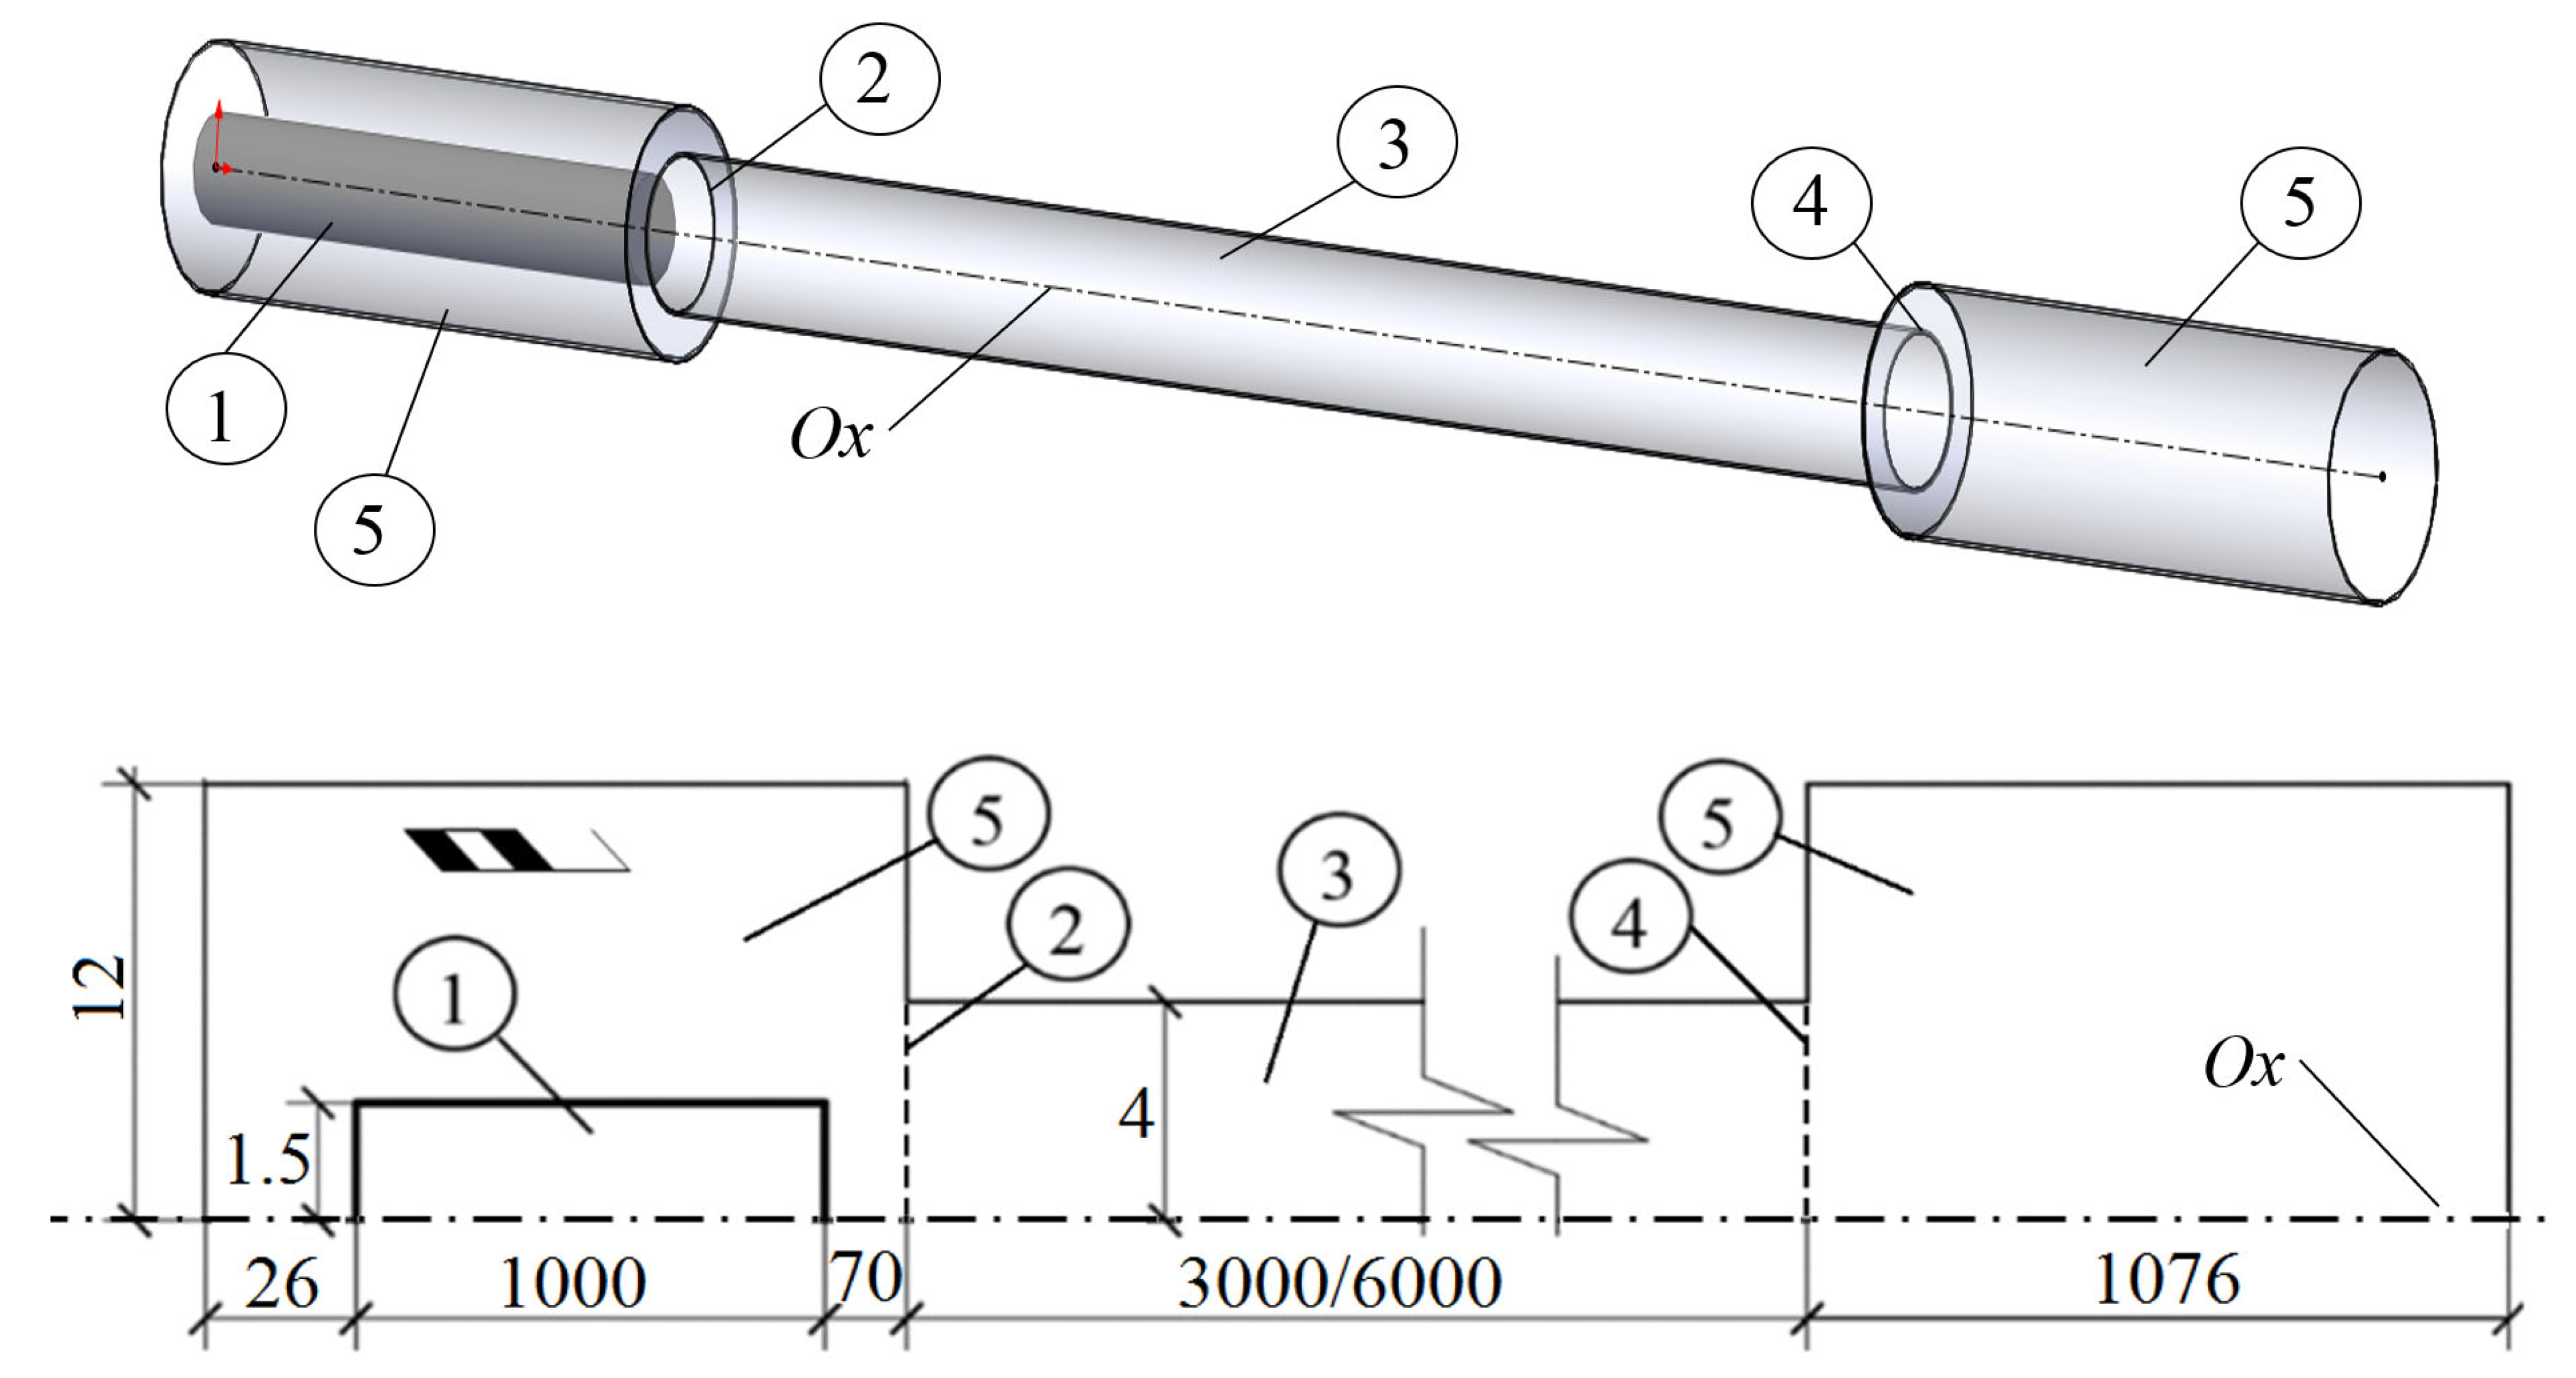
Figure 3 demonstrates the geometry of the plane axially symmetric calculation model of a tunnel with a train. The total length of the model domain is 5152 and 8152 for the 3000 and 6000 m long tunnels, respectively. At the initial time, the train 1000 m in length is immobile at a distance of 70 m from the entry to the tunnel portal.
The modeling assumes the mode of train motion as follows:
- (1)
the train uniformly accelerates in an open space section, 50 long, from 0 to 11.1 m/s (40 km/h);
- (2)
the train skirts the remaining 20 m to the tunnel entrance at the above-specified velocity, enters the tunnel, moves in it and leaves the tunnel within 364 s for a 3 km tunnel, and within 625 s for a 6 km tunnel;
- (3)
at the moment when the distance from the exit portal to the end of the last car of the train is 20 m, the train begins uniformly decelerating in a span of 50 m from 11.1 to 0 m/s;
- (4)
having stopped, the train stands for 60 s in the open space outward of the tunnel.
The estimated skin friction drag per 1 km in the tunnel is 0.000347 kµ (1 kµ » 9.81 N·s2·m−8).
Figure 4 and
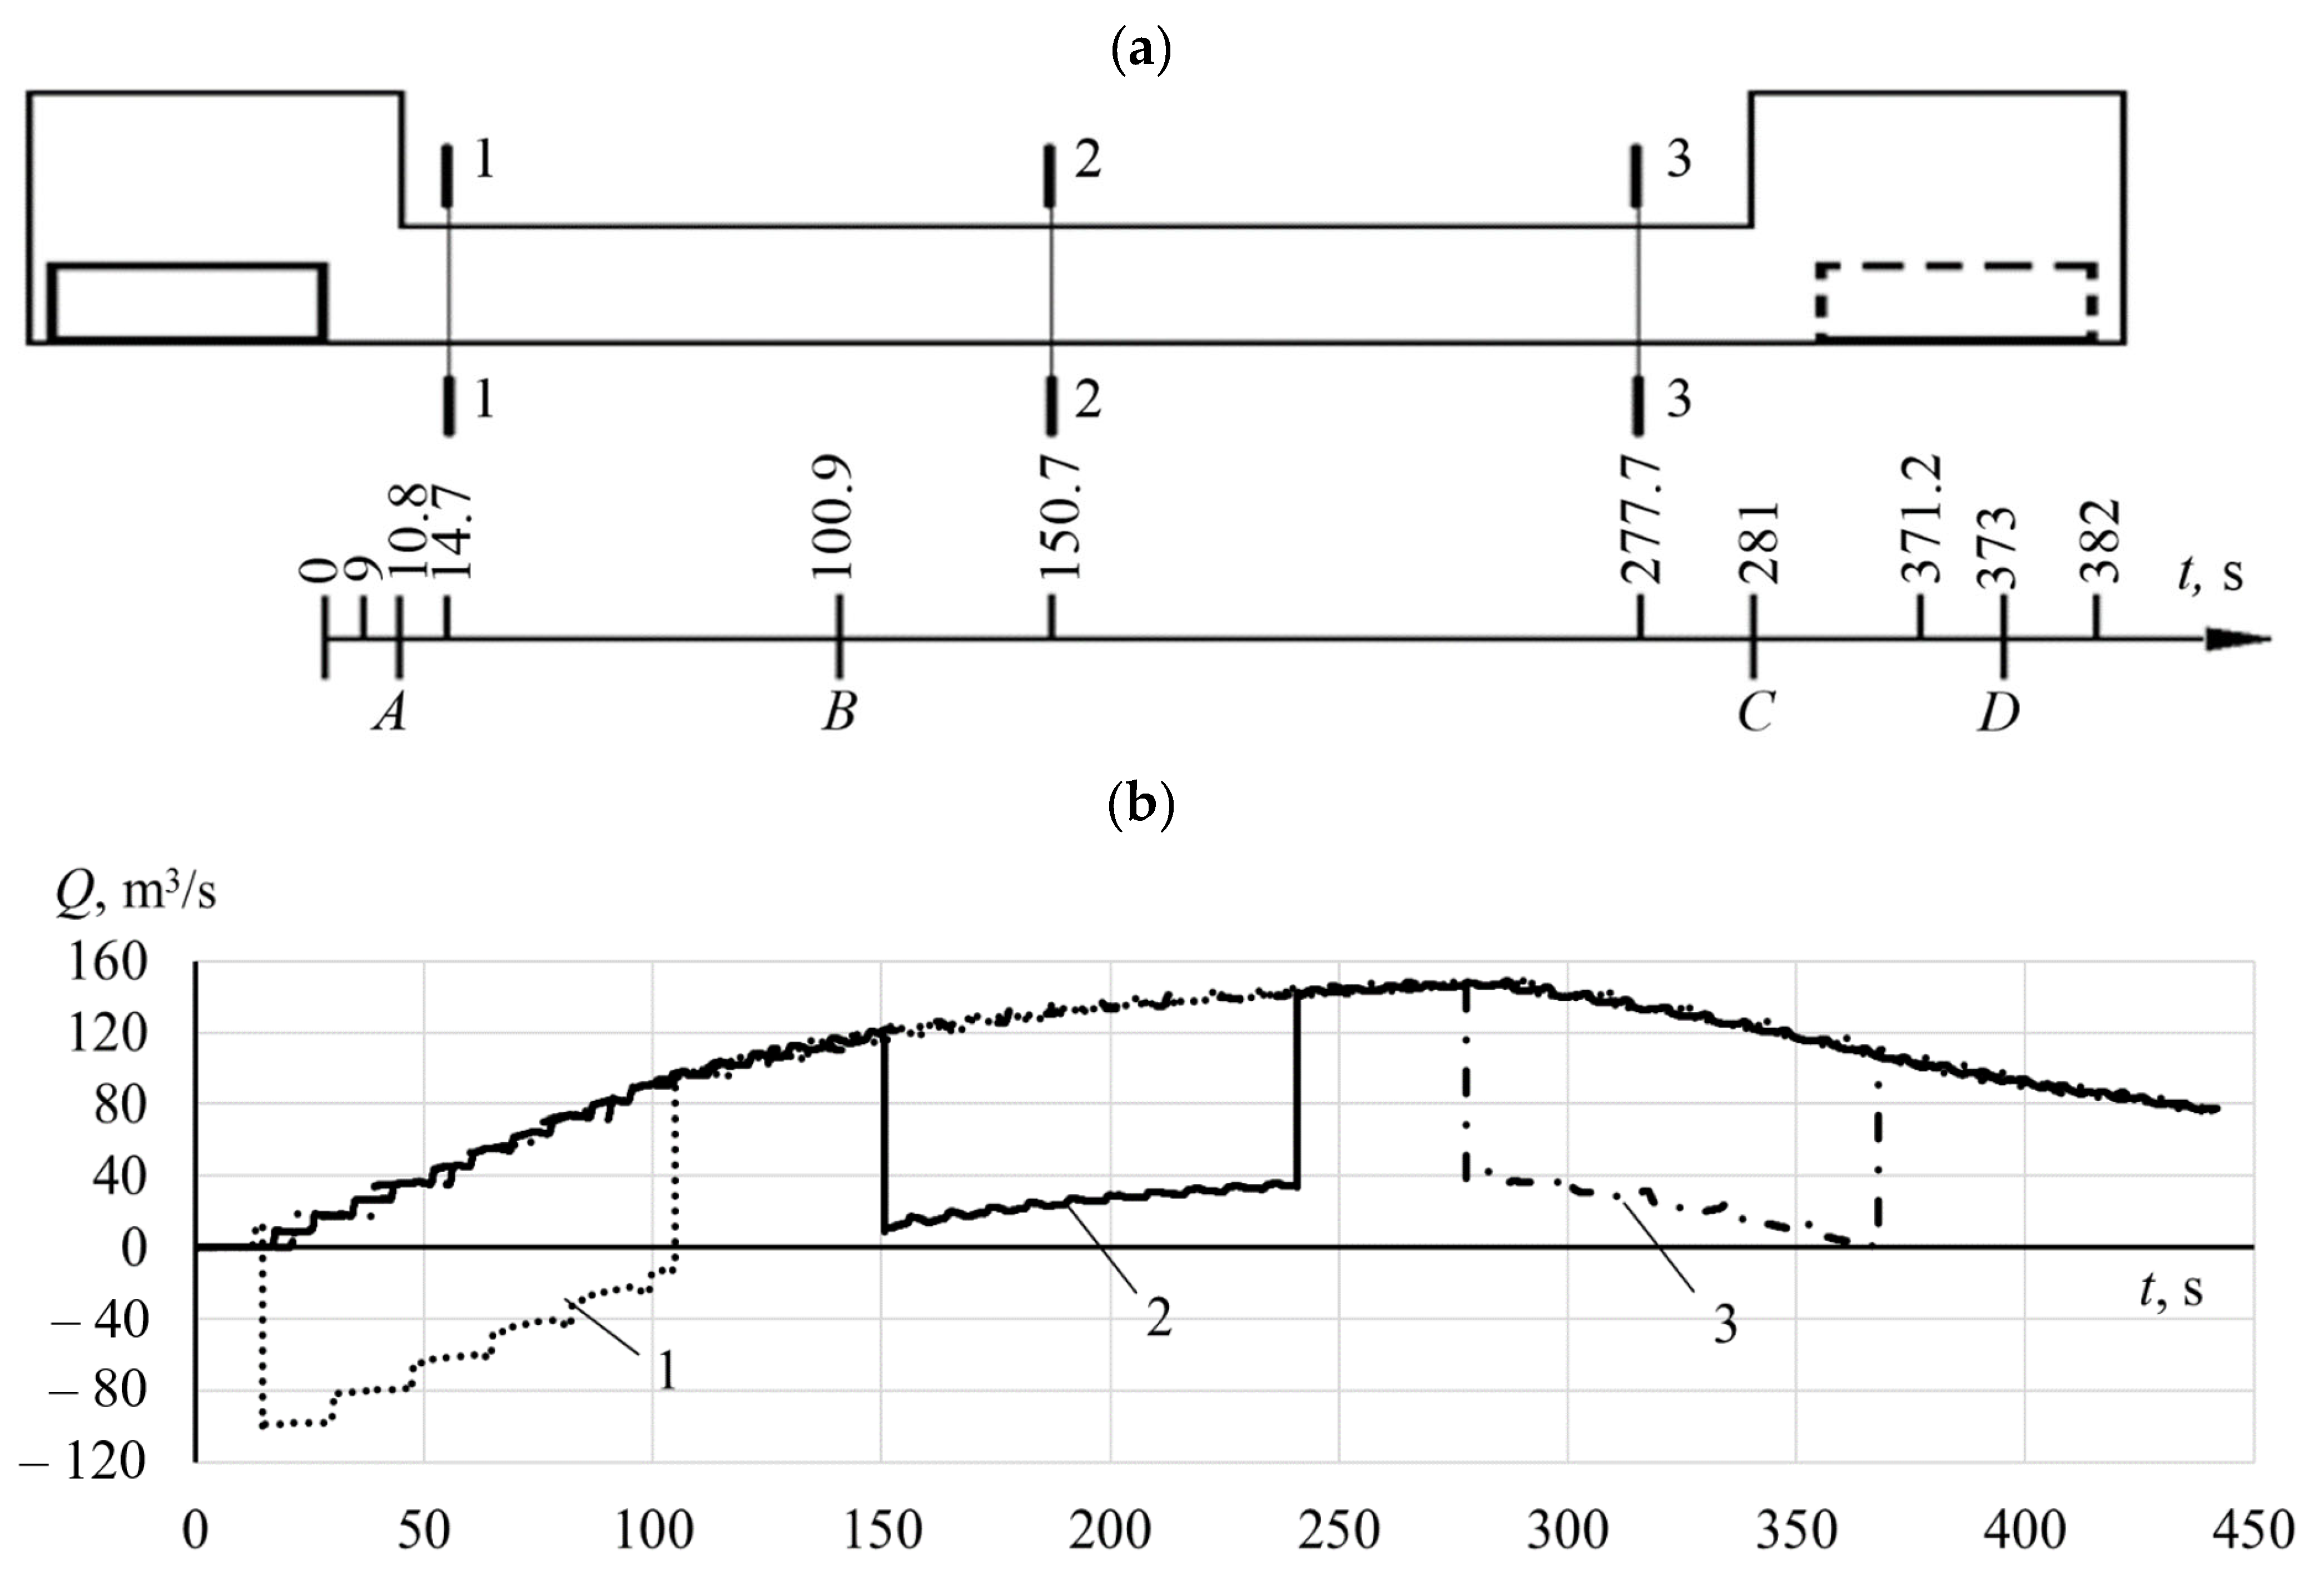
Figure 5 present the numerical modeling results for a 3000 m long tunnel: the air pressure and flow rates per cross sections of the tunnel, as well as the air pressure at the front and back surfaces of the train.
Figure 4a shows the longitudinal plan of the tunnel with marked sections 1–1, 2–2 and 3–3. Sections 1–1 and 3–3 lay at the distance of 10 tunnel diameters from the inlet and outlet portals, respectively, and section 2–2 is in the middle of the tunnel. The time scale in
Figure 4a specifies some characteristic moments and time spans: 0–9 s—speedup of the train; 10.8 s—front surface of the loco (LF) crosses the inlet portal; 14.7 s—LF crosses section 1–1; 100/9 s—back surface of the tail car (TB) crosses the inlet portal; 150.7 s—LF crosses section 2–2; 277.7 s—LF crosses section 3–3; 281 s—LF crosses the outlet portal; 371.2 s—train leaves the tunnel (TB crosses the outlet portal); 373 s—trains begins decelerating; starting from 382 s—the train is at lay-over for 60 s.
Firstly, the air flow rate changes almost linearly (
Figure 4b) and depends on the position of the train in the tunnel. At a train speed of 40 km/h, at 100.9 s, when the train is fully in the tunnel, the slope of the curve changes (point of inflexion) and the air flow rate in section 1–1 varies according to the quadratic dependence. For different length trains, the point of inflexion takes place at different times.
4. Results
Based on the experimental modeling, it has been found that the air flow rate caused by the piston effect of train movement at a constant velocity is a piecewise function that is dependent on the train’s length and its position in the tunnel. The process of the train movement can be divided into three characteristic time intervals:
I—from LF entrance in the inlet portal until TB entrance in the tunnel;
II—from TB entrance in the inlet portal until LF exit from the outlet portal;
III—from LF exit from the outlet portal until TB exit from the tunnel.
Table 2 gives the obtained air flow rates in the tunnels as a function of the time:
Qt =
f(
t). These relations result from the approximated relations of air flow rate variations in tunnels.
5. Discussion
Figure 5 shows the parameters of the fans that simulate the pressure front ahead of the train, as well as the rarefaction front behind the tail car. It is important to note that until the train is fully in the tunnel, the rarefaction front at the back of the tail car is not ventilated. For this reason, the model (
Figure 1) in this time interval is free from fan 1 which simulates air rarefaction behind the tail car. In the case under study, such a model is valid for the time span 0 > t > 100.9 s. The draught loss in the tunnel clearance is a variable that is dependent on the length of the train entering the tunnel. In the exit section of the tunnel, when t > 278 s, the model is free from fan 2, which simulates the increased air pressure in front of the head car, and the draught loss in the tunnel clearance is also a variable.
Thus, the modeling of air distribution caused by the piston effect in an extra-long railway tunnel has three stages: 1—entry of the train into a tunnel; 2—movement of the whole train within a tunnel; 3—exit of the train from a tunnel.
Figure 5 indicates the trends of the pressure on the LF and TB for each of the listed stages. Let the pressure of the fan simulating the front surface of the loco be equal to the average value of the pressure trend in the fitting section. When the train enters a tunnel, P1f = 124 Pa; when the whole train moves within a tunnel, P2f = 60 Pa; when the train leaves a tunnel, P3f = 60 Pa. Hence, the pressure of the fan simulating the tail surface of the moving train inside the tunnel is P2b = 60 Pa, and is P3b = 40 Pa when the train leaves the tunnel.
In
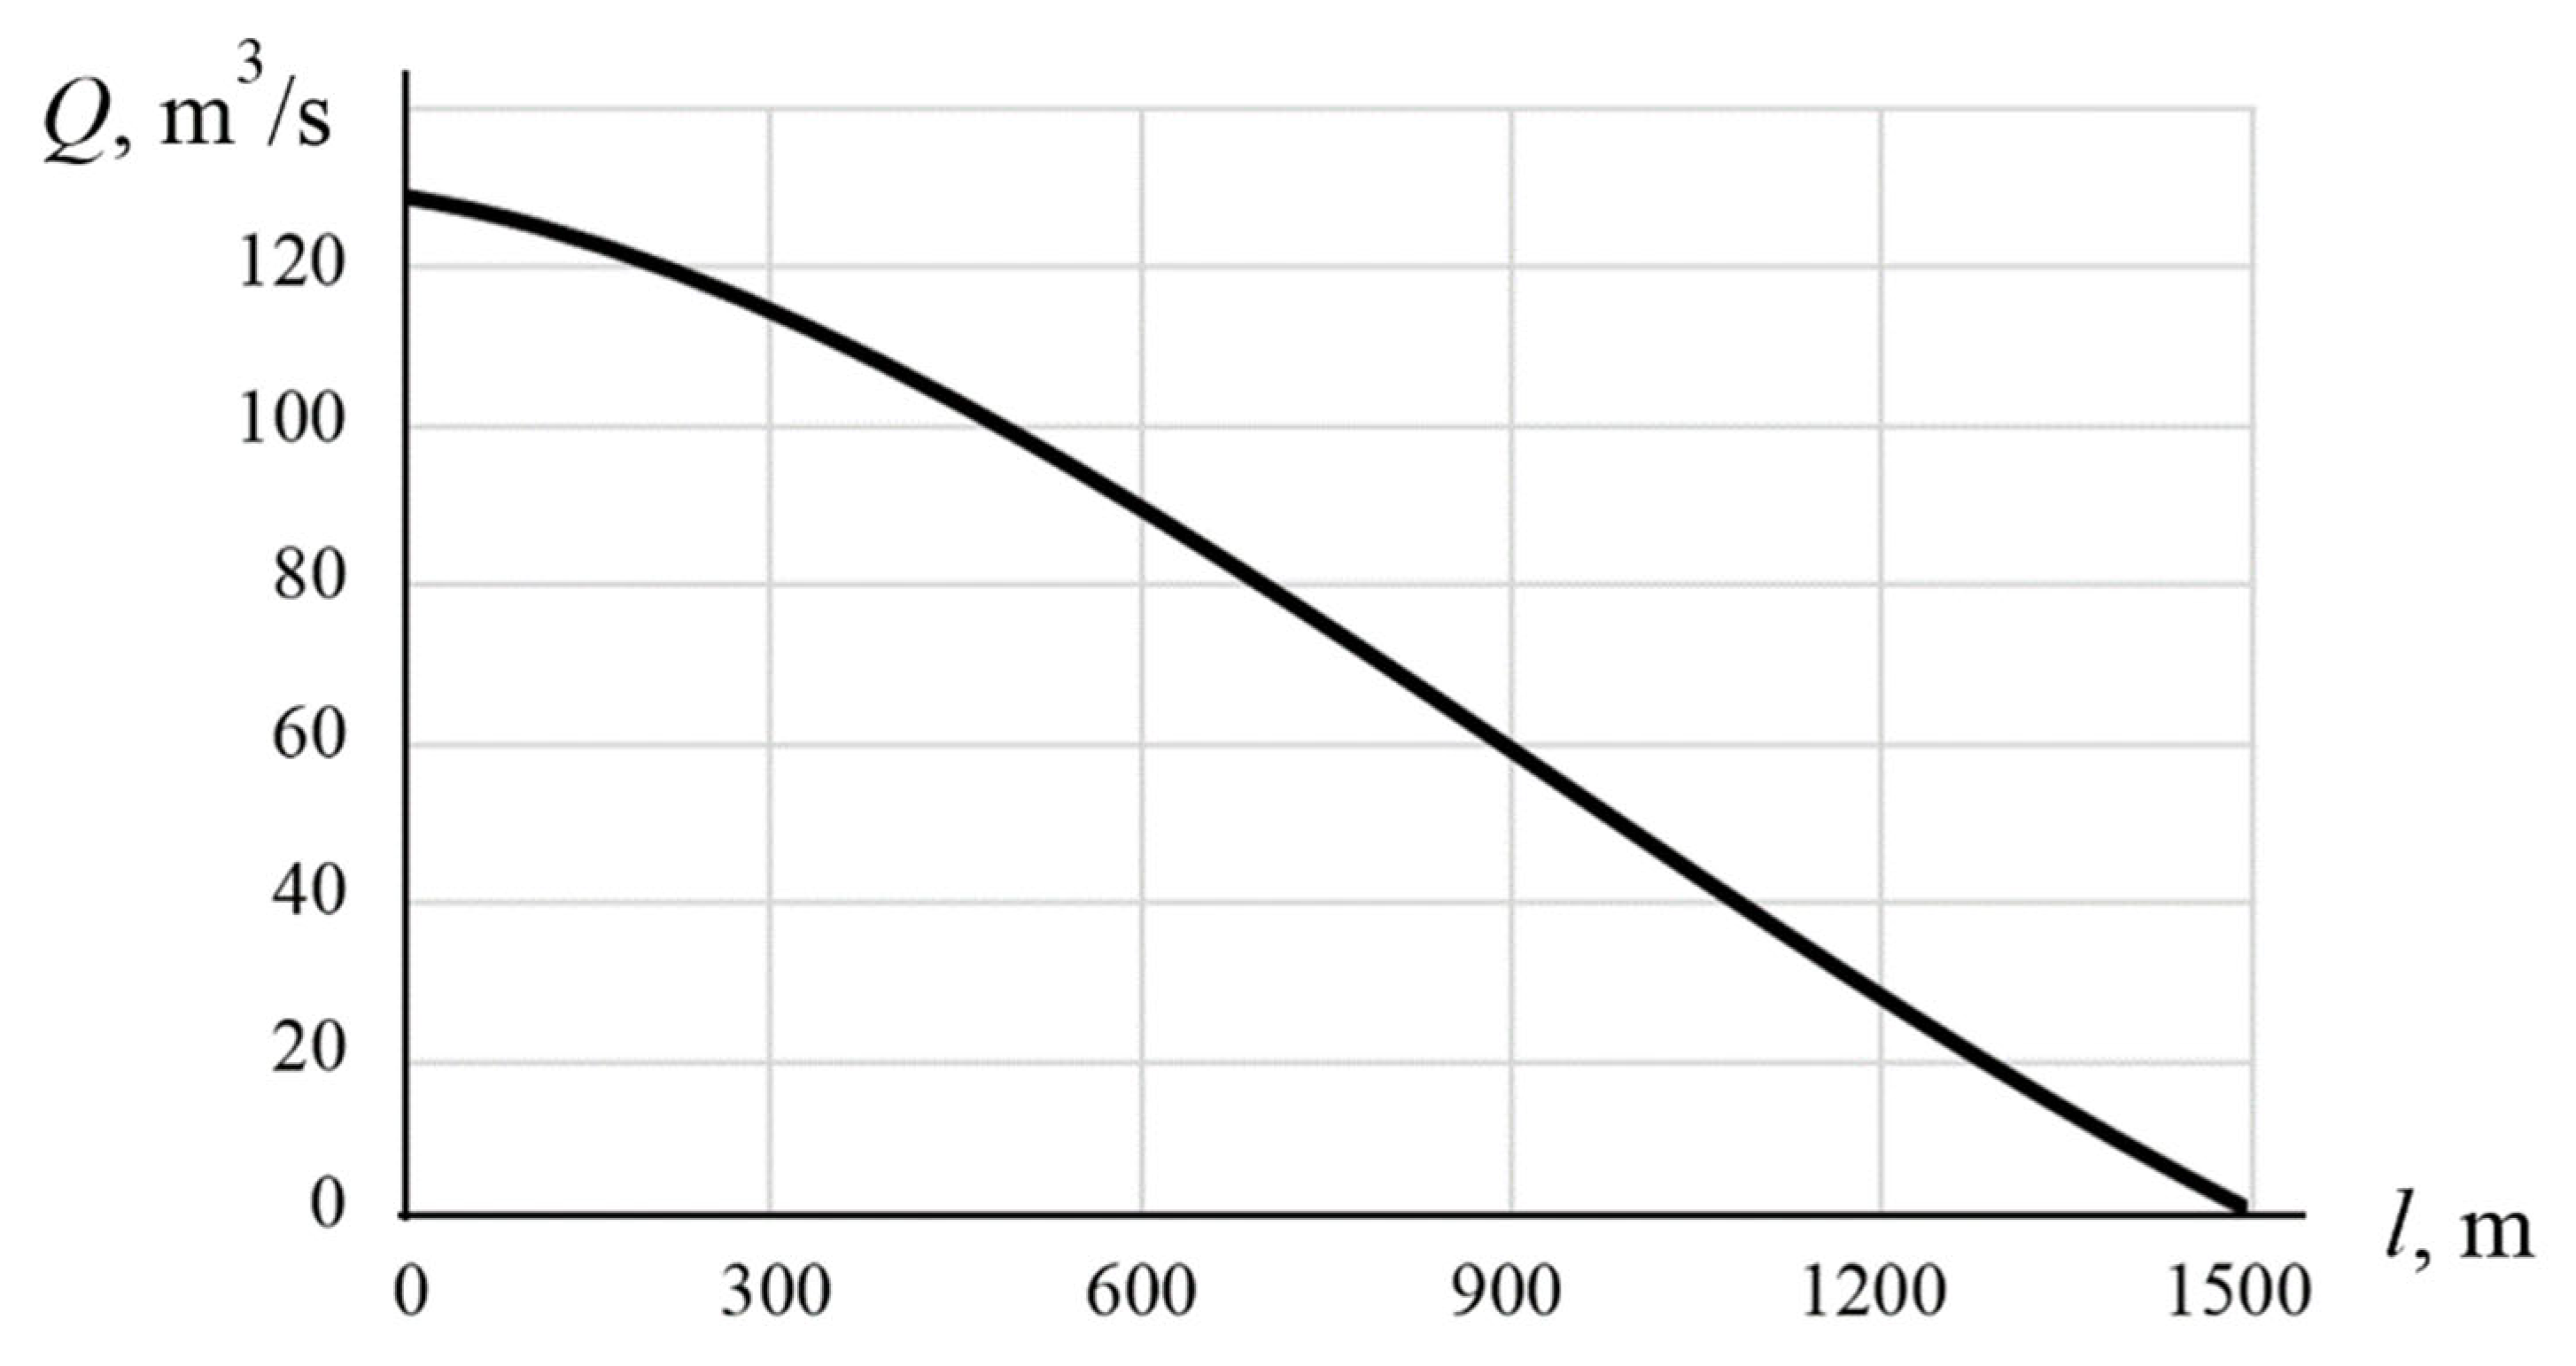
Figure 6, we see how the diffusion resistance Rd (
Figure 1) depends on the distance between the front face of the loco and the tunnel section where the air flow rate is required to be determined. By way of example, we analyze the variation in the air flow rate in section 2–2 when the loco approaches it (
Figure 6). When the train is at the distance of 1500 m, the air flow rate in section 2–2 is less than 10 m
3/s in the 3000 m long tunnel, while the average air flow velocity is under 0.2 m/s. Thus, this flow rate is assumed to be undisturbed.
The diffusion resistance
Rd is a function of the distance
l between the front face of the train and the point at which the air velocity is to be determined. The air velocity is calculated so that the flow rate decreases linearly, and at the distance of 1500 m from the loco front, the air flow caused by the piston effect attenuates down to the velocity of an undisturbed flow. We relate this effect to the diffusion resistance
Rd(
S) and the distance from the front of the loco to the tunnel section of interest (
Figure 7):
Rd(S) = 5 × 10⁻¹³·S3 − 9 × 10⁻¹⁰·S2 + 7 × 10⁻⁷·S − 8 × 10⁻⁵, kμ.
In this fashion, the mathematical model of the air flow caused by the piston effect is given by the system of equations:
—for the 3 km long tunnel;
Rd(S) = 4.6 × 10⁻¹³·S3 − 8.27 × 10⁻¹⁰·S2 + 7.93 × 10⁻⁷·S − 8.333 × 10⁻⁵
—for the tunnel 6 km long;
Rd(S) = 5.48 × 10⁻¹³·S3 − 8.84 × 10⁻¹⁰·S2 + 7.25 × 10⁻⁷·S − 8.035 × 10⁻⁵
RZ = 0.00249—for the 1000 m long train.
The developed mathematical model was verified in calculations of the air flow caused by the piston effect of a freight train 1000 m long in the Severomuysky Tunnel with a length of 15 km. The calculated air flow rate is 148.3 m
3/s. According to the in situ measurements in the Severomuysky Tunnel [
22], the air flow rate caused by the piston effect of an empty freight train is 153 m
3/s. Thus, the modeling and experimental results disagree by a mere 7%.
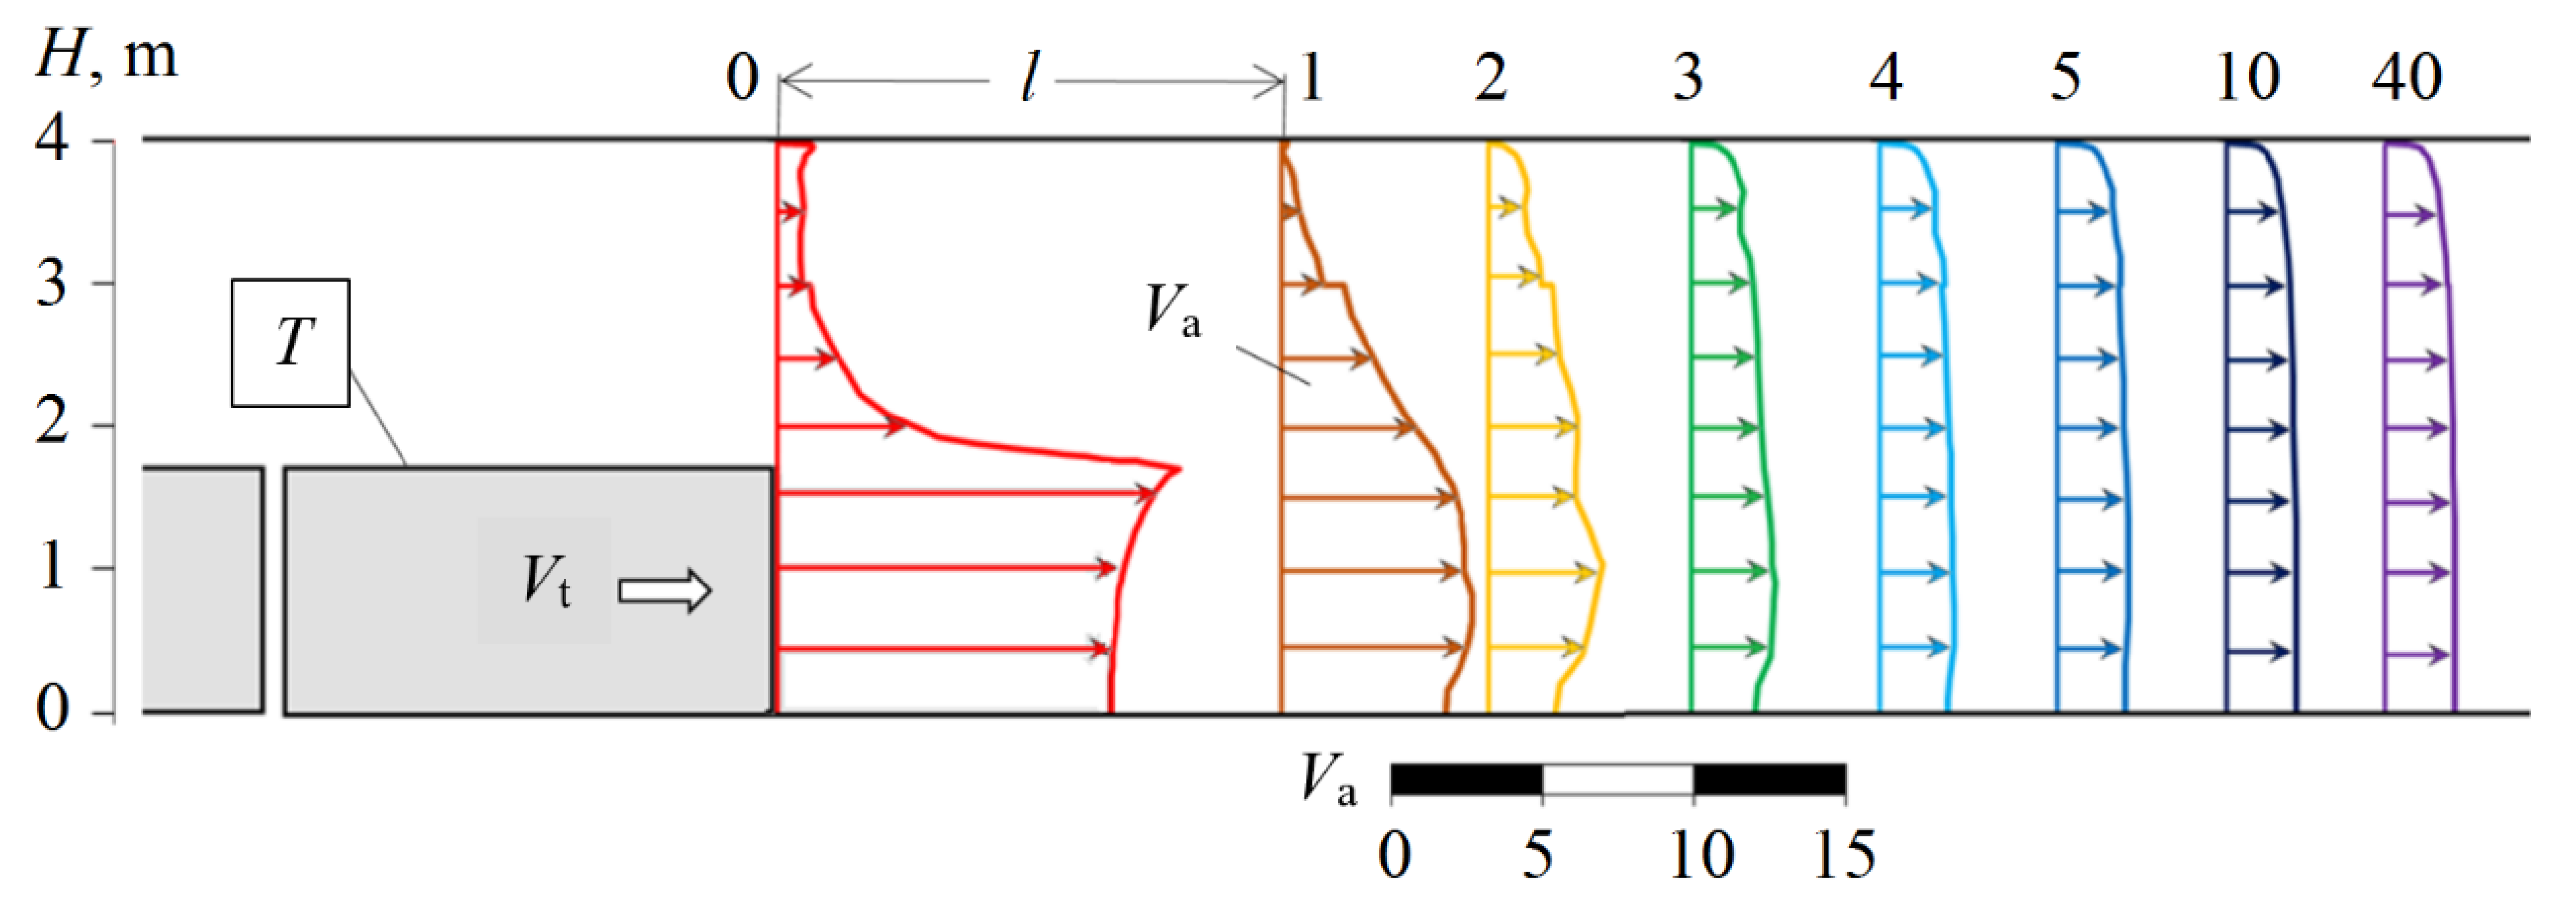
Figure 8 shows the velocity profiles of the air flow in the tunnel at different distances from the loco front. The profiles are almost similar and settled at a distance of more than 4 km. It should be noted that with a moving train in the subway tunnel, the section with the settled velocity profiles is much farther [
23]. It is due to the fact that subway train overlaps 50% of the tunnel section and moves at a velocity two times higher than a railway train (around 20 m/s).
Based on the obtained results, it is validated that the quasi-dynamic models of air flow caused by the piston effect in extra-long railway tunnels are applicable to a network model of static air distribution. Consequently, the design time for tunnel ventilation systems can be greatly reduced. As an example, the calculation of the air flow rates in the 6 km long tunnel, with a moving freight train in the ANSYS Fluent environment, took 1089 h. The quasi-dynamic calculation of the air distribution in the network model took no more than 1 s, or 2.7 × 10⁻⁴ h. In terms of obtaining information on the air flow rates in a tunnel during the travel of a train, it is sufficient to perform calculations at ten positions of the train in the tunnel. In this case, the total calculation time is 2.7 × 10⁻³ h. The achieved reduction in the computing interval is 4 × 10⁵.
6. Conclusions
Through modeling exercises, the authors have evaluated the air exchange caused by the piston effect in tunnels in terms of the extended railway tunnels 3 and 6 km long in Siberia and Russian Far East. The air flow rate in a tunnel with a moving train features three modes of behavior: 1—linear, at the entrance of train in a tunnel; 2—quadratic, when train is fully in a tunnel; 3—linear, at the exit of train from a tunnel. The numerical calculation agrees with the field observation data.
Aiming to solve the problems of ventilation in network models of static distribution, the authors have developed the quasi-dynamic model of the piston effect in extra-long railway tunnels. The calculated air flows at different tunnel sections in the ANSYS Fluent environment and in the network model agree well. Meanwhile, the time interval of the air distribution calculation in the 3 km long tunnel in the network model is 4 × 10⁵ times shorter, which is of practical significance in the multivariate design of ventilation systems for railway tunnels.
Author Contributions
Conceptualization, A.K.; methodology, E.A. and T.I.; software, I.L.; validation, T.I., A.K. and E.A.; formal analysis, E.A.; resources, A.K. and I.L.; data curation, I.L.; writing—original draft preparation, A.K. and I.L.; writing—review and editing, T.I., I.L. and A.K. All authors have read and agreed to the published version of the manuscript.
Funding
The authors acknowledge the Science committee of the Ministry of Education and Science of the Republic of Kazakhstan for the financial support (state registration number is AP09260842).
Institutional Review Board Statement
Not applicable.
Informed Consent Statement
Not applicable.
Data Availability Statement
The data used in this study were collected by the authors, any questions and clarifications can be addressed to the author (
ivlugin@misd.ru).
Acknowledgments
The work was carried out within the Project of Fundamental Scientific Research of the Russian Federation (state registration number is 121052500147-6) and with the financial support of the Science committee of the Ministry of Education and Science of the Republic of Kazakhstan (state registration number is AP09260842).
Conflicts of Interest
The authors have no conflict of interest to declare.
References
- Russian Railways Company Annual Report. Rail Transportation and Infrastructure. 2021. Available online: https://ar2021.rzd.ru/ru/performance-overview/analysis-operating-results/railway-transportation-infrastructure (accessed on 23 January 2023).
- Lugin, I.V.; Vitchenko, A.A. Maintaining required temperature conditions in the Severomuysky Tunnel in cold season using the tunnel ventilation facilities. Fundam. Appl. Issues Min. Sci. 2014, 1, 210–214. (In Russian) [Google Scholar]
- Kiyanitsa, L.A.; Lugin, I.V.; Krasyuk, A.M. The analysis of thermal conditions in extra-long railway tunnels during the cold season. J. Min. Sci. 2021, 57, 154–170. [Google Scholar] [CrossRef]
- Alferova, E.L.; Lugin, I.V.; Kiyanitsa, L.A. Modeling of air flow disturbances during train movement in a double-track subway tunnel. Min. Inf. Anal. Bull. 2016, 6, 5–14. (In Russian) [Google Scholar]
- Jiang, Y.; Jianyou, Y.; Zhou, P.; Zhou, F.; Lin, J.; Li, J.; Lin, M.; Lei, F.; Wang, Z. Influence of traffic on the temperature field of tunnel in cold region: A case study on the world’s longest highway spiral tunnel. Undergr. Space 2023, 8, 196–209. [Google Scholar] [CrossRef]
- Krasyuk, A.M.; Lugin, I.V.; Pavlov, S.A. Experimental research into air distribution in a terminal subway station. Tunn. Undergr. Space Technol. 2019, 85, 21–28. [Google Scholar] [CrossRef]
- Król, A.; Król, M. Numerical investigation on the piston effect in subway tunnels. In Advanced Solutions and Practical Applications in Road Traffic Engineering; Springer: Cham, Switzerland, 2023; pp. 108–119. [Google Scholar] [CrossRef]
- Kuznetsov, A.S.; Lukin, S.M. Flow algorithms are used to calculate air distribution in ventilation networks. J. Min. Sci. 1989, 25, 448–454. [Google Scholar] [CrossRef]
- Lanchava, O.; Nozadze, G. Piston effect analysis for the metro ventilation. Georgian Sci. 2021, 3, 1–14. [Google Scholar] [CrossRef]
- González, M.L.; Vega, M.G.; Oro, J.M.F.; Marigorta, E.B. Numerical modeling of the piston effect in longitudinal ventilation systems for subway tunnels. Tunn. Undergr. Space Technol. 2014, 40, 22–37. [Google Scholar] [CrossRef]
- Miyachi, T.; Ozawa, S.; Fukuda, T.; Iida, M.; Arai, T. A new simple equation governing distortion of compression wave propagating through Shinkansen tunnel with slab tracks. J. Fluid Sci. Technol. 2013, 8, 462–475. [Google Scholar] [CrossRef]
- Wu, Y.; Gao, N.; Wang, L.; Xiping, W. A numerical analysis of airflows caused by train-motion and performance evaluation of a subway ventilation system. Indoor Built Environ. 2014, 23, 854–863. [Google Scholar]
- Krasyuk, A.M.; Lugin, I.V. Investigation of the dynamics of air flows generated by the disturbing action of trains in the metro. J. Min. Sci. 2007, 43, 655–661. [Google Scholar] [CrossRef]
- BAM Tunnel Project. Projects. Far Eastern Railway. 2023. Available online: https://btpnsk.ru/projects/dvzhd/ (accessed on 23 January 2023).
- Genlder, S.G.; Pleskunov, V.A. Selecting efficient airing circuit for the Kuznetsovsky Tunnel. Min. Inf. Anal. Bull. 2009, S13, 81–89. (In Russian) [Google Scholar]
- Project Documentation (2014). Construction of the New Baikal Tunnel in the Delbichinda–Daban Trackside of the East Siberian Railway. Section 3: Technological and Design Solutions for a Linear Object. Artificial Structures; Stroy-Trest: Saint Petersburg, Russia, 2014. (In Russian)
- Krasyuk, A.M.; Lugin, I.V.; Pavlov, S.A. Circulatory air rings and their influence on air distribution in shallow subways. J. Min. Sci. 2010, 46, 431–437. [Google Scholar] [CrossRef]
- Lugin, I.V.; Alferova, E.L. Modeling natural draught effect in ventilation network of shallow subways. Proc. Young Sci. Conf. Min. Descend. 2010, 2, 64–69. (In Russian) [Google Scholar]
- Construction Code SP 131.13330.2020. Construction Climatology. Effective as of 25 June 2021, Moscow. (In Russian). Available online: https://minstroyrf.gov.ru/docs/118243/ (accessed on 23 January 2023).
- Russian Railways Company Annual Report. Key Indicators. 2021. Available online: https://sr2021.rzd.ru/ru/about-company/key-indicators (accessed on 23 January 2023).
- The Russian Railways Company Denies Khodorkovsky’s Saying on Slow Traffic Activity in Russia. 2015. Available online: https://www.gazeta.ru/business/news/2015/06/22/n_7312041.shtml (accessed on 23 January 2023).
- Gendler, S.G.; Smirnyakov, V.V.; Sokolov, V.A. First results of ventilation network tests in the Severomuysky Railway Tunnel. Min. Inf. Anal. Bull. 2005, S2, 272–281. (In Russian) [Google Scholar]
- Krasyuk, A.M.; Lugin, I.V. Subway Ventilation; SO RAN: Novosibirsk, Russia, 2019; 316p. (In Russian) [Google Scholar] [CrossRef]
Figure 1.
Structure of network model of piston effect: 1—fan simulating negative pressure (air rarefaction) behind the tail car (Qb—capacity and PbSV—static pressure of the fan); 2—fan simulating overpressure (air pressure increase) ahead of the loco’s front face (Qf—capacity and PfSV—static pressure of the fan); 3—draught loss in the clearance between the train and tunnel walls, RZ; 4—diffusion resistance (air dispersion drag) Rd; 5—train; Vt—train velocity; arrows show directions of air flow.
Figure 2.
Branches 1, 8, 10, 12—connections to atmosphere; 2 and 7—inlet and outlet portals; 3 and 6—tunnel; 4—RZ; 5—Rd; 9—fan simulating air rarefaction behind tail car; 11—fan simulating increased of air pressure ahead of train; 13—fan simulating the natural draught.
Figure 2.
Branches 1, 8, 10, 12—connections to atmosphere; 2 and 7—inlet and outlet portals; 3 and 6—tunnel; 4—RZ; 5—Rd; 9—fan simulating air rarefaction behind tail car; 11—fan simulating increased of air pressure ahead of train; 13—fan simulating the natural draught.
Figure 3.
Axially symmetric calculation model of the tunnel and train: 1—train; 2—cross section of entry portal; 3—tunnel; 4—cross section of exit portal; 5—open space outside the tunnel, for speedup, deceleration and lay-over; arrows indicate travel direction of the train; figures stand for geometrical dimensions in meters; Ox—axis of symmetry.
Figure 4.
(a) Longitudinal section of the tunnel: A—time when LF crosses the inlet portal, t = 10.8 s; B—time when TB crosses the inlet portal; C—time when LF crosses the outlet portal; D—time when TB crosses the outlet portal; (b) 1, 2, 3—air flow rates in sections 1–1, 2–2 and 3–3, respectively.
Figure 4.
(a) Longitudinal section of the tunnel: A—time when LF crosses the inlet portal, t = 10.8 s; B—time when TB crosses the inlet portal; C—time when LF crosses the outlet portal; D—time when TB crosses the outlet portal; (b) 1, 2, 3—air flow rates in sections 1–1, 2–2 and 3–3, respectively.
Figure 5.
Air pressure at LF and TB: 1—average pressure at LF; 2—average pressure at TB; 3—trend of average pressure at LF; 4—trend of average pressure at TB.
Figure 5.
Air pressure at LF and TB: 1—average pressure at LF; 2—average pressure at TB; 3—trend of average pressure at LF; 4—trend of average pressure at TB.
Figure 6.
Variation in air flow rate in section 2–2 versus distance to the front face of the locomotive.
Figure 6.
Variation in air flow rate in section 2–2 versus distance to the front face of the locomotive.
Figure 7.
Diffusion resistance Rd(S) versus distance from the front of the loco to the tunnel section in the 3 km long tunnel.
Figure 7.
Diffusion resistance Rd(S) versus distance from the front of the loco to the tunnel section in the 3 km long tunnel.
Figure 8.
Velocity profiles of air flow in tunnel at different distances from the loco front face: T—loco; l—distance from the front face of the loco, m; H—height of train and tunnel (from the axis of symmetry), m; Va—air flow velocity, m/s; Vt = 11.1—train velocity, m/s.
Figure 8.
Velocity profiles of air flow in tunnel at different distances from the loco front face: T—loco; l—distance from the front face of the loco, m; H—height of train and tunnel (from the axis of symmetry), m; Va—air flow velocity, m/s; Vt = 11.1—train velocity, m/s.
Table 1.
Pressures of fictitious sources of ND, Pa.
Table 1.
Pressures of fictitious sources of ND, Pa.
| Δh, m | 5 | 10 | 15 | 20 | 25 |
|---|
| Bagdarin | WS | 60 | 120 | 179 | 240 | 300 |
| CS | 71 | 141 | 213 | 283 | 354 |
| Ayan | WS | 61 | 121 | 181 | 242 | 302 |
| CS | 69 | 136 | 205 | 274 | 341 |
| Kirensk | WS | 60 | 119 | 178 | 238 | 297 |
| CS | 71 | 141 | 211 | 281 | 352 |
Table 2.
Relations of air flow rates and time within characteristic time intervals.
Table 2.
Relations of air flow rates and time within characteristic time intervals.
| | Tunnel Length | 3 km | 6 km |
|---|
| Time Interval | |
|---|
| I | Qt = 1.05t − 15.65 | Qt = 0.7t − 10.4 |
| II | Qt = −0.0016t2 + 0.883t + 22 | Qt = −0.00039t2 + 0.36t + 30.8 |
| III | Qt = −0.478t + 284.5 | Qt = −0.299t + 280.43 |
| Disclaimer/Publisher’s Note: The statements, opinions and data contained in all publications are solely those of the individual author(s) and contributor(s) and not of MDPI and/or the editor(s). MDPI and/or the editor(s) disclaim responsibility for any injury to people or property resulting from any ideas, methods, instructions or products referred to in the content. |
© 2023 by the authors. Licensee MDPI, Basel, Switzerland. This article is an open access article distributed under the terms and conditions of the Creative Commons Attribution (CC BY) license (https://creativecommons.org/licenses/by/4.0/).


