Abstract
In the present study, we used device visualization in tandem with deep learning to detect weeds in the wheat crop system in actual time. We selected the PMAS Arid Agriculture University research farm and wheat crop fields in diverse weather environments to collect the weed images. Some 6000 images were collected for the study. Throughout the season, tfhe databank was assembled to detect the weeds. For this study, we used two different frameworks, TensorFlow and PyTorch, to apply deep learning algorithms. PyTorch’s implementation of deep learning algorithms performed comparatively better than that of TensorFlow. We concluded that the neural network implemented through the PyTorch framework achieves a superior outcome in speed and accuracy compared to other networks, such as YOLO variants. This work implemented deep learning models for weed detection using different frameworks. While working on real-time detection models, it is very important to consider the inference time and detection accuracy. Therefore, we have compared the results in terms of execution time and prediction accuracy. In particular, the accuracy of weed removal from wheat crops was judged to be 0.89 and 0.91, respectively, with inference times of 9.43 ms and 12.38 ms on the NVIDIA RTX2070 GPU for each picture (640 × 640).
1. Introduction
Wheat (Triticum aestivum L.) is a commonly cultivated cereal worldwide that covers about 237 million hectares annually, producing 765 million tons of yield [1]. Pakistan is expecting huge population growth over the coming decades. It is expected that the population will reach 225 million in 2025. To meet the demand of a large population, we need to produce more food. Wheat is the most widely consumed food grain; its output outnumbers rice, maize, and potatoes [2]. Wheat accounts for 1.6% of the overall GDP, and generates 8.9% of added agricultural value [3].
Its ideal growing temperature is around 25 °C, with minimum and maximum temperatures of 3 to 4 °C and 30 to 32 °C, respectively [4]. Wheat is tolerant of a wide variety of moisture levels, and can be grown in most climates, with annual precipitation ranging from 250 to 170 nm [5]. Spring and winter wheat crops are the most commonly classified, and these terms relate to the season in which the crop is grown. After cloudy winter temperatures (0° to 5°C), winter wheat heads will appear. Spring wheat is sown in the spring and matures over the summer, despite the fact that it may be cultivated in the autumn in places such as Pakistan that have mild winters [6].
Weeds cause economic losses in wheat crops that can range from 40 to 50%, and must be controlled throughout the crop’s growing season to achieve an appropriate crop yield. Weeds constitute unwanted plants that fight with crops for nutrients, resources, and sunlight. They can have a number of detrimental effects, including reducing agricultural yields and unmanageable weed populations [7]. Weeds infect crops and provide food for insect pests. Weeds are referred to as pests in agriculture because they harm produce. Weed infestation is the most damaging but least visible variable adversely impacting wheat crop production. Weeds are the most unappealing, destructive, and problematic vegetation worldwide. These off-type plants have grown out of their natural habitat, and their value has yet to be identified. Weeds also serve as a pool for the food and protection of various pests and diseases during the off-season. Weed density has been investigated with regard to yield losses depending on different densities of Melilo indica in both rainfall and irrigated conditions.
Implementing healthy farming requires modern technologies and methods, such as processing images, videos, machine vision, and artificial intelligence. These enable the maximum application of pesticides in machine vision applications in agriculture [8], accurate assessment of crop nitrogen levels, determination of crop growth, calculation of the solar radiation received by the crop, and the identification of plant diseases and grasses. The most important part of designing machine vision systems is segregation, because of the risk of extracting and sorting identified objects from the process.
Nowadays, the development of computer vision and automated expert systems has made it possible to distinguish between crops and weeds in an easy and fast way. Multiple groundwater detection techniques for selective herb application and site-related grass management have been studied as environmentally friendly techniques to reduce the consumption of chemical pesticides and their environmental impact on fields. For this purpose, some researchers used remote sensing technology to distinguish weeds, crops, and soil-based measurements reflected at different wavelengths. In contrast, others distinguish plants based on color, texture, and shape characteristics. An image-processing system to detect weeds based on classification was developed by [9].
Real-time target identification relies on a number of variables, such as the amount and quality of pictures, the architecture of deep convolutional neural networks (DCNN), the hardware, and the memory storage, including GPUs [10]. Quantifying the phenotypic changes resulting from genetic or environmental differences using convolutional neural networks (CNNs) produced an 86.6% detection accuracy in recognizing wheat spikes. Using DL models, a 95.9 and 99.7% accuracy in identifying wheat spikes and spikelets, respectively, was achieved. Samseemoung et al. [11] reported that DCNNs support agricultural applications. They classified weeds with an accuracy of more than 95% using DCNN models. Partel et al. [12] described an extraordinary organization accuracy of 99% when using CNNs to distinguish between weeds and sugar beets.
From linear regression to CNNs, the dataset using which a machine learning model can be presented is constrained. The literature contains many grasses and plant life image datasets. The Annual Life CLEF Plant Identification Challenge 2015 Dataset 25 features 113,205 pictures with 41,794 explanations of 41,794 trees. This vast dataset is unique compared with most other work sites that offer particular datasets of scientific interest. All of these approaches provide high-ranking accuracy for target datasets. However, most datasets capture plant life to the best of their ability under perfect lab conditions. Although perfect lab conditions allow strong theoretical classification results, determining a classification model on a grass control robot requires an image dataset that captures plants in realistic environmental conditions [13].
Agriculture productivity is predicted to increase significantly with robotic grass control. The main benefits of an autonomous weed control system are lower labor costs and the potential to use fewer herbs, while using weeds more effectively. Improving the efficacy of weed control will have a huge economic impact. Farmers are thought to lose US 2.5 billion each year due to adversely impacted agricultural productivity, and to spend USD 1.5 billion on grass management efforts in Australia alone. Agricultural robot technology offers the opportunity to eliminate these losses and boost output [14].
In comparison to variable rate application (VRA), uniform application of agrochemicals (UA) causes over-application of harmful chemicals, greater agricultural input costs, and environmental deterioration (VA). The design, implementation, and testing of a smart variable ratio sprinkler (SVRS) for VA pesticide application uses deep learning (DL). The SVRS is used to quickly identify healthy potato plants and those affected by early blight, lambs’ quarter’s weed, and other pests. Approximately 24,000 images of farmlands in Prince Edward Island and New Brunswick were shot in a range of bright, overcast, and partly cloudy situations to present and train the YOLOV3 and mini YOLOV3 models. The tiny YOLOV3 was chosen for SVRS improvements because of its increased performance. The two spraying methods (UA and VA) and three weather conditions (cloudy, partly cloudy, and sunny) functioned as the two independent factors in a factorial laboratory experiment, with spray volume consumption acting as the response variable [15].
The development of optical techniques and artificial intelligence to distinguish crop plants and weeds is a critical step toward the automation of nonchemical herbal control systems in agriculture and decreasing chemical use through spot spraying. Large-scale bold spraying of chemical herbicides is not only a waste of herbal medicines and labor, but also a cause of environmental pollution and food quality problems. Traditional methods are concerned with the need for high light and sample quality. Therefore, proper identification of weeds and precise sprays are important strategies for promoting sustainable agricultural development. To avoid the effect of different light on the pictures, the color model and then the gray picture component are suggested. The method of vertical projection and the method of linear scanning have been developed to identify the main line of crop rows quickly. To reduce the complexity of the math, the Classical view efficiency rate (WIR) has been modified, and a better method of horizontal scanning has been adopted to make calculations within the cells. Finally, the revised broad inflation rate (MWIR) is typically used to capture real-time decisions through the minimum error ratio of the basin decision under distribution [16].
The following are the main contributions of this research paper:
- Collecting real-time data on undesirable plants in wheat crops, which are then used as input data for deep learning models after pre-processing.
- Efficiently raining deep learning-based models for weed detection so that they can later be used in real-time detection models.
- Providing a comparative inference time in addition to detection accuracy, which suggests the suitability of the specific model in terms of inference time as well.
This paper is organized as follows. Section 2 discusses the work carried out by other researchers in this area. Details about data collection techniques, pre-processing, and prediction models are presented in Section 3. Section 4 concerns the experiments and results, and the discussion is concluded in Section 5.
2. Literature Review
In [13], a useful technology for efficient farming-related implementations is outlined: UAV (unmanned aerial vehicles). Aerial surveillance of UAV farms in agriculture allows for crucial decision-making on the monitoring of crops. Developments have further improved the accuracy and reliability of aerial imagery-based research in deep learning models. Remote crop assessment applications such as plant categorization and aggregation, crop counting, yield estimate and comparison, weed identification, disease detection, crop mapping, and nutrient deficiencies, among others, may accommodate various types of sensors (spectral cameras, RGB) on UAVs. UAVs are abundantly used to practice farming activities, and are cited by several researchers. An analysis of research studies adapting deep learning to UAV imagery for deficient farming is provided in this report. Depending on the requirement, these studies were categorized into five main classes, which include identification of vegetation, classification and segmentation, crop estimation and yield expectations, crop mapping, crop disease and detection of weeds, and detection of inadequate intake. A comprehensive analysis of each area of research is presented.
In [17], the use of fungicides and herbicides in agriculture can be substantially reduced or even eliminated using precision weeding. The specific selection of weeds, low-cost plant identification, and high speed are necessary to achieve high precision. Using combined red, green, and near-infrared reflectance, the current system is combined with a size differentiation system to classify weeds and crops in lettuce fields. LED arrays are presented at 525, 650, and 850 nm, and pictures are captured in a single shot using a modern RGB camera. A kinematic stereo system is used to compensate for parallax errors in pictures, and the precise position data of plants are presented. The scheme was tested within three lettuce fields ranging from 0.5 to 10 km/h at various growth stages in field trials around fields. The results of in-field trials showed values of 69% and 56%, respectively, in crop and weed identification. Post-trial processing led to average crop and weed processing values of 88% and 81%, respectively.
The demand for wheat is also growing as the world’s population grows [18]. It is essential to monitor weeds in wheat crops and the barren/wasteland areas in order to decrease the production of weeds so that wheat productivity can be enhanced. The important variable evaluated was the detection of weeds. An unmanned aerial vehicle (UAV) is utilized in various stages of gathering wheat crop data to capture high-quality RGB pictures. The recommended backdrop subtraction approach speeds up the processing of weeds, wheat, and barren land inside the wheat crop region. The results show that background subtraction is a good method for detecting weeds, barren land, and wheat.
In [14], pictures were taken, and the study describes a machine vision system for weed detection in the field of vegetable crops, while avoiding illumination and sharpness difficulties throughout the acquisition phase. This design will serve as a foundation for a mobile weed removal robot with a camera obscura (Latin for “dark room”) in light-controlled areas. This research study aims to build a successful weed discrimination algorithm by using image filtering to remove color and area characteristics, then implementing a method to mark each item in the scene, and finally recommending a region-based classification involving specificity, sensitivity, and positive and negative estimated parameters to evaluate the algorithm.
The authors of [19] stated that weed control in modern agriculture usually consists of pouring herbicides all around the agricultural field. Substantial waste and herbicide rates for farmers and environmental degradation are involved in this activity. Allocating the appropriate herbicide dosages in the correct location and at the right time is one approach for reducing costs and environmental consequences (precision agriculture). Unmanned aerial vehicles (UAV) are becoming an attractive acquisition approach for weed optimization and control due to their capacity to capture pictures of the whole agricultural field area with extremely fine spectral resolution and at a reasonable cost. Despite the substantial advancements in UAV acquisition systems, automated weed detection remains difficult because of weeds’ strong similarity to crops. The latest deep learning technique has shown promising results in various complex classification problems. This method, however, requires a certain amount of time in a training phase; it is highly time-consuming to create large agricultural datasets with expert pixel-level annotations. This paper presents a new automated learning approach for weed detection from UAV images, utilizing convolutional neuronal networks (CNNs) and unmonitored training dataset selection. The planned system is divided into three major stages. We begin by automatically detecting crop lines and using them to define interline weeds. The second phase uses interline weeds to create the training dataset. Finally, to create a model capable of detecting the crops and weeds in the photos, we performed CNNs on this dataset. The obtained results are close to conventional supervised labeling of training data. In the field of spinach, the precision gaps are 1.5%, and are 6% in the bean field.
The work [20] seeks to thoroughly map the latest technology of weed mapping in crop fields from aerial agricultural pictures. Four digital repositories were checked: Science Direct, Springer. IEEEXplore, ArXiv, and Link. We were capable of identifying, with this research, what kind of approaches and techniques have been utilized in this particular field in the last 10 years. Four main points are explored in the reviewed research articles: the form of segmentation, method of classification, space of features, and culture addressed.
The paper [21] provides a detailed research survey on the implementation of artificial intelligence approaches in agriculture farming. There are many problems in the world of agriculture, including infestation of diseases and pests, insufficient soil management, in adequate irrigation and drainage, and much more. All these lead to substantial crop loss, including environmental challenges resulting from the severe and unnecessary usage of chemicals. There have been some academic reports carried out to solve these problems. The artificial intelligence field, with its robust learning abilities intelligence, has become a primary technique for tackling challenges related to agriculture. In order to assist agricultural specialists, technologies for effective applications are being built throughout the world. This research survey assesses 100 major contributions, in which artificial intelligence strategies were used to tackle the issues associated with agriculture farming. This paper deals with the introduction of artificial intelligent approaches to the vast agricultural subdomain, so that readers can capture the multi-dimensional advancement of agro-intelligent systems over 34 years, from 1983 to 2017.
The paper [9] discusses that one of the most significant ways to assess apple growth phases and calculate output in orchards is the real-time detection of apples. Apples alter their size, color, cluster density, and other growth features as they mature. Conventional detection methods can only identify apple plants at a specific stage of development, and they cannot be modified to various phases of development using the same model. In orchards with changing light, complicated backdrops, overlapping apples, and branches and leaves, we present an enhanced YOLO-V3 model for identifying apples throughout different growth phases. Images of immature, growing, and ripe apples were initially gathered. Rotation, color stability, luster transformation, and blur processing were then applied to these pictures. Training sets were created using enhanced pictures. In the YOLO-V3 network, the dense net technique is utilized to process feature layers with poor resolution. This increases network performance by improving feature propagation and promoting feature reuse. The trained model’s performance is assessed on a test dataset once it has been trained. The test results demonstrate that the suggested YOLOV3-dense model outperforms the original YOLO-V3 model and the state-of-the-art fruit identification model, the Faster R-CNN with VGG16 net model. The model’s average detection time per frame at 3000 × 3000 resolution is 0.304 s, allowing for real-time detection of apples in orchards. Furthermore, the YOLOV3-dense model can successfully offer apple identification in circumstances of overlapping apples and occlusion, and it may be used in a real-world orchard setting.
The paper [22] deals with weeds known as yield reducers, which can be more economically damaging than fungi, insects, and other crop pests in many cases. Crop productivity and financial losses due to weeds (off-type plants) are key components of agricultural research that contribute to the development of effective weed control techniques. Researchers utilized data from 1581 agricultural research studies on weed control in important field crops, carried out by the ALL India Coordinated Research Project in diverse locations of Indian states between 2003 and 2021, to estimate productivity and economic losses due to weeds. The study discovered that in the case of soybeans (50–76%) and groundnuts (45–71%), there was higher variation in prospective outcome decline among the various locations than in the case of direct seeded rice (15–66%) and maize (18–65%). There was higher variation in potential yield losses among different locations in the case of direct seeded rice (15–55%) and maize (15–55%). Three factors highly influenced (p.0001) the variation in real yield losses due to weeds in farmers field, location, crop type, and soil type. There were also significant variations between various locales, crops, and soil types. Rice had the highest economic losses (USD 4420 million), followed by wheat (USD 3376 million), and soybeans (USD 1559 million). Groundnut (35.8%), soyabean (31.4%) green gram (30.8%), pearl millet (27.7%), maize (25.3%), sorghum (25.1%), sesame (23.7%), mustard (21.4%), direct seeded rice (21.4%), wheat (18.6%), and transplanted rice (21.4%) were among the ten major crops in India in which weeds caused a total economic loss of about USD 11 million (13.8%).
In [23], one of the most essential components of agricultural yield is identified as weed control; determining the number and position of weeds has been a difficulty for specialists for decades. In this work, we compared three approaches to weed estimation in lettuce fields, based on deep learning image processing compared with visual assessments by experts. As a feature descriptor, one method is to utilize support vector machine (SCM) histograms of oriented gradients (HOG). In the third strategy, Mask R-CNN (a region-based convolutional neural network) was used to produce instance segmentation for each individual, whereas YOLOv3 (You Only Look Once v3) was used in the second strategy to benefit from its robust architecture for object recognition. These techniques were complemented with a backdrop subtractor that removed non-photosynthetic objects using the NDVI index (normalized difference vegetation index). Crop detection F1-scores for machine and deep learning techniques were 88%, 94%, and 94%, respectively, according to specified criteria. The identified crops were then converted to a binary mask and used with the NDVI background subtractor to identify weeds indirectly. After obtaining the marijuana image, the coverage percentage was determined using standard image processing methods. Finally, we used a Blan–Altman plot, infraclass correlation coefficients (ICCs), and Dunn’s test to give statistical measures among each estimation and those of a group of weed specialists (human machines). We discovered that these methods improve weed coverage assessment accuracy and reduce subjectivity in human-estimated data.
Authors of [8] conducted a field study, they found that outcome losses caused by six normally occurring and most plentiful weeds in wheat fields, namely Phalaris minor Retz., Rumex dentatus L., Coronopus didymus (L.) Sm., Medicago denticulata Willd., Chenopodium album L., and Poa annua L., were investigated. These weeds were cultivated in a 1:1 weed-crop ratio with two commercially farmed wheat types, Inqalab 91 and Punjab 96. P. annua caused the highest yield losses of 76 percent in Inqalab 91, followed by C. Didymus at 75 percent, while other weeds caused yield losses of 60–70 percent. R. dentatus produced the greatest yield decrease of 55 percent in Punjab 96, followed by P. minor (28 percent), M. denticulate, C. album (23 percent), C. Didymus (10 percent), and P. annua (10 percent) (0 percent). In comparison to Inqalab 91, Punjab 96 proven to be more resistant to weeds.
In [15], the new technology of deep learning convolutional neural networks (CNNs) was shown to help farmers boost their efficiency by using remote sensing and automated field condition inference. This study investigated how CNNs were used to identify two weeds in pictures of wild blueberry fields: hair fescue and sheep sorrel. To control patches of these weeds, commercial herbicide sprayers apply agrochemicals uniformly. Three objects were identified, and three images were classified. Using pictures from 58 wild blueberry fields, CNNs were taught to recognize hair fescue and sheep sorrel. The CNNs were trained on pictures with a resolution of 1280 x 720 and tested at four different internal resolutions. The CNNs were retrained with progressively reduced training datasets ranging from 3780-472 images to explore the influence of dataset size on accuracy. The best object detection CNN was YOLOv3 small; it detected at least one target weed per image at 1280 × 736 resolution, and had F-1 scores of 0.97 for hair fescue and 0.90 for sheep sorrel. The reference of the darknet for the image classification CNN was the most accurate, with F1-scores of 0.96 and 0.95 for pictures containing hair fescue and sheep sorrel, respectively, at 1280 × 736. At the lowest resolution, 864 × 480, MobileNetV2 produced comparable findings, with F1-scores of 0.95 for both weeds. Except for the darknet reference, the quantity of the training dataset has no influence on accuracy. This technique may be used in smart sprayer to manage individual spray treatments for specific targets, which would reduce herbicide use. The CNN will be put to the test on a smart sprayer, and an app will be developed to provide producers with field-specific data. For wild clue berry growers, using a CNN to improve agricultural efficiency will result in significant cost savings.
In the paper [20], in military navigation, environmental monitoring, and civic applications, accurate and quick identification in remote sensing pictures is critical. Due to the difficulty of recognizing tiny items in remote sensing pictures, object detection technology faces greater demands and obstacles. One-stage object detectors and the two-stage object detectors based on convolutional neural networks have made considerable progress in the field of image classification and detection in recent years. The one-stage object detector outperforms the two-stage object detector in terms of detection speed, while the two-stage target detector outperforms the other in terms of detection accuracy. YOLOv3 is used as a one-stage target detector in this article to identify remote sensing images from small aircraft. Using dimension clusters, we selected appropriate anchors to cover the size distribution in our experimental data. The experimental results show that YOLOv3 not only beats the standard one-stage object detector in terms of speed, but also equals the accuracy of the two-stage object detector. For tiny aircraft detection, the YOLOv3 demonstrated good detection accuracy while little processing time.
3. Materials and Methods
This research is carried out on the dataset collected from PMAS Arid Agriculture University research farm Koont Chakwal during 2020-21, with latitude N 33.7′11.604” and longitude E 7′3.051.996”, to detect weeds in wheat crops through image analysis and artificial intelligence (AI).
3.1. Site Description and Field Experiment
The experiment was carried out at university research farm Koont Chakwal during 2020–2021. The wheat seed was sown on 27 October 2020 with the help of a Rabi drill; a row-to-row distance of 23 cm was maintained under rainfed conditions. The temperature at sowing time was 24 °C/75.2 °F in October 2020–2021. The recommended dose of NPK was applied uniformly to all the fields at the time of sowing @ 52:46:25 kg/ha−1. The total plot size was 3 kanal. In the current study, a number of different YOLO (You Only Look Once) variants, i.e., YOLOv3-Tiny, YOLOv4-Tiny and different versions of YOLOv5, are employed to assess how well the model performed after various adjustments. Our objective was to assess the precision and effectiveness of several YOLO iterations in order to ascertain which version would be most suited to our particular application.
3.2. Image Acquisition
An aggregate of 6000 RGB ordinal pictures of weeds and wheat plants were reserved at the university research farm Koont Chakwal field, using a mobile camera (Samsung A31s) and Logitech C920 Pro HD webcam with a resolution of 1080 × 2400 (FHD+) (Full HD 1080p/30fps HD 720p/30fps) pixels. The images were taken from the field of PMAS Arid Agriculture University research farm Koont (Lat N 33.06, 59.7, N″ long 73.00, 40.6 E). Besides the other physical characteristics of wheat and weed plants modified throughout their life cycle, the dataset was split into three groups (Table 1). Some sample images of Cirsium arvense are shown in below Figure 1. The weed images obtained with an RGB camera were transferred to a computer to build deep learning models. A diagram of the weed images’ collection is shown in Figure 2.

Table 1.
Training dataset under different growth stages.

Figure 1.
Overview of samples of Cirsium arvense.
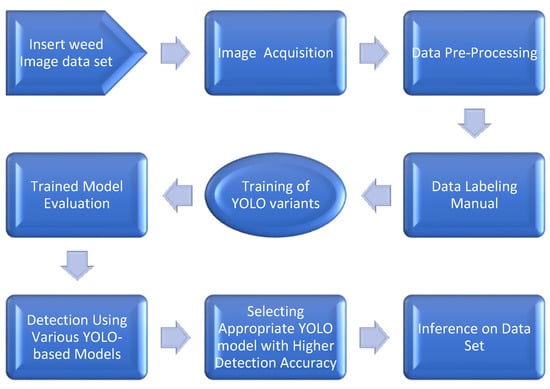
Figure 2.
Flow chart of the weed detection process.
Cirsium arvense is one of the worst kinds of weed; it destroys many plants and crops by consuming their resources (such as water and nutrients), causing a loss in final production. It is also referred to as creeping thistle. In plants affected by this weed, plant shape is deformed, and growth is affected too.
There are basically two classes (class labels) involved, i.e., Cirsium arvense and wheat plants. A total of 1200 images of weeds in wheat plants were captured. Some 1000 images were available for final use after blurred and ineffective images were removed. For equal distribution, every class has 1000 images, of which 640 weed and wheat plant images were used to train the dataset. As mentioned in Table 1, 30% of pictures of every session were used for validation, 180 for every three classes, and 30% of 180 for testing all weeds and wheat plants. All of the images were taken in a variety of weather situations, including bright, overcast, and partially cloudy conditions, at varied heights (1, 1.5m), at 60, 80, and 90 degrees from the ground’s surface, and with shadow and tree shadow.
3.3. Data Pre-Processing
To feed the dataset to the neural networks, the dataset must be pre-processed according to the needs of neural networks such as YOLO-based architectures. All the blurred and noisy images are removed from dataset, and the images are resized to 224 × 224 dimensions, as YOLO-based architectures require that input shape.
3.4. Image Classification
Prior to picture classification, all of the photos used for the model training were downsized (1280 × 720) in Irfan View (version 4.58) to obtain the best possible accuracy value. Cropping helps to remove the unnecessary details and helps the deep learning model to learn patterns that are relevant to the task at hand. Another reason for cropping images is that specific neural network models expect images of specific dimensions. YOLOv4 is example of such a network that expects images to be in 224 × 224 dimensions. The pictures were chosen to be 224 × 224 pixels in size, with a base learning rate of 0.001 and a decay learning ratio strategy. However, 0.95 was chosen as the value of momentum. The lessons were improved upon using a transfer learning strategy. Transfer learning involves retraining a model for new classes using the existing weights (a set of weights) from a model that has already been fully trained on a specific dataset, such as ImageNet [24]. Transfer learning is effective in many sensing applications, as confirmed by the study of Monteiro et al. [25]. Further steps during the DCNN network training showed that the lowest value was saved for the validation set later. The outcomes of all the saved models were then computed in the fashion of statistical metrics such as accuracy, precision, and recall with the test dataset. The training of all the detection models, including YOLOv3-tiny, YOLOv4-tiny, and variations of YOLOv5, was performed on the powerful discrete NVIDIA RTX 2070 GPU.
3.5. Preparation of Models
Irfan view (version 5.54) software was used to crop each image to 1280 × 720 pixels, tag it with the YOLO Mark tool, and then enlarge it to that size. The YOLO technique for object detection operates in real time. It is a clever CNN that processes the entire image using a single neural network, before dividing it into regions to predict bounding boxes and probabilities for each zone. It is a cutting-edge CNN that processes the full image using a neural network before segmenting it into sections and forecasting bounding boxes and probabilities. The most recent iteration of YOLO, version 5, often known as YOLOv5, was employed. Compared to another detection model with equivalent performance, the YOLOv5 runs much quicker. The reduced version of YOLOv5, known as Tiny-YOLOv5, is crucial in lowering the convolutional layer. For both the weed and wheat crop picture datasets, the ratio of training to testing validation photos was 70:30. Images utilized for training were not used for testing. On Ubuntu 16.04, GPU was used for all training experiments. Using the torch framework, the model was trained using the YOLO and small YOLO algorithms established by Badeka et al. [26]. YOLOv5 outperforms the small, reduced YOLO in terms of speed [24]. The pictures were chosen to be 224 × 224 pixels in size, with a base learning rate of 0.001 and a decay learning rate policy (Table 2) and hyper parameter of YOLOv3-Tiny and YOLOv4-Tiny is shown in Table 3. However, 0.95 was chosen as the value of momentum. We utilized the same dataset for all versions of YOLO; thus, we did not need to perform training and validation several times with various different image orderings. To guarantee the right image shuffle and a minimal number of runs for each version of the model, we did utilize certain software and testing.

Table 2.
The lists of hyper-parameters for the training of models YOLOv5s, YOLOv5l and YOLOv5m.

Table 3.
The lists of hyper-parameters for the training of models YOLOv3-Tiny and YOLOv4-Tiny.
3.6. Performance Metrics
We used a range of measures, including mean average precision (MAP) and mean intersection over union (mIOU), to assess the model’s performance on our dataset and statistically compare the many YOLO iterations. In order to guarantee a fair comparison and to take into account any differences in the data, we also chose varied numbers of photos across the versions.
The performance of the models utilized in this work was assessed using accuracy, recollection, accuracy and inaccuracy ratios, Matthew’s correlation coefficient, F1-scores and an implication period (Table 4). A positive predictive value is another term used for precision. It is a ratio that measures the neural network’s performance by dividing the amount of accurate TP by the summation of true positive and FP (Equation (1)). The best and worst precisions are 1.0 and 0.0, respectively.
Accuracy = TP/(TP + FP)

Table 4.
The misperception medium developed utilizing justification, and the taxing results of images for classification model using the four potential situations.
Recall is computed by multiplying TP by the sum of TP and FN. Recall is also known as sensitivity and the true confident rate (Equation (2)). Its value is between 0 and 1. The effectiveness of the neural network in weed detection was evaluated using recall.
Recall = TP/(TP + FN)
Precision refers to the proportion of correctly predicted positive instances (true positives) out of all instances that were predicted as positive, whether they were true or false positives. In other words, it measures the accuracy of positive predictions. Precision can be calculated using the following formula (Equation (3)):
Precision = TP/(TP + FP)
The F1-score, on the other hand, is the harmonic mean of precision and recall (sensitivity). The F1-score is a balanced measure of precision and recall, and is used when the distribution of classes is uneven. F1-score can be calculated using the following formula (Equation (4)):
F1-Score = 2 * (Precision * Recall)/(Precision + Recall)
Equation (5) is used to determine Matthew’s correlation coefficient, which accounts for all four variables in the conflict matrix.
MCC = TP × TN − FP × FN
(TP + FP) (TP + FN) (TN + FP) (TN + FN)
Matthew’s correlation coefficient (MCC) is a metric used to evaluate the performance of binary detection and classification problems. It is effective in evaluating imbalanced datasets. Its value ranges from 1 to −1, representing perfect detection or classification as 1, totally incorrect detection as −1, and a somewhat random output as 0.
4. Experiments and Results
4.1. The Performance of CNNs within the Pytorch Framework
In the context of PyTorch, the result outcomes are summarized in Table 5. The table shows that all the YOLOv5m, YOLOv5s, and YOLOv5l all models performed well, and the range of results was obtained from the same scale. However, the YOLOv5l results were better and more accurate compared to those of the other two models. The precision value of YOLOv5l was 0.842, which was comparatively higher than the value provided by both the other models. The remaining two models provided the following values: YOLOv5m (0.66) and YOLOv5s (0.53), as presented in Table 5 and Figure 3.

Table 5.
Comparison of different YOLOv5 models for accuracy rate.
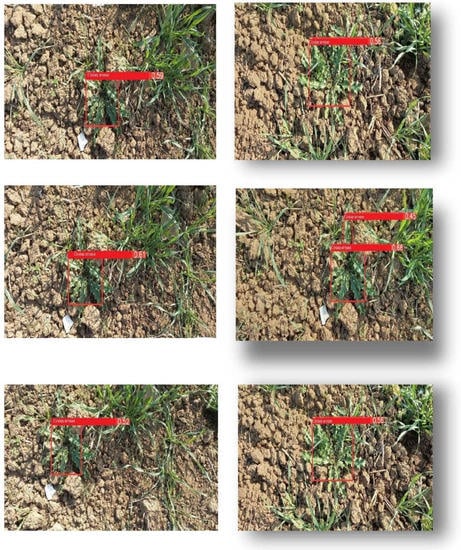
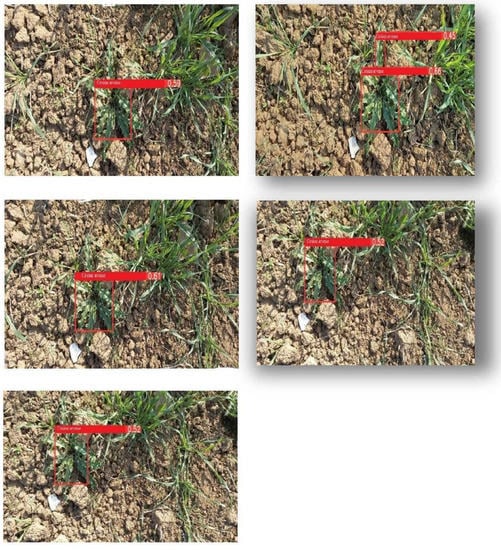
Figure 3.
Process image of Cirsium arvense, and healthy wheat plants for YOLOv5l, m, s.
All three models, YOLOv5s, YOLOv5m, and YOLOv5l were used to train the weed dataset using the Pytorch framework. In terms of accuracy, for the weed datasets, YOLOv5l provided relatively better results compared with the other models. The inference speed of YOLOv5l was slightly higher than both YOLOv5s and YOLOv5m. In comparing the YOLOv3, YOLOv4, and YOLOv5 given in (Table 3), it was observed that the YOLOv4 performed better overall because of its accuracy, as presented in Figure 4, Figure 5 and Figure 6; however, the YOLOv5 is more flexible, and has a model with four networks [27]. In comparison to SSD, Faster R-CNN, and the original YOLOv3, the improved YOLOv3 CNN can recognize tomato diseases and pests in real time with greater speed and accuracy, and in less time [28]. In the end, YOLOv4-tiny and YOLOv3-tiny were compared to identify what improvements YOLOv4-tiny brings.
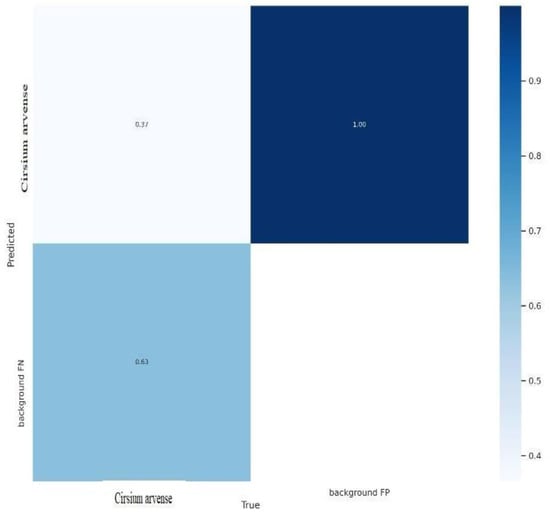
Figure 4.
Confusion Matrix for Detection.
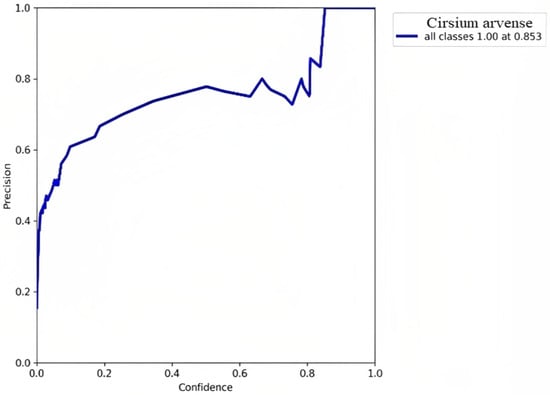
Figure 5.
Precision Results.
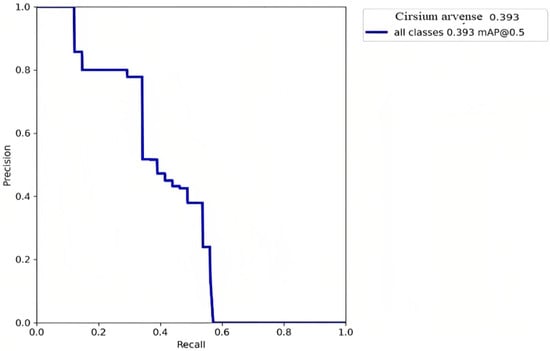
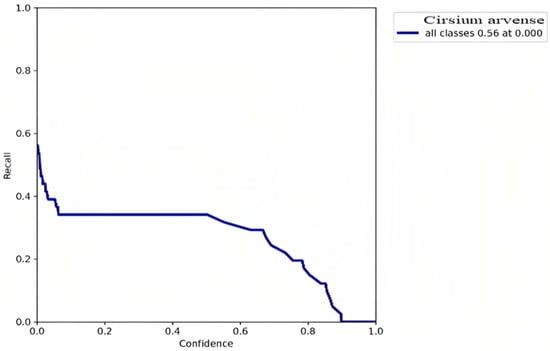
Figure 6.
Recall Results.
YOLO-based detection results were recorded for all models, as shown in (Table 5), with precision values of 0.59, 0.67, and 0.84 for YOLOv5s, YOLOv5m, and YOLOv5l, respectively for weed. The accuracy, recall, and F1-score values for the weed datasets (using these models’ statistical significance indicators) are mentioned in Table 6.

Table 6.
Precision Recall and F1score values for weeds dataset using these models.
Figure 7 demonstrates the results of evaluating two different neural network models, YOLOv5s and YOLOv5l, on a classification task using five different batch sizes (42, 32, 16, 8, and 4). The evaluation metric used in the figure is the F1-score. In general, the results in Figure 7 show that the YOLOv5l model tends to have a higher F1-score compared to the YOLOv5s model, especially when using larger batch sizes (32). Further, the performance of the model is reduced if the batch size used in the model training is bigger than 32. Furthermore, using a smaller batch size can lead to less stable training, and may result in the ideal overfitting to the preparation records, resulting in a lesser performance.
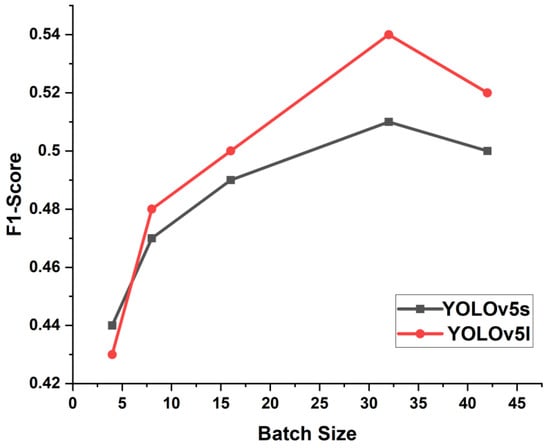
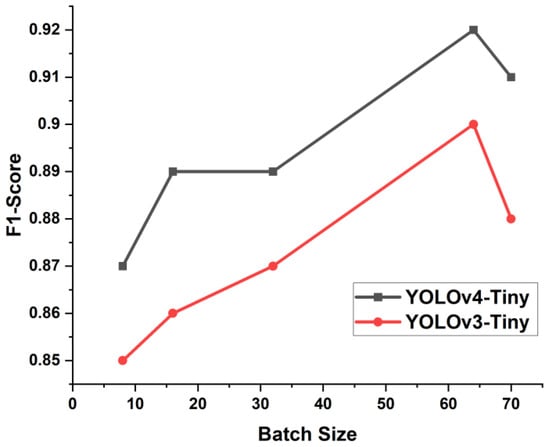
Figure 7.
F1-scores for detection.
In the above figures, we show that the highest F1-score is achieved by the model using the batch size of 64. However, if we increase the batch size more than 64 the performance of the model drops. Furthermore, using smaller batch size results into the lower performance in terms of F1-score.
4.2. The Performance of CNNs under TensorFlow
The YOLOv4-Tiny performed better than the YOLOv3-Tiny within the TensorFlow framework at different growth stages of Cirsium arvense and wheat crops (Table 7), and the models’ real time detection accuracy values are shown in Figure 8 and Figure 9. The YOLOv4-Tiny-based network achieved the highest accuracy in this study. The accuracy value for YOLOv4-Tiny (0.97) was comparatively higher than the YOLOv3-Tiny value (0.96). The precision value of YOLOv3-Tiny (0.91) was higher than the precision value of YOLOv4-Tiny (0.89); the F1-score and recall values of YOLOv4-Tiny (0.92 and 0.96) were higher than the YOLOv3-tiny values (0.90 and 0.90). However, the YOLOv4-Tiny performed better than the YOLOv3-Tiny, and showed a higher F1-score, recall, and overall accuracy as compared to YOLOv3Tiny. That said, the YOLOv3-Tiny precision value (0.91) was better than the YOLOv4-Tiny precision value (0.89). Our study showed a higher precision, recall and F1-score, as compared to an earlier study [28].

Table 7.
Comparison of YOLOv3-Tiny and YOLOv4-Tiny models for accuracy rate.
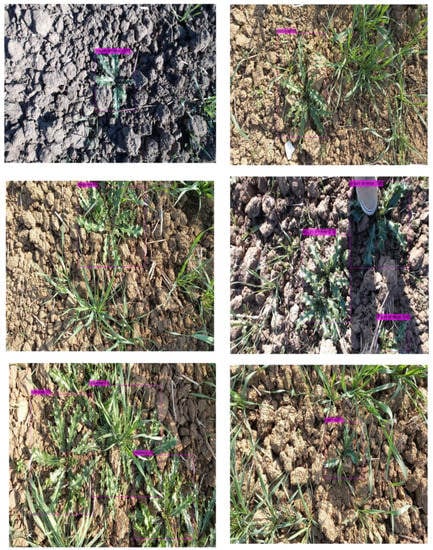
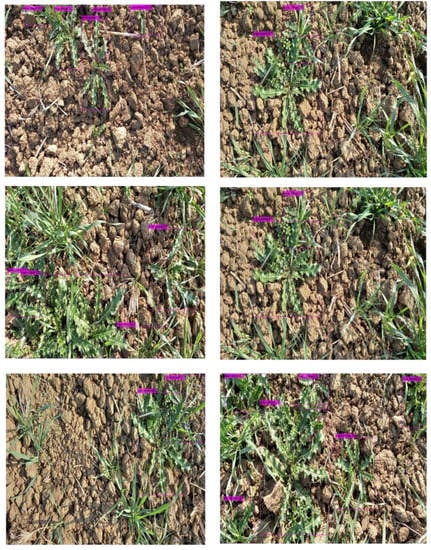
Figure 8.
Examples of Cirsium arvense for YOLOv3-Tiny predictions.
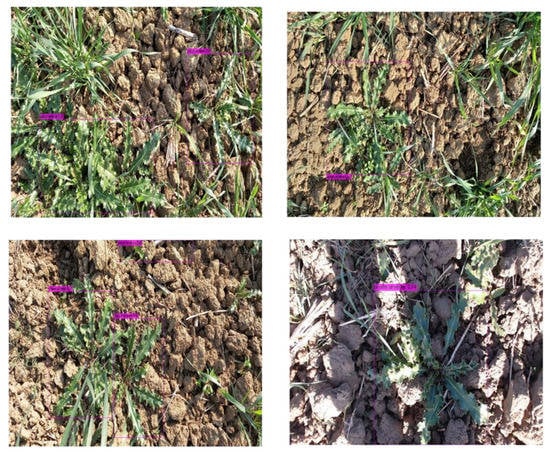
Figure 9.
Examples of Cirsium arvense for YOLOv4-Tiny Predictions.
4.3. Comparing the Performance of CNNs within TensorFlow and PyTorch
The accuracy, recollection, F1-score, and precision values for PyTorch were slightly higher than those for TensorFlow (Table 5 and Table 6). This indicates that PyTorch provides better enactment for huge convolutional and completely allied systems using GPU and Google Colab GPU. The maximum accuracies for PyTorch were 0.49, 0.53, and 0.51 (Table 5), and for TensorFlow were 0.97 and 0.96 (Table 7 and Figure 10 and Figure 11). There was no significant difference in performance between the PyTorch and TensorFlow frameworks for YOLOv5, YOLOv4-Tiny, and YOLOv3-Tiny’s inference speeds (Table 8).
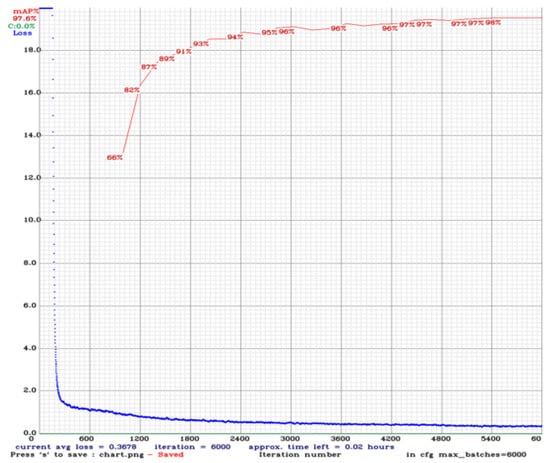
Figure 10.
Loss and Accuracy Graph of YOLOv4-Tiny.
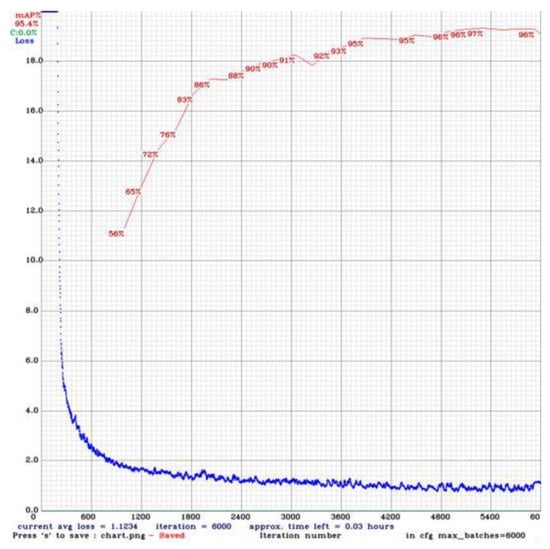
Figure 11.
Loss and Accuracy Graph for YOLOv3-Tiny.

Table 8.
Precision Recall and F1score values for weeds dataset using these models.
5. Conclusions and Future Work
The various DCNNs were effective, and verified using pictures of weeds collected using a mobile camera and Logitech HD camera in wheat crops. Three DCNN models, YOLOv5s, YOLOv5m, and YOLOv5l, were evaluated using the PyTorch framework. The YOLOv5l and YOLOv5m models were more effective than YOLOv5s, due to the base-on-model accuracy rate; conclusively, the Pytorch framework was better than the TensorFlow framework. All the DCNN models used in this study had results that showed better accuracies (i.e., 0.44, 0.49, and 0.39) regarding all the development phases of the weed shrubberies. However, all the models recorded the maximum accuracy of the dataset. All the models performed better with respect to inference speed within the PyTorch framework. Our findings for inference times showed that the DCNN models YOLOv5s, YOLOv5m, and YOLOv5l fulfil the requirements for real-time wildflower credentials in the wheat field. In this study, we achieved a good balance between accuracy and inference speed in the models’ real-time application for weed detection. All the results of the developed models in this study suggested that the DL models YOLOv5l, YOLOv5s, and YOLOv5m also preferred two DCNNs. Additionally, two DCNN models, YOLOv4-Tiny and YOLOv3-Tiny, were evaluated using the TensorFlow framework. The YOLOv4-Tiny was more effective than the YOLOv3Tiny due to the base-on model accuracy rate; therefore, the TensorFlow framework is better than the PyTorch framework. All the DCNN models used in this study showed better accuracies (0.97 and 0.96) at all stages of the growth of weed plants.
This study demonstrated that deep learning algorithms implemented through PyTorch outperformed implementations achieved with Tensorflow. This is because PyTorch gives deeper and more fine-grained controls (that increase its flexibility over that of TensorFlow), thus allowing better models and resulting in better accuracies. We concluded that our setup achieves a superior outcome concerning swiftness and precision compared to other networks such as YOLOv4. Image recognition is far more effective and efficient than more conventional methods of recognition. The NVIDIA RTX2070 GPU’s inference time per picture (640 × 640) was 9.43 milliseconds and 12.38 milliseconds, respectively, with the highest accuracy of unwanted plants along with wheat plants being 0.89 and 0.91, correspondingly. This also relates to autonomous crop-harvesting equipment.
In the future, the authors plan to extend their proposed weed detection work to other crops and regions for wider applicability. Furthermore, deep learning models with high prediction and detection accuracy could be integrated with variable rate technologies to provide real-time weed management solutions.
Author Contributions
S.I.U.H.: writing—original draft. M.N.T.: Supervision and Project administration. Y.L.: Visualization. All authors have read and agreed to the published version of the manuscript.
Funding
This work was supported by Data Driven Smart Decision Platform (PSDP-332), and Higher Education Commission of Pakistan. The authors would like to thank all researchers and students involved in this project for their assistance during the experiments.
Institutional Review Board Statement
Not applicable.
Informed Consent Statement
Not applicable.
Data Availability Statement
Not applicable.
Acknowledgments
The authors would like to thank the DDSDP project.
Conflicts of Interest
The authors declare no conflict of interest.
References
- World Health Organization; United Nations University. Protein and Amino Acid Requirements in Human Nutrition; World Health Organization: Geneva, Switzerland, 2019; Volume 935. [Google Scholar]
- Li, S.; Chen, N.; Li, F.; Mei, F.; Wang, Z.; Cheng, X.; Kang, Z.; Mao, H. Characterization of wheat homeodomain-leucine zipper family genes and functional analysis of TaHDZ5-6A in drought tolerance in transgenic Arabidopsis. BMC Plant Biol. 2020, 20, 50. [Google Scholar] [CrossRef] [PubMed]
- Khan, R.U. Integrated Plant Nutrition System Modules for Major Crops and Cropping Systems in Pakistan. Integr. Plant Nutr. Syst. Modul. Major Crops Crop. Syst. South Asia 2019, 176, 28. [Google Scholar]
- Ayugi, B.O.; Tan, G. Recent trends of surface air temperatures over Kenya from 1971 to 2010. Meteorol. Atmos. Phys. 2019, 131, 1401–1413. [Google Scholar] [CrossRef]
- Naqvi, S.M.Z.A.; Awais, M.; Khan, F.S.; Afzal, U.; Naz, N.; Khan, M.I. Unmanned air vehicle based high resolution imagery for chlorophyll estimation using spectrally modified vegetation indices in vertical hierarchy of citrus grove. Remote Sens. Appl. Soc. Environ. 2021, 23, 100596. [Google Scholar] [CrossRef]
- Gao, J.; French, A.P.; Pound, M.P.; He, Y.; Pridmore, T.P.; Pieters, J.G. Deep convolutional neural networks for image-based Convolvulus sepium detection in sugar beet fields. Plant Methods 2020, 16, 29. [Google Scholar] [CrossRef]
- Ying, B.; Xu, Y.; Zhang, S.; Shi, Y.; Liu, L. Weed Detection in Images of Carrot Fields Based on Improved YOLO v4. Traitement Du Du Signal 2021, 38, 341–348. [Google Scholar] [CrossRef]
- Zhao, K.; Ren, X. Small Aircraft Detection in Remote Sensing Images Based on YOLOv3. In IOP Conference Series: Materials Science and Engineering; IOP Publishing: Bristol, UK, 2019; Volume 533, p. 012056. [Google Scholar] [CrossRef]
- Tian, Y.; Yang, G.; Wang, Z.; Wang, H.; Li, E.; Liang, Z. Apple detection during different growth stages in orchards using the improved YOLO-V3 model. Comput. Electron. Agric. 2019, 157, 417–426. [Google Scholar] [CrossRef]
- Schumann, A.W.; Mood, N.S.; Mungofa, P.D.K.; MacEachern, C.; Zaman, Q.; Esau, T. Detection of Three Fruit Maturity Stages in Wild Blueberry Fields Using Deep Learning Artificial Neural Networks. In Proceedings of the 2019 ASABE Annual International Meeting, St. Joseph, MI, USA, 7–10 July 2019; p. 1. [Google Scholar]
- Samseemoung, G.; Soni, P.; Suwan, P. Development of a Variable Rate Chemical Sprayer for Monitoring Diseases and Pests Infestation in Coconut Plantations. Agriculture 2017, 7, 89. [Google Scholar] [CrossRef]
- Partel, V.; Charan Kakarla, S.; Ampatzidis, Y. Development and evaluation of a low-cost and smart technology for precision weed management utilizing artificial intelligence. Comput. Electron. Agric. 2019, 157, 339–350. [Google Scholar] [CrossRef]
- Oghaz, M.M.D.; Razaak, M.; Kerdegari, H.; Argyriou, V.; Remagnino, P. Scene and Environment Monitoring Using Aerial Imagery and Deep Learning. In Proceedings of the 15th International Conference on Distributed Computing in Sensor Systems (DCOSS), Santorini, Greece, 29–31 May 2019; pp. 362–369. [Google Scholar]
- Molina-Villa, M.A.; Solaque-Guzmán, L.E. Machine vision system for weed detection using image filtering in vegetables crops. Rev. Fac. De Ing. Univ. DeAntioq. 2016, 80, 124–130. [Google Scholar] [CrossRef]
- Hennessy, P.J.; Esau, T.J.; Farooque, A.A.; Schumann, A.W.; Zaman, Q.U.; Corscadden, K.W. Hair Fescue and Sheep Sorrel Identification Using Deep Learning in Wild Blueberry Production. Remote Sens. 2021, 13, 943. [Google Scholar] [CrossRef]
- Aitkenhead, M.J.; Dalgetty, I.A.; Mullins, C.E.; McDonald, A.J.S.; Strachan, N.J.C. Weed and crop discrimination using image analysis and artificial intelligence methods. Comput. Electron. Agric. 2003, 39, 157–171. [Google Scholar] [CrossRef]
- Elstone, L.; How, K.Y.; Brodie, S.; Ghazali, M.Z.; Heath, W.P.; Grieve, B. High speed crop and weed identification in lettuce fields for precision weeding. Sensors 2020, 20, 455. [Google Scholar] [CrossRef] [PubMed]
- Hameed, S.; Amin, I. Detection of weed and wheat using image processing. In Proceedings of the 2018 IEEE 5th International Conference on Engineering Technologies and Applied Sciences (ICETAS), Bangkok, Thailand, 22–23 November 2018; IEEE: Piscataway, NJ, USA, 2019; pp. 1–5. [Google Scholar]
- Bah, M.D.; Hafiane, A.; Canals, R. Deep learning with unsupervised data labeling for weed detection in line crops in UAV images. Remote Sens. 2018, 10, 1690. [Google Scholar] [CrossRef]
- Pereira, P.C., Jr.; Monteiro, A.; von Wangenheim, A. Weed Mapping on Aerial Images; Santa Catarina, Brasil, 2019. [Google Scholar]
- Bannerjee, G.; Sarkar, U.; Das, S.; Ghosh, I. Artificial intelligence in agriculture: A literature survey. Int. J. Sci. Res. Comput. Sci. Appl. Manag. Stud. 2018, 7, 1–6. [Google Scholar]
- Gharde, Y.; Singh, P.K.; Dubey, R.P.; Gupta, P.K. Assessment of yield and economic losses in agriculture due to weeds in India. Crop Prot. 2018, 107, 12–18. [Google Scholar] [CrossRef]
- Osorio, K.; Puerto, A.; Pedraza, C.; Jamaica, D.; Rodríguez, L. A Deep Learning Approach for Weed Detection in Lettuce Crops Using Multispectral Images. AgriEngineering 2020, 2, 471–488. [Google Scholar] [CrossRef]
- Jocher. YOLO v4 or YOLO v5 or PP-YOLO? Available online: https://towardsdatascience.com/yolo-v4-or-yolo-v5or-pp-yolo-dad8e40f7109 (accessed on 9 June 2020).
- Badeka, E.; Kalampokas, T.; Vrochidou, E.; Tziridis, K.; Papakostas, G.A.; Pachidis, T.P.; Kaburlasos, V.G. Vision-based vineyard trunk detection and its integration into a grapes harvesting robot. Int. J. Mech. Eng. Rob. Res. 2021, 10, 374–385. [Google Scholar] [CrossRef]
- Yan, B.; Fan, P.; Lei, X.; Liu, Z.; Yang, F. A Real-Time Apple Targets Detection Method for Picking Robot Based on Improved YOLOv5. Remote Sens. 2021, 13, 1619. [Google Scholar] [CrossRef]
- Liu, J.; Wang, X. Tomato Diseases and Pests Detection Based on Improved Yolo V3 Convolutional Neural Network. Front. Plant Sci. 2020, 11, 898. [Google Scholar] [CrossRef]
- Hasan, A.S.M.M.; Sohel, F.; Diepeveen, D.; Laga, H.; Jones, M.G.K. A survey of deep learning techniques for weed detection from images. Comput. Electron. Agric. 2021, 184, 106067. [Google Scholar] [CrossRef]
Disclaimer/Publisher’s Note: The statements, opinions and data contained in all publications are solely those of the individual author(s) and contributor(s) and not of MDPI and/or the editor(s). MDPI and/or the editor(s) disclaim responsibility for any injury to people or property resulting from any ideas, methods, instructions or products referred to in the content. |
© 2023 by the authors. Licensee MDPI, Basel, Switzerland. This article is an open access article distributed under the terms and conditions of the Creative Commons Attribution (CC BY) license (https://creativecommons.org/licenses/by/4.0/).