Abstract
In the last decades, the use of structural glass has increased exponentially. The reliability of brittle structural glass elements is considerably improved if laminated glass elements are chosen because, in this case, a redistribution of internal forces is permitted once a limited breakage occurs. Thus, instead of monolithic glass, composite materials consisting of two or more glass plies bonded together using a polymeric film as an interlayer are used. In the event of glass failure, because of the chemical bond between the different materials, the adhesion to the interlayer prevents glass fragments from scattering. To design structural elements, the definition of the mechanical features of the interlayer is necessary. However, several standards and techniques can be applied, considering the characterization of either the interlayer itself or the laminated glass. The paper reviews the main existing methods and focuses on the standard suggested by the CEN/TS 19100:2021, analyzing in detail the effect of the different parameters involved. A numerical model is presented to account for the effect of the stress level, glass, and interlayer thickness. Although the standard leaves a certain degree of freedom in choosing those parameters, in some cases the results can differ.
1. Introduction
Over the past decades, the demand for complex transparent architecture considerably increased due to the aesthetic requirements and the improvement of the safety level owing to the increased knowledge of the mechanical properties of the materials [1]. Structural glass is a composite material obtained through the process of lamination by joining, at high pressure and temperature, glass plies and polymer films. Laminated glass (LG) combines the high stiffness, compressive strength, and environmental durability of the glass with the ability of the interlayer to bond the glass plies. LG has been proven to be a valuable solution to fulfill the fail-safe approach according to the requirements of standards and codes [2,3,4,5]. Indeed, the interlayer of LG has the ability to retain glass shards in case of failure reducing the risk of injury, and depending on the type of glass/interlayer, a noticeable post-failure strength can be achieved [6,7].
The design of structural elements is challenging and involves several problems [8,9] related to the structural response of the composite material “laminated glass”. The experimental evidence can be the basis of theoretical validations to define constitutive bonds to be used in a model calibration on the base of simple relaxation tests on laminated glass specimens [10,11].
Owing to the spread of glass structures and non-structural elements [7,8,9,10,11,12,13,14,15,16], many new interlayer materials have been developed and patented to improve the overall behavior, since the interlayer properties affect the performances at different limit states and under different temperature and load duration.
Starting from the first polyvinyl butyral (PVB) interlayer (which is currently still the most popular) [17,18,19], new formulations such as ethylene vinyl acetate (EVA), SentryGlas (SG), and a plasticized PVB (known as DG41) have been developed.
The mechanical properties of the interlayers have been improved over the years both in terms of stiffness and long-term properties at different temperatures. Indeed, these polymers are viscoelastic materials characterized by a relatively low stiffness which is strongly affected by the service temperature and by the load duration [1,18,19,20]. These properties strongly affect the behavior of the LG, which can behave as a monolithic element or as a layered element, in case of lack of collaboration between glass plies. Therefore, the definition of the interlayer properties is of primary concern to assess the displacement at the serviceability state, the resistance at the ultimate limit state, and the residual capacity at the collapse limit state.
However, the experimental assessment of the mechanical properties is not straightforward because it requires the evaluation of the constitutive law of the interlayer, which, in principle, should be evaluated on the pure material. However, the lamination process (at high temperatures and pressure) alters the properties of the material itself; therefore, the properties of the interlayer must be evaluated under its conditions of use (in laminated glass). Therefore, several test procedures have been developed over the years considering either only the interlayer or the LG [21]. At the standard level, the most dated documents refer to interlayer tests (ASTM D638 [22] and ISO 6721-1 [23]), while recently the standard EN16613:2019 [24] has been adopted at the European level and presents three different test methods to be adopted depending on the type of the interlayer.
The ASTM D638 [22] and the ISO 6721-1 [23] are standards developed for plastics, and thus do not account for the lamination process. Due to this reason, several researchers [25,26,27,28,29,30,31,32,33,34,35,36,37,38,39] have proposed different test methods to assess the mechanical properties of the interlayer in the laminated glass. However, these different procedures are still at the research level and have not been standardized.
The paper summarizes the main test methods proposed in the literature, discussing the advantages and disadvantages of each procedure, as well as considering the stress distribution generated by the test configuration. The procedure proposed by Serafinavičius et al. [30] and by Valarinho et al. [31] has been adopted by the European standard EN 16613:2019 [24]; nevertheless, it does not include strict prescriptions on the test’s parameters.
Therefore, after a brief review of the available experimental methods for evaluating the mechanical properties of plastic interlayers, since the EN 16613:2019 [24] is proposed by the new design document CEN/TS 19100:2021 [2,3,4], the paper focuses on the procedure presented in that standard and analyzes the effect of the main parameters (interlayer and glass thickness and load level) on the evaluation of the shear modulus. Based on the obtained results, some suggestions to properly assess the mechanical properties of glass interlayers are presented. These outcomes will be useful for the designers to properly assess the laminated glass mechanical response at the serviceability and ultimate limit state.
2. Test Methods for LG Interlayers Characterization
Over the last years, many procedures have been developed and they can be classified in different ways, namely based on:
- (i)
- Type of specimen: only interlayer or laminated glass;
- (ii)
- Type of load: static or dynamic;
- (iii)
- Type of stress: tension or shear;
- (iv)
- Duration of load: instantaneous or creep behavior;
- (v)
- Temperature effects: test conducted at different temperatures or at ambient temperature.
Although the characteristics of the interlayer itself are very important (e.g., evaluated according to ISO 6721-1), the process of lamination at high pressure/temperature could change the mechanical properties of the material [21,25]. For this reason, to evaluate the shear modulus, which is the most important parameter to assess the structural behavior of LG, laminated specimens should be preferred. In addition, for design purposes, both creep and temperature effects are crucial. Therefore, designers need the shear modulus under different conditions (e.g., wind gust load, snow load).
The main test procedures available in the literature are summarized in Table 1, on the basis of the above-mentioned classifications.

Table 1.
Summary of test methods to determine the mechanical properties of interlayers.
More details about the tests listed in Table 1 are discussed, considering the numerical simulation to show the state of stress in the interlayers in each case. In all cases, the float glass and PVB were adopted. The float glass was modeled using an eight-node linear brick, incompatible elements (C3D8I), and an eight-node three-dimensional cohesive element (COH3D8) was adopted to model the viscoelastic behavior of PVB. The adopted values of the mechanical properties of the glass and interlayer are reported in Section 3.2.1. It should be noted that ABAQUS/Explicit was used for the analysis of the case of the uniaxial tensile test and dynamic torsion tests due to the fact that in such tests, displacement (or angle) control was adopted and it is much easier to use ABAQUS/Explicit to define quasi-static condition or dynamic condition by changing the applying time, and static/linear perturbation was adopted to analyze the modal tests. ABAQUS/Standard was applied in other cases.
The numerical simulation was conducted to show the stress distribution in the interlayer under the diverse test setups. The different stress fields obtained were illustrated accordingly to show: (i) the normal stress (tensile) for tensile tests (Section 2.1 and Section 2.2); (ii) the Von Mises stress to describe the stress distribution of specimens under torsion, because the interlayer was under a complex stress state (not uniaxial state or under pure shear dominated state); (iii) the shear stress in other cases, because the shear stress is the fundamental component in these cases.
2.1. Uniaxial Tensile Tests of Interlayers
The uniaxial tensile test is a simple method in which a dog-bone specimen of the interlayer is subjected to direct tension according to ASTM D638 [22]. Three different displacement rates were adopted in the simulation: (1) 5 (2) 50 (3) 500 mm/min. It evaluates Young’s modulus, and the shear modulus is calculated by assuming a value of the Poisson’s ratio. However, it does not consider the effect of delayed deformation and of the temperature. An example of the stress distribution is shown in Figure 1a, where the specimen was designed following existing literature [20], and the thickness of the specimen was . The shell element (S4R) was selected to model the behavior of interlayers under tension. The specimen was fixed at one end and loaded under the constant displacement rate of (with the strain rate of ) at the other end in this study. The load can be obtained and the stress can be derived by dividing the load by the area of the cross-section. The results show that, in the elastic range, the stress distribution is homogeneous in the gauge length (Figure 1a). The uniaxial tensile test is the most widely applied test method to characterize the stress-strain relationship of interlayers under tension.
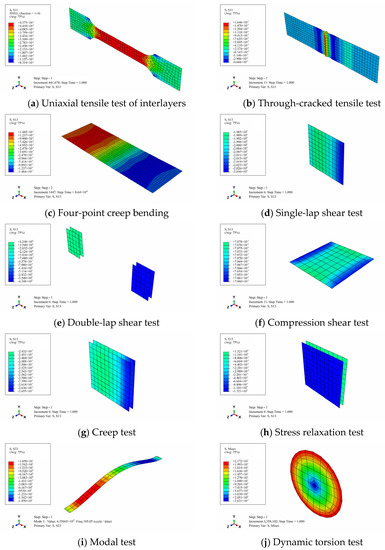
Figure 1.
Stress distribution in the different test setups.
In addition, the influence of strain rates ( to ) and temperature ( to ) on the tensile behavior of interlayers are also studied [44].
2.2. Through-Cracked Tensile Tests
The simulation of the through-cracked tensile was carried out according to the geometries of the specimens and loading procedures adopted by Chen et al. [29]. The specimens were 200 mm in length, 50 mm in width, with a configuration of two 5 mm float glass sandwiching one 1.52 mm thick PVB interlayer. The pre-cracking process of the specimen was made in the middle of the specimen before the tests. The specimen was fixed at one end and quasi-static loaded 300 N under uniaxial tension at the other end. The shear stress can be obtained by the applied load divided by the shear area. The results show that there is concentrated stress at the pre-crack region in the interlayers because there is a decrease of stiffness at that cross-section (Figure 1b). It should be noted that delamination was observed in such test, which would make it more difficult to define the strain in the interlayer.
2.3. Four-Point Creep Bending
The four-point creep bending was conducted following the procedures illustrated in Section 3.1. The laminated glass plate was manufactured by two 8mm-thick floating glass and 0.76 mm-thick interlayer, with the length of 1100 mm and the width of 360 mm. The tests were conducted under a total applied force of 1150 N with simply-supported boundary condition for 24 h at the temperature of 20 °C. The time history can be obtained and the shear modulus can be derived according to EN 16613:2019 [24]. The stress analysis suggests that the stress distribution is not homogeneous in the interlayer, with the stress gradually increasing from the mid-span to the support (Figure 1c).
2.4. Single-Lap Shear Tests
The single-lap shear test was simulated according to the dimensions of the specimen and loading procedures adopted by Hana [32,33]. The specimen was made of two 10 mm-thick float glass bonded by 0.76 mm-thick PVB interlayer, with the shear area of 50 × 50 mm. During the test, the lower glass ply was fixed with the clamp and the load was applied on the upper glass ply, while a couple of equivalent opposite static loads of 5000 N was applied to the upper and lower plies during the simulation (as shown the corresponding case in Table 1). The shear stress can be obtained by dividing the applied load by the shear area. The results show the homogeneous stress distribution in the interlayer, with the variation within 5% (Figure 1d). However, the specimen was under a couple of forces, acting in opposite directions, which would lead to the interlayer not only under shear but also bending moment, although the moment was limited due to the short lever arm. Overall, the relationship between shear stress and shear strain can be obtained, and the initial secant shear modulus can also be determined.
2.5. Double-Lap Shear Test
The double-lap specimen [34,35] was made of 10 mm-thick float glass plies bonded by 1.52 mm-thick PVB interlayers. The specimens were loaded with a couple of equivalent opposite static loads of 20 kN on the side surface of the middle glass plies (as shown the corresponding case in Table 1). The shear stress can be obtained by dividing the applied load by the shear area. The results show the homogeneous stress distribution in the interlayer, with a variation of 2% (Figure 1e).
2.6. Compression Shear Tests
The compression shear tests were conducted with the LG specimens, which consisted of two 6 mm-thick glass plies and one 0.76 mm-thick PVB interlayer. Considering both the upper and lower surfaces of the specimen was fixed by the test setup (as shown the corresponding case in Table 1), the constrain ‘tie’ was adopted to characterize the behavior of surfaces between the specimen and the test setup. A total force of 2.5 kN was applied vertically at the top of the test setup, which would transfer to shear forces into the specimens. And the shear stress can be obtained by dividing the applied load by the shear area. The simulation results show the homogeneous stress distribution in the interlayer, with the variation within 1% (Figure 1f).
2.7. Creep Tests
The simulation of the creep tests was carried out according to the previous literature [27]. The specimens were made of 10 mm-thick glass plies bonded by 1.52 mm-thick PVB interlayers, with the shear area of 100 × 100 mm in each side. The creep load of 5 kN was applied horizontally at the center of the middle glass ply to reproduce an average shear stress of , while the other sides of the other two outer glass plies were fixed (as shown the corresponding case in Table 1). The time history of deformation was captured. The simulation results show the homogeneous stress distribution in the interlayer, with a variation of 9% (Figure 1g). Furthermore, the shear modulus at a given temperature can be derived based on Prony series [11], and this can be generalized to a wider time range through time–temperature superposition principle (TTSP) [11,45].
2.8. Stress Relaxation Tests
The simulation of the stress relaxation tests was carried out referring to [37]. The specimens were made of 10 mm-thick glass plies bonded by 1.52 mm-thick PVB interlayers, with a shear area of 100 × 100 mm on each side. The load of 25 kN was applied horizontally at the center of the middle glass ply to reproduce the shear stress of around , while the other sides of the other two outer glass plies were fixed. The time history of the load was captured. The simulation results show the homogeneous stress distribution in the interlayer, with a variation of 2% (Figure 1h). Through such tests, the master curves can be built to evaluate the long-term mechanical behavior of interlayers.
2.9. Modal Tests
The specimen was designed according to the geometry adopted in the previous literature [38]. The laminated glass beam has a length of 1000 mm, and a width of 100 mm, which consists of two 6 mm-thick float glass coupling with 0.76 mm-thick interlayer. The natural frequency analysis of the beam was carried out under the free-free boundary condition, and the natural frequency of such specimens was obtained. The simulation results indicate that the stress is distributed as the propagation of the wave, which shows a non-homogeneous distribution (Figure 1i).
2.10. Dynamic Torsion Tests
The dynamic torsion tests were simulated according to the specimens and test procedures adopted by Andreozzi et al. [39]. The cylinder specimen was made of two 8 mm-thick glass panes bonded by 1.52 mm-thick PVB interlayers. The angular velocity of 0.1 rad/s was applied on one side of the specimen while the other side was fixed during the simulation. Dynamic tests that could measure the viscoelastic properties for times of the order of 10−4 are usually conducted on polymeric material. In this case, significant uncertainties might affect the experimental characterization because the bonding process of the glass plies to the polymeric interlayers changes the mechanical properties of the original polymer.
In any case, dynamic tests on LG beams at very high frequencies are not feasible because the forces of inertia would give results that can be difficult to interpret.
The simulation shows the stress is not homogeneous, with the stress distribution increasing from the center to the surrounding (Figure 1j).
Overall, the advantages and the disadvantages of the test methods shown in Table 1 have been summarized in Table 2, considering the feasibility, the stress distribution, and the time-dependent behavior of interlayers.
Table 2.
Advantage and disadvantage of each test method.
In addition to the test methods mentioned above to characterize the mechanical properties of interlayers, V-notched shear tests [46], and tensile shear tests on small cylindrical button-shaped specimens [47] were also adopted to study the shear modulus of interlayers and other factors which would influence the mechanical behavior of interlayers, e.g., humidity [48] and aging conditions [35], were also investigated.
Overall, the test methods listed above can be classified into three categories: (i) quasi-static test [20,26,27,28,29,30,31,32,33,34,35,36], which does not consider the time-dependent behavior; (ii) long-term tests [27,37], which investigates the influence of time on the mechanical behavior of interlayers. (iii) characterizing the behavior of interlayers in frequency domain, which is dependent on the responses of specimens under a sinusoidal load. A generalized Maxwell model [43], and Prony series [11] are adopted to define the viscoelastic behavior at a given temperature, and TTSP is applied to widen the time domain in the last two cases.
3. Evaluation of Interlayer Properties According to EN 16613:2019
The recent document CEN/TS 19100:2021 [2,3,4] is a great step towards the common application of structural glass. This technical document suggests assessing, the properties of the interlayer according to the EN16613:2019 [24]. The standard prescribes dynamic tests according to ISO 6721 [23]. For non-isotropic material or for interlayers which cannot be formed into small pieces four-point creep bending test should be conducted. However, the test procedure defined in EN16613—Annex A does not define some parameters such as the glass and the interlayer thickness and the stress to be applied. In particular, the standard suggests a load level to achieve at least a stress of 10 MPa (without an upper limit) and the total thickness of the specimen should be higher than 10 mm (again without a limit and without distinction between glass and thickness interlayer). To assess the influence of those parameters, numerical parametric analyses were performed. The numerical model was validated based on experimental data.
3.1. Experimental Research
Experimental tests were conducted according to EN16613—Annex A [24] under the four-point bending configuration (Figure 2). The laminated glass plates were manufactured by two float glass plies (thickness 8 mm) with PVB interlayer (thickness 0.76 mm), with the size of and (Figure 2) and total thickness . The distance between the central lines of supporting rollers was , and the distance between the central lines of upper bending rollers was 200 mm. The tests (3 specimens) were conducted at a room temperature of 20 °C. A dead load () of 1150 N was applied for 24 h, while the midspan displacement was measured with an LVDT, continuously acquiring with a sampling rate of 50 Hz for the first 20 min and then with a sampling of 5 Hz (Figure 2). Figure 3 shows the time-displacement curve, which was used to validate the numerical model in Section 3.2.3. According to standard prescription, the response of the specimen which exhibited the maximum displacement was considered.
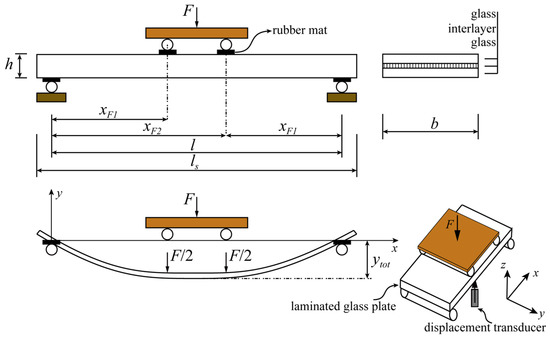
Figure 2.
Test setup.
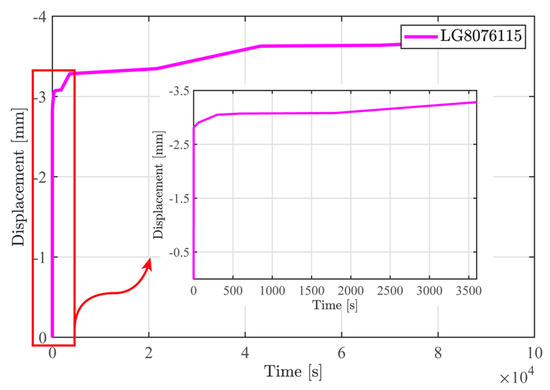
Figure 3.
Test result of bending creep test within 86,400 s.
3.2. F.E.M. Modeling
The finite element (FE) software ABAQUS was employed to conduct the numerical analyses. There are three main aspects to be considered to simulate the creep bending response of LGs. These are:
- (i)
- Constitutive assumptions of the materials (Section 3.2.1), in particular the viscoelastic behavior of interlayers;
- (ii)
- The numerical model (finite element type, mesh, boundary conditions, and the load application (Section 3.2.2);
- (iii)
- Validation of the finite element model established with the experimental results (Section 3.2.3).
3.2.1. Materials
Glass is an elastic-brittle material for which density (), elastic modulus (), strength (), and Poisson’s ratio of glass () were assumed as , , , and 0.23, respectively.
For the interlayer, a viscoelastic constitutive law with formerly derived material parameters was adopted to characterize the behavior of PVB. The domain of influence (DOI) method [49] was employed to approximate the Prony Series coefficients and exponents of PVB, because this method allows fine-tuning a fitting algorithm with a fixed number of coefficients. And the shear relaxation modulus () and relaxation time () were obtained through the relationship between the shear modulus () and applied time (), and shown in Table 3.
Table 3.
Prony series of PVB.
3.2.2. Finite Element Type, Mesh, Boundary Conditions, and Load Application
The float glass plies were modeled using eight-node linear brick, incompatible elements (C3D8I). Because of their removed shear locking and much reduced volumetric locking, linear elements of C3D8I can be subjected to bending. The fine mesh size was 8 mm in the y and z direction, and 20 mm in the x direction (Figure 2), respectively.
An 8-node three-dimensional cohesive element (COH3D8) was selected to model the behavior of PVB. Considering the glass plies remained in the elastic range during the whole tests, a finite-thickness adhesive layer model was used, based on a continuum-based constitutive response. The cohesive element connected two neighboring glass plies and they matched meshes. As a result, they were connected by sharing nodes.
To improve the calculation efficiency, the boundary conditions and load application were simplified. The displacement along the three axes was constrained at one bottom support. At the other support, only the displacement along the z-axis and y-axis was constrained (Figure 2).
A loading point was defined to apply the load (1150 N). That point was coupled with the two lines where the upper rollers were located.
3.2.3. Validation of the Finite Element Model
To support the development of appropriate numerical model, detailed experimental data is needed for validation. The time history of the plate deflection obtained from the experiment and the numerical model was examined.
Figure 4 shows the time history of deformation of the LGs in the range of 0–86,400 s, obtained experimentally (magenta line) and numerically (blue line). The deformation of the specimen increases slowly from 3.04 to 3.65 mm during the whole simulation. The deformation tends to be constant over 65,000 s. The quantitative comparison in Figure 3 shows a very good correlation (coefficient of determination ) for the experimental and numerical time-deflection histories. Therefore, the numerical model can well describe the experimental response with time of the tested plates. Based on this numerical model, an investigation of the influence of the glass thickness, the interlayer thickness, and the loading scenario on the bending creep behavior was carried out.
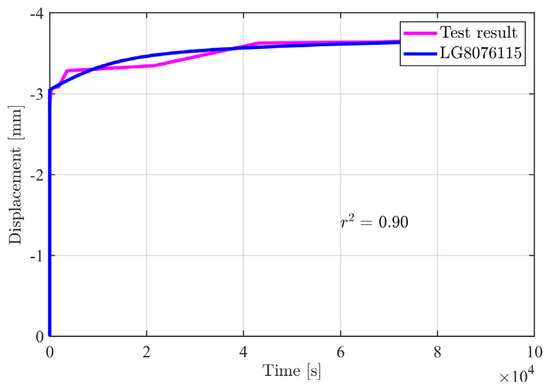
Figure 4.
Validation of the numerical model.
3.3. Parametric Analyses
Three glass thicknesses (5, 8, 10 mm), two interlayer thicknesses (0.76, 1.52 mm), and three different loading levels (600, 1150, 1800 N) were considered.
Designation of the specimen is given according to the following ID tag, LG-5/8/10-076/152-060/115/180, where the first two capital letters ‘LG’ indicate the specimens made by laminated glass, the second serial numbers (5, 8, or 10) indicate the thickness of the glass ply, the third serial numbers (076, 152) indicate the thickness of the interlayer, and the last numbers (060, 115, 180) indicate the different load levels.
The numerical analyses allowed the displacements at midspan for each configuration to be evaluated (Figure 5). The results indicate, as expected, that the displacements decrease by increasing the glass or by decreasing the load.
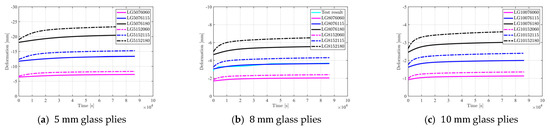
Figure 5.
Midspan displacement vs. time curves.
According to the standard procedure, the interlayer shear modulus can be evaluated on the basis of the measured displacement at different load duration to allow designers to assess safety under different actions. Figure 5 shows that the thickness of the interlayer, has a strong influence on the response in case of sustained load, especially under a large load. However, a short time this difference is limited. Hence, the displacements at 86,400 s (24 h) were considered to evaluate the influence of the parameters under investigation. Table 4 reports for each case the deflection, the equivalent monolithic glass thickness (), the shear transfer coefficient ω, and the shear modulus of the interlayer .
Table 4.
Main results.
The equivalent monolithic glass thickness is a theoretical thickness of a monolithic glass that accounts for the deflection under load and is evaluated with the formula [24]:
where:
is the applied force (600, 1150, or 1800 N),
is the self-weight of the LG plate in the form of a line load equal to ,
is the width of the beam in the unit of ,
is the midspan deflection.
The shear transfer coefficient ω is evaluated with the relation:
where , are the thickness of the glass ply, and the distance between the centroid of the k-glass ply and the centroid of the LG ply, respectively.
Furthermore, the interlayer shear modulus can be evaluated by inverting the Wölfel–Bennison equation [5,50,51] as:
where is the interlayer thickness, is the distance between the mid-plane of the glass plies, and (moment of inertia per unit length) can be expressed as:
Therefore, the shear modulus () can be determined through Equation (3), with the known parameters, as follows:
The results indicate that the stress level (for the considered range) does not influence the shear modulus, while it increases by increasing the thickness of the glass and by decreasing the thickness of the interlayer. This tendency is shown in Figure 6, where the normalized shear modulus (defined as the ratio between the shear modulus and the reference shear modulus of the specimen LG5076060) is plotted as a function of the thickness of the glass ply. The glass thickness appears to be the parameter that mostly affects the results, with an increase up to about 80% of the shear modulus when considering glass ply of 10 mm instead of 5 mm. The variation related to the interlayer thickness is not negligible (about 20%) but is limited with respect to the effect of the glass thickness.
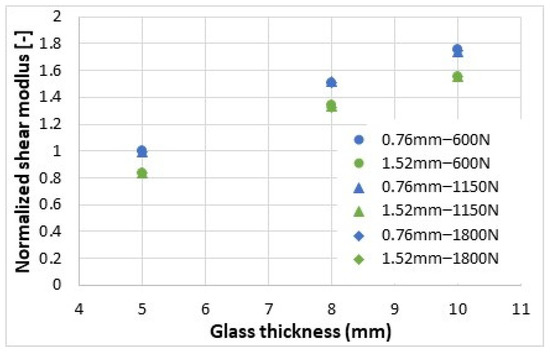
Figure 6.
Normalized shear modulus vs. glass thickness.
Therefore, these numerical results suggest that the geometry of the specimen can affect the evaluation of the properties of the interlayer and consequently provide a not always reliable assessment for use in a prediction of a correct stress field in a laminated glass plate.
4. Conclusions
After a presentation of the methods proposed by standards or different authors, the paper presents experimental and numerical research on the method suggested by the European Standard: EN16613—Annex A on the experimental characterization of the polymeric interlayers used in glass lamination. Test methods adopted from previous literature to determine the mechanical properties of interlayers were also summarized. A stress analysis was conducted which demonstrated that some experimental methods induce a non-uniform stress field in the interlayer. Consequently, an appropriate analysis of the experimental results is required.
Although the four-point bending test method according to EN16613 does not generate a uniform stress field, it has great advantage that it is very simple and easy to perform, it accounts for the long-term behavior, and can be conducted at different temperatures. However, the analyses have shown that the experimental data seem to be affected by geometric features (both thickness of the glass and of the interlayer) and/or load level, not clearly defined in the standard.
Consequently, it is highly recommended to include additional provisions in the standard EN16613, defining a fixed glass thickness (e.g., ) and suggesting testing the interlayer with the higher thickness as defined by the interlayer producer to obtain the lower value of the shear modulus.
In addition, the following requirements should be considered to define the mechanical properties: (i) the shear coupling not the tensile strength of interlayers should be obtained, (ii) the shear stress should be uniform, (iii) the specimens should be prepared as simple as possible, (iv) the thermal-state and moisture should be easy to control, (v) the interlayer should be laminated into the glass plies, (vi) different temperatures should be considered, (vii) long-term behavior should be obtained.
Overall, the test proposed by EN16613 does not meet all the above-mentioned factors but could be a good compromise between easiness of execution and reliable results, accounting for the outcome of this research which highlights that some geometrical parameters influence the test results, and thus should be directly defined in the standard.
Author Contributions
Conceptualization, S.C. and L.B., methodology, S.C. and L.B., software, S.Z., validation, S.C., L.B., and S.Z., formal analysis, S.C., L.B., and S.Z., investigation, S.C. and S.Z., resources, S.C., data curation, S.C. and S.Z., writing—original draft preparation, S.Z. and S.C., writing—review and editing, S.C. and L.B., visualization, S.Z. and S.C., supervision, S.C. and L.B., project administration, S.C. and L.B., funding acquisition, S.C. and L.B. All authors have read and agreed to the published version of the manuscript.
Funding
This research received no external funding.
Institutional Review Board Statement
Not applicable.
Acknowledgments
Special thanks are due to Roberto Minerva and Daniele Spinelli (Materials Testing Laboratory, Politecnico di Milano) who supervised in setting up the experimental apparatus and performing the tests.
Conflicts of Interest
The authors declare no conflict of interest.
References
- Piscitelli, L.R. Serviceability and Post-Failure Behaviour of Laminated Glass Structural Elements; Firenze University Press: Florence, Italy, 2019. [Google Scholar]
- CEN/TS 19100-1:2021-11; Design of glass structures: Part 1: Basis of Design and Materials. European Committee for Standardization: Brussels, Belgium, 2021.
- CEN/TS 19100-2:2021-11; Design of glass structures: Part 2: Design of out-of-Plane Loaded Glass Components. European Committee for Standardization: Brussels, Belgium, 2021.
- CEN/TS 19100-3:2021-11; Design of glass structures: Part 3: Design of in-Plane Loaded Glass Components and Their Mechanical Joints. European Committee for Standardization: Brussels, Belgium, 2021.
- Italian National Council—CNR DT 210 Guide for the Design, Construction and Control of Buildings with Structural Glass Elements. 2013. Available online: https://www.cnr.it/en/node/3843 (accessed on 21 June 2023).
- Biolzi, L.; Cattaneo, S.; Orlando, M.; Spinelli, P. Post-failure behavior of laminated glass beams using different interlayers. Compos. Struct. 2018, 202, 578–589. [Google Scholar] [CrossRef]
- Foraboschi, P. Optimal design of glass plates loaded transversally. Mater. Des. (1980–2015) 2014, 62, 443–458. [Google Scholar] [CrossRef]
- Jóźwik, A. Introduction to structural design of glass according to current European standards. Arch. Civ. Eng. 2022, LXVIII-2, 147–170. [Google Scholar]
- Kuntsche, J.; Schuster, M.; Schneider, J. Engineering design of laminated safety glass considering the shear coupling: A review. Glass Struct. Eng. 2019, 4, 209–228. [Google Scholar] [CrossRef]
- Viviani, L.; Di Paola, M.; Royer-Carfagni, G. Fractional viscoelastic modeling of laminated glass beams in pre-crack state under explosive loads. Int. J. Solids Struct. 2022, 248, 111617. [Google Scholar] [CrossRef]
- Ferry, J.D. Viscoelastic Properties of Polymers, 3rd ed.; John Wiley & Son: New York, NY, USA, 1980. [Google Scholar]
- Centelles, X.; Ramon Castro, J.; Cabeza, L.F. Experimental results of mechanical, adhesive and laminated connections for laminated glass elements—A review. Eng. Struct. 2019, 180, 192–204. [Google Scholar] [CrossRef]
- Bez, A.; Bedon, C.; Manara, G.; Amadio, C.; Lori, G. Calibrated numerical approach for the dynamic analysis of glass curtain walls under spheroconical bag impact. Buildings 2021, 11, 154. [Google Scholar] [CrossRef]
- Yin, F.; Liu, M.; Bai, Y.; Zhang, Y.; Yang, L. Experimental study on failure mechanism of point-supported tempered glass panels under fire conditions. Structures 2021, 30, 495–502. [Google Scholar] [CrossRef]
- Bedon, C.; Fasan, M. Reliability of field experiments, analytical methods and pedestrian’s perception scales for the vibration serviceability assessment of an in-service glass walkway. Appl. Sci. 2019, 9, 1936. [Google Scholar] [CrossRef]
- Biolzi, L.; Bonati, A.; Cattaneo, S. Laminated Glass Cantilevered Plates under Static and Impact Loading. Adv. Civ. Eng. 2018, 2018, 7874618. [Google Scholar] [CrossRef]
- Duser, A.V.; Jagota, A.; Bennison, S.J. Analysis of glass/polyvinyl butyral laminates subjected to uniform pressure. J. Eng. Mech. 1999, 125, 435–442. [Google Scholar] [CrossRef]
- Hooper, P.A.; Blackman, B.R.K.; Dear, J.P. The mechanical behaviour of poly (vinyl butyral) at different strain magnitudes and strain rates. J. Mater. Sci. 2012, 47, 3564–3576. [Google Scholar] [CrossRef]
- Stevels, W.; D’Haene, P.; Zhang, P.; Haldeman, S. A comparison of different methodologies for PVB interlayer modulus characterization. Challenging Glass Conf. Proc. 2016, 5, 399–410. [Google Scholar]
- Centelles, X.; Martín, M.; Solé, A.; Ramon Castro, J.; Cabeza, L.F. Tensile test on interlayer materials for laminated glass under diverse ageing conditions and strain rates. Constr. Build. Mater. 2020, 243, 118230. [Google Scholar] [CrossRef]
- Ranocchiai, G.; Zulli, F.; Andreozzi, L.; Fagone, M. Test methods for the determination of interlayer properties in laminated glass. J. Mater. Civ. Eng. 2017, 29, 04016268. [Google Scholar]
- ASTM D638; Standard Test Method for Tensile Properties of Plastics. ASTM International: West Conshohocken, PA, USA, 2002.
- EN. 6721-1:2019; Plastics—Determination of Dynamic Mechanical Properties—Part 1: General Principles. International Organization of Standardization: Geneva, Switzerland, 2019.
- EN 16613:2019; Glass in Building-Laminated Glass and Laminated Safety Glass-Determination of Interlayer Mechanical Properties. European Standard: Brussels, Belgium, 2019.
- Centelles, X.; Pelayo, F.; Lamela-Rey, M.J.; Cabeza, L.F. Viscoelastic characterization of seven laminated glass interlayer materials from static tests. Constr. Build. Mater. 2021, 279, 122503. [Google Scholar] [CrossRef]
- Biolzi, L.; Cattaneo, S.; Rosati, G. Progressive damage and fracture of laminated glass beams. Constr. Build. Mater. 2010, 24, 577–584. [Google Scholar] [CrossRef]
- Biolzi, L.; Cagnacci, E.; Orlando, M.; Piscitelli, L.; Rosati, G. Long term response of glass–PVB double-lap joints. Compos. Part B Eng. 2014, 63, 41–49. [Google Scholar] [CrossRef]
- Nawar, M.; Salim, H.; Lafta, M.; Elshihy, A. Quasi-static performance of interlayer systems for laminated glass. J. Mater. Civ. Eng. 2016, 28, 04015084. [Google Scholar] [CrossRef]
- Chen, S.; Chen, Z.; Chen, X.; Schneider, J. Evaluation of the delamination performance of polyvinyl-butyral laminated glass by through-cracked tensile tests. Constr. Build. Mater. 2022, 341, 127914. [Google Scholar] [CrossRef]
- Serafinavičius, T.; Lebet, J.P.; Louter, C.; Lenkimas, T.; Kuranovas, A. Long-term laminated glass four point bending test with PVB, EVA and SG interlayers at different temperatures. Procedia Eng. 2013, 57, 996–1004. [Google Scholar] [CrossRef]
- Valarinho, L.; Correia, J.R.; Garrido, M.; Sá, M.; Branco, F.A. Flexural creep behavior of full-scale laminated glass panels. J. Struct. Eng. 2017, 143, 04017139. [Google Scholar] [CrossRef]
- Hána, T.; Eliášová, M.; Machalická, K.; Vokáč, M. Determination of PVB Interlayer’s Shear Modulus and Its Effect on Normal Stress Distribution in Laminated Glass Panels. IOP Conf. Ser. Mater. Sci. Eng. 2017, 251, 012076. [Google Scholar] [CrossRef]
- Hána, T.; Vokáč, M.; Eliášová, M.; Machalická, K.V. Experimental investigation of temperature and loading rate effects on the initial shear stiffness of polymeric interlayers. Eng. Struct. 2020, 223, 110728. [Google Scholar] [CrossRef]
- Valarinho, L.; Correia, J.R.; Branco, F.A. Experimental study on the flexural behaviour of multi-span transparent glass–GFRP composite beams. Constr. Build. Mater. 2013, 49, 1041–1053. [Google Scholar] [CrossRef]
- Centelles, X.; Castro, J.R.; Cabeza, L.F. Double-lap shear test on laminated glass specimens under diverse ageing conditions. Constr. Build. Mater. 2020, 249, 118784. [Google Scholar] [CrossRef]
- Froli, M.; Lani, L. The Influence of Parameter Setting on the Mechanical Properties of PVB in Lamination Process. In Challenging Glass 3; IOS Press: Amsterdam, The Netherlands, 2012; pp. 669–678. [Google Scholar]
- Biolzi, L.; Cattaneo, S.; Orlando, M.; Spinelli, P. Constitutive relationships of different interlayer materials for laminated glass. Compos. Struct. 2020, 244, 112221. [Google Scholar] [CrossRef]
- López-Aenlle, M.; Noriega, A.; Pelayo, F. Mechanical characterization of polyvinil butyral from static and modal tests on laminated glass beams. Compos. Part B Eng. 2019, 169, 9–18. [Google Scholar] [CrossRef]
- Andreozzi, L.; Bati, S.B.; Fagone, M.; Ranocchiai, G.; Zulli, F. Dynamic torsion tests to characterize the thermo-viscoelastic properties of polymeric interlayers for laminated glass. Constr. Build. Mater. 2014, 65, 1–13. [Google Scholar] [CrossRef]
- Hána, T.; Janda, T.; Schmidt, J.; Zemanová, A.; Šejnoha, M.; Eliášová, M.; Vokáč, M. Experimental and numerical study of viscoelastic properties of polymeric interlayers used for laminated glass: Determination of material parameters. Materials 2019, 12, 2241. [Google Scholar] [CrossRef]
- Weller, B.; Wünsch, J.; Härth, K. Experimental Study on Different Interlayer Materials for Laminated Glass. In Proceedings of the Glass Processing Days, Tampere, Finland, 17–20 January 2005; pp. 120–123. [Google Scholar]
- Weller, I.B.; Kothe, D.L.C.C.; Kothe, D.C.M.; Wünsch, D.I.J. Thermo Mechanical Behaviour of Polymeric Interlayer Materials. In Proceedings of the Glass Performance Days 2009, Tampere, Finland, 12–15 June 2009; pp. 734–737. [Google Scholar]
- Pelayo, F.; Lamela-Rey, M.J.; Muniz-Calvente, M.; López-Aenlle, M.; Vázquez, A.; Fernández-Canteli, A. Study of the time-temperature-dependent behaviour of PVB: Application to laminated glass elements. Thin-Walled Struct. 2017, 119, 324–331. [Google Scholar] [CrossRef]
- Chen, S.; Lu, Y.; Zhang, Y.; Shao, X. Experimental and analytical study on uniaxial tensile property of ionomer interlayer at different temperatures and strain rates. Constr. Build. Mater. 2020, 262, 120058. [Google Scholar] [CrossRef]
- Huntsberger, J.R. Adhesion of plasticized polyvinyl butyral) to glass. J. Adhes. 1981, 13, 107–129. [Google Scholar] [CrossRef]
- Lu, Y.; Chen, S.; Shao, X. Shear modulus of ionomer interlayer: Effects of time, temperature and strain rate. Constr. Build. Mater. 2021, 302, 124224. [Google Scholar] [CrossRef]
- Sobek, W.; Kutterer, M.; Messmer, R. Shear Stiffness of the Interlayer in Laminated Glass. In Proceedings of the Glass Processing Days, Tampere, Finland, 13–16 June 1999; pp. 360–365. [Google Scholar]
- Hartwell, R.; Overend, M. Effects of Humidity and the Presence of Moisture at the Bond-line on the Interfacial Separation of Laminated Glass for Flat Glass Re-use. Challenging Glass Conf. Proc. 2020, 7. [Google Scholar] [CrossRef]
- Gant, F.S.; Bower, M.V. Domain of influence method: A new method for approximating Prony series coefficients and exponents for viscoelastic materials. J. Polym. Eng. 1997, 17, 1–22. [Google Scholar] [CrossRef]
- Wölfel, E. Nachgiebiger, Verbund Eine Näherungslösung und deren Anwendungsmöglichkeiten. Stahlbau 1987, 6, 173–180. [Google Scholar]
- Bennison, S.J.; Stelzer, I. Structural Properties of Laminated Glass. In Short Course; Glass Perfomance Days: Tampere, Finland, 2009. [Google Scholar]


Disclaimer/Publisher’s Note: The statements, opinions and data contained in all publications are solely those of the individual author(s) and contributor(s) and not of MDPI and/or the editor(s). MDPI and/or the editor(s) disclaim responsibility for any injury to people or property resulting from any ideas, methods, instructions or products referred to in the content. |
© 2023 by the authors. Licensee MDPI, Basel, Switzerland. This article is an open access article distributed under the terms and conditions of the Creative Commons Attribution (CC BY) license (https://creativecommons.org/licenses/by/4.0/).