1. Introduction
As fidelity significantly affects the response of a tested autonomous vehicle, in a more realistic virtual world, the validity and acceptance of tests in a simulation are higher [
1,
2]. Therefore, to enhance their realism, important elements such as vehicle dynamics, sensor models, and rendering technologies can be easily incorporated into the existing automated driving simulations. This is because the nature of their work remains unchanged before or after the integration and provides an adequate balance between performance and efficiency [
3]. However, a primary element of this test environment is the scenario vehicle, which is expected to perform trustworthy interaction bidirectional tasks with the autonomous vehicle under test. With this emerging demand for realistic behaviors of scenario vehicles [
1], the accurate simulation of the behaviors of human drivers is becoming increasingly challenging [
4].
One of the major issues in the existing models is their conservative behavior, as they can only respond negatively to the environment or other agents instead of taking assertive actions. Another problem is the underlying methodology, wherein a large proportion of the models use the finite-state machine (FSM), Markov decision process, or neural networks, which cannot be easily modified. However, rapid adjustments to the behaviors of the scenario vehicles are often necessary during simulation tests.
To address the aforementioned problems, this study proposes a dynamic scenario vehicle model considering the perspective of a human driver. Based on the theories of Maslow and Reiss [
5,
6], every action is considered to be determined by an underlying motive. The basic framework of the model is organized using a behavior tree, which describes switching between the finite sets of tasks in a modular manner. This implies that the actions performed, decisions made, and transfers between states are visible and easy to compose.
Simulations were conducted using a self-developed two-dimensional (2D) simulator, which currently supports an earlier version of the OpenDRIVE format map description file. The results indicate that scenario vehicles equipped with the proposed model successfully perform long-distance driving tasks to reach their targets and demonstrate interactions with other vehicles.
2. Related Work
Typically, scenario vehicle models in open-source autonomous driving simulators are designed to follow certain simple yet hard-coded rules. Their behaviors may exhibit a limited number of predefined driving styles in terms of lane changing, car following, and collision avoidance [
7,
8]. Nevertheless, in comparison with the more conservative tracking modes of open-source platforms, commercial software, such as Automotive Artificial Intelligence (AAI) and Cognata, generally uses artificial intelligence to build decision-making systems for scenario vehicles in simulations. As the development and adjustment of such models are expensive, the range of scenarios is extremely limited.
Since the proposal of the car-following model in the 1950s, the continuous optimization of the microscopic traffic simulation has rendered it highly mature. Several researchers have attempted to create a dynamic driving environment in the aforementioned simulator, with traffic participants provided by microscopic traffic simulations [
9,
10,
11]. However, some researchers have argued that directly deploying microscopic traffic simulations may cause significantly biased evaluation results during the testing of autonomous vehicles. Therefore, the parameter values of scenario vehicles are adjusted such that different levels of aggressiveness are produced [
12] or their behaviors appear statistically closer to reality [
2]. However, the background requirement of traffic flow simulation is significant in traffic engineering, which is used to accurately reproduce the macroscopic characteristics [
13]. Although these models have achieved the desired granularity in autonomous driving tests, they are over-simplified in their dynamics [
14], implicitly use safe rather than actual behaviors [
15], and are unrealistic at the inter-individual level despite calibrations with real-world data [
4].
Recently, certain researchers have attempted to eliminate the conventional framework of microscopic traffic simulation and develop more realistic interactive models. Chao et al. [
16] proposed a force-based framework that could replicate the sophisticated behaviors of various road users and their interactions in a unified manner. Wang et al. [
17] introduced a cognition-driven traffic simulation method capable of generating virtual drivers with heterogeneous behaviors in unstructured road networks. Additionally, researchers at the University of Michigan have addressed the need for a more realistic and interactive model using the “level-k” game theory [
18,
19,
20]. Several researchers have also borrowed popular development methods from autonomous driving. O’Kelly et al. [
21] trained the policies of scenario vehicles using imitation learning to mimic human-like driving behaviors. However, these new models provide staged results as they can be applied only in specific scenarios.
3. Driving Motives Analysis
Psychologists have proposed numerous theories to explain what motives are and how they function, and these theories are now widely used in various fields. However, only a few studies have been conducted on the systematic evaluation of driver’s behavior [
22]. This section presents different research studies conducted on psychology theories of motivation and human needs. The aim is to analyze the motives that affect the driver’s operation during driving, which are safety, dominance, achievement, order, and relatedness.
3.1. Safety
Safety is one of the most basic motives for survival. When faced with external threats, it compels individuals to avoid risks and harm. Safety motives find their closest associations with “flight” and “repulsion” in McDougall’s list of instincts [
23], “defendance” and “harmavoidance” in Murray’s personology [
24], “safety” in Maslow’s hierarchy of needs [
5], “existence” in Existence, Relatedness, and Growth (ERG) theory [
25], and “tranquility” in Reiss’s theory of 16 basic desires [
6].
For drivers, the safety motive represents the most basic requirement to ensure their survival and prevent collision. Only when the safety motive is met can the driver feel safe and comfortable while driving without excessive psychological burden. Summala’s “Safety Margin” is a model used to describe safety needs in time and space [
22]. In addition, Taubman–Ben-Ari’s “life endangerment” in the Driving Costs and Benefits Questionnaire (DCBQ) [
26] and Hoedemaeker’s “risk or safety” are also manifestations of safety motives [
27].
3.2. Dominance
The motive for dominance pertains to the need to exert influence on the environment to fulfill one’s desires. The motive for dominance is related to the “dominance” of Murray’s personology [
24], the “power” of McClelland’s achievement motivation theory [
28], the “power” of Reiss’s 16 basic desires [
6], and the “competence” of Deci and Ryan’s Self-Determination Theory (SDT) [
29].
In the context of driving, the dominance motive is evident in the driver’s active control of speed and direction. Summala suggested that drivers derive pleasure from maintaining both normal speeds and pushing the limits for thrills, likely because of their sense of dominance over the vehicle [
22]. This notion is also supported by Taubman–Ben-Ari’s “sense of control” in the DCBQ [
26] and Rumar’s goal of speed control [
30].
3.3. Achievement
Achievement motives typically involve purposefulness, encompassing the need to accomplish specific goals or tasks and actualize personal ideals. “Achievement” in Murray’s personology [
24], “achievement” in McClelland’s achievement motivation theory [
28], “self-actualization” in Maslow’s hierarchy of needs [
5], and “growth” in Alderfer’s ERG Theory [
25] are all related to the achievement requirements during driving presented in this section.
For drivers, the primary objective is to reach their destination [
30], which represents the “achievement” they strive to accomplish during a driving task. Summala’s “good or expected progress of trip” also reflects the driver’s achievement motive [
22]. The forced lane change in the micro-traffic flow model is a typical lane-changing behavior driven by the motive for achievement in order to reach the destination [
31].
3.4. Order
The order motive refers to the need to adhere to norms and avoid punishment. Although there are limited discussions on the importance of order in various theories of needs, Murray’s personology [
24] explores the concept of “blamavoidance”, while Reiss’s 16 basic desires touch upon the concept of “honor” [
6], which is somewhat related.
For drivers, the order motivation translates into specific rules that must be followed. These rules include formal traffic laws such as obeying traffic signals, driving in designated lanes, and adhering to speed limits [
30,
32]. Additionally, there are informal rules to consider [
33]. Adhering to these rules not only helps drivers avoid accidents and penalties associated with rule violations [
22] but also enhances overall driving efficiency, prevents traffic congestion and accidents, and saves time and money.
3.5. Relatedness
Relatedness refers to the desired state of being with others, which can manifest in positive ways such as acceptance, respect, and reciprocity or negative ways such as refusal to cooperate, exclusion, and confrontation. In McDougall’s list of instincts, relational motives are related to two instincts: “pugnacity” and “gregariousness” [
23]. Murray’s personology identifies interacting with others as “abasement”, “rejection”, “narcissism”, “affiliation”, and “succorance” [
24]. In contrast to the previous two theories, where there are several distinct states, in Reiss’s theory of 16 basic desires, the two desires “acceptance” and “social contact” are relatively positive expressions [
6]. In addition, there are “affiliative motives” in McClelland’s achievement motivation theory [
28], “belonging” in Maslow’s hierarchy of needs [
5], “relatedness” summarized in Alderfer’s ERG theory [
25], and “relatedness” in SDT [
29].
The desire for connection involves drivers’ inclination to cooperate with fellow traffic participants, seek approval and acknowledgment, or express disagreement when alerted by others. For example, if a vehicle in a nearby lane merges into the driver’s lane, the driver may adapt their speed and increase the following distance to facilitate the merging process if they accept or approve of the other vehicle’s actions. Conversely, if the driver disapproves or opposes the merging, they may maintain or slightly increase their speed while decreasing the following distance to impede the other vehicle from merging.
4. Decision-Making Model for Dynamic Scenario Vehicles
Maslow’s theory states that human needs can be expressed hierarchically from a low to high level [
5]. However, the motivations for driving are not identical to those in the regular pyramid of needs. Therefore, the five motivations mentioned in the previous subsection are prioritized as follows in this study.
For instance, the priority of safety motivation is higher than that of order motivation. Therefore, the scenario vehicle may consider order motivation only when the environment is sufficiently safe. Additionally, once a high-priority motivation appears, the scenario vehicle should discard the current motivation, despite the implemented behavior being generated from a low-priority motivation. For instance, if the safety motivation occurs when the scenario vehicle is implementing the behavior generated by the achievement motivation, the vehicle should immediately terminate this behavior and perform the behavior associated with the safety motivation.
The study assumed that the behavior layer of the scenario vehicle determines the three main types of behaviors : changing speed (), changing lane (), and maintaining current motion (). Each behavior contains several actions. Among these, the set includes five actions: maintaining safe headway (), emergent deceleration (), slowing down and stopping (), complying with the speed limit (), and giving way to others (). The set includes four actions—that is, changing lanes to the target lane (), changing lanes to the faster lane (), changing lanes to a random adjacent lane (), and aborting changing lanes (). The set includes two actions: maintaining the current speed and lane () and maintaining current speed and lane while alerting the front vehicle ().
Figure 1 depicts the overall structure of the proposed decision-making model. At the core of the behavior tree lies a selector node, comprising five child nodes representing different levels of motivation, along with a default state to ensure the tree’s accuracy (
Figure 1a). In this research, behavior trees were utilized to represent behavioral decisions, as they are widely employed in designing intelligent behaviors across various systems. These trees offer a hierarchical framework that facilitates the organization of smaller behavioral units, known as nodes, enabling the creation of complex and adaptable behaviors.
The execution of a behavior tree initiates from the root, which sends periodic ticks to its child nodes. A tick serves as a triggering signal for the execution of a child node. When a node in the behavior tree becomes eligible for execution, it communicates its status to the parent node, indicating whether it is “running” (ongoing execution), “success” (goal achieved), or “failure” (goal not achieved).
For this study, three control nodes (sequence, selector, and random selector) and two execution nodes (action and condition) were employed. The sequence node searches and executes the first child that has not yet succeeded. The selector node identifies and executes the first child that does not fail. The random selector node randomly selects and executes one of its child nodes. The condition node evaluates a specific condition and returns a success or failure status based on the evaluation. Finally, an action node represents a specific action or behavior that the agent or system should perform.
4.1. Safety
Typically, drivers do not intend to cause or be victims in accidents when driving vehicles. To this end, they maintain a certain distance from their surrounding vehicles. As depicted in
Figure 1b, the longitudinal safety motivation originates from the judgment of the distance between a scenario vehicle (
) and the vehicle in front of it (
). If
is extremely close to
,
adjusts its distance from
via the action
. If this action fails to protect
from the dangerous situation,
applies emergency brakes through
, immediately lowering the speed and increasing its distance from
until the scenario vehicle stops or avoids danger. Considering that
may encounter a failure in motion planning, an action
is added beyond the sequence nodes to handle emergency situations.
The lateral safety motivation originates from the judgment of the distance between and adjacent vehicles on the left and right sides (). If is laterally close to and is changing lanes, should immediately stop changing lanes and return to the original lane via the action . If is not changing lanes, it is expected to avoid collision with adjacent vehicles on both sides because of the longitudinal emergency deceleration behavior ().
Safety Distance
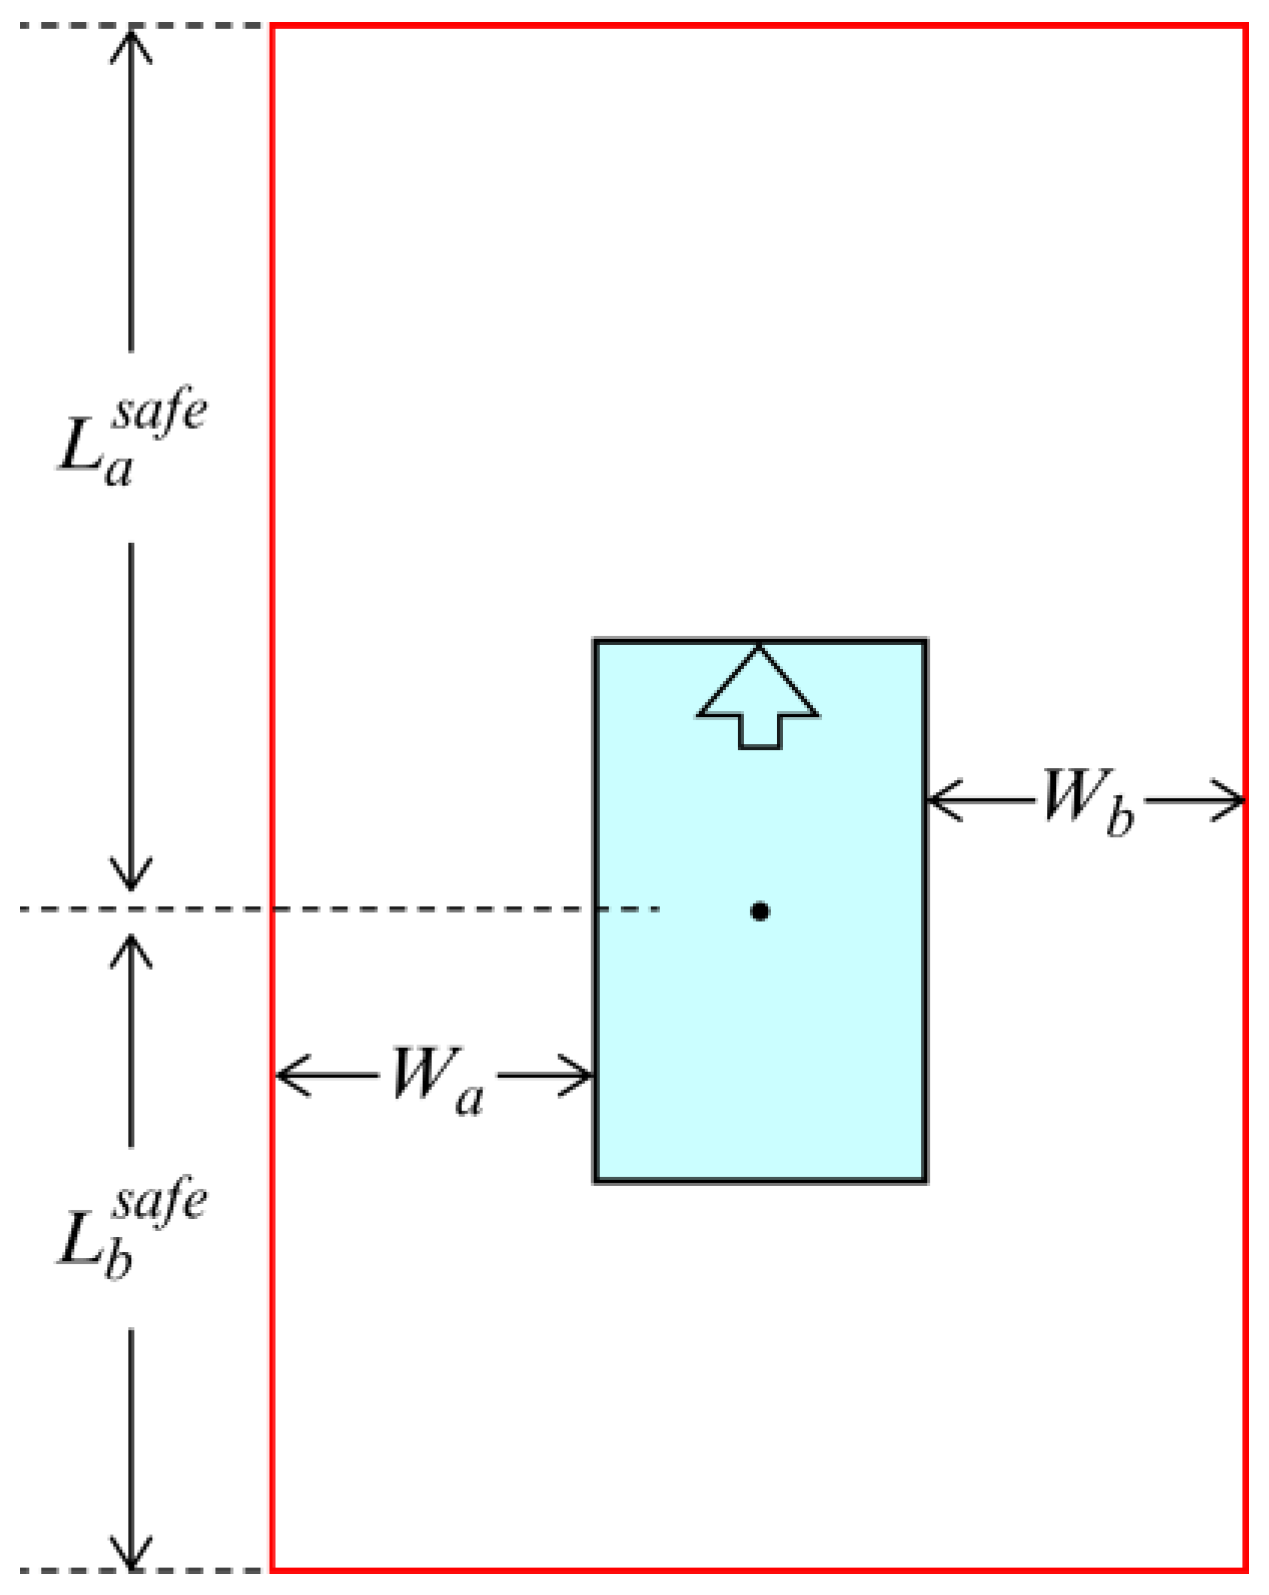
Figure 2 depicts the rectangular safety field that exists around each
. The safety field changes in real time with the speed and acceleration of
. A potentially dangerous situation occurs when the safety fields of two vehicles intersect. Based on the responsibility-sensitive safety model, we calculated the size of the safety field as follows:
where
and
denote the distances from the center of
to the front and rear edges of the safety field, respectively;
and
indicate the distances from the left and right edges of
respectively, to the corresponding edges of the safety field;
and
represent the length and width of
, respectively;
and
denote the initial expansion coefficients of the length and width, respectively;
indicates the driver’s reaction time;
represents the current longitudinal velocity;
denotes the longitudinal maximum acceleration;
indicates the current longitudinal deceleration;
represents the current lateral velocity;
denotes the current lateral acceleration; and
indicates the maximum lateral acceleration.
4.2. Order
The traffic rules at intersections without signal lights are temporarily applied in the model. In other words, all vehicles pass in the order in which they reach the intersection. If other vehicles exist at the intersection ahead, a scenario vehicle should stop before the stop line (
) and wait in line (
), as depicted in
Figure 1c.
4.3. Achievement
As depicted in
Figure 1d,
estimates whether the remaining distance
in the current road section is sufficient to change from the current lane to the nearest target lane for a forced lane change. The achievement motivation does not emerge if the remaining distance is sufficient. If the remaining distance is insufficient,
further checks whether the current lane is the target lane for forced lane change. If this criterion is satisfied,
maintains the current driving state via the action
; otherwise,
switches to the target lane (
).
Remaining Distance Estimation
Multiple target lanes exist for the forced lane change, which can be considered as
on road section
.
The target lane
closest to the current lane
is selected from
. The function
is the identification (ID) of the acquired lane.
For the sake of computational convenience, the following condition was assumed:
Considering the average vehicle speed
on each lane of the road section
, we estimated the longitudinal distance
from
to
as follows:
where
denotes the time that
waits to change lanes, and
indicates the time required by
to change lanes. Furthermore,
where
denotes the distance reserved in the road section, and
represents the actual remaining distance of the road section.
The goal motivation emerges only if .
4.4. Relatedness
As depicted in
Figure 1e, the entire decision-making process for relatedness motivation involves two perspectives. The first perspective is when
is considered as the front vehicle. During the lane changing process (
Figure 3a), if the rear vehicle
sends a signal to
expecting
to give way, then
can choose to continue changing lanes based on a preset probability (
) or abort the lane change and return to the original lane (
). When the motivation for lane change is unclear, action
can be used to represent the lane change from a lower level. When
sends a negotiation signal during normal driving along the lane (
Figure 3b),
can increase speed (
), maintain current speed (
), or randomly change lanes and move to the adjacent lane (
).
The second perspective considers
as a rear vehicle. A possible scenario is that a vehicle in the adjacent lane
merges with the lane in front of
and expects
to maintain a safe distance or reduce its speed (
Figure 3c).
can agree to this request and adjust its speed (
) to help
change lanes or maintain the current state (
) and prevent
from changing lanes.
4.5. Dominance
As depicted in
Figure 1f, the decision-making process for dominance motivation comprises two stages. In the first stage,
compares its speed
with that of
in the current lane. If
,
can remind
to increase speed appropriately (
) or move to the faster adjacent lane (
). If the current lane is not blocked by
, it implies that the speed of
is greater than that of
or that no vehicle exists in the front. In this case,
proceeds to the subsequent stage, wherein the current speed
is compared with the expected speed
of
. If
,
increases the speed via the action
. If
, the model exits the judgment of dominance motivation.
4.6. Default
When no motivation is satisfied, a default state must be set to ensure normal operation of the entire decision model. In this state, the driver chooses to maintain the current state
or randomly change lanes
, as depicted in
Figure 1g.
5. Experiments
The experiments were conducted on a MacBook Pro (16-inch, 2019), with 2.3 GHz Intel Core i9, 32 GB 2667 MHz DDR4, and AMD Radeon Pro 5500M 8 GB. The simulation platform used in this study was a self-developed 2D simulator based on Unity 2020.3.23f1. The platform comprises four key components: camera, map, static environment, and dynamic environment. The camera serves the purpose of capturing the surrounding environment and monitoring the movements of the scenario vehicles. The map component converts map data from OpenDRIVE format into visual images that are then integrated into the simulation environment. The static environment oversees the management of roads and intersections, providing accurate information for scenario vehicle perception. Regarding the dynamic environment, it exclusively encompasses the scenario vehicles themselves. The programs were primarily coded in C#, with the exception of the map drawing program, which was developed using Python.
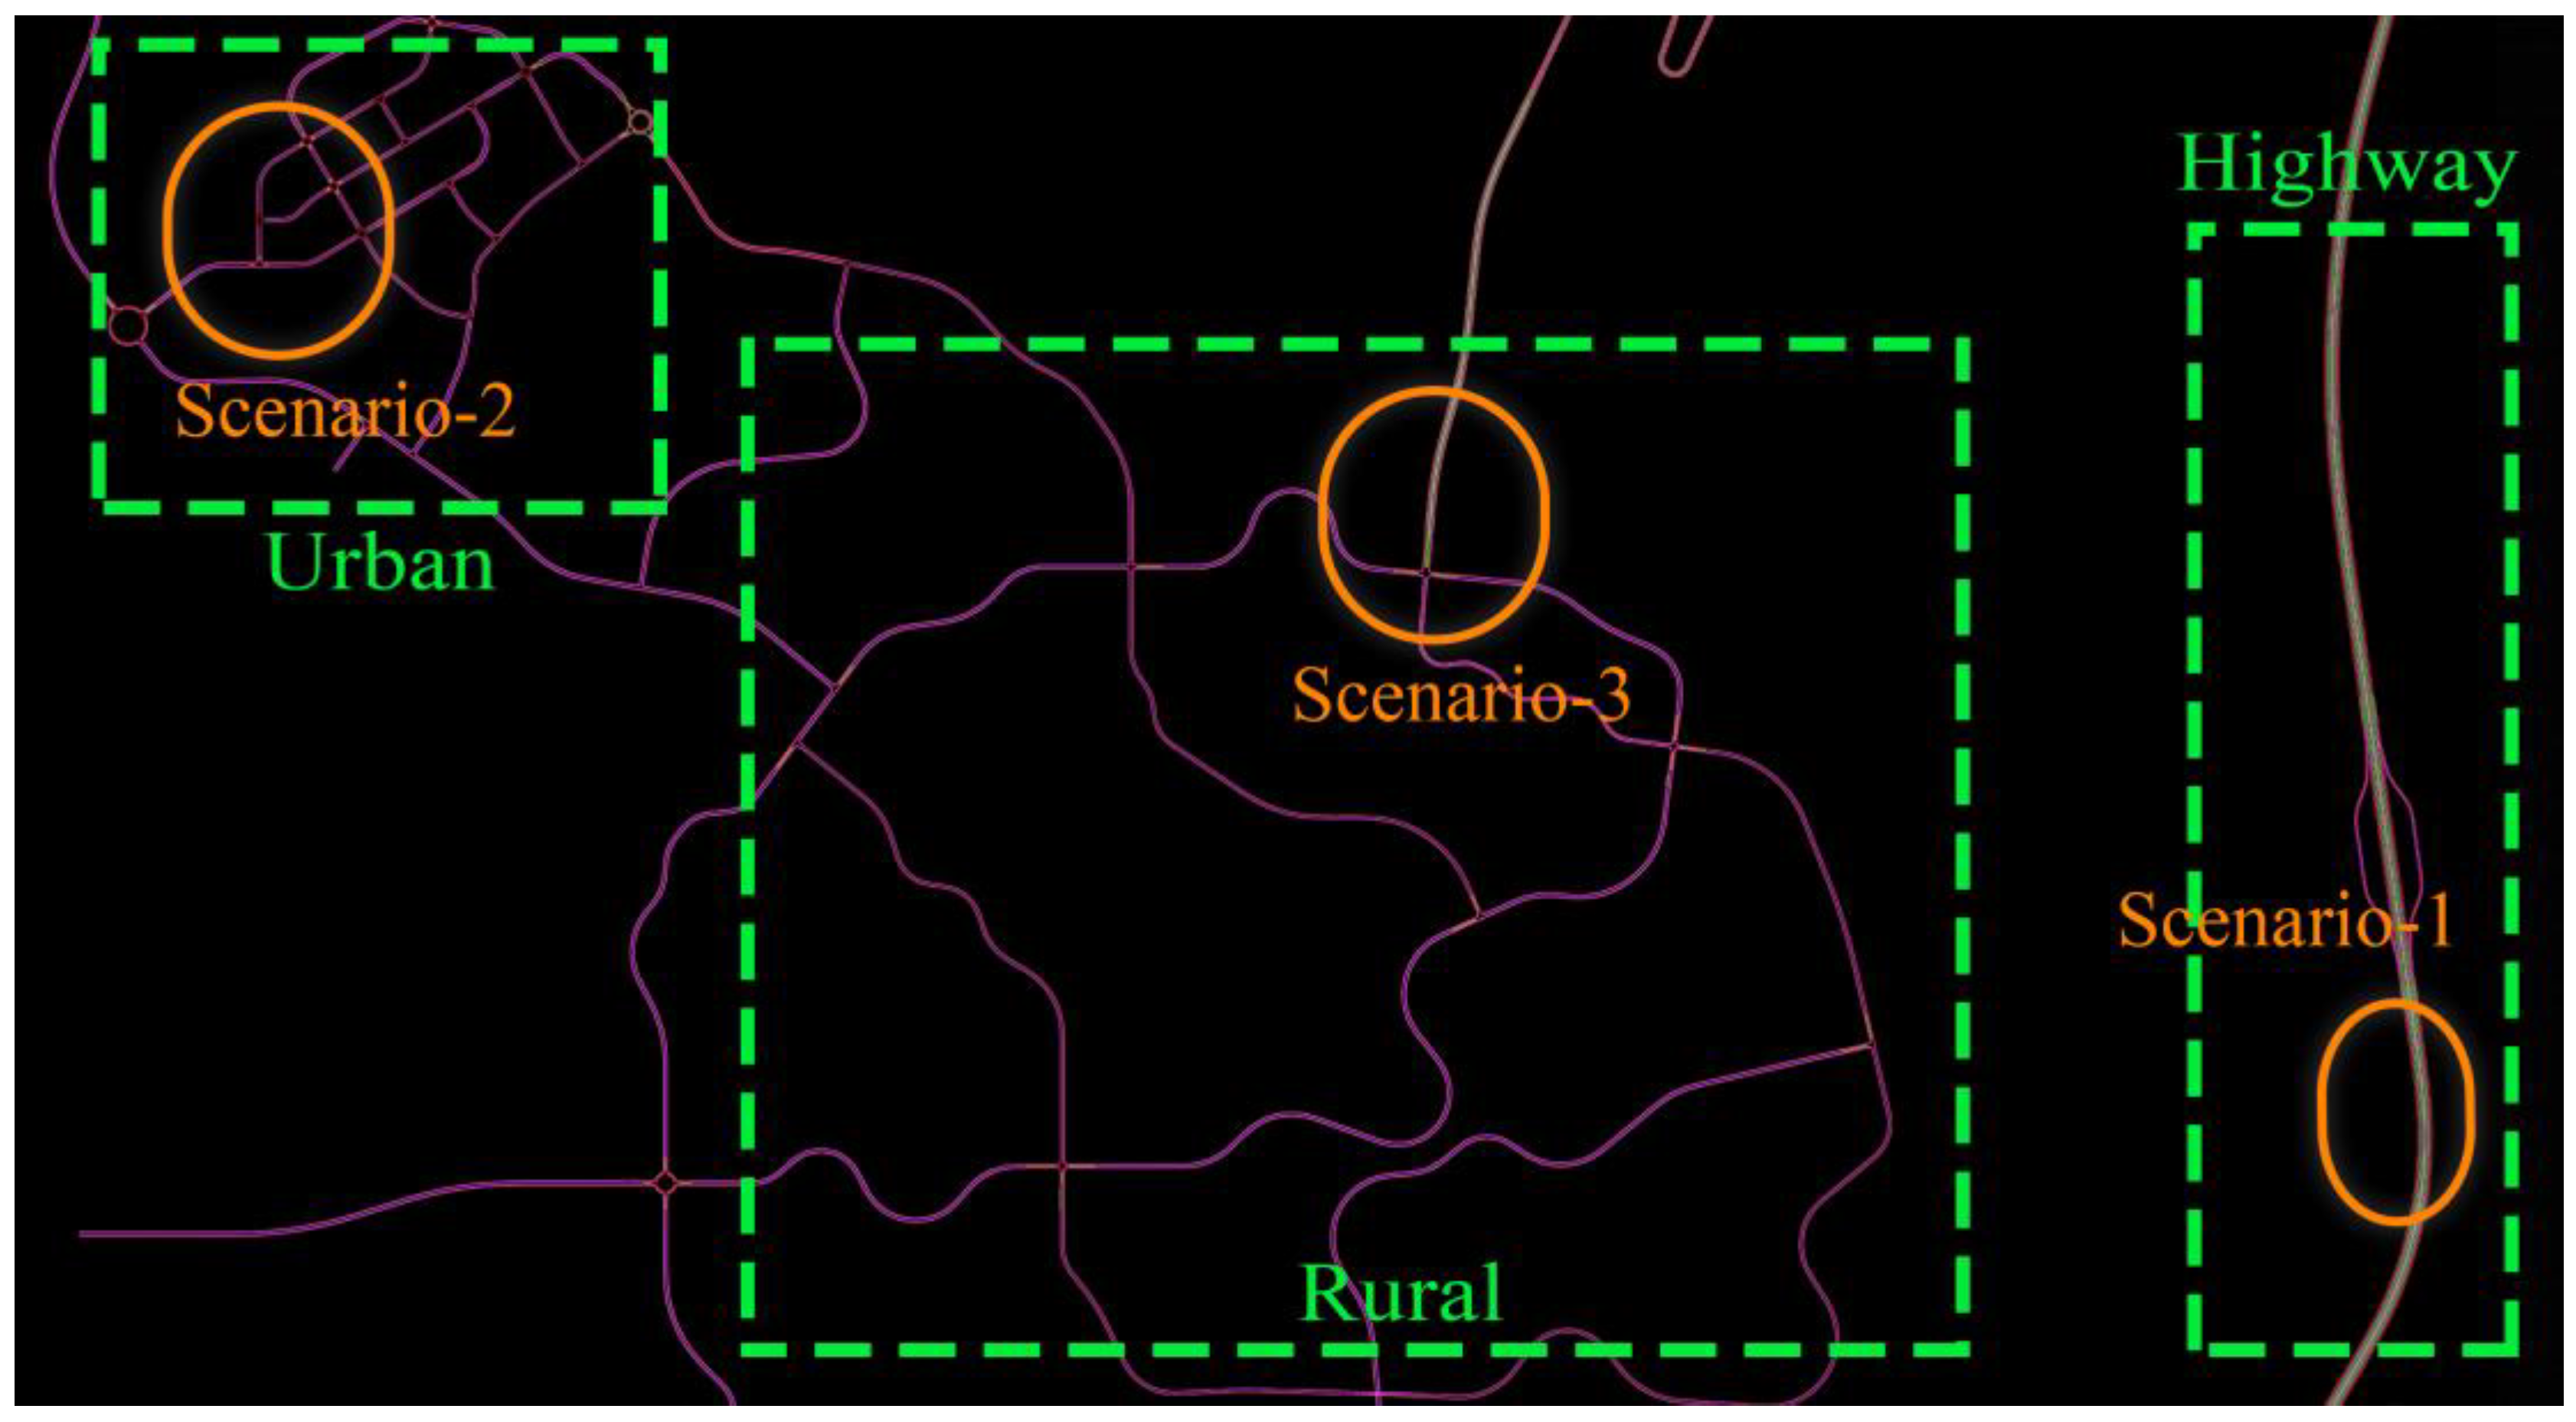
Figure 4 illustrates the map used for the experiments; it comprises urban, rural, and highway areas on which the experiments were performed to evaluate the proposed model. All the scenario vehicles used in the simulation were equipped with the same decision-making model considering different preferences. As the model contains multiple states, different features were validated in three separate experiments.
Weaving ability in multilane traffic (Scenario 1): a scenario vehicle is expected to cross groups of vehicles from the rear on multilane highways to increase its speed.
Handling unsignalized traffic junctions (Scenario 2): three vehicles converge at a junction and wait for the vehicles that arrived earlier to leave before entering the junction.
Cooperation between vehicles on rural roads (Scenario 3): a vehicle is expected to slow down to match the speed of an adjacent vehicle to change lanes.
5.1. Scenario 1
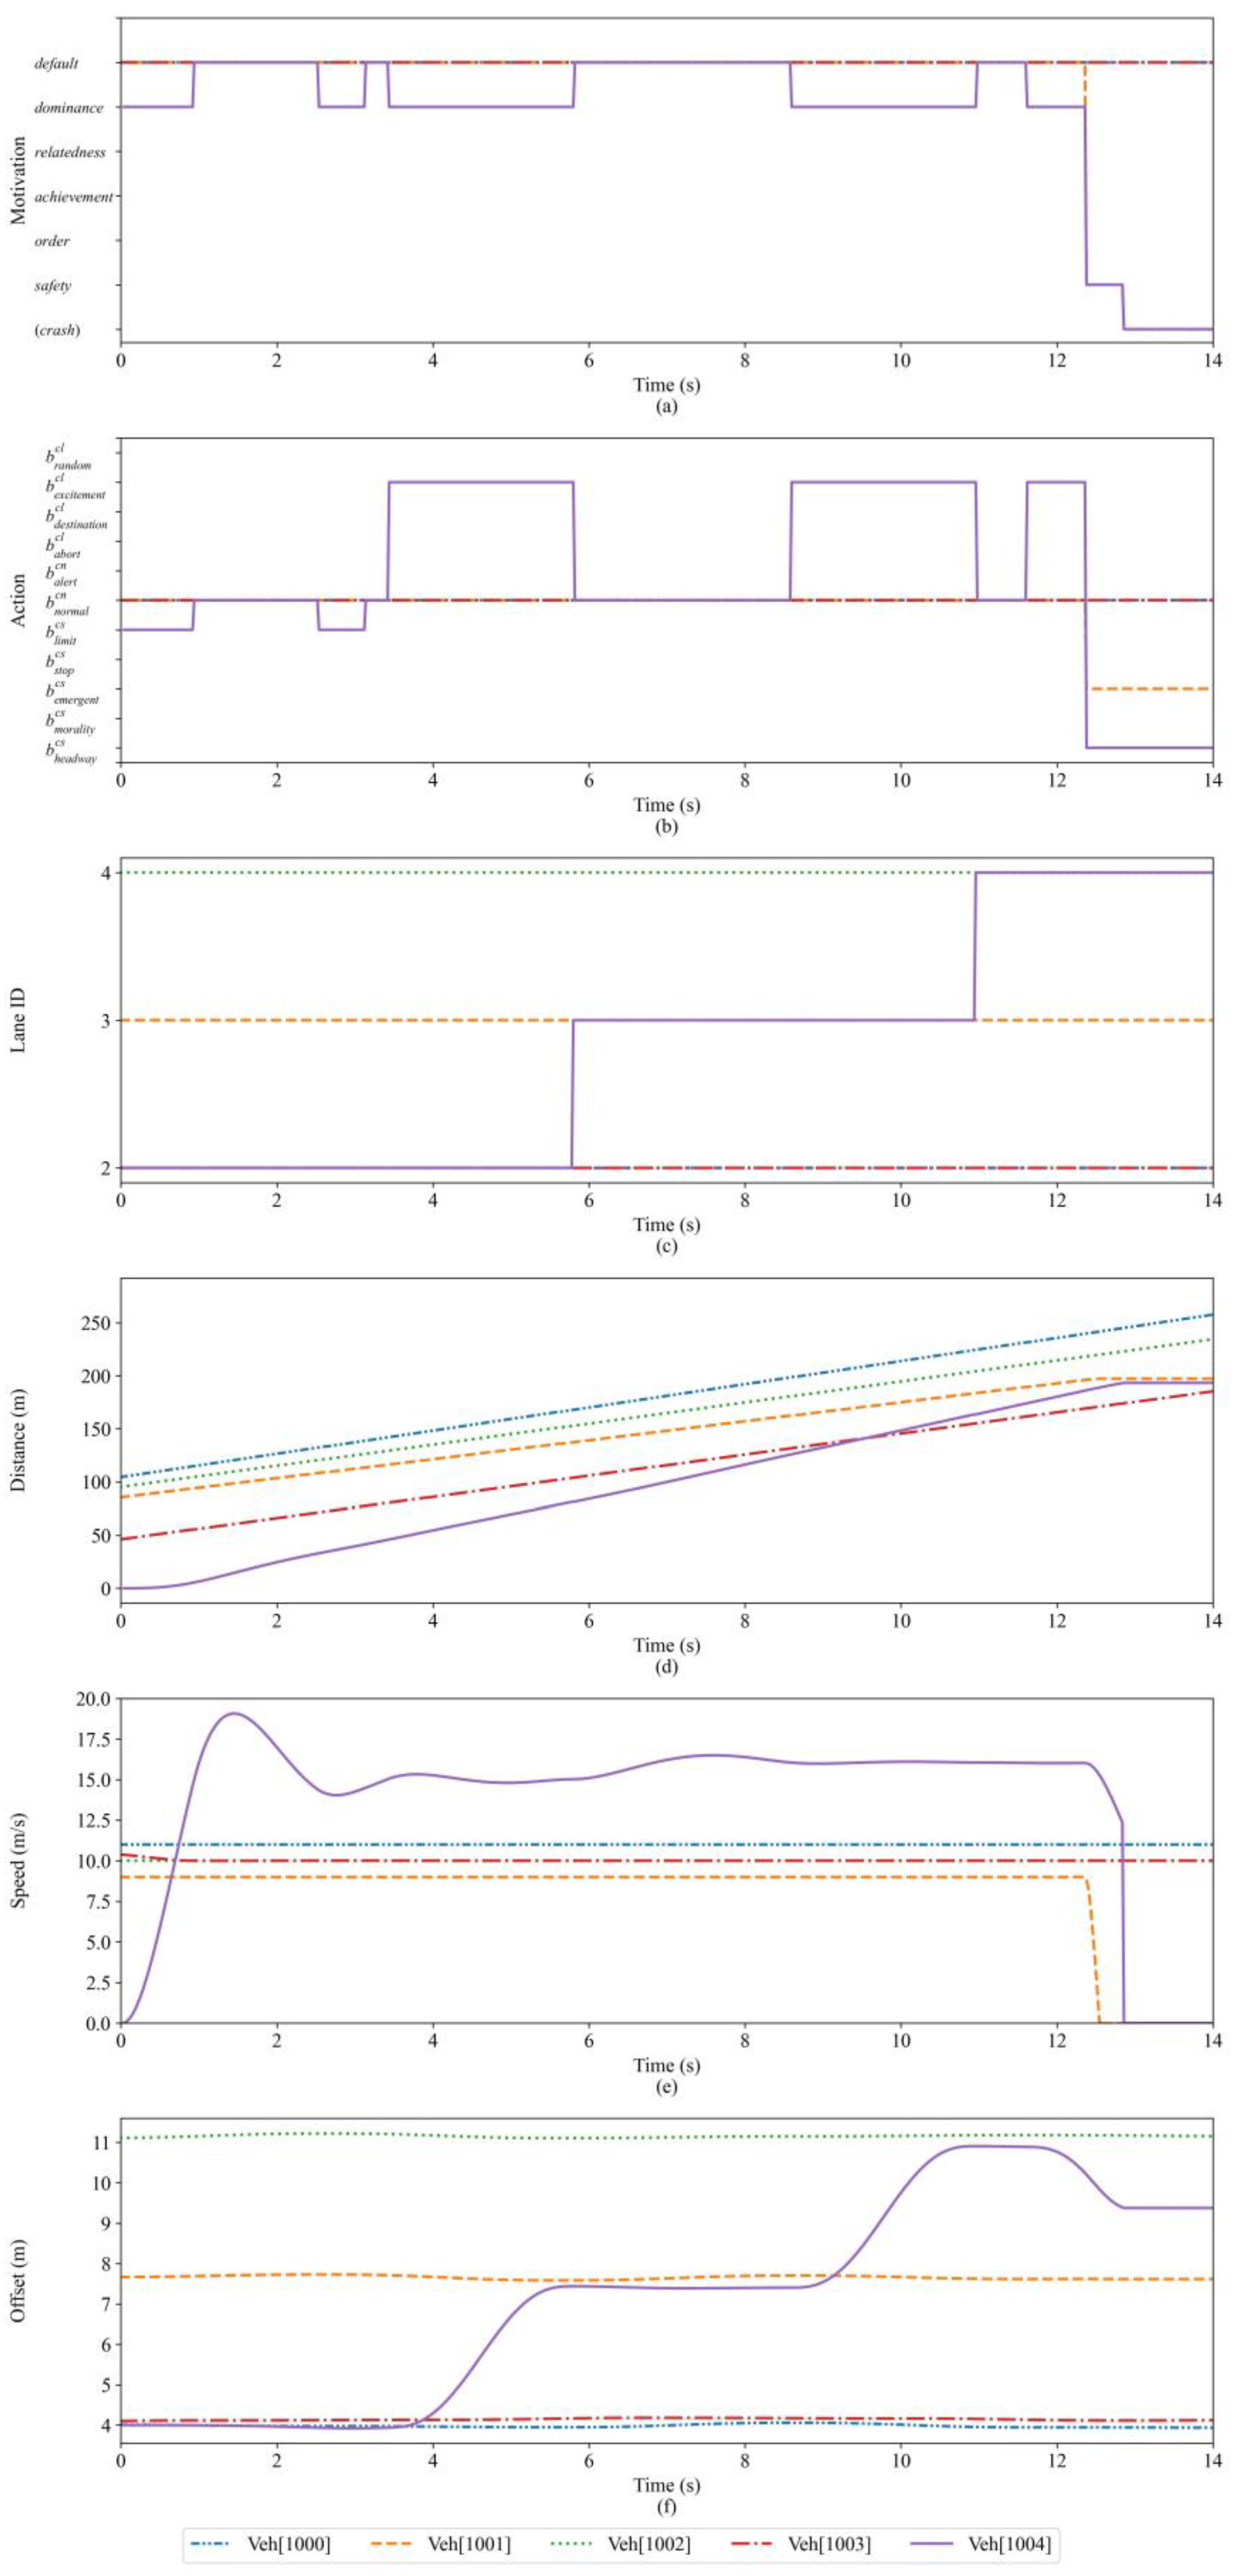
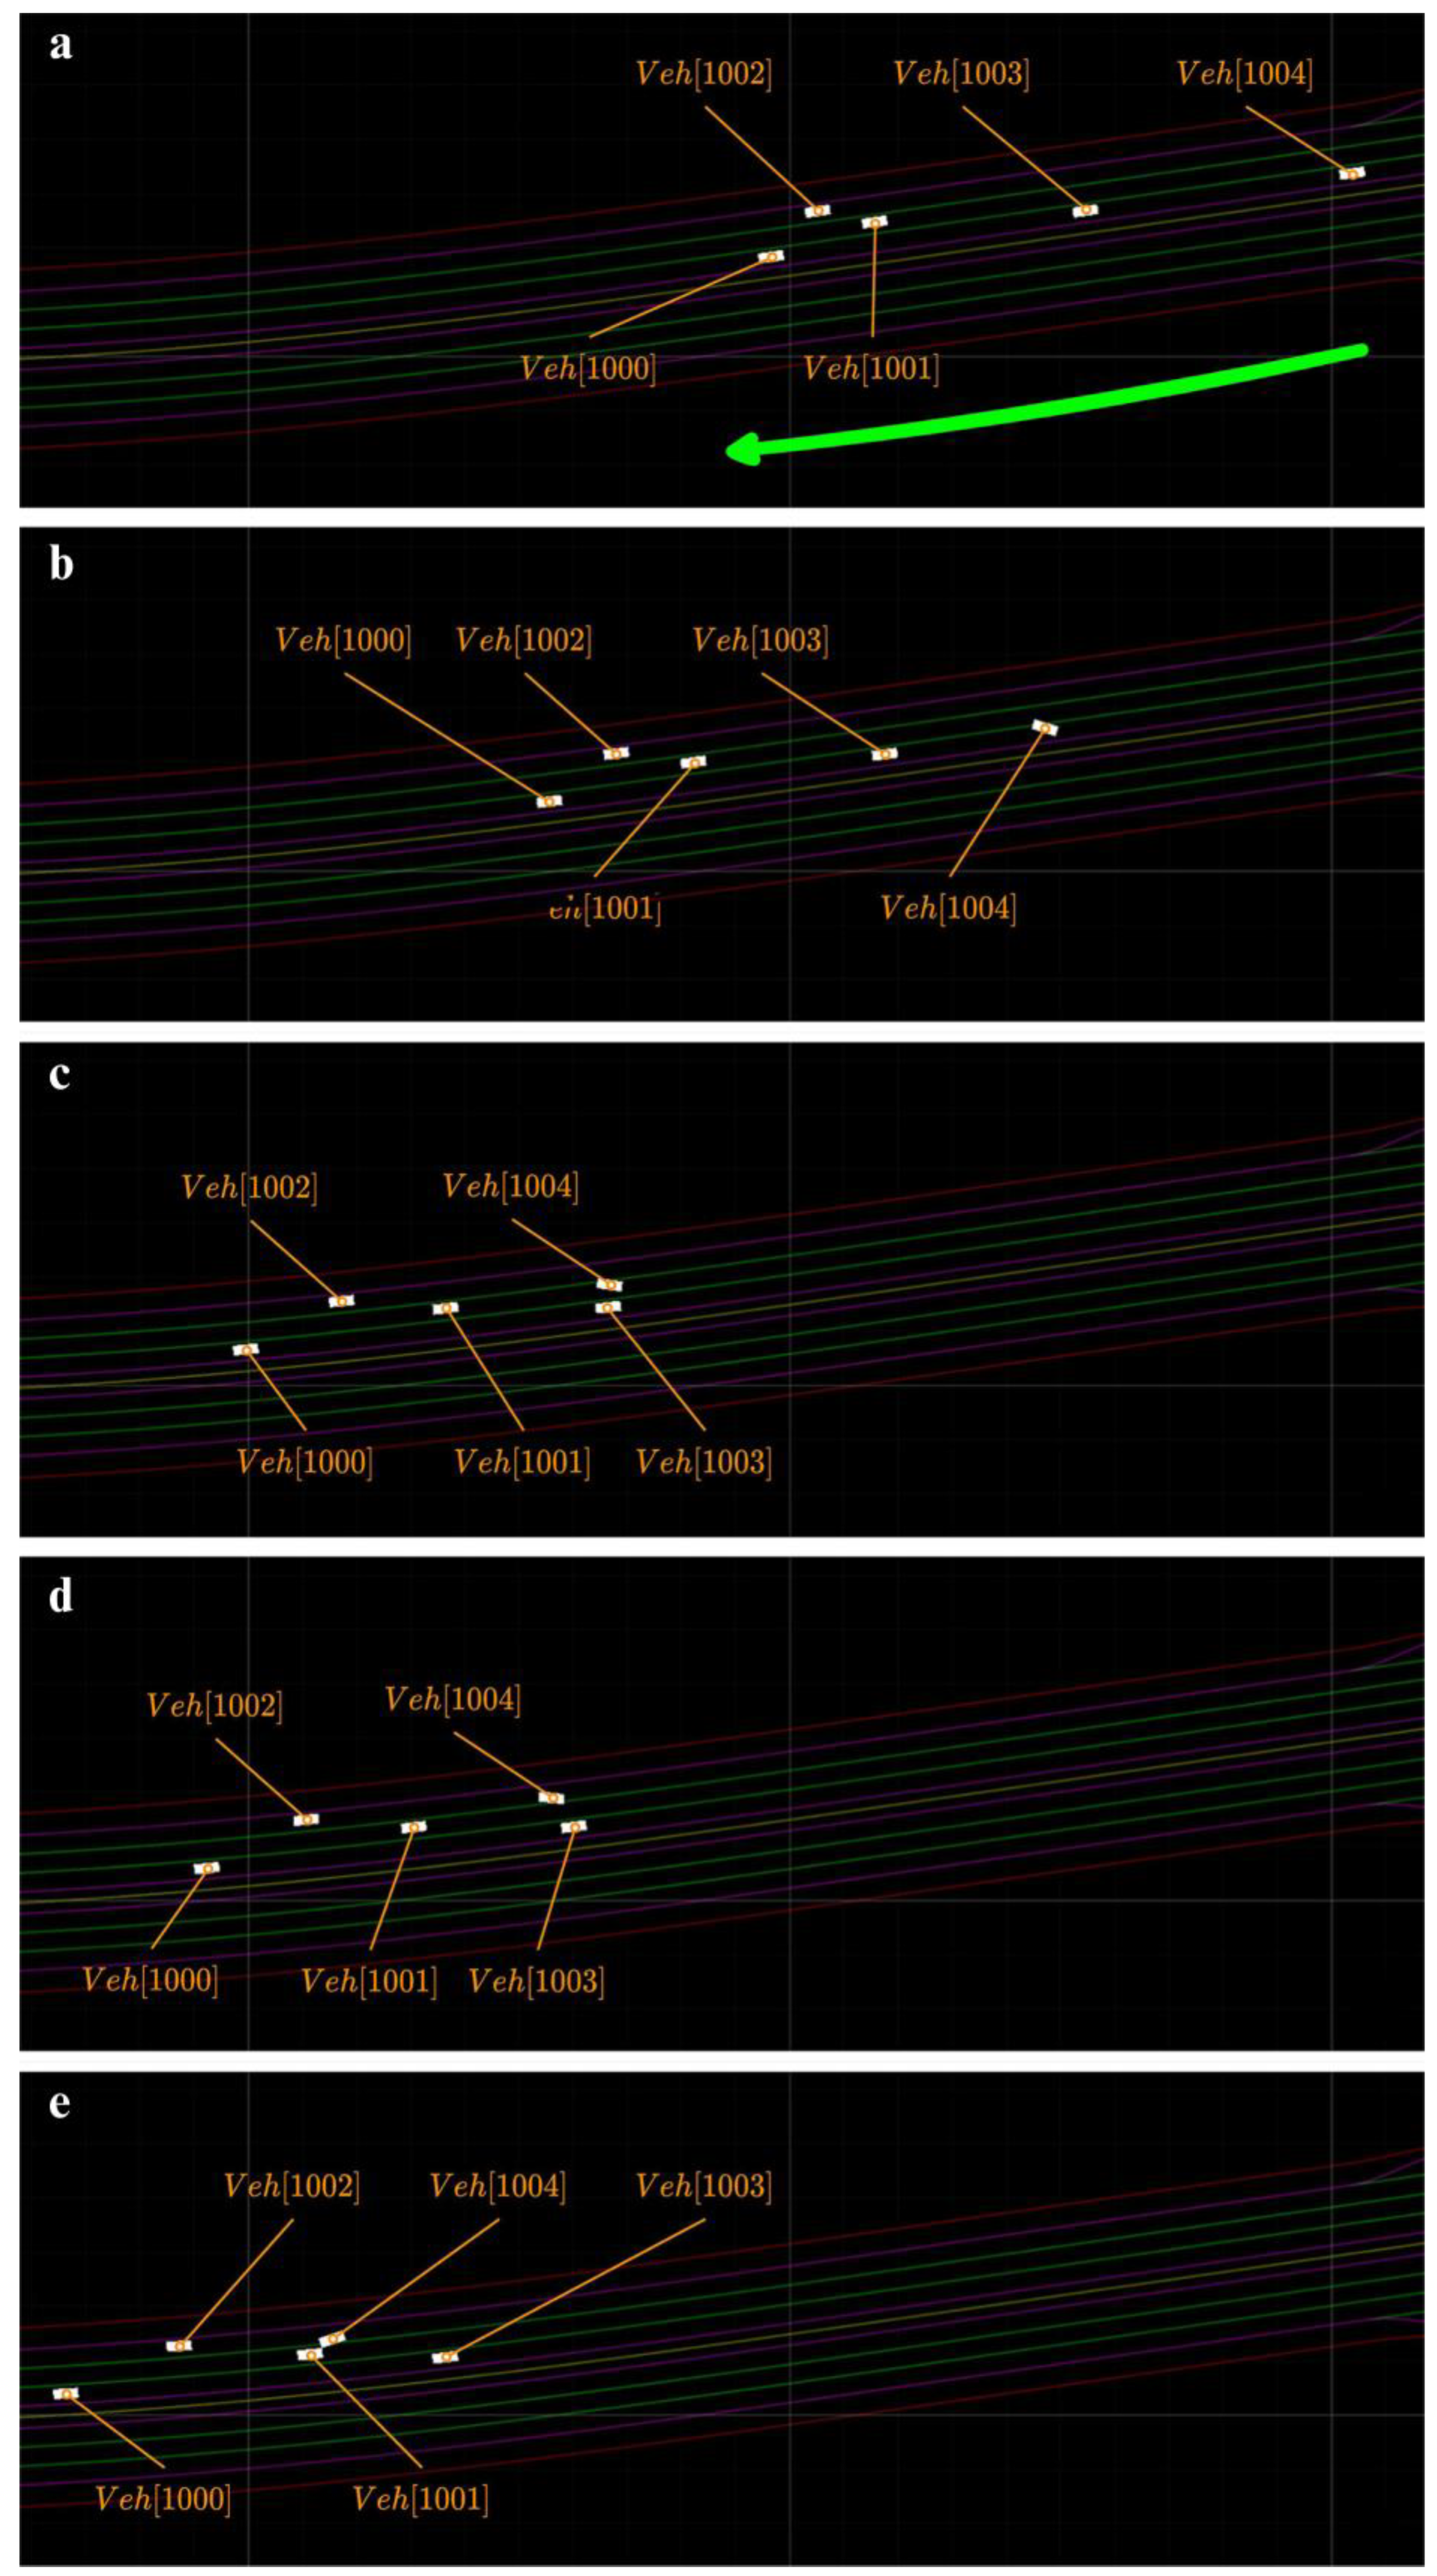
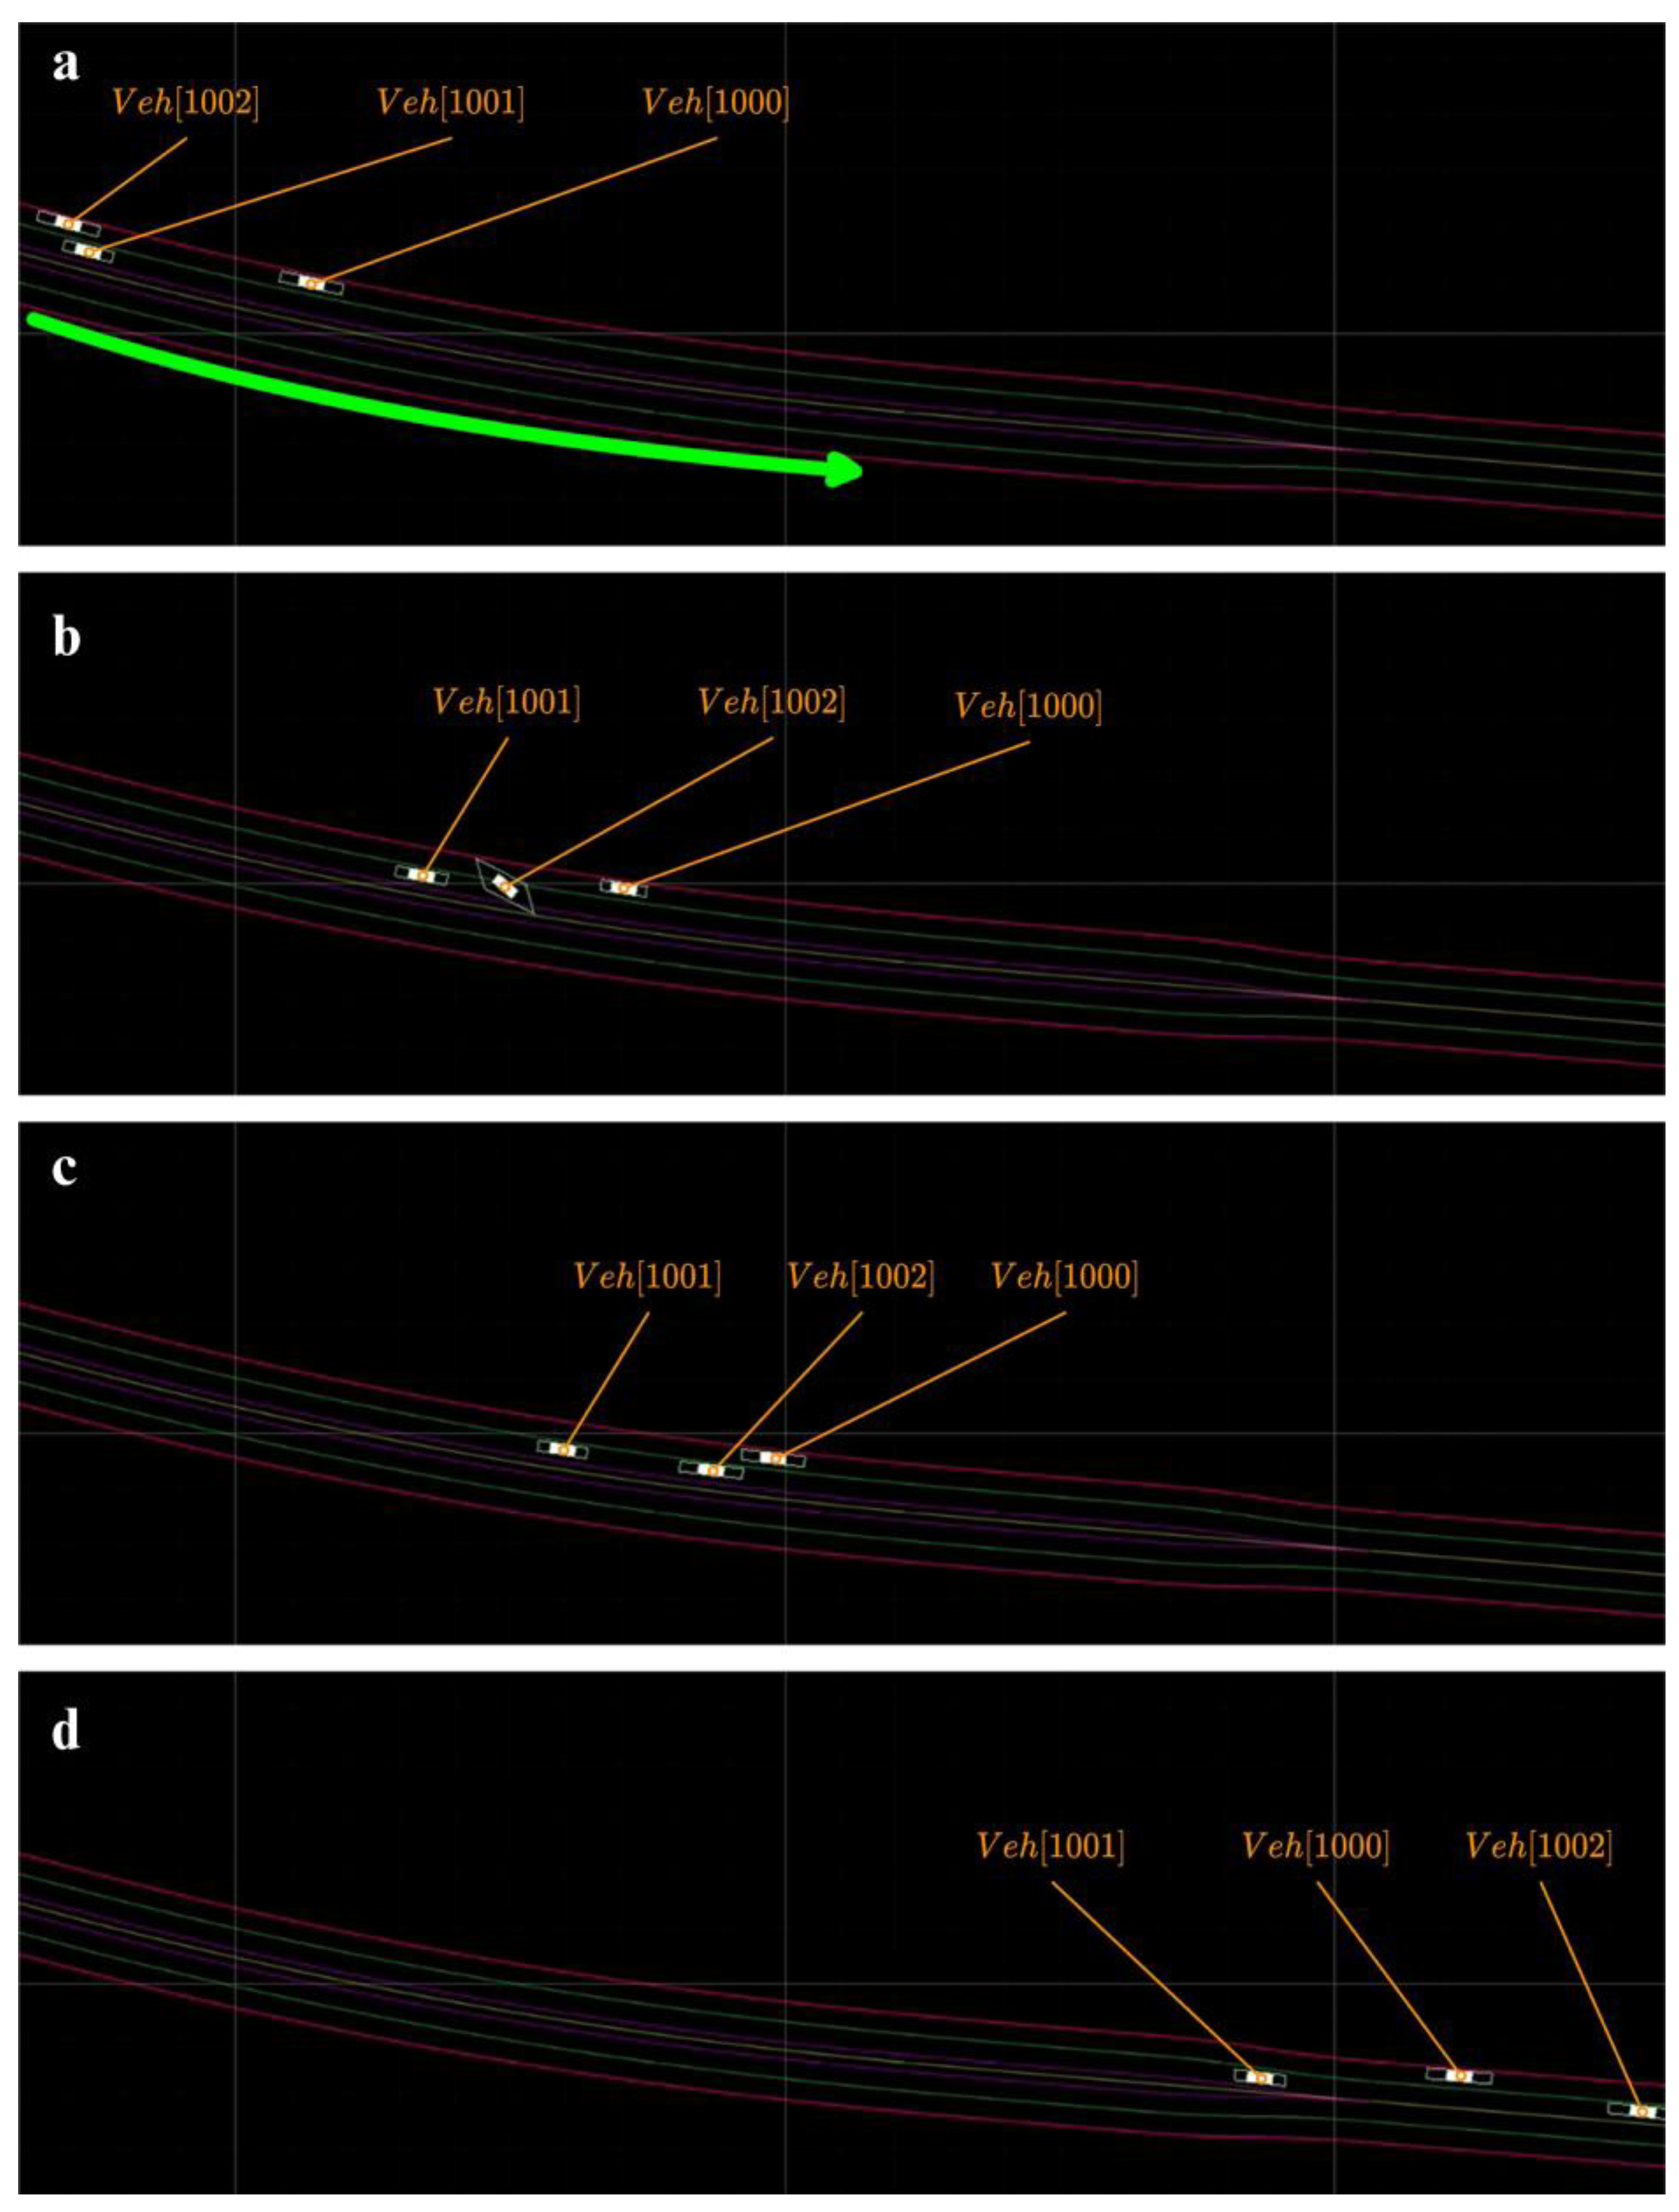
Figure 5 depicts that at
,
,
, and
were driving on lanes 2, 3, and 4 of
, respectively, and
was driving approximately 50 m behind
. All four vehicles were in the default motivation and maintained the current state (
Figure 6a) with a constant speed of approximately 10 m/s.
accelerated from a standstill; after
, the speed of the vehicle was stable at 15 m/s. As the front vehicle
was slow,
entered the dominance motivation and began to change lanes (
Figure 6b). The lane change was completed at approximately
, and
successfully steered into lane 3 from lane 2. Subsequently,
was in the default motivation, maintaining the vehicle speed constant with other vehicles. This continued until
gradually approached
, at this point
was blocked again and was ready to change lanes (
Figure 6c).
completed the lane change at approximately 11 s, successfully switching from lane 3 to lane 4. After a certain period,
re-entered the dominance motivation and began to change lanes because the vehicle in front of it was slower (
Figure 6d). However,
failed to notice
in the adjacent lane and continued to maintain its current vehicle speed. Both vehicles eventually entered the safety motivation. Although
applied emergency brakes and
reduced speed accordingly,
inevitably collided with
from the side and rear, as depicted in
Figure 6e.
5.2. Scenario 2
Figure 7 depicts the motivation, action, longitudinal displacement, and speed during the simulation, and
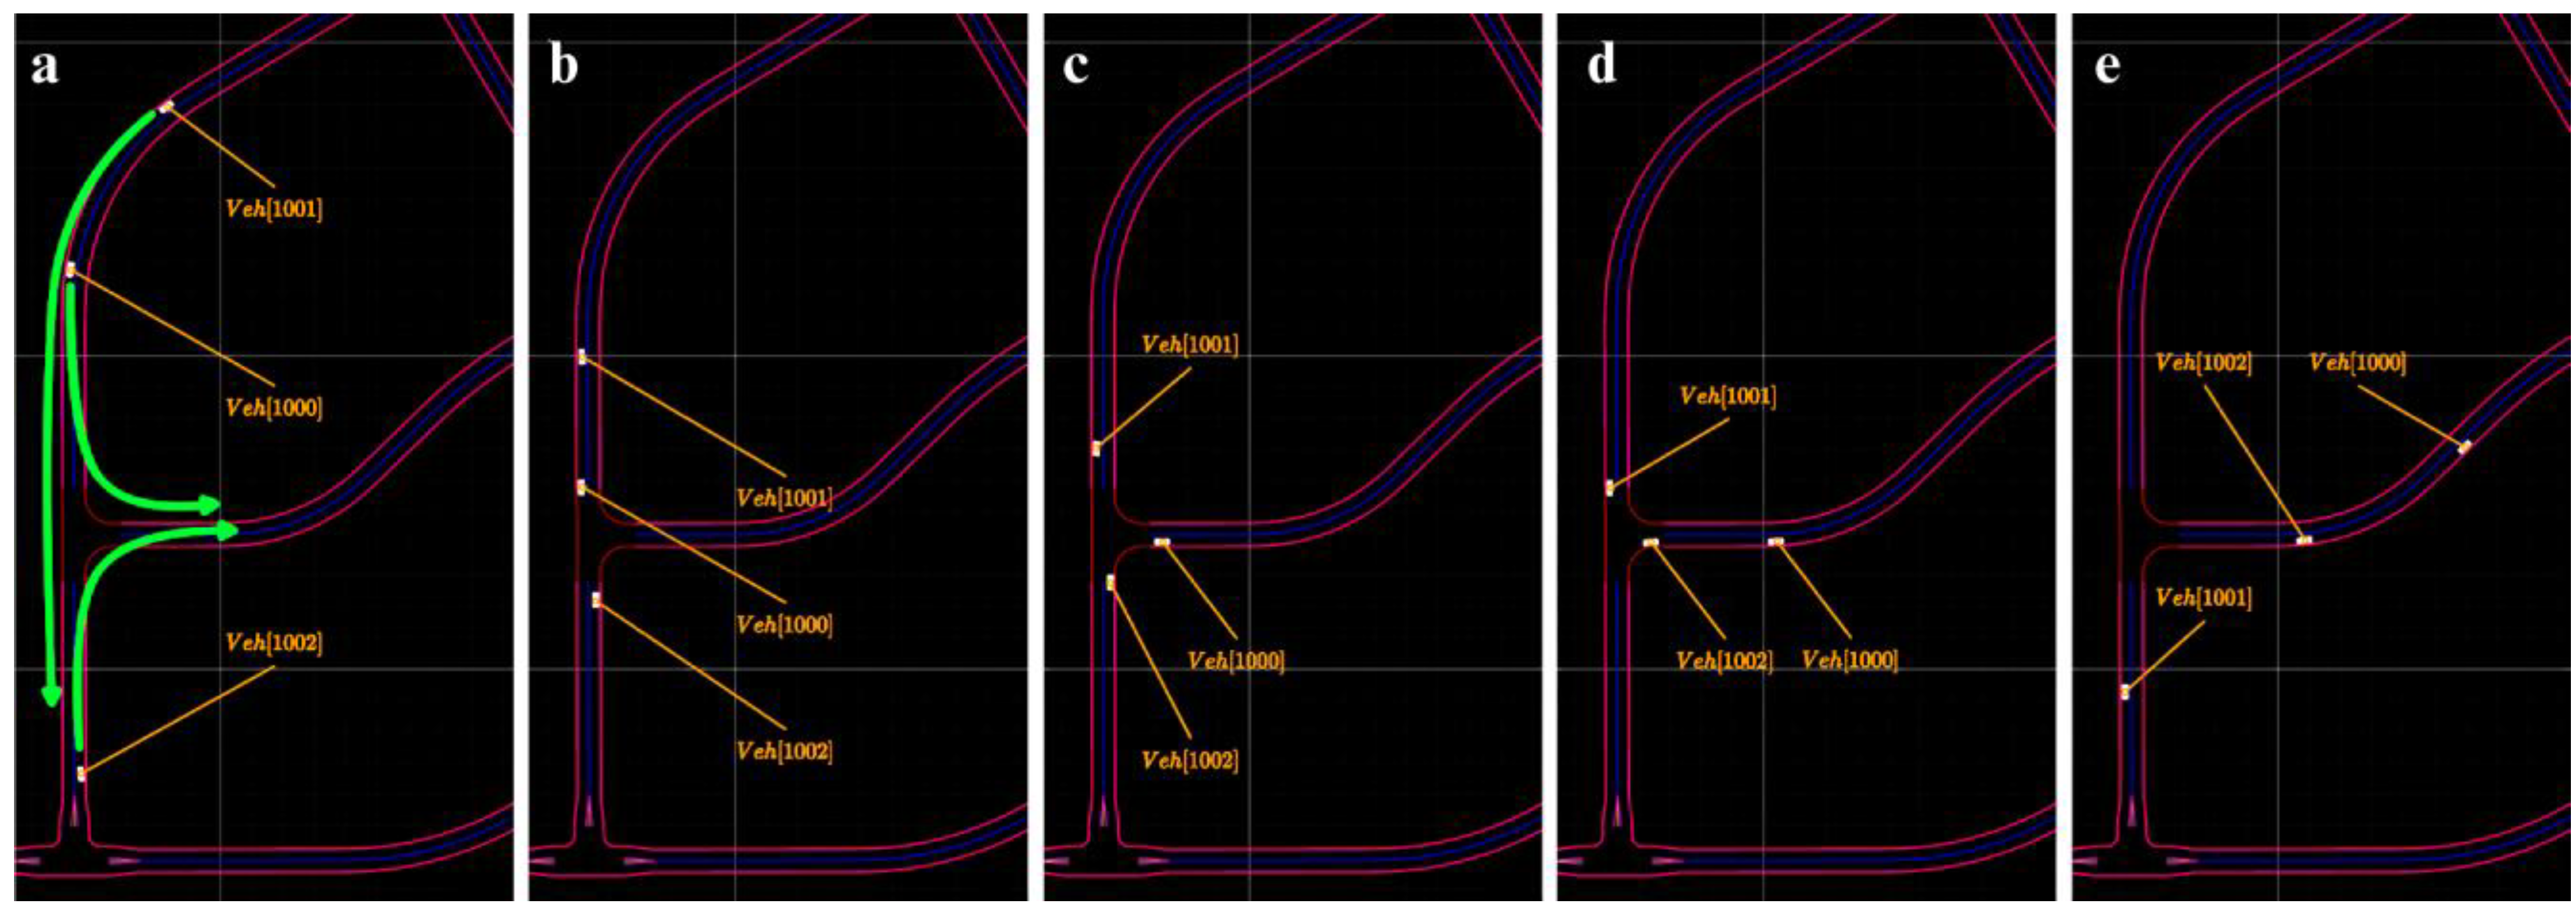
Figure 8 shows the screenshots of the top views of the five processes. Initially (
Figure 8a),
was driving on
at a speed of 10 m/s and intended to move to
when passing
. Additionally, in the rear of
,
intended to drive towards
at an initial speed of 10 m/s while passing
.
set out from standstill and intended to drive toward
by passing
and
. At approximately 12 s,
first arrived at
, slowed down, and observed the traffic. As no vehicles existed at the junction at the time, the vehicle was allowed to pass (
Figure 8b). Therefore,
continued to increase its speed, left the junction according to the preset destination, and continued to drive along
. When
arrived at
after
,
had to wait because
was at the junction at that time. At approximately 14 s,
moved away from the junction, and only then did
begin to speed up and pass the junction (
Figure 8c).
slowed down and waited when
was passing
. At approximately 21 s,
switched to
, and
gradually accelerated to pass
and drove towards
.
5.3. Scenario 3
As depicted in
Figure 9,
,
, and
drove on the left side of the reference direction on
.
was the foremost vehicle, traveling at a speed of 9 m/s in lane 3.
was in lane 2, approximately 40 m behind
was in the rear position, rapidly approaching
with the speed of 12 m/s in lane 3. After a short period,
believed that its speed might be affected by
in the adjacent lane and reminded
to change its current state.
received the reminder and attempted to increase the speed
; however, the vehicle reached its speed limit. At approximately 8 s,
approached
and reminded
to change its current state. Similar to
,
was unable to increase its speed despite receiving the signal from the rear vehicle. Consequently,
had to change lanes. As only two lanes existed in this road section,
could only select the adjacent lane 3 as the target lane. In this case,
reminded the rear vehicle
to cooperate for changing lanes successfully. Although
agreed to cooperate, it was extremely close to
. Therefore,
chose to slow down using
, and
merged into the lane from the front. After
changed the lane,
entered the dominance motivation, adjusted speed appropriately, and returned to the default state
.
Figure 10 depicts the screenshots of the top views of the four scenarios indicating the entire process.
6. Conclusions
This study proposed a scenario vehicle decision-making model for virtual testing of autonomous driving. The developed model could decide behaviors by simulating the changing psychological needs of human drivers during driving. The motivation-based approach offered an intuitive showcase of the motivation generation process and decision-making process for actions. In every test scenario, the motives and actions chosen by the scenario vehicle were observable throughout the simulation. This addressed the interpretability challenge present in current scenario vehicle behaviors for autonomous driving simulations. Moreover, it provided reliable reference data for autonomous driving systems to accurately predict and analyze the behavior of surrounding vehicles. Several experiments were conducted to evaluate the performance of the model. Despite the promising simulation results, the model is in its preliminary stage. In certain simple scenarios, such as Scenario 3, the vehicles controlled by the model successfully completed the driving tasks and significantly increased the interactions between the vehicles. Notably, other autonomous driving simulation platforms such as Carla and VTD had limited inter-vehicle communication capabilities. Consequently, their models exhibited a high level of caution, often maintaining significant distances or resorting to emergency stops when confronted with vehicles attempting lane changes. However, in scenarios with increased traffic participants, such as Scenario 1, accidents were observed. This implies that despite several trials being performed on the same scenario without recurring accidents, the model needs to be strengthened in terms of safety. Another aspect that must be addressed is the behavioral adaptation at signalized junctions, which are crucial in urban scenarios.
In the future, in addition to refining the aforementioned aspects of the model, the efforts will be extended to explore and incorporate new methods of trajectory generation and macro statistical features to improve the overall performance and feasibility.

