Article

Real-Life Traffic Data Based ITS-G5 Channel Load Simulations of a Major Hungarian C-ITS Deployment Site

by
András Wippelhauser
1,
Tamás Attila Tomaschek
2,*,
Máté Verdes
3 and
László Bokor
1
1
Department of Networked Systems and Services, Faculty of Electrical Engineering and Informatics, Budapest University of Technology and Economics, Műegyetem rkp. 3., H-1111 Budapest, Hungary
2
Department of Automotive Technologies, Faculty of Transportation Engineering and Vehicle Engineering, Budapest University of Technology and Economics, Műegyetem rkp. 3., H-1111 Budapest, Hungary
3
Hungarian Public Roads, ITS Department, Fényes Elek utca 7-13., H-1024 Budapest, Hungary
*
Author to whom correspondence should be addressed.
Appl. Sci. 2023, 13(14), 8419; https://doi.org/10.3390/app13148419
Submission received: 30 May 2023 / Revised: 5 July 2023 / Accepted: 14 July 2023 / Published: 21 July 2023
(This article belongs to the Section Transportation and Future Mobility)

Abstract

:

Featured Application

The primary objective of introducing the proposed tools and methodology is to enable the accurate and comprehensive simulation of ITS-G5 radio channel load, thereby advancing the field of C-ITS network design and deployment. By leveraging these resources, stakeholders can gain critical insights into the intricate relationship between various C-ITS services, V2X penetration ratios, ITS-G5 radio channels, and network performance. These simulations can then be applied to optimize C-ITS network architecture, identify potential bottlenecks and points of failure, and support strategic decision making. Ultimately, the proposed tools and methodology can serve as a crucial asset for improving the reliability and efficiency of C-ITS networks.

Abstract

Transportation efficiency and safety are crucial development areas nowadays. Cooperative Intelligent Transport Systems (C-ITSs), relying on Vehicle-to-Everything (V2X) communication, are a promising group of technologies and applications aimed at solving several issues related to road safety or efficiency. The C-Roads Platform was brought to life to ensure the cross-border harmonization of C-ITS at a European level, guiding several pilot activities in national deployment projects and providing a harmonized pan-European C-ITS service perspective. Because of the safety relevance of V2X technologies, it is essential to ensure that the crucial parameters of wireless communication are within an acceptable range to serve C-ITS applications appropriately. In this work, we developed a simulation pipeline to evaluate future V2X deployments using the real-world traffic and map data of a C-Roads harmonized major Hungarian C-ITS deployment site. First, we selected three time periods representing different traffic patterns. Then, we reconstructed the flow-based traffic data from the real-world traffic counters for the selected time periods. We developed an approach based on linear equations to perform the conversion. Eventually, we used the real-world data to simulate the effects of various DSRC (ITS-G5-based) C-ITS services and V2X penetration rates on the Channel Busy Ratio (CBR) parameter of the radio access environment.

1. Introduction

Transportation faces various challenges nowadays. There are numerous efforts to enhance traffic safety and efficiency. C-ITS is a key technology in this field that aims to address these challenges. It connects the traffic participants and the infrastructure in a cooperative network. Thanks to the communication, the actors can exchange essential information to realize a wide range of safety improvements, efficiency enhancement, and convenience applications.
The applications are usually categorized into three generations. Day1 applications typically implement cooperative awareness, Day2 broadens the horizon via perception sharing, and Day3 introduces coordinated maneuvering. As of 2023, Day1 use cases are mass-deployed, and Day2 applications are in the final stages of standardization.
Naturally, the C-ITS applications depend on the various network parameters. In the scope of this work, we aim to provide realistic simulation results based on real-world traffic data for different future deployment realizations of Day1 and Day2 applications. We hope this work will support the C-ITS community’s decisions with realistic and accurate data.
The rest of the paper is organized as follows. The background of the article is elaborated in Section 2. Section 3 introduces the applied simulation environment, our proposed extensions, and the used configuration. The details of the traffic modeling follow this in Section 4. The results are collected, introduced, and analyzed in Section 5. Finally, we conclude the paper and highlight our future work.

2. Background

2.1. V2X Use Cases and Literature Review

Multiple surveys focus on the achievable use cases in this domain, as summarized in [1]. In [2], the authors present 5G-V2X use cases and enabling technologies. The authors of [3] collect cooperative automated driving use cases. The authors of [4] introduces an implementation of infrastructure-supported cooperative maneuvers. In [5], the authors survey the scope of V2X testing, while [6,7] analyze the service requirements in this domain.
There are multiple articles covering C-Roads C-ITS deployments in the literature. However, no available documents provide realistic channel utilization simulation results [8,9,10,11]. Currently, the most relevant use cases from the deployment perspective are the so-called Day1 and Day2 use cases. Various aspects of these use cases are examined in the available papers. A list of the most important use cases is provided in Table 1 below.

2.2. The Simulation Context

The first ITS-G5-based C-ITS pilot in Hungary was implemented in 2015 along a 136 km-long stretch of the motorway M1 between Vienna and Budapest. The ITS-G5 technology supports vehicle-to-vehicle, vehicle-to-everything ad hoc communications without prior network set-up used at the dedicated 5.9 GHz frequency bands in Europe (the specified access layer of the communication stack is collectively called ITS-G5). The trial focused on road safety, especially on work zone use cases. Therefore, maintenance vehicles were also equipped with transceivers to act like ad hoc roadside units besides the fixed R-ITS-S stations. They were capable of operating both in connected and in standalone mode. By using an additional switch connected to the installed OBU, the operator can easily generate a DENM message which is broadcasted at the spot directly (standalone mode) or via the central ITS station (connected mode). The C-Roads Platform [43] is considered an adequate instrument for Member States to continue their involvement in the dynamic field of C-ITS and to delve into more detail from a particular road operator perspective. Member States across Europe are installing C-ITS pilot sites needed for the testing and later operation of “Day1” and beyond recommended by the European Commission’s “C-ITS platform”. Therefore, Member States will invest in their infrastructure; OEMs and the industry will use that pilot test infrastructure to test components and services.
As part of C-Roads, Hungarian Public Roads upgraded and extended the 2015 pilot in coverage and functionality. Additional Day1 use cases were introduced with hybrid communication along Motorway M1 (toward Austria) and Motorway M7 (toward Croatia and Slovenia). The provided services/the names of their sub-cases are as follows: IVS-DSLI, IVS-EVFT, IVSDLM, IVS-OSI, HLN-AZ, HLN-TJA, HLN-WCW, HLNTSR, HLN-OR, RWW-LC, RWW-RC, and RWW-RM (as in C-ROADS Harmonized Communication Profiles Rel. 1.6). In addition to core network corridors, special attention was also paid to urban applications: traffic light controllers were improved in the town of Győr to provide Time To Green and Green Light Optimum Speed Advisory (SI-GLOSA/SI-SPTI) information and Intersection Violation Warning (SI-ISVW) at ten neighboring junctions along the main traffic route, where intersection safety services are also available. The pilot sites have been operational since Q1 2021 [44].
Based on the C-Roads Platform results, the parallel CROCODILE project [45] Phase 2 also aimed for new C-ITS investments, mainly focusing on the Budapest Ring Road (expressway M0), implementing a testbed of cooperative ITS functions for the Central Region of Hungary (concerning the plan of the national C-ITS infrastructure). The deployment was started before the C-Roads investments, but the work strongly relied on the outcomes. Therefore, all the installed 26 Road Side Units (RSUs) at 13 locations (see Figure 1 for details) comply with the then-available C-Roads technical specs (”C-ROADS—Harmonized C-ITS Specifications for Europe—Release 1.3”). As a result of the investment, Commsignia ITS-RS4-M transceivers [46] provide ITS-G5 communication links at least every 10 km along the M0 ring road around Budapest (in both directions). The existing roadside stations are to be upgraded according to the newest C-Roads profiles, and RSUs will be available every 5 km of the expressway in the coming development phase.
Despite the tremendous results already collected with the help of the C-Roads Platform, technological innovation still causes plenty of challenges for road operators. It leaves many uncertainties for C-ITS and even more for CCAM (Connected, Cooperative, and Automated Mobility). To tackle the difficulties, Hungarian Public Roads further support connected mobility. The ongoing deployments involving a national C-ITS infrastructure and a planned European C-ITS ecosystem also help this goal by providing more valuable information, best practices, and harmonization guidelines.
An essential part of these C-ITS-related investments in Hungary is connected to the Automated Proving Ground and ZalaZone [47], which is dedicated to genuine public road testing in the town of Zalaegerszeg. The test track is unique because it integrates all the standard driving and driving stability features, a complex research/development framework, and advanced communication infrastructures to create a multi-level system for validating automotive solutions for the CCAM era. Therefore, the proving ground provides dynamics tests for conventional vehicles, but it also allows validation tests for autonomous and electric vehicles. The demand was raised by setting up the test track to enable open road tests (with safety always the first concern). In addition to the testing area of ZalaZone, the planned expressway M76 (between M7 and Zalaegerszeg) will be a part of the testing facility, too. This is the first road section in Hungary that will be constructed by taking the requirements of automotive Tier 1 s and OEMs into account already from the planning phase and aiming at CCAM test opportunities in real traffic conditions. The ongoing C-Roads 2 Hungary project is focusing on this region, too, using synergies with the test facility. The planned Hungarian work program devotes particular attention to creating an urban test environment for autonomous and connected vehicles in the town of Zalaegerszeg, linked to the Automotive Proving Ground Zala (APZ), and building on the experiences of the pilot project in Győr. The deployment will focus on Day1 and Day1.5 C-ITS services with special attention on Vulnerable Road User (VRU) use cases. “ZalaZone” is the greater area that includes the town and the test track that will be ready for autonomous vehicle testing, but there are even more ambitious plans. As part of trilateral multi-level cooperation, Austria, Slovenia, and Hungary plan to implement cross-border test routes [48]. C-Roads 2 Hungary will enhance this effort by implementing C-ITS services in the greater city area and TEN-T corridors (with domestic and cross-border sections).
Supported by the C-Roads Platform results/available deployment details and driven by the above-introduced intertwined C-ITS/CCAM plans of the Hungarian road operator, it became essential to start analyzing the possible limitations of existing infrastructure components and to evaluate potential barriers and challenges to the further growth and advancement of C-ITS solutions available. This work can be considered as the first step of this general effort. We took expressway M0 and its RSU deployment as the C-ITS infrastructure under evaluation: we modeled the traffic of this road segment based on real-life traffic and map data, we modeled the RSU deployment and the V2X network and performed extensive simulations to highlight how the penetration rate of the C-Roads-compatible V2X technology will affect the service scalability in means of the radio channel load from now to the future.

3. The Simulation Environment

3.1. The Simulation Pipeline

In order to perform the necessary simulation steps, we developed a simulation pipeline containing eight main stages. The pipeline is depicted in Figure 2. Some of the stages with non-trivial contributions are elaborated on in the sections below.
  • In the traffic data collection stage, we received traffic count data in an hourly resolution from the Hungarian Roads. The data originated from loop detectors which are able to count the passing vehicles. Typically, one loop detector is deployed between each driveway.
  • In the traffic data selection stage, we selected traffic scenarios that were considered to represent typical traffic patterns, including, e.g., summer-time low-intensity traffic and school start high-intensity traffic. The selection is elaborated on in Section 4.
  • In the traffic data aggregation stage, we calculated the average of the data of the selected road sections in the selected hours. We have also performed some cleaning on the data in this stage.
  • In the traffic demand generation stage, we generated the number of entering, leaving, and passing vehicles for each driveway. The method is described in Section 4.
  • In the traffic flow generation stage, we generated traffic flows from the previously generated traffic demand values using Algorithm 1.
  • In the scenario selection and configuration generation stage, we selected the relevant services and simulation parameters. The configuration is elaborated on in Section 2.
  • We used the Artery/OMNeT++ simulator in the supervised simulation stage to model the network and analyze the channel utilization values. The details are described in Section 3.
  • We developed data processing scripts to visualize the results in the evaluation stage.
Algorithm 1 The proposed algorithm for flow generation
Require: Demand values to each driveway (D)
Ensure: Proper flows (F)
          F ← {}
          for all d ← D do
                   l ← d.next {Node satisfy demand}
                  while d.entry ≠ 0 do
                             p ← min{d.entry, l.leaving} {Processable demand}
                             d.entry ← d.entry—p
                             l.leaving ← l.leaving—p
                             F ← F ∪ {d, l, p} {Add flow}
                             l ← l.next
                   end while
          end for

3.2. OMNeT++ and Artery-Based Simulation Framework

The Artery/OMNeT++ framework is a state-of-the-art simulation solution supporting V2X communication with real protocol implementation and advanced traffic modeling capabilities. The Artery framework binds and integrates the following main components.
  • The OMNeT++ framework: The OMNeT++ [49] is an event-based discrete-time network simulation framework that serves as a basis for the Artery framework. It is responsible for the simulation core of the network simulator. It also helps with many utility commands, like its own configuration file format, the XML parsing utilities, or the capability of defining multiple configurations with variable parameters.
  • SUMO: The SUMO [50]—Simulation of Urban Mobility—is a discrete-time microscopic traffic simulation framework. The SUMO framework supports network files imported from real-world maps using OpenStreetMaps. It is easily configurable with various parameters like the dynamics of the vehicles or the number of cars in a flow. The most important configuration options are the used network files and the route files defining the vehicles or vehicle flows in the simulation.
  • INET: The INET framework [51] is practically an open-source simulation model library built on top of the OMNeT++ environment. It implements protocols, agents, and other models for researchers and students working with communication networks. It models and implements various Internet-related protocols like IP, UDP, TCP, Wi-Fi, and many others. The Artery framework uses this library for multiple purposes, like the physical layer implementation.
  • Veins: Veins [52] is an open-source framework for executing vehicular network simulations. It integrates INET/OMNeT++ (the event-based network simulator with well-detailed protocol models) and SUMO (the road traffic simulator component). Veins also extends these main components to offer a comprehensive suite of models for inter-vehicle communication.
  • Vanetza: Vanetza [53] is an ETSI protocol stack library comprising compiled ASN.1 descriptors. It includes various protocols from the ITS transport, network, security, management, and facilities layers. This package was originally designed to operate on the ETSI-standardized ITS-G5 channels in V2X networks using IEEE 802.11p [54], but it can also be combined with other communication technologies.
  • Artery: The Artery framework [55] is considered the state-of-the-art V2X simulation solution to evaluate complete C-ITS service infrastructures based on ETSI ITS-G5 protocols like GeoNetworking and Basic Transport Protocol (BTP). Simulated vehicles can be equipped with multiple V2X interfaces to access various possible ITS-G5 services through Artery’s middleware component that also implements common facilities for the C-ITS services. Furthermore, the framework provides a sensor architecture with local and global environment models and a scripting toolset for dynamically evolving scenarios.

3.3. Proposed Extensions to the Artery Framework

  • The CPM support: The Collective Perception Message (CPM) models and the related mechanisms were implemented in our previous work [56]. We further extended and updated this model to a newer version based on the available ETSI CPM standardization documents [57,58]. Apart from that, the dynamic behavior of the protocol—CP service—also had to be implemented in the Artery framework since it is not implemented in Vanetza.
  • The modeled V-ITS-S nodes: The Vehicle ITS station (VITS-S) nodes included an ITS-G5 interface to send the status information generated by the vehicles. We have modified the model, enabling the used V2X messages to now be either a Cooperative Awareness Message (CAM) [59], CPM, or CAMs and CPMs in the simulation scenarios.
  • In order to enhance the interpretability of the measured data, a data-processing pipeline was developed. In the simulation framework, the proper measurement data were logged. After the simulation, the data were converted to CSV format, which was eventually processed by a Python-based process script based on pandas and matplotlib responsible for the visualization.
  • Resource management: The simulation was performed with many simulation setups. The simulation was also time and resource-consuming—both RAM and CPU utilization had to be monitored to achieve optimal speed. To manage this kind of issue, a virtualized docker-based simulation environment was developed. Our ultimate goal is to create a Kubernetes-based simulation system with automatic simulation orchestration and intelligent resource estimation heuristics.

3.4. The Simulation Configuration

The simulation had three unbounded variables. One of them was the used service on the ITS-G5 channel. It could be CAM, CPM, or combined CAM and CPM facilities. The V2X protocol stack was implemented in accordance with the standards. The protocol layers included the MAC header, the GeoNet header, and the UPER-encoded facility layer protocol headers as well. The second variable represented the amount of traffic in the simulation. During the traffic data selection, we chose nine different traffic patterns. The selection is elaborated on in detail in Section 4. The last unbounded variable was penetration, which means the share of V2X-equipped vehicles in the overall traffic. These three variables resulted in 297 different simulation configurations. The simulated time was 20 s long, and the simulation covered the expressway M0 C-ITS deployment site of Hungarian Public Roads.

4. Traffic Data

Using a realistic microscopic traffic simulator implies that the expected traffic data format of the traffic simulator is flow-based. Contrary to this, measuring the actual traffic conditions on public roads is implemented in practice typically via traffic counters due to technical and legal reasons. The following section describes how we calculated the flows from the real-world traffic counter measurements, i.e., how we generated the appropriate SUMO models for our simulations.

4.1. Traffic Data Preprocessing

  • Traffic data format: The traffic information provided by road operators is usually the number of vehicles crossing the highway at some measurement points. Contrary to this, the traffic simulators expect the traffic given by routes of cars or vehicle flows. Both of these models expect the start and end positions to be provided. This means that we need to transform the measurement data into some form of a flow model.
  • Traffic data: In the phase of traffic data collection, we processed the real-life measured data gathered by Hungarian Public Roads. The data included traffic counter information from various sections of the modeled M0 highway with a one-hour resolution. The data covered three weeks from 2019; one represented winter, one represented spring, and one represented autumn. We split the measurement data into different periods in the day to better showcase the relevant traffic patterns. We took the measurements’ average to calculate the traffic’s magnitude in the specific time period. This means that the measured values of the different intervals are scaled to one hour. After that, we selected periods representing the minimum, the maximum, and the average traffic within that specific day. This method also preserved the typical traffic patterns of that period. The traffic patterns among the measurement points are visible in Figure 3. The S and N letters indicate the direction of the lanes—south or north. The numbers on the X-axis identify the measurement points. The number of vehicles passing the measurement point is represented on the Y-axis.

4.2. Traffic Model

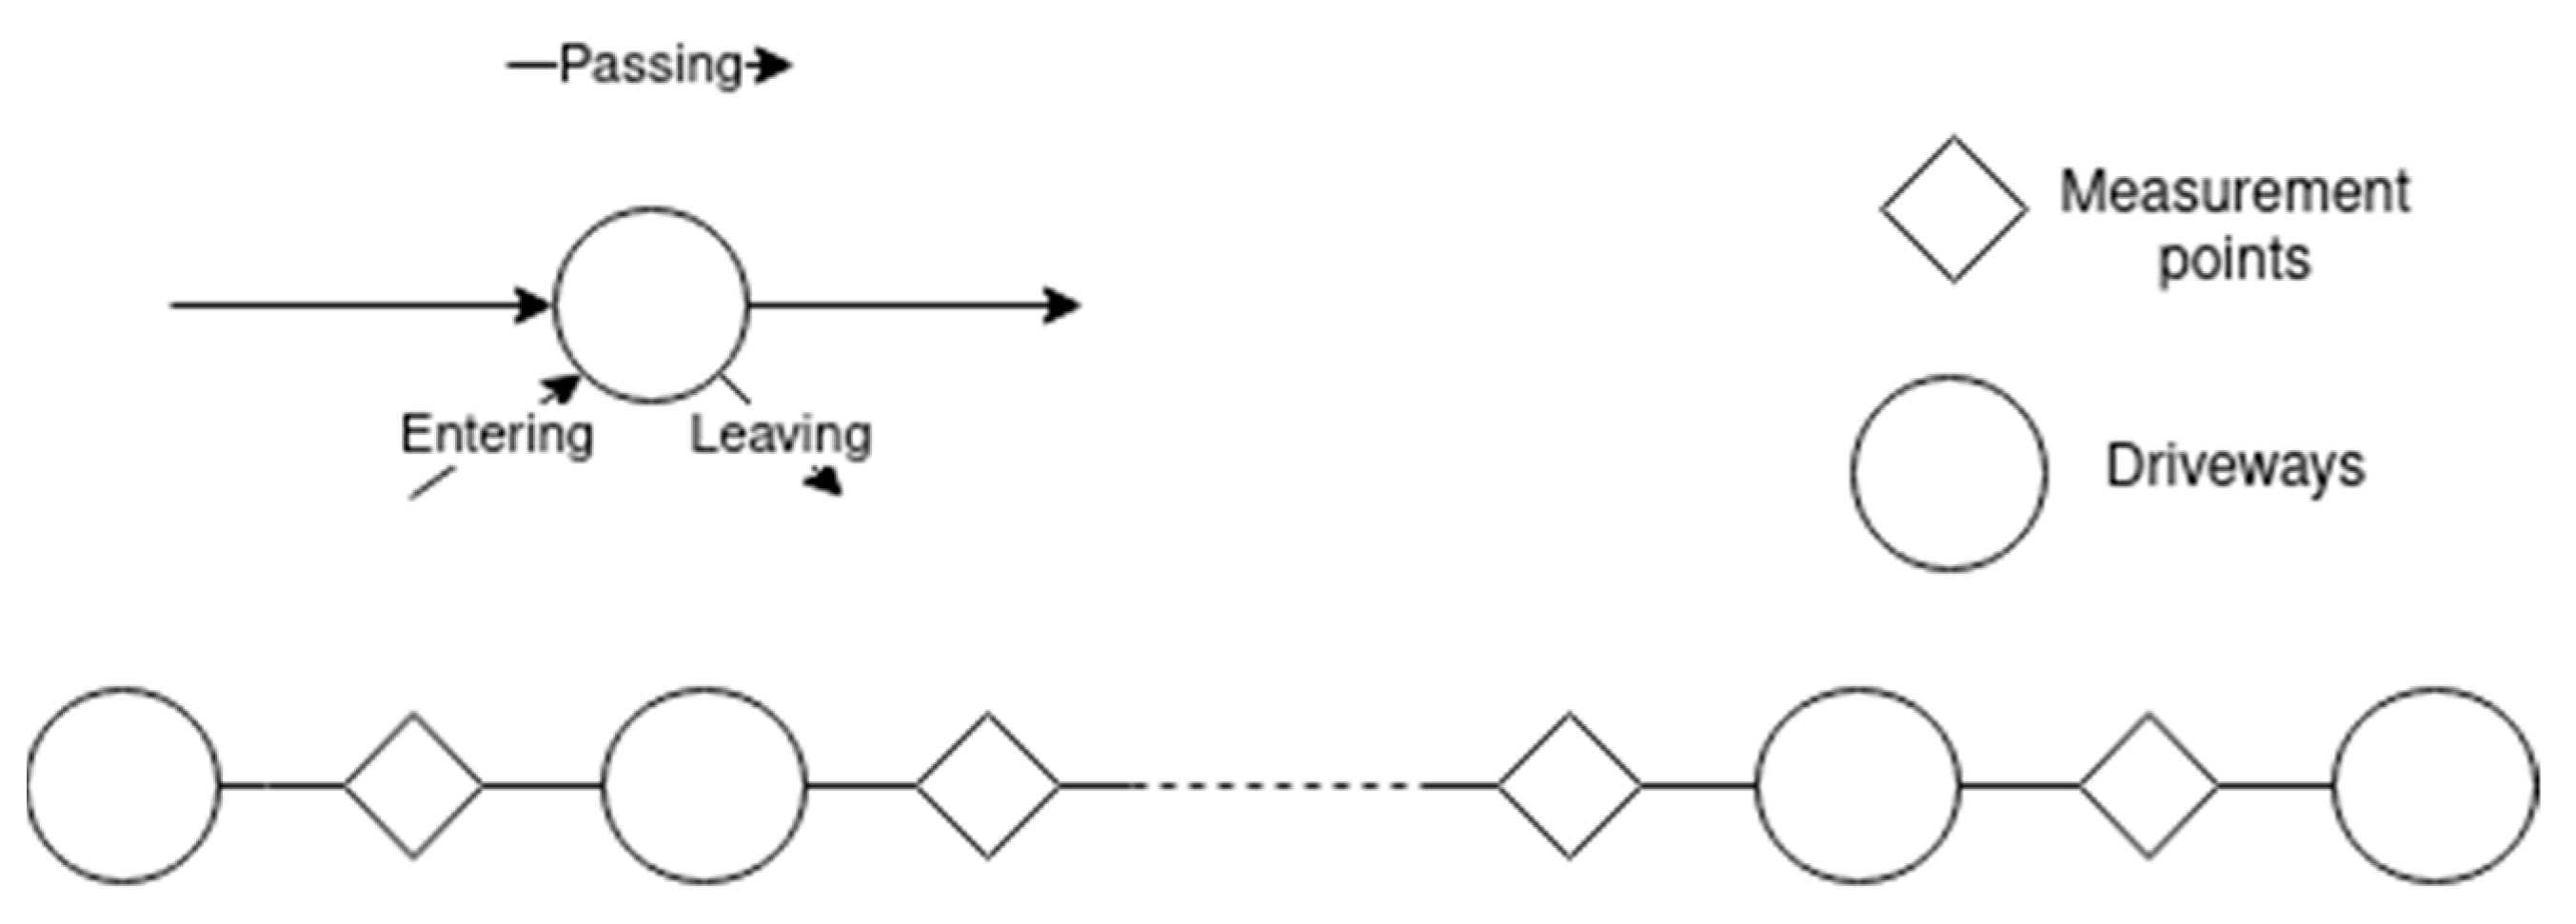
In this measurement, we considered a highway scenario where the vehicles were driving on the M0 motorway. SUMO implements a microscopic traffic simulation, meaning that each vehicle’s movement is simulated individually. To model the vehicles’ movements, it was sufficient to specify where the vehicles entered and left the highway. After that, SUMO handled the exact modeling of the movement. Our road model consisted of one highway and highway driveways where the vehicles could enter, leave or pass on the highway (one road for each direction). First, we calculated the entry, exit, and passing traffic at each driveway (we named it traffic demand; see Figure 4). After that, we calculated the flows (practically each vehicle’s start and end points). Eventually, we transformed these data into a format accepted by the traffic simulator. The entry and exit points were mapped with the map topology of the traffic simulator—SUMO—to interpret these points as the starting and ending points of a particular traffic flow. Using this model and the related calculations, we were able to replicate the traffic counter data in the simulation.

4.3. Transform Data into a Traffic Model

The measurement data were first transformed into our traffic model. To do so, first, we collected the driveway points and ordered them based on their position. After that, we calculated the traffic on the different road segments. This means we took the average of the two subsequent road segments if no measurement points were within the examined road segment. We took their average if there were multiple measurement points on a road segment. We kept the result intact if there was precisely one measurement point between two driveways. Using this method, we calculated the amount of traffic on each road segment.

4.4. Obtaining Demand Information

Based on the traffic on each road segment, we had to calculate the entering, leaving, and passing—e, l, and p in the second indices, respectively—traffic on each driveway. We modeled the traffic situation with m driveways, which is one more than the number of measurement points. There are driveways between each measurement point and an entering and a leaving driveway at the end and beginning of the road segment. Thus, we have m + 1 driveways and m measurement points. We formulated the problem using linear equations. The problem was solved for x with an optimizer tool.
The x values represent the number of entering, passing, and leaving vehicles In each intersection, as denoted by its indices, respectively.
The t values on the equation’s right hand represent the number of passing vehicles on the measurement points. This was known based on real-world measurements.
The A matrix on the left-hand side of Equation (1) has three main sections (Figure 5).
The first section represents that the number of entering and passing vehicles after a driveway equals the number of vehicles in the next measurement point. Due to the long sampling period (1 h), the effect of vehicles that are among the measurement points at the end or beginning of the sample period on the simulation result is negligible. The right-hand side of the matrix represents the measured traffic values after the ith driveway. Naturally, on the last measurement point, there are no entering and passing vehicles; thus, the related number on the right hand is 0. The second section represents that the number of leaving and passing vehicles on a driveway equals the number of vehicles on the preceding measurement point. Naturally, on the first measurement point, there are no leaving and passing vehicles; thus, the corresponding number on the right hand is 0.
The third section (last four rows) represents that the first driveway is modeled in a way that it has only leaving vehicles; thus, the number of passing and entering vehicles is 0. The last driveway only has leaving vehicles, so the number of passing and entering vehicles is 0.
110 000 000     000 110 000     000 000 110 011 000 000     000 011 000     000 000 011 010 000 000 001 000 000 000 000 100 000 000 010 × x 1 , e x 1 , p x 1 , l x i , e x i , p x i , l x m ± 1 , e x m + 1 , p x m + 1 , l = t 0 t i t m 0 0 t 0 t i t m 0 0 0 0
Here, the following constraints apply:
A _ _   ×   x _   =   t _
x i 0   i
S o   t h a t   m i n { i A i _ _ × x i _ t i _ 2 }
Naturally, constraint (2) was applied. Constraint (3) defines that each x must be larger or equal to 0, meaning that the number of vehicles cannot be smaller than 0.
If the number of measurement points was higher than 4, the number of columns exceeded the number of rows. This means that the system is underdetermined, which means that there are either zero or an infinite number of solutions. In order to provide a solution with relatively small x values, we optimized for Equation (4). This problem will provide us with the number of vehicles leaving, entering, and passing on each driveway. The algorithm also ensures correctness in converting the generated data into flows. On the first and last road segments, there are only entering and leaving vehicles, respectively. This method had to be applied in both driving directions.

4.5. The Proposed Algorithm to Calculate the Flows

We designed an algorithm (Algorithm 1) to convert the demand values into vehicle flows. The algorithm walked through the driveways starting from the nearest and tried to assign as much of its entry demand as possible to the existing values in the other driveways. The algorithm generated the necessary flows, which were converted to the SUMO format. The algorithm had to be applied in both directions.

4.6. Generalization of the Solution

The current solution can only be applied to traffic models with only one highway. This algorithm can be easily extended to more complex networks with multiple highways. In such traffic networks, only the connections have to be handled, and after that, the proposed algorithm can be applied without any changes. Taking such connections is quite an easy problem to solve, but it is not in the scope of the current document.

5. Measurement Details and Results

In V2X networks, the most crucial channel load parameter is the CBR—Channel Busy Ratio. The relevant ETSI standard defines the measurement of this parameter. The V2X protocols also use this value for congestion control [60]. This work focused on this CBR parameter affecting the V2X channel scalability and measured CBR values on eight R-ITS-S nodes and all the V-ITS-S nodes within the selected highway section. With the evaluation of this CBR parameter, we wanted to highlight two different perspectives. On the one hand, we wanted to depict the CBR values on some well-defined measurement points in the network with the first approach. This approach gives us an overview of the average CBR values in the whole network and represents the R-ITS-S perspectives. We took the average of the CBR values measured on the R-ITS-S devices to measure this parameter. On the other hand, we tried to highlight the perspective of the vehicles. We wanted to show what CBR values an average vehicle will see when it participates in the traffic with this value. We calculated the average CBR value on each V-ITS-S node to measure this parameter and took the average of the calculated average CBR parameters.

5.1. CA Service

The standalone use of CA service is typical today in the so-called Day1 scenarios or deployments. In some cases, Day1 use cases also include DENM and IVIM messages in highway scenarios; however, these message types were not in the scope of this work, since they would only change the results marginally.
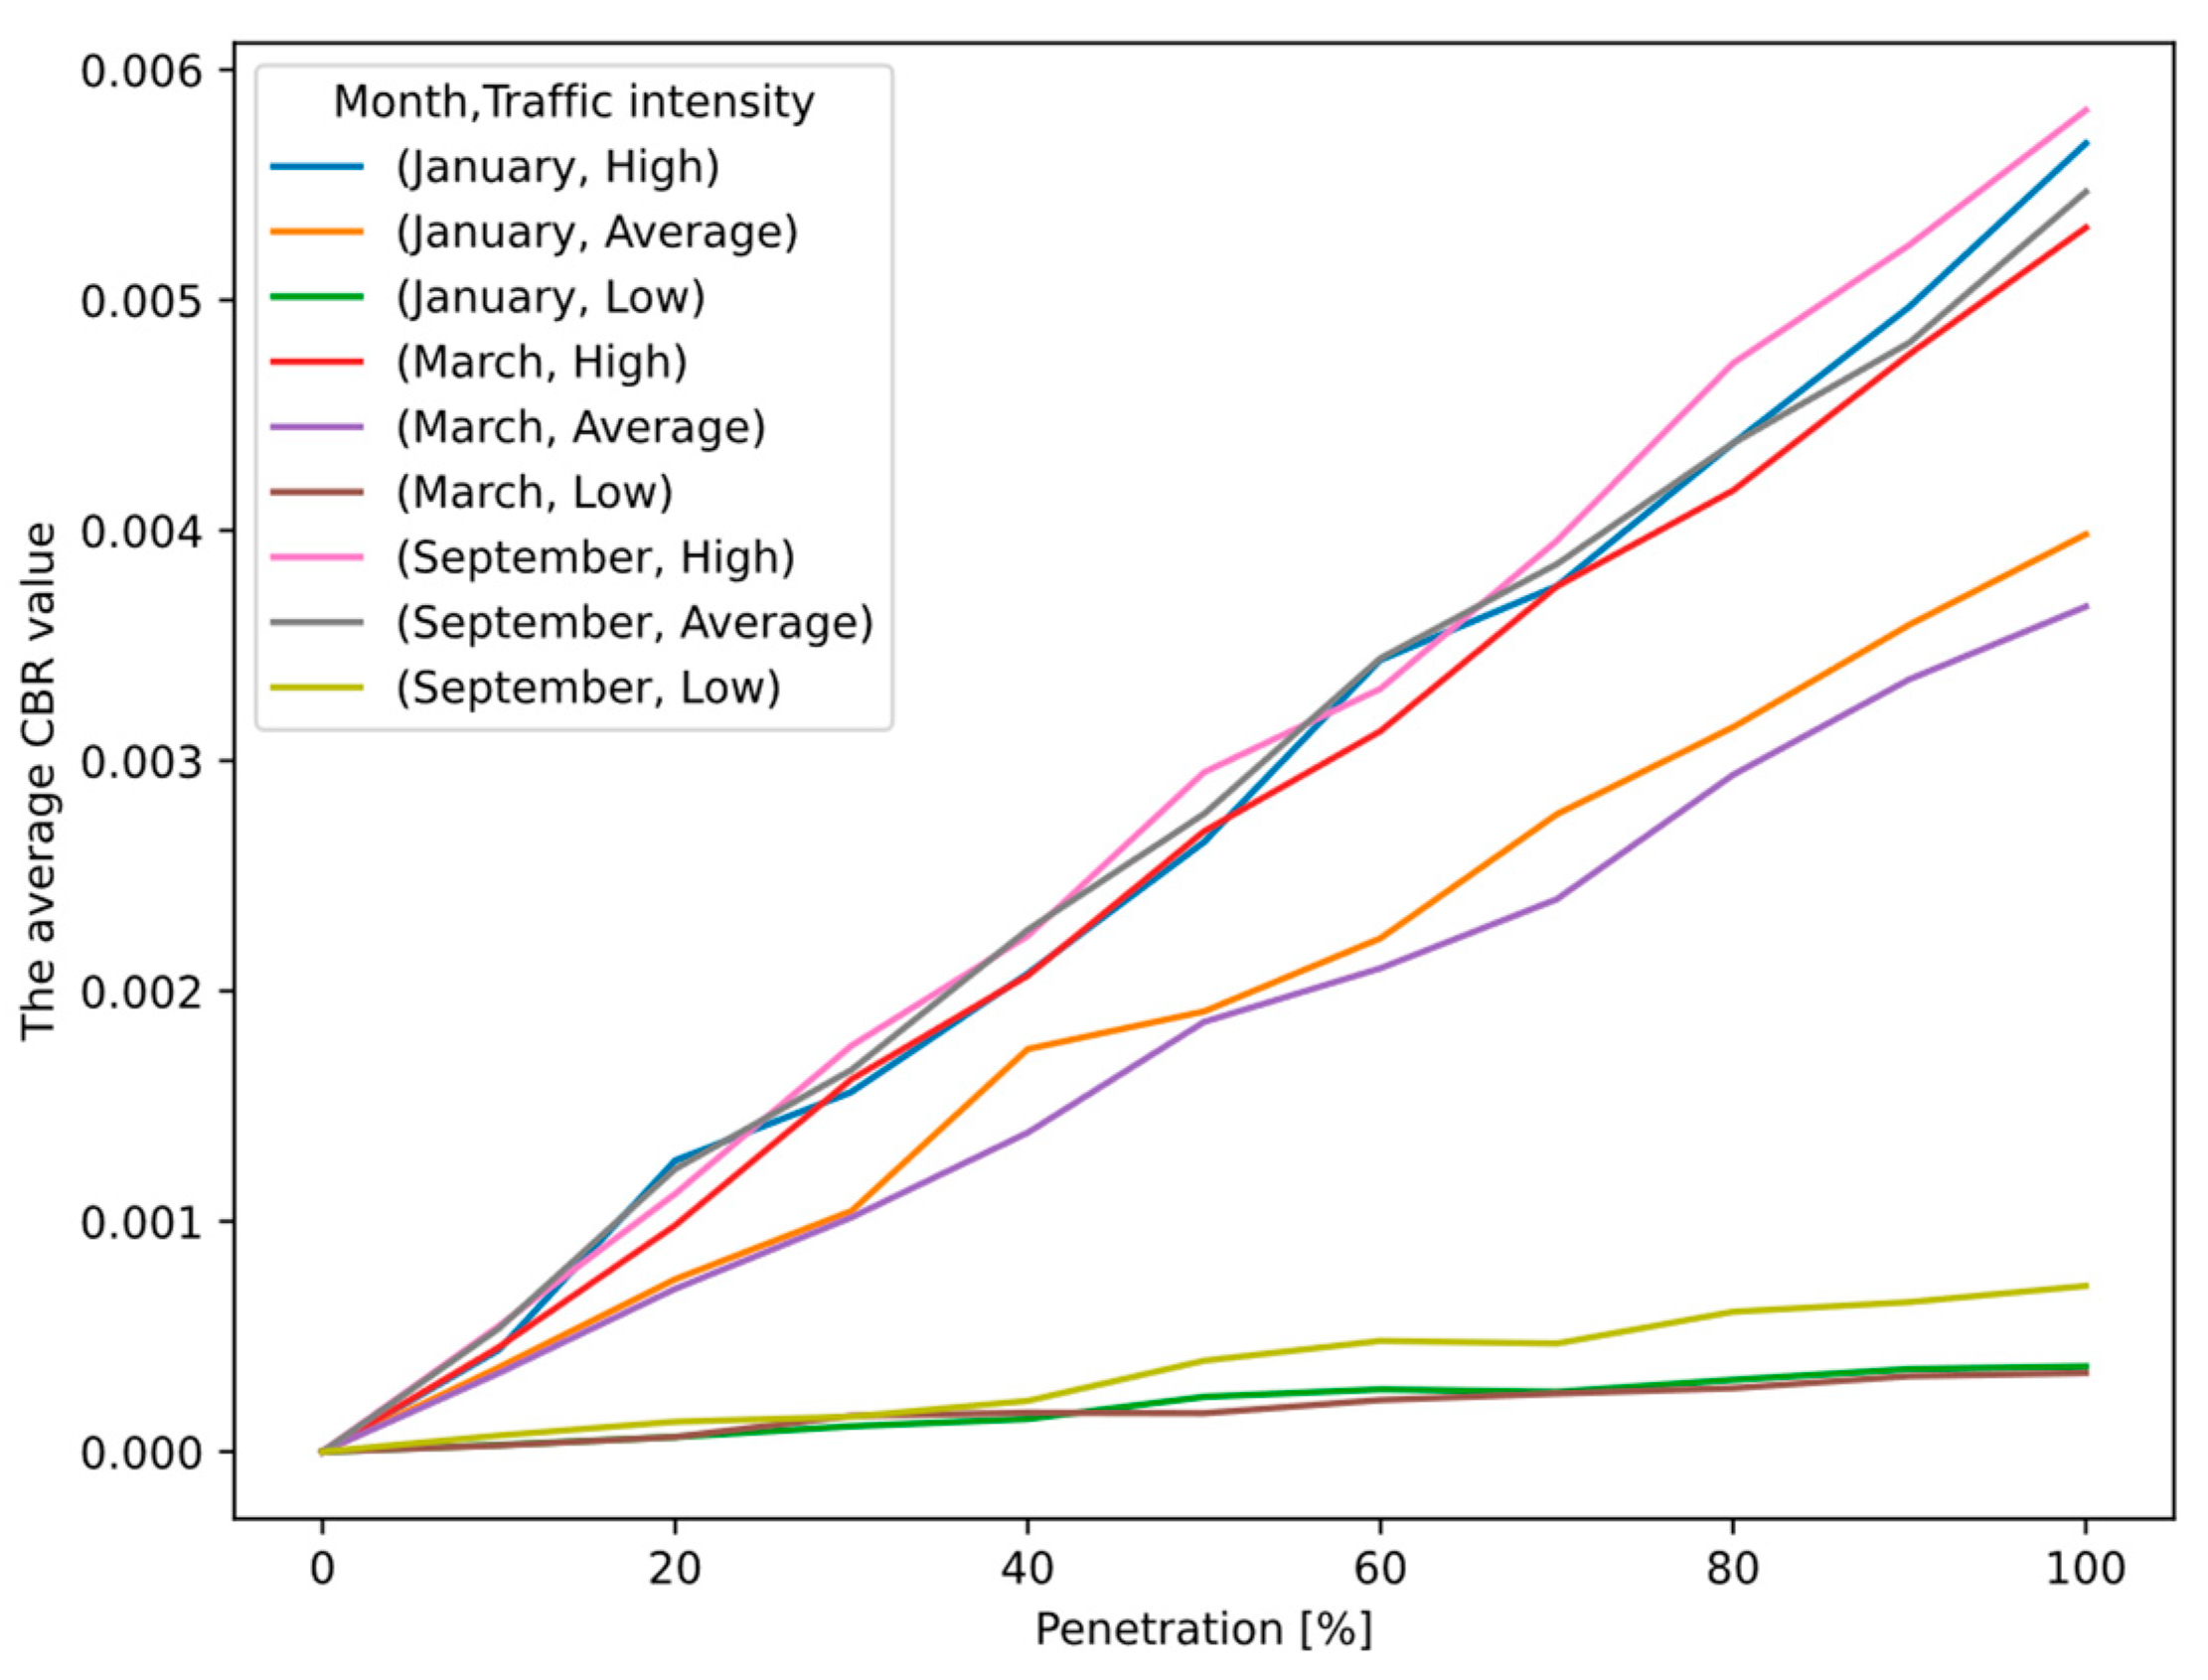
Figure 6 shows that the CBR values will remain low if we only use the CA service. This means that the maximum value of the CBR remains around 6% even with the assumption of 100% penetration—this is approximately half of the value measured with both CP and CA services. We can also see in Figure 6 and Figure 7 that the data are growing nearly linearly.
Figure 7 shows that the average CBR values reported by V-ITS-S nodes are slightly higher than those reported by R-ITS-S nodes. The clusterization is more or less similar to the CAM and CPM scenarios.

5.2. CP Service

The CPM—Collective Perception Message—is a message type that can drive so-called Day2—or perception sharing—use cases. The CPMs and CAMs are both sent by V-ITSS nodes and are also sent quite regularly, in many cases with 10 Hz—unlike, for example, the DENM. This means that CAM+CPM messages are responsible for the majority of channel usage. We can assume that if an ITSS supports CPM, it also supports CAM. The measurement of the standalone CP service still makes sense, because ITSG5 supports multiple channels, and it is not certain whether CA and CP services will be deployed on the same channel in the future. We have to emphasize that in our CPM model—thanks to the Artery framework’s sensor and environment architecture—the generation of the perception messages perfectly complies with the characteristics of the realistic, traffic-given environment. This means that the size of every CPM message is in line with the actually sensed number of objects (other vehicles in the ego sensor range) for every V-ITS-S during the simulation.
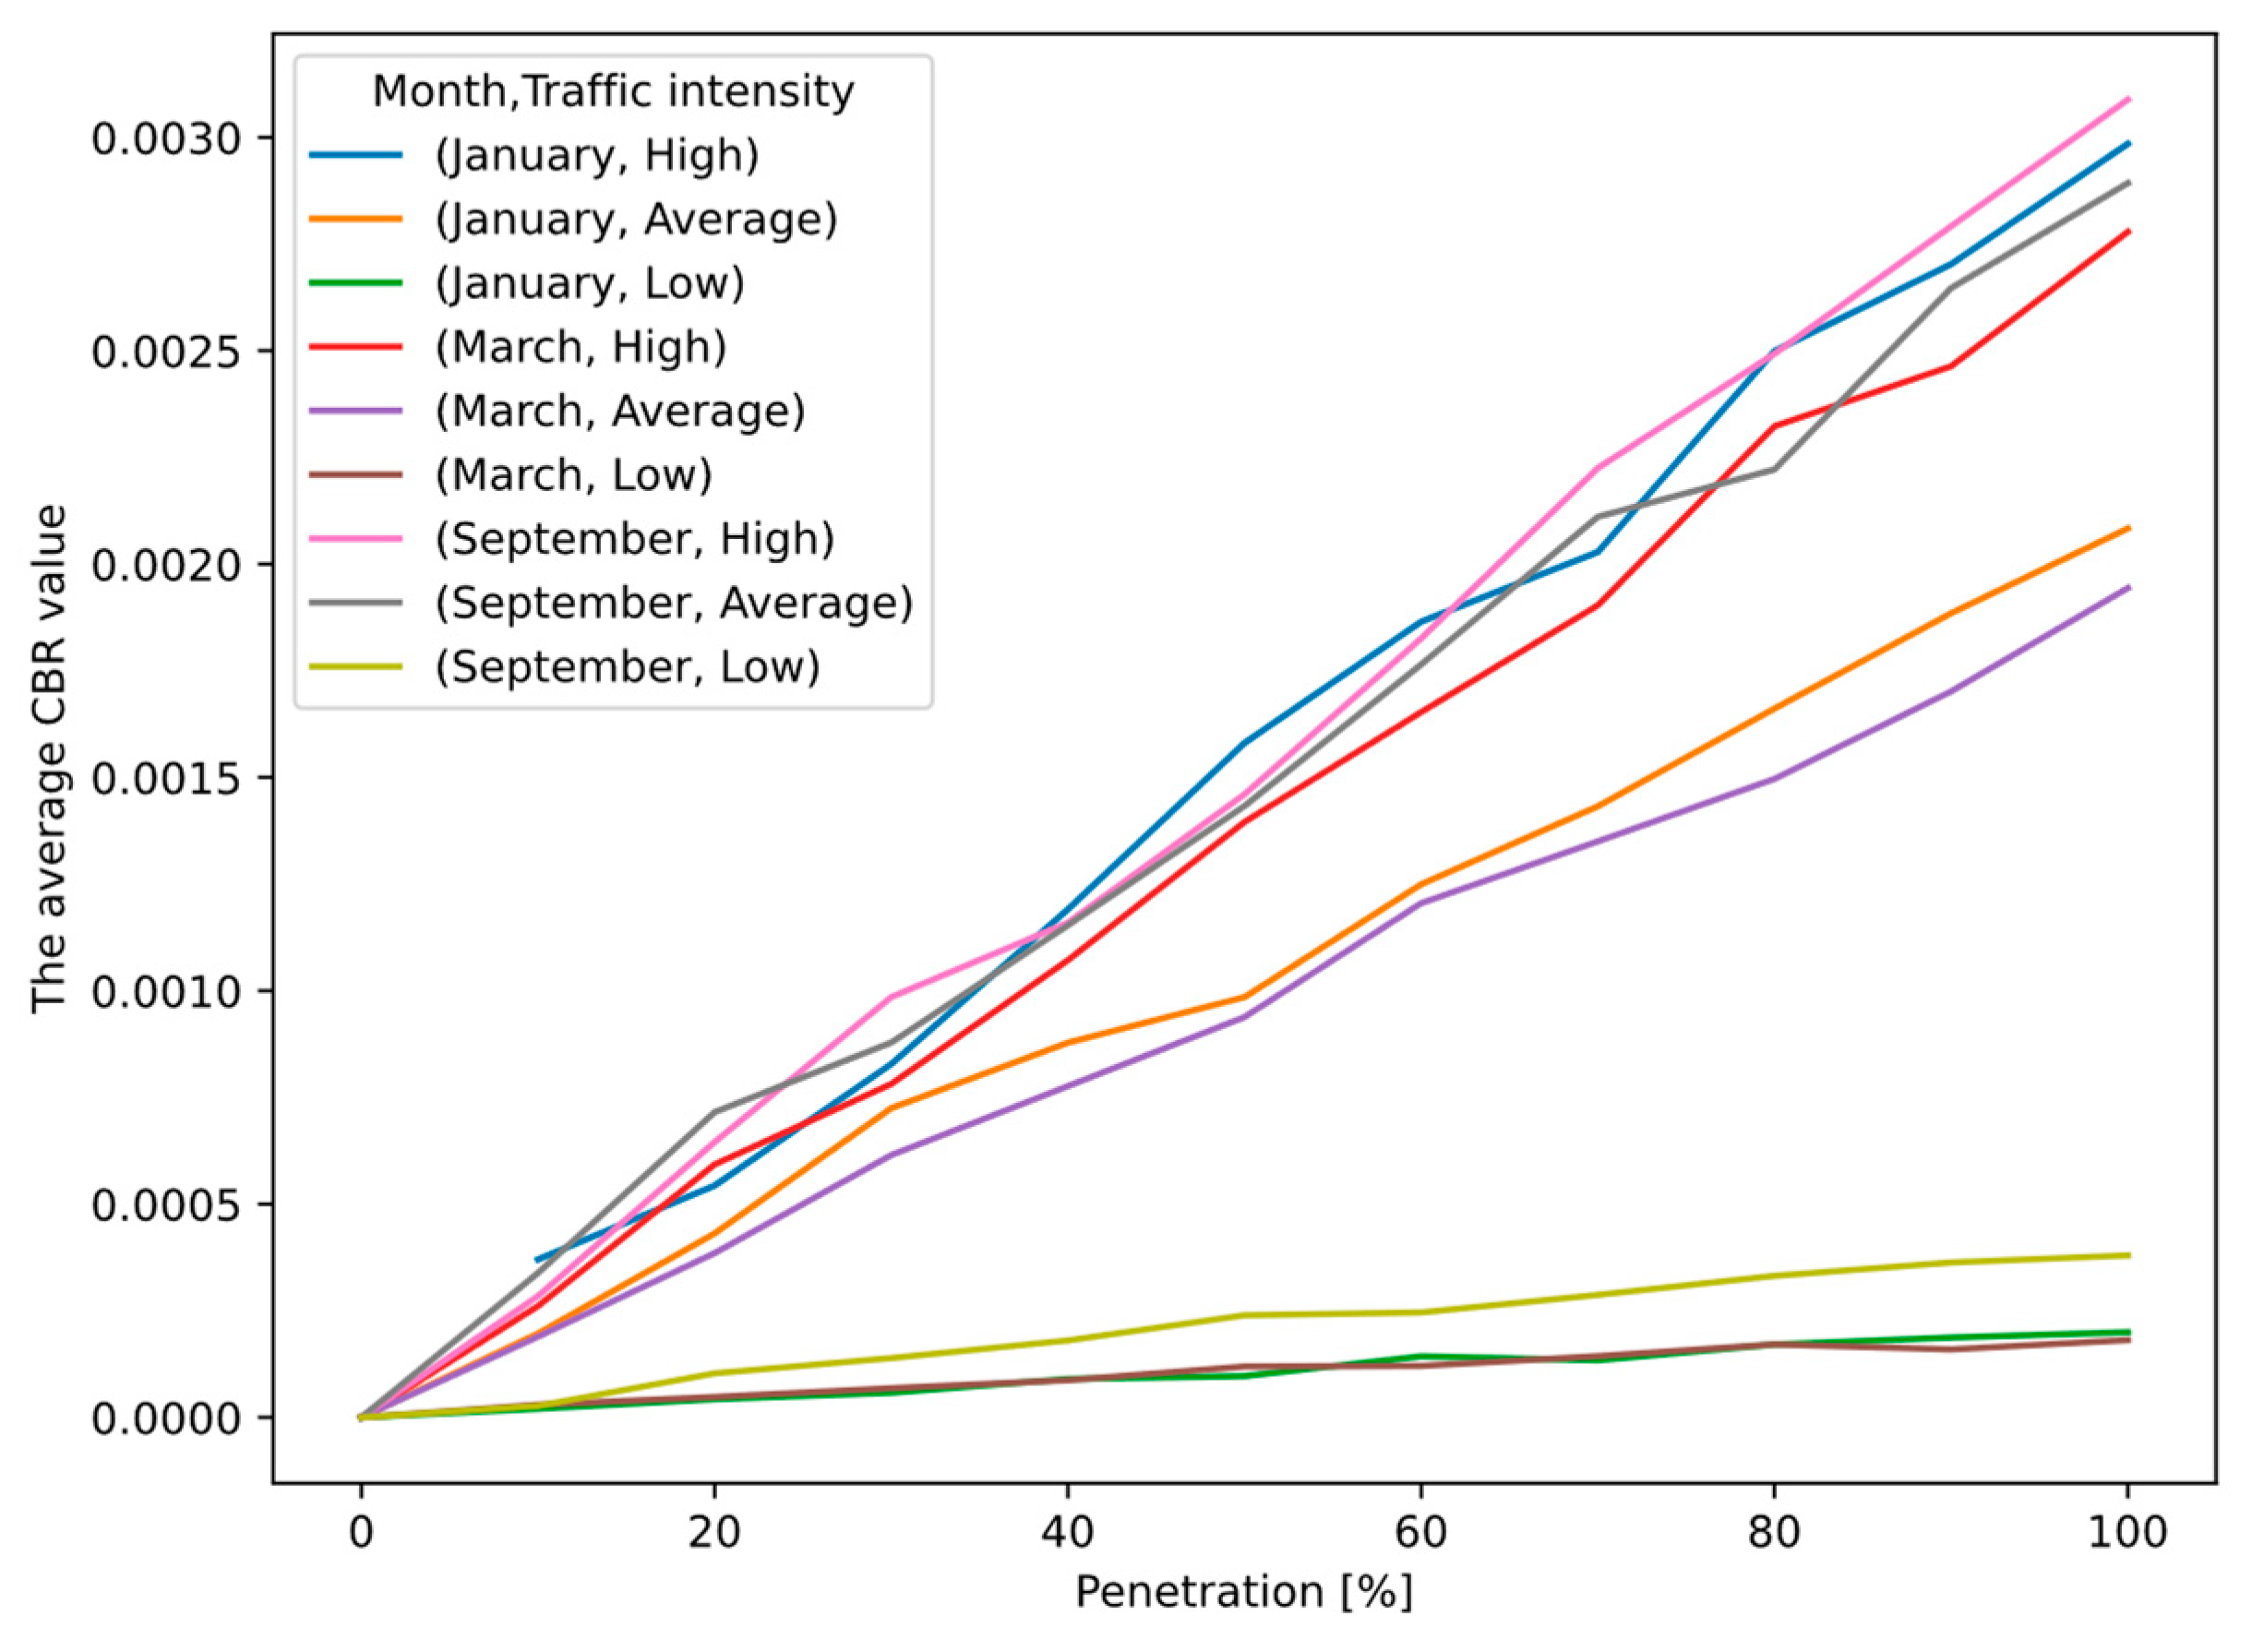
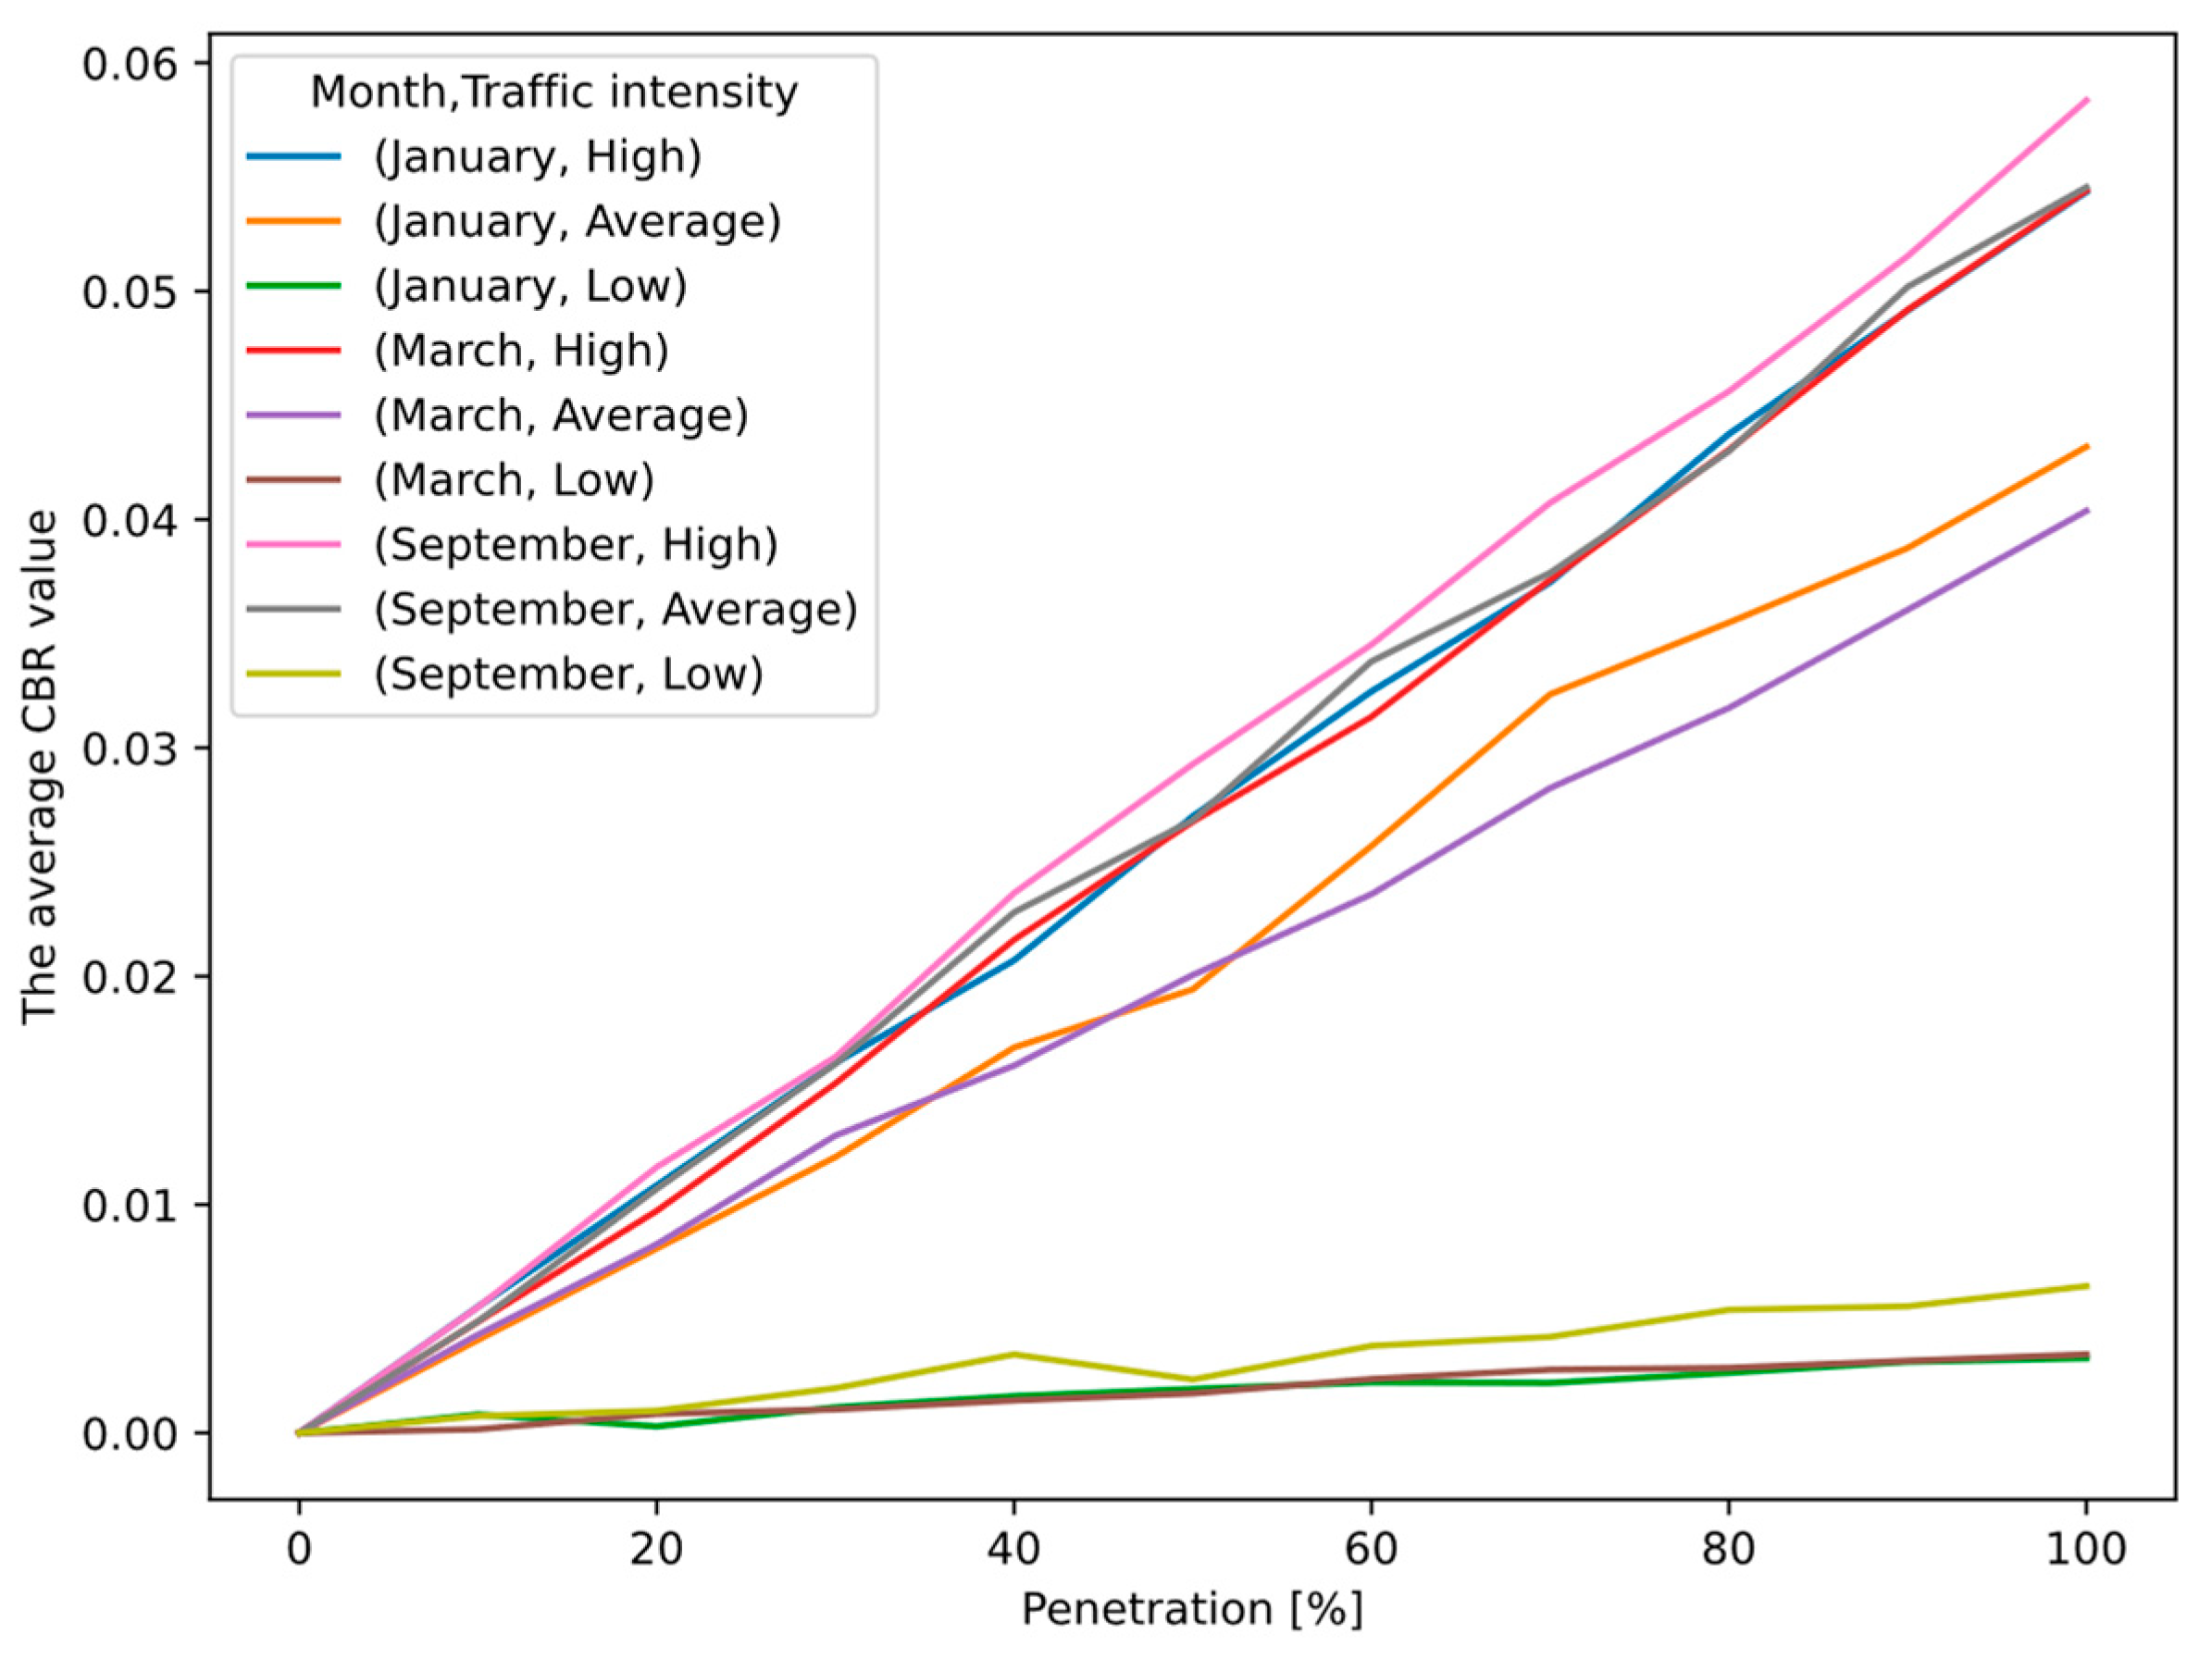
The simulation results show that the CP service is responsible for a similar CBR value compared to the CA service considering the applied vehicle traffic parameters. This is visible in Figure 8. The maximum CBR value was around 6% in each scenario.
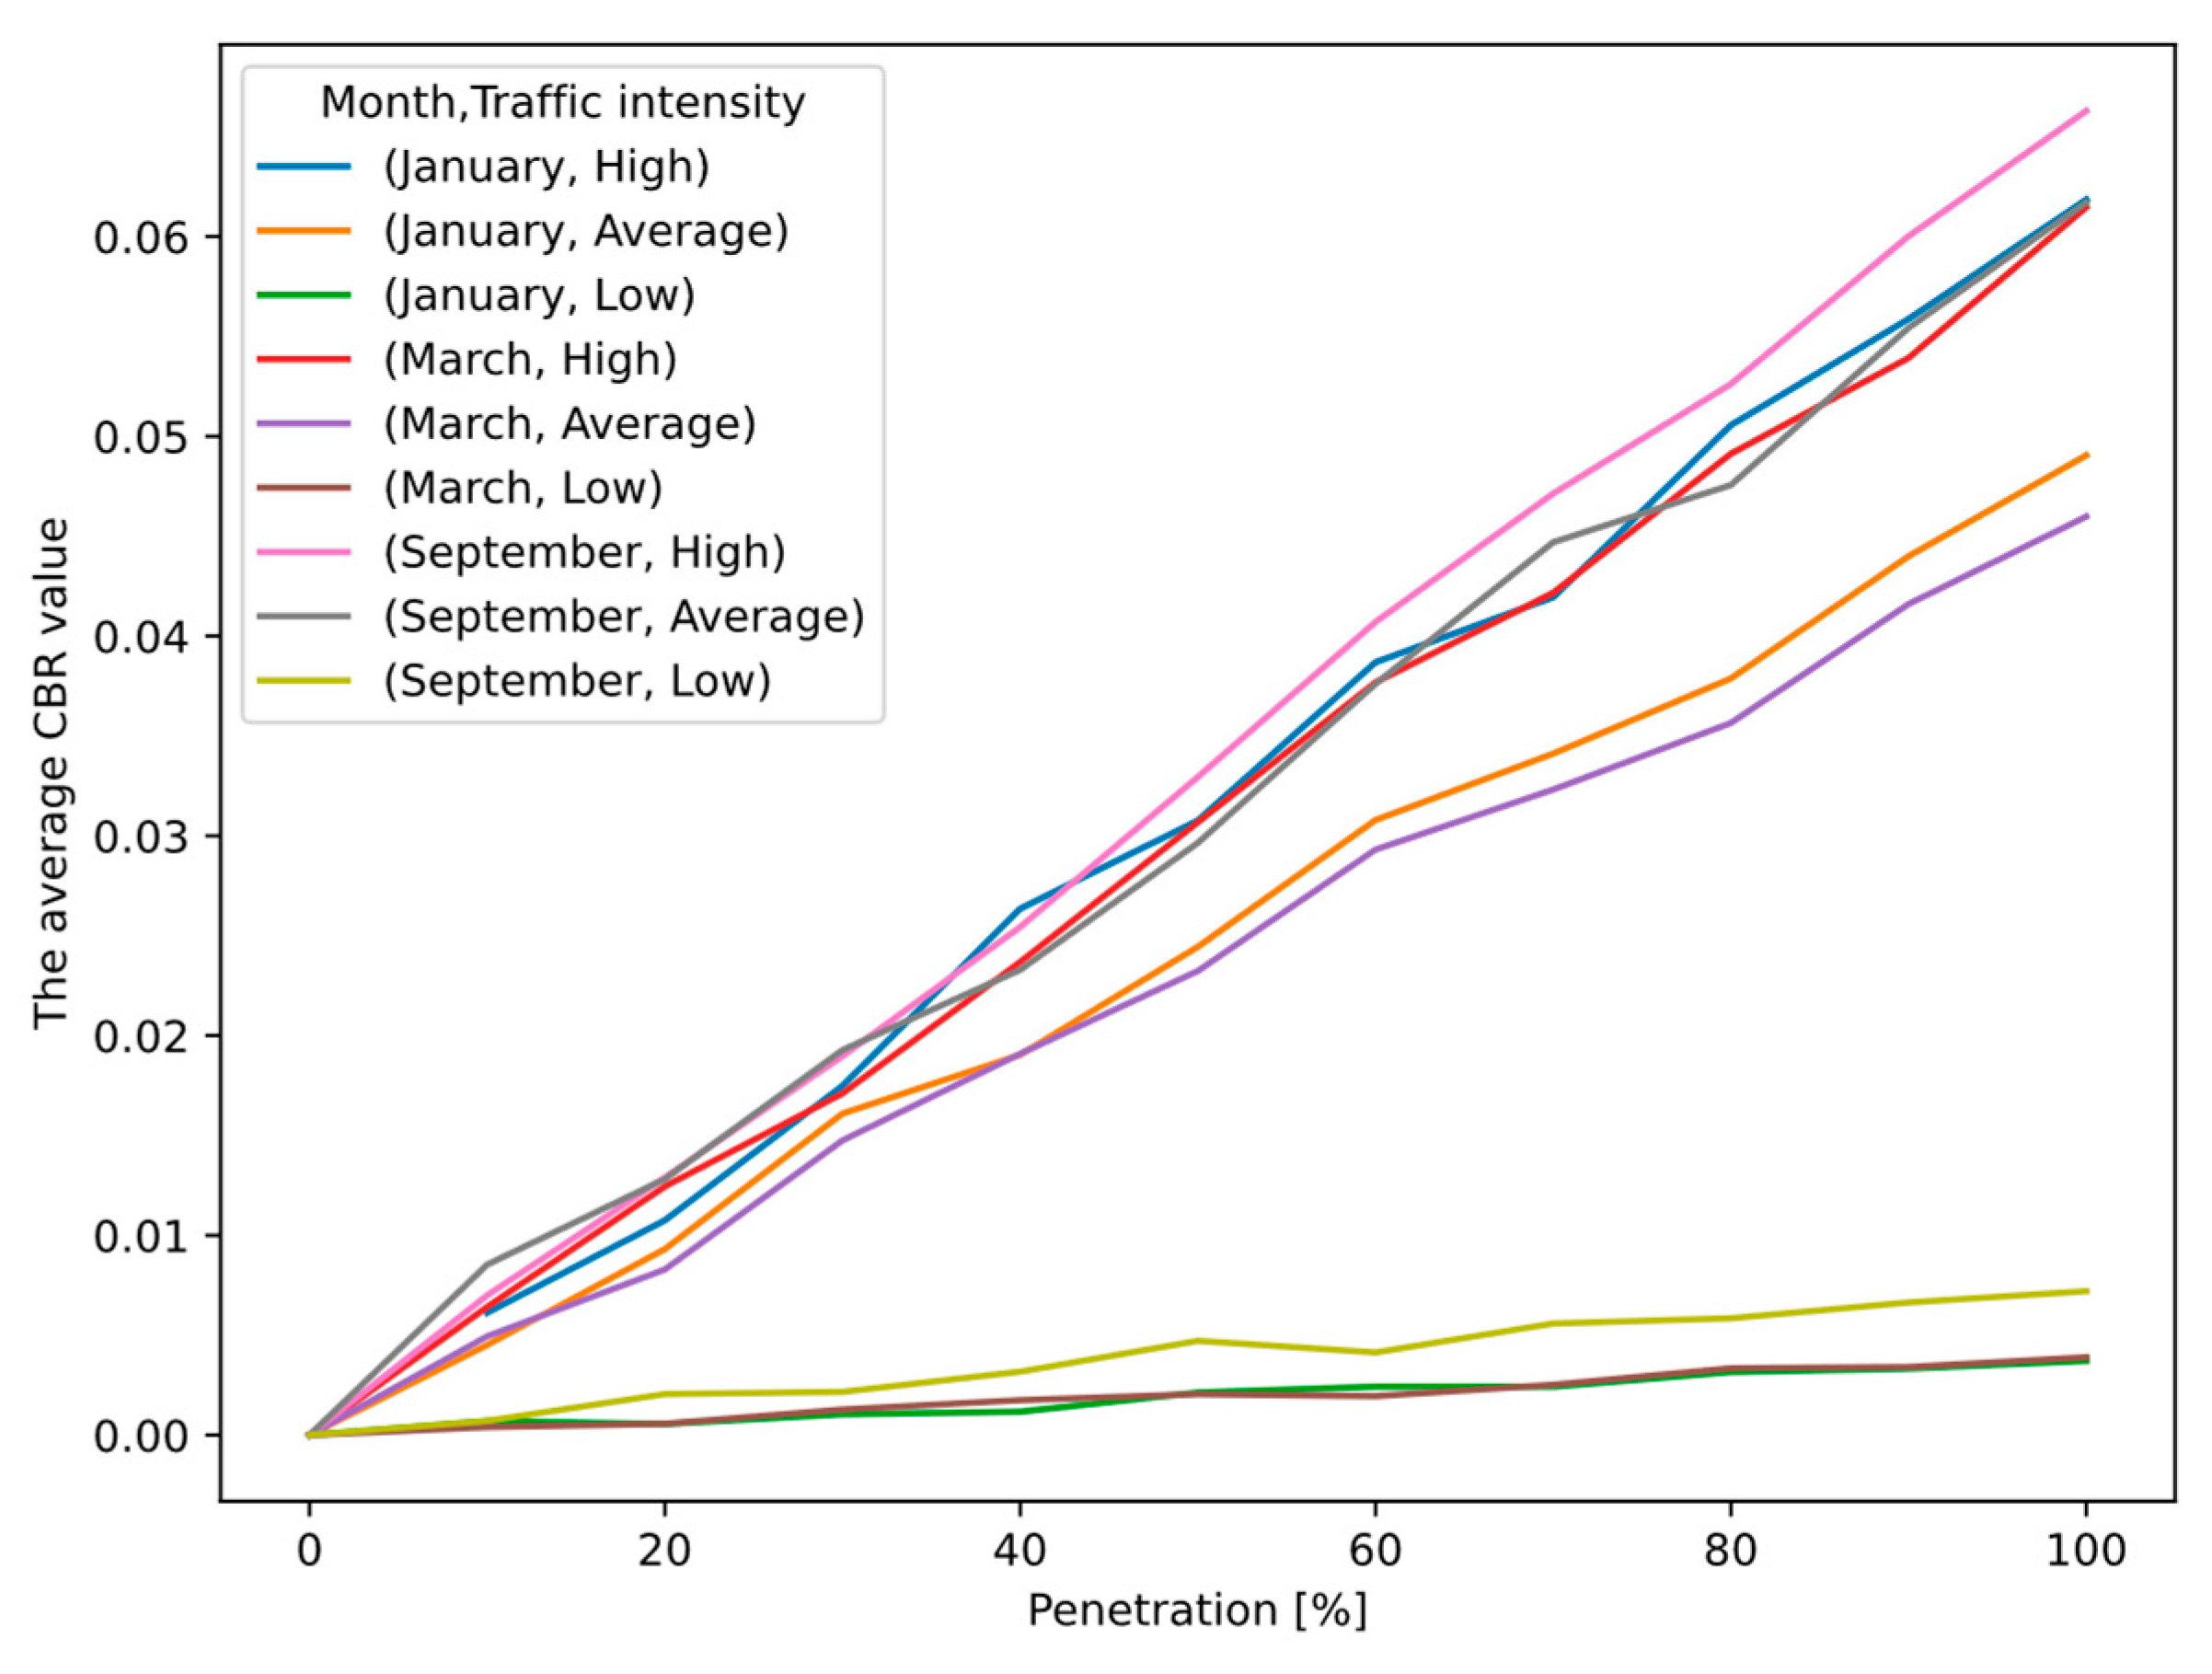
We can see in the Figure 9 diagram that the measured values are slightly higher than the ones measured on the R-ITS-S nodes.
We can observe in Figure 8 and Figure 9 that if we add the values measured in the CAM and CPM scenarios, the result will be about the same as in the combined CAM + CPM scenario alone. This is due to the relatively low channel usage. We can also see that the traffic measurement intervals with low traffic have only minor channel usage.

5.3. CA and CP Combined Services

In the combined usage of CA and CP services, we can see in Figure 10 and Figure 11 that the CBR value increases almost linearly with the V2X penetration. In the case of the highway scenario, the CBR value was at most 12%, which means that the channel is capable of handling a lot more additional services than just the CAM and CP services—or, in other words, it is capable of providing the CAM and CP services on a high service level. We can also see from Figure 10 that the CBR values are growing almost linearly with the penetration. We can also see that lower traffic generates higher average CBR values. These symptoms are valid, since the simulation has a stochastic nature, and the selection of traffic densities does not consider the traffic patterns.
In Figure 10 and Figure 11, we can observe that the two different approaches provide similar results. The R-ITS-S nodes experience slightly lower CBR values than the regular V-ITS-S nodes.
We can also see that the CBR values are characterized mainly by three different clusters, one representing the minimum values, one representing the average values of January and March, and one representing the maximal intervals and the average of September. From the diagram, we can see that September is quite a busy month from a traffic perspective.

6. Conclusions

In this work, we successfully modeled the C-ITS infrastructure of the Budapest Ring Road (expressway M0) and simulated V2X messaging of Day1 and Day2 cooperative services using real-world traffic data measurements in our implementation. The traffic data were processed and fed to the simulation engine, which used a detailed implementation of the overall V2X communication chain from the access and networking layers through the facilities and toward the applications/services.
We could see from the results that the V2X channel load remained in the acceptable range in every case. In the case of 20% penetration—which could represent the V2X penetration in the foreseeable future—the CBR value was about 0.02 in the combined CAM and CPM case and only about 0.01 in the case of single CA or CP services (both from the infrastructure’s and the vehicle’s point of view).
However, as the V2X penetration grows and the number/bandwidth requirements of C-ITS services increases, the ITS-G5 channel will definitely see more considerable challenges: it might quickly be saturated in Day2 and beyond scenarios. Multi-Channel Operation (MCO) techniques can be applied to mitigate this problem.
Our future work is to implement a complete list of ITS services with all the possible Day1/2/3 applications in the created C-ITS environment and analyze the precise conditions of channel saturation during the modeled realistic traffic situations.

Author Contributions

Conceptualization, L.B.; Writing – original draft, A.W., T.A.T. and L.B.; Writing – review & editing, T.A.T. and M.V. All authors have read and agreed to the published version of the manuscript.

Funding

C-ITS deployment and services evaluation was co-funded by the European Commission through the Connecting Europe Facility (C-Roads Hungary project, Action no. 2016-HU-TMC-0216-M and C-Roads 2 Hungary project, Action no. 2018-HU-TM-0092-M).

Informed Consent Statement

Not applicable.

Data Availability Statement

Not applicable.

Conflicts of Interest

The authors declare no conflict of interest.

References

  1. C-Roads. The Platform of Armonizedd C-ITS Deployment in Europe. Available online: https://www.c-roads.eu/ (accessed on 26 April 2023).
  2. C-Roads Brochure. Available online: https://www.c-roads.eu/fileadmin/user_upload/media/Dokumente/C-Roads_Brochure_2021_final_2.pdf (accessed on 26 April 2023).
  3. CROCODILE Project. Available online: https://crocodile.its-platform.eu/ (accessed on 26 April 2023).
  4. Szalay, Z. Next Generation X-in-the-Loop Validation Methodology for Automated Vehicle Systems. IEEE Access 2021, 9, 35616–35632. [Google Scholar] [CrossRef]
  5. Tomaschek, T. Towards Connected and Automated Driving in Hungary–The Changing Role of the Road Operator. In Proceedings of the MAÚT 25 International Scientific Symposium, Budapest, Hungary, 17–18 September 2019. [Google Scholar]
  6. Commsignia Ltd. Connecting Cars with Each Other and the Smart City Infrastructure. Available online: https://www.commsignia.com/ (accessed on 26 April 2023).
  7. Varga, A. OMNeT++. In Modeling and Tools for Network Simulation; Wehrle, K., Güneş, M., Gross, J., Eds.; Springer: Berlin/Heidelberg, Germany, 2010. [Google Scholar] [CrossRef]
  8. Lopez, P.A.; Behrisch, M.; Bieker-Walz, L.; Erdmann, J.; Flotterod, Y.P.; Hilbrich, R.; Lucken, L.; Rummel, J.; Wagner, P.; Wiebner, E. Microscopic Traffic Simulation using SUMO. In Proceedings of the 2018 21st International Conference on Intelligent Transportation Systems (ITSC), Maui, HI, USA, 4–7 November 2018; pp. 2575–2582. [Google Scholar] [CrossRef] [Green Version]
  9. INET Framework. An Open-Source OMNeT++ Model Suite for Wired, Wireless and Mobile Networks. Available online: https://inet.omnetpp.org/ (accessed on 26 April 2023).
  10. Sommer, C.; German, R.; Dressler, F. Bidirectionally Coupled Network and Road Traffic Simulation for Improved IVC Analysis. IEEE Trans. Mob. Comput. 2011, 10, 3–15. [Google Scholar] [CrossRef] [Green Version]
  11. Vanetza. An Open-Source Implementation of the ETSI C-ITS Protocol Suite. Available online: https://www.vanetza.org/ (accessed on 26 April 2023).
  12. IEEE Standard 802.11-2016; IEEE Standard for Information Technology–Telecommunications and Information Exchange between Systems Local and Metropolitan area Networks–Specific Requirements–Part 11: Wireless LAN Medium Access Control(MAC) and Physical Layer (PHY) Specifications. IEEE: Piscataway, NJ, USA, 2016.
  13. Riebl, R.; Obermaier, C.; Günther, H.J. Artery: Large Scale Simulation Environment for ITS Applications. In Recent Advances in Network Simulation. EAI/Springer Innovations in Communication and Computing; Virdis, A., Kirsche, M., Eds.; Springer: Cham, Switzerland, 2019. [Google Scholar] [CrossRef]
  14. Herbert, M.; Váradi, A.; Bokor, L. Modelling and Examination of Collective Perception Service for V2X Supported Autonomous Driving. In Proceedings of the 11th International Conference on Applied Informatics (ICAI), CEUR, Aachen, Germany, 29–31 January 2020; pp. 138–149. Available online: http://ceur-ws.org/Vol-2650/paper15.pdf (accessed on 26 April 2023).
  15. ETSI TR 103 562 V2.1.1; Intelligent Transport Systems (ITS); Vehicular Communications; Basic Set of Applications; Analysis of the Collective Perception Service (CPS); Release 2. ETSI: Nice, France, 2019.
  16. ETSI TS 103 300-2 V2.1.1; Intelligent Transport System (ITS); Vulnerable Road Users (VRU) Awareness; Part 2: Functional Architecture and Requirements Definition; Release 2. ETSI: Nice, France, 2020.
  17. ETSI EN 302 637-2; Intelligent Transport Systems (ITS); Vehicular Communications; Basic Set of Applications; Part 2: Specification of Cooperative Awareness Basic Service—v1.4.1. ETSI: Nice, France, 2019.
  18. ETSI TS 102 687 V1.2.1; Intelligent Transport Systems (ITS); Decentralized Congestion Control Mechanisms for Intelligent Transport Systems operating in the 5 GHz Range; Access Layer Part. ETSI: Nice, France, 2018.
  19. Alalewi, A.; Dayoub, I.; Cherkaoui, S. On 5G-V2X Use Cases and Enabling Technologies: A Comprehensive Survey. IEEE Access 2021, 9, 107710–107737. [Google Scholar] [CrossRef]
  20. Llatser, I.; Michalke, T.; Dolgov, M.; Wildschütte, F.; Fuchs, H. Cooperative Automated Driving Use Cases for 5G V2X Communication. In Proceedings of the 2019 IEEE 2nd 5G World Forum (5GWF), Dresden, Germany, 30 September–2 October 2019; pp. 120–125. [Google Scholar] [CrossRef]
  21. Correa, A.; Alms, R.; Gozalvez, J.; Sepulcre, M.; Rondinone, M.; Blokpoel, R.; Lucken, L.; Thandavarayan, G. Infrastructure Support for Cooperative Maneuvers in Connected and Automated Driving. In Proceedings of the 2019 IEEE Intelligent Vehicles Symposium (IV), Paris, France, 9–12 June 2019; pp. 20–25. [Google Scholar] [CrossRef]
  22. He, J.; Tang, Z.; Fu, X.; Leng, S.; Wu, F.; Huang, K.; Huang, J.; Zhang, J.; Zhang, Y.; Radford, A.; et al. Cooperative Connected Autonomous Vehicles (CAV): Research, Applications and Challenges. In Proceedings of the 2019 IEEE 27th International Conference on Network Protocols (ICNP), Chicago, IL, USA, 7–10 October 2019; pp. 1–6. [Google Scholar] [CrossRef]
  23. Zhang, Z.; Yu, L.; Fan, X.; Li, Y.; Wang, L. A Survey of V2X Testing for Cooperative Connected and Automated Mobility. In Proceedings of the 2021 IEEE 24th International Conference on Computer Supported Cooperative Work in Design (CSCWD), Dalian, China, 5–7 May 2021; pp. 942–946. [Google Scholar] [CrossRef]
  24. Cinque, E.; Valentini, F.; Persia, A.; Chiocchio, S.; Santucci, F.; Pratesi, M. V2X Communication Technologies and Service Requirements for Connected and Autonomous Driving. In Proceedings of the 2020 AEIT International Conference of Electrical and Electronic Technologies for Automotive (AEIT AUTOMOTIVE), Turin, Italy, 18–20 November 2020; pp. 1–6. [Google Scholar] [CrossRef]
  25. Antonakoglou, K.; Brahmi, N.; Abbas, T.; Fernandez Barciela, A.E.; Boban, M.; Cordes, K.; Fallgren, M.; Gallo, L.; Kousaridas, A.; Li, Z.; et al. On the Needs and Requirements Arising from Connected and Automated Driving. J. Sens. Actuator Netw. 2020, 9, 24. [Google Scholar] [CrossRef]
  26. Guerrieri, M.; Mauro, R.; Pompigna, A.; Isaenko, N. Road Design Criteria and Capacity Estimation Based on Autonomous Vehicles Performances. First Results from the European C-Roads Platform and A22 Motorway. Transp. Telecommun. J. 2021, 22, 230–243. [Google Scholar] [CrossRef]
  27. Lokaj, Z.; Srotyr, M.; Vanis, M.; Broz, J. Technical part of evaluation solution for cooperative vehicles within C-ROADS CZ project. In Proceedings of the 2020 Smart City Symposium Prague (SCSP), Prague, Czech Republic, 25–25 June 2020. [Google Scholar]
  28. Ribeiro, J.; Moura, L. A-to-Be experience: Deploying a Portuguese highway C-ITS network under C-ROADS Portugal. In Proceedings of the 14th ITS European Congress, Lisbon, Portugal, 18–20 May 2020. [Google Scholar]
  29. Godarzi, F.; Reiff, T.; Cheung, S.; Hirschberger, M.; Pei, Y. C-Roads Germany. TRA 2020. In Proceedings of the 8th Transport Research Arena, Helsinki, Finland, 27–30 April 2020. [Google Scholar]
  30. Liu, Y.; Wang, Z.; Li, Y.; Zhou, X.; Ma, C.; Pan, D. V2X-based forward collision avoidance algorithm considering target multi-front vehicles interaction risk. SPIE 2023, 12642, 1264222. [Google Scholar]
  31. Liu, Y.; Wang, X.; Zhang, Y.; Wang, Y. An effective target selection method for forward collision on a curve based on V2X. In Proceedings of the 2022 7th International Conference on Intelligent Informatics and Biomedical Science (ICIIBMS), Nara, Japan, 24–26 November 2022; Volume 7. [Google Scholar]
  32. Ma, J.; Li, J.; Huang, H. Evaluation of Multimodal and Multi-Staged Alerting Strategies for Forward Collision Warning Systems. Sensors 2022, 22, 1189. [Google Scholar] [CrossRef] [PubMed]
  33. Wu, Q.; Zhou, S.; Pan, C.; Tan, G.; Zhang, Z.; Zhan, J. Performance analysis of cooperative intersection collision avoidance with c-v2x communications. In Proceedings of the 2020 IEEE 20th International Conference on Communication Technology (ICCT), Nanning, China, 28–31 October 2020. [Google Scholar]
  34. Wang, R.; He, F.; Gan, B. Anti-Collision Warning Algorithm of Vehicle Intersection Based on V2X. In Proceedings of the 7th International Conference on Cyber Security and Information Engineering, Brisbane, Australia, 23–25 September 2022. [Google Scholar]
  35. Ni, Y.; Wang, S.; Xin, L.; Meng, Y.; Yin, J.; Sun, J. A V2X-based Approach for Avoiding Potential Blind-zone Collisions between Right-turning Vehicles and Pedestrians at Intersections. In Proceedings of the 2020 IEEE 23rd International Conference on Intelligent Transportation Systems (ITSC), Rhodes, Greece, 20–23 September 2020. [Google Scholar]
  36. Chochliouros, I.P.; Spiliopoulou, A.S.; Kostopoulos, A.; Agapiou, G.; Lazaridis, P.; Zaharis, Z.; Chen, T.; Dardamanis, A.; Kourtis, M.A.; Agapiou, M.; et al. C-V2X Communications for the Support of a Green Light Optimized Speed Advisory (GLOSA) Use Case. J. Telecommun. Inf. Technol. 2021, 2, 93–106. [Google Scholar] [CrossRef]
  37. Wágner, T.; Ormándi, T.; Tettamanti, T.; Varga, I. sPaT/MAP V2X communication between traffic light and vehicles and a realization with digital twin. Comput. Electr. Eng. 2023, 106, 108560. [Google Scholar] [CrossRef]
  38. Klöppel-Gersdorf, M.; Grimm, J. Evaluating suitable glosa-algorithms by simulation considering realistic traffic conditions and v2x-communication. Transp. Telecommun. 2020, 21, 303–310. [Google Scholar] [CrossRef]
  39. Aznar-Poveda, J.; Egea-López, E.; García-Sánchez, A.-J.; García-Haro, J. Advisory Speed Estimation for an Improved V2X Communications Awareness in Winding Roads. In Proceedings of the 2020 22nd International Conference on Transparent Optical Networks (ICTON), Bari, Italy, 19–23 July 2020. [Google Scholar]
  40. Zhang, Y.; Carballo, A.; Yang, H.; Takeda, K. Perception and sensing for autonomous vehicles under adverse weather conditions: A survey. ISPRS J. Photogramm. Remote Sens. 2023, 196, 146–177. [Google Scholar] [CrossRef]
  41. Vaidya, B.; Kaur, P.P.; Mouftah, H.T. Provisioning road weather management using edge cloud and connected and autonomous vehicles. In Proceedings of the 2021 International Wireless Communications and Mobile Computing (IWCMC), Harbin, China, 28 June–2 July 2021. [Google Scholar]
  42. Romeo, F.; Campolo, C.; Molinaro, A.; Berthet, A.O. DENM repetitions to enhance reliability of the autonomous mode in NR V2X sidelink. In Proceedings of the 2020 IEEE 91st Vehicular Technology Conference (VTC2020-Spring), Antwerp, Belgium, 25–28 May 2020. [Google Scholar]
  43. Wippelhauser, A.; Edelmayer, A.; Bokor, L. A Declarative Application Framework for Evaluating Advanced V2X-Based ADAS Solutions. Appl. Sci. 2023, 13, 1392. [Google Scholar] [CrossRef]
  44. Campolo, C.; Molinaro, A.; Berthet, A.O.; Vinel, A. On latency and reliability of road hazard warnings over the cellular V2X sidelink interface. IEEE Commun. Lett. 2019, 23, 2135–2138. [Google Scholar] [CrossRef]
  45. Maglogiannis, V.; Naudts, D.; Hadiwardoyo, S.; van den Akker, D.; Marquez-Barja, J.; Moerman, I. Experimental V2X evaluation for C-V2X and ITS-G5 technologies in a real-life highway environment. IEEE Trans. Netw. Serv. Manag. 2021, 19, 1521–1538. [Google Scholar] [CrossRef]
  46. Selvaraj, A.K.; Beni, P.S.; Shakila, B.; Shenbaga, M.R.; Ankur, D.; Mamoon, R. V2X-Based Highly Reliable Warning System for Emergency Vehicles. Appl. Sci. 2023, 13, 1950. [Google Scholar] [CrossRef]
  47. Weinert, F.; Düring, M.; Bogenberger, K. Influence of Emergency Vehicle Preemption on Travelling Time and Traffic Safety in Urban Environments enabled by Innovative Behavioral Models and V2X Communication–Simulation and Case Study. In Proceedings of the 2019 IEEE Intelligent Transportation Systems Conference (ITSC), Auckland, New Zealand, 27–30 October 2019. [Google Scholar]
  48. Ashish, A.; Gandhiraj, R.; Panda, M. V2X Based Emergency Corridor for Safe and Fast Passage of Emergency Vehicle. In Proceedings of the 2021 12th International Conference on Computing Communication and Networking Technologies (ICCCNT), Kharagpur, India, 6–8 July 2021. [Google Scholar]
  49. Brož, J.; Tichý, T.; Angelakis, V.; Bělinová, Z. Usage of V2X Applications in Road Tunnels. Appl. Sci. 2022, 12, 4624. [Google Scholar] [CrossRef]
  50. Gelbal, S.Y.; Cantas, M.R.; Guvenc, B.A.; Guvenc, L. Virtual and Real Data Populated Intersection Visualization and Testing Tool for V2X Application Development. arXiv 2023, arXiv:2306.00157. [Google Scholar]
  51. Zoghlami, C.; Kacimi, R.; Dhaou, R. A study on dynamic collection of cooperative awareness messages in v2x safety applications. In Proceedings of the 2022 IEEE 19th Annual Consumer Communications & Networking Conference (CCNC), Las Vegas, NV, USA, 8–11 January 2022. [Google Scholar]
  52. Marroquin, A.; To, M.A.; Azurdia-Meza, C.A.; Bolufé, S. A General Overview of Vehicle-to-X (V2X) Beacon-Based Cooperative Vehicular Networks. In Proceedings of the 2019 IEEE 39th Central America and Panama Convention (CONCAPAN XXXIX), Guatemala City, Guatemala, 20–22 November 2019. [Google Scholar]
  53. Thandavarayan, G.; Sepulcre, M.; Gozalvez, J. Analysis of Message Generation Rules for Collective Perception in Connected and Automated Driving. In Proceedings of the 2019 IEEE Intelligent Vehicles Symposium (IV), Paris, France, 9–12 June 2019; pp. 134–139. [Google Scholar] [CrossRef]
  54. Delooz, Q.; Willecke, A.; Garlichs, K.; Hagau, A.-C.; Wolf, L.; Vinel, A.; Festag, A. Analysis and evaluation of information redundancy mitigation for v2x collective perception. IEEE Access 2022, 10, 47076–47093. [Google Scholar] [CrossRef]
  55. Schiegg, F.A.; Brahmi, N.; Llatser, I. Analytical performance evaluation of the collective perception service in C-V2X mode 4 networks. In Proceedings of the 2019 IEEE Intelligent Transportation Systems Conference (ITSC), Auckland, New Zealand, 27–30 October 2019. [Google Scholar]
  56. Huang, H.; Li, H.; Shao, C.; Sun, T.; Fang, W.; Dang, S. Data redundancy mitigation in V2X based collective perceptions. IEEE Access 2020, 8, 13405–13418. [Google Scholar] [CrossRef]
  57. Delooz, Q.; Festag, A. Network load adaptation for collective perception in V2X communications. In Proceedings of the 2019 IEEE International Conference on Connected Vehicles and Expo (ICCVE), Graz, Austria, 4–8 November 2019. [Google Scholar]
  58. Nichting, M.; Heß, D.; Schindler, J.; Hesse, T.; Köster, F. Space time reservation procedure (STRP) for V2X-based maneuver coordination of cooperative automated vehicles in diverse conflict scenarios. In Proceedings of the 2020 IEEE Intelligent Vehicles Symposium (IV), Las Vegas, NV, USA, 19 October–13 November 2020. [Google Scholar]
  59. Correa, A.; Avedisov, S.S.; Sepulcre, M.; Sakr, A.H.; Molina-Masegosa, R.; Altintas, O.; Gozalvez, J. On the Impact of V2X-based Maneuver Coordination on the Traffic. In Proceedings of the 2021 IEEE 93rd Vehicular Technology Conference (VTC2021-Spring), Helsinki, Finland, 25–28 April 2021. [Google Scholar]
  60. Maksimovski, D.; Festag, A.; Facchi, C. A survey on decentralized cooperative maneuver coordination for connected and automated vehicles. In Proceedings of the 7th International Conference on Vehicle Technology and Intelligent Transport Systems, Online, 28–30 April 2021. [Google Scholar]
Figure 1. Roadside Units along Expressway M0.
Applsci 13 08419 g001
Figure 2. The proposed and implemented simulation pipeline.
Applsci 13 08419 g002
Figure 3. Traffic measurement values with the sensor positions in the examined periods.
Applsci 13 08419 g003
Figure 4. The road model contains alternating driveways and measurement points. On driveways, entering, leaving, and passing vehicles are modeled.
Applsci 13 08419 g004
Figure 5. Explanation diagram for the first and second sections of the matrix equation.
Applsci 13 08419 g005
Figure 6. The average CBR value on all R-ITS-S devices when only CA service is running.
Applsci 13 08419 g006
Figure 7. The average CBR value on all V-ITS-S devices when only CA service is running.
Applsci 13 08419 g007
Figure 8. The average CBR value on all R-ITS-S devices when only CP service is running.
Applsci 13 08419 g008
Figure 9. The average CBR value on all V-ITS-S devices when only CP service is running.
Applsci 13 08419 g009
Figure 10. The average CBR value on all R-ITS-S devices in case of simultaneously running CA and CP services.
Applsci 13 08419 g010
Figure 11. The average CBR value on all V-ITS-S devices in case of simultaneously running CA and CP services.
Applsci 13 08419 g011
Table 1. C-ITS use cases evolution.
Use CaseGenerationReferences
Forward collisionDay1, Day2[12,13,14]
Intersection collisionDay1, Day2[15,16]
Speed advisoryDay1[17]
Adverse weatherDay1[18,19]
Dangerous situationDay1, Day2[20,21,22,23]
Special vehicleDay1[24,25,26]
Stationary vehicleDay1[27]
Green light optimal speed advisoryDay1[28,29,30]
Red light violationDay1[31]
VRU protectionDay2[32]
Collective perceptionDay2[18,33,34,35,36,37]
Cooperative awarenessDay1[38,39]
Maneuver CoordinationDay3[40,41,42]
Disclaimer/Publisher’s Note: The statements, opinions and data contained in all publications are solely those of the individual author(s) and contributor(s) and not of MDPI and/or the editor(s). MDPI and/or the editor(s) disclaim responsibility for any injury to people or property resulting from any ideas, methods, instructions or products referred to in the content.