Article

Stress Characteristics of Horizontal-Axis Wind Turbine Blades under Dynamic Yaw

1
College of Energy and Transportation Engineering, Inner Mongolia Agricultural University, Hohhot 010018, China
2
College of Electrical Engineering, Inner Mongolia University of Technology, Hohhot 010051, China
3
College of Energy and Power Engineering, Inner Mongolia University of Technology, Hohhot 010051, China
4
School of Civil Engineering, Inner Mongolia University of Technology, Hohhot 010051, China
*
Authors to whom correspondence should be addressed.
Appl. Sci. 2023, 13(14), 8418; https://doi.org/10.3390/app13148418
Submission received: 9 June 2023 / Revised: 16 July 2023 / Accepted: 18 July 2023 / Published: 21 July 2023
(This article belongs to the Section Civil Engineering)

Abstract

:
The dynamic yaw significantly affects the aerodynamic load distribution of wind turbines, and the aerodynamic load is one of the main influencing factors of wind turbine structural stress variation. Taking the NACA4415 horizontal axis wind turbine designed by the research group as the research object, the numerical simulation was used to analyze the distribution characteristics of blade stress, surface thrust coefficient, and the wind turbine power output under periodic dynamic yaw conditions. The results show that the blade stress, blade axial thrust, and wind turbine output power were presented as a cosine distribution with yaw fluctuations. The distribution trend of blade stress showed an increase followed by a decrease from the inside out along the span direction. In addition, due to the influence of dynamic yaw and aerodynamic loads, the stress values near the blade root exhibited significant fluctuations. With the increase in tip speed ratio, the stress values of dynamic windward yaw gradually exceeded those of leeward yaw. Within the range of a 10° to 30° yaw variation period, the stress value with positive yaw was larger than that with negative yaw, and the highest stress value occurred in the range of −5° to 15°. The results can be provided as a theoretical basis for the structural design and yaw control strategies of wind turbines, considering dynamic yaw operation.

1. Introduction

Wind energy, as a renewable and clean energy source, has the advantages of abundant reserves, no need for transportation, and wide distribution [1,2]. The stable and efficient development and utilization of wind energy is one of the most important development directions for achieving the goals of carbon peak and carbon neutrality [3,4,5]. The frequent movement of yaw results in long-term and unbalanced force loads on wind turbine blades, leading to fatigue accumulation [6], which may potentially cause structural damage to the blades, resulting in cracks and damages that may shorten its expected service life. Research on large wind turbines has shown that the accurate failure location of blades is generally at the stress concentration location [7]. Therefore, the study of blade stress under yaw conditions has a direct and important impact on the reliability and lifespan of wind turbine blades.
The load on the wind turbine blades changes with azimuthal changes; the trailing and shed wake vortices increase indistinctly; and the wake velocity distribution is asymmetrical, according to aeroelasticity studies of wind turbines [8,9,10]. Numerous numerical techniques have been utilized to determine the effects of the yaw coefficient on wind turbines’ power, power coefficients, and rotor torque. Experimental investigations have demonstrated a substantial link between the power coefficient and the yaw angle [11,12]. Yaw inputs lead the axial velocity to decrease, which significantly lowers the output power and thrust [13,14,15].
Ye Z et al. [16,17,18] examined the power and thrust coefficients of wind turbines under various steady and transient yaws while taking into account the dynamic yaw process. For each of the spanwise portions, the aerodynamic performance and angle of attack distribution were calculated. They discovered that dynamic yawing resulted in larger fluctuations than static yawing, and analyzed the causes of this. The angle of attack (AOA) of a blade on a horizontal offshore floating wind turbine was studied by Wen et al. [19] using the free vortex method under both static and dynamic yaw conditions. They discovered that in the dynamic yawed condition, upwind and downwind yawing effects occurred and contributed to AOA fluctuations.
Ke et al. [20,21] investigated the structural responses, buckling stability, and ultimate bearing capacity of a large-scale wind turbine system under various wind and wind–rain conditions, taking into account the effect of the yaw angle. This was accomplished in the study of stress–strain on wind turbine blades combined with yaw. The results demonstrated that the yaw angle may significantly affect a wind turbine system’s aerodynamic efficiency and overall stress performance, and that fatigue brought on by the yaw circumstances can significantly reduce the system’s lifespan. Wang et al. [22] studied the influence of the interaction between a flange diffuser and the yaw angle of a blade, and found that the influence of the wind-lens on the dynamic strain in the blade root was substantial, and that large yaw angles led to low strains. Dai et al. [23] analyzed the aeroelastic performance of wind turbines under various fixed yaw angles, and concluded that the blade strain had a fairly asymmetrical distribution during one rotation of the rotor. Studies have shown that the measured fatigue spectrum of a free-yaw small wind turbine consists mostly of many low-mean-stress and low-stress ratio cycles. By decreasing unsteady yaw behavior and lowering the maximum yaw rate, the mean stresses of these loads can be decreased [24].
Wind turbine blade stress causes blade fatigue, and fatigue failure is the main cause of wind turbine blade failure. The influence of bend–twist coupling (BTC) on fatigue loads under various wake situations has been examined using a stress-based methodology, and the BTC method was found to reduce those loads [25,26]. Boujleben et al. [27] proposed a very efficient computational model for fluid–structure interaction problems, which provided detailed information on the stress distribution in turbine blades. Such detailed stress distributions is of special interest in studies of fatigue failure risk. When compared to conventional materials, Liu et al.’s investigation of a piezoelectric wind turbine blade material revealed that the stress at the blade root and the displacement at the blade tip both decreased, and the likelihood of fatigue failure and overload at the blade root was significantly lower [28]. Zhang et al. [29] used numerical simulation analysis of wind turbine blade loads to determine mechanical parameters for fatigue analysis, such as the load cycle, maximum stress, minimum stress, mean stress, stress amplitude, and equivalent stress. They also proposed a method for investigating the fatigue damage of a composite wind turbine blade.
Wind turbine blades are structurally impacted by cyclic stress. Wind turbine blade strain was analyzed by Chen et al. [30,31] who also provided quantitative proof of the process leading to blade collapse. Additionally, they identified the underlying reasons and failure mechanisms of blade collapse. To simulate the failure behavior of box beams, they created a continuum-damage, mechanics-based, progressive failure analysis approach in a 3D stress–strain domain. This modelling approach could predict both the strength and failure of box beams with reasonable accuracy. It showed a potential ability to aid in the design of damage-tolerant composite wind turbine blades by facilitating reasonable failure prediction at large structural scales. According to Stanciu et al. [32], fracture of the aft panel leads to catastrophic blade failure, and delamination is caused by an uneven load distribution. To determine tiny stresses and to simulate microscopic damage, Ye et al. [33] established an isoperimetric micromechanical model.
Various measurement and loading methods have been used in experimental research on the stress–strain of wind turbine blades. Baqersad et al. [34,35] proposed a method for measuring the full-field dynamic strain of a wind turbine structure from a limited set of measurements. Meanwhile, their approach was used to extract the full-field dynamic strain on a wind turbine assembly subject to arbitrary loading conditions. The strains predicted by this method agreed with those measured by strain gauges, and the two techniques determined the strains on both the surface and interior parts of the structure. Wu et al. [36] proposed a novel and economical optical technique based on 3D digital image correlation (3D-DIC) for monitoring the health of wind turbine blades. The full-field dynamic parameters of displacement and strain were obtained, and they diagnosed blade health in both the time and frequency domains. The findings demonstrate that 3D-DIC is a reliable non-contact technique for operating wind turbine blade health monitoring.
Philipp [37] utilized an advanced modeling approach to improve the consistency between numerical predictions and experimental observations of displacement, stress, and strain values in a numerical study of stress–strain in wind turbine blades in order to increase the accuracy of structural predictions for wind turbines. Fernandez et al. [38] proposed an improved method of applying loads to a 3D finite element blade model and calculated the global and local stress–strain on wind turbine blades during normal operation as well as extreme wind cases. A dynamic load and stress analysis of a wind turbine was conducted by Santo et al. [39] using transient fluid–structure interaction simulations. The k-epsilon turbulence model was used, and the computational fluid dynamics (CFD) and computational solid mechanics solvers were strongly coupled using an in-house code. During the simulations, the transient evolution of loads, stresses, and displacements on each blade was monitored.
Based on findings from studies conducted under the aforementioned yaw situations and the stress–strain properties of wind turbine blades, researchers aiming to optimize wind power have considered (1) tracking the maximum power by controlling the rotor speed and yaw rotation of twin wind turbines [40]; (2) an individual pitch control system designed to reduce fatigue damage to key components [41,42]; and (3) novel yaw control strategies [43,44,45].
In summary, yaw and blade stress in wind turbines have been extensively studied. Most of the existing analysis and design methods have considered only output power, fatigue load characteristics, and structural stress damage to wind turbines at a fixed angle. However, the dynamic variation of these characteristics during the yaw process is seldom researched. While some research on the dynamic yaw process additionally emphasizes the aeroelasticity of wind turbines, the blade structure has not been further examined. It is challenging to simulate the stress distribution of wind turbine blades based on dynamic yaw because wind has periodic, complicated, and varied features. Therefore, a self-developed horizontal axis wind turbine was selected in this study to analyze the real-time dynamic stress characteristics of wind turbine blades subjected to periodic dynamic yaw, combined with the method of one-way fluid–solid coupling numerical simulation. The results can provide a theoretical basis for the design of wind turbine blades and for yaw control strategies.

2. Numerical Model

2.1. Structural Dynamics Model

The NACA 4415 horizontal-axis wind turbine is used as a case. It was independently developed by the Key Laboratory of Wind Energy and Solar Energy Technology (Inner Mongolia University of Technology). Figure 1 shows the stress–strain curve of wind turbine blade material. The curve results from the tensile test, and the wood material used in the experiment is the same material as the wind turbine blade. The linear relationship between the tensile and fracture processes is shown in the figure. The first section increases linearly with a slope of 0.0048, then decreases rapidly with a slope of −0.0141 after reaching the yield limit, and finally reaches the fracture.
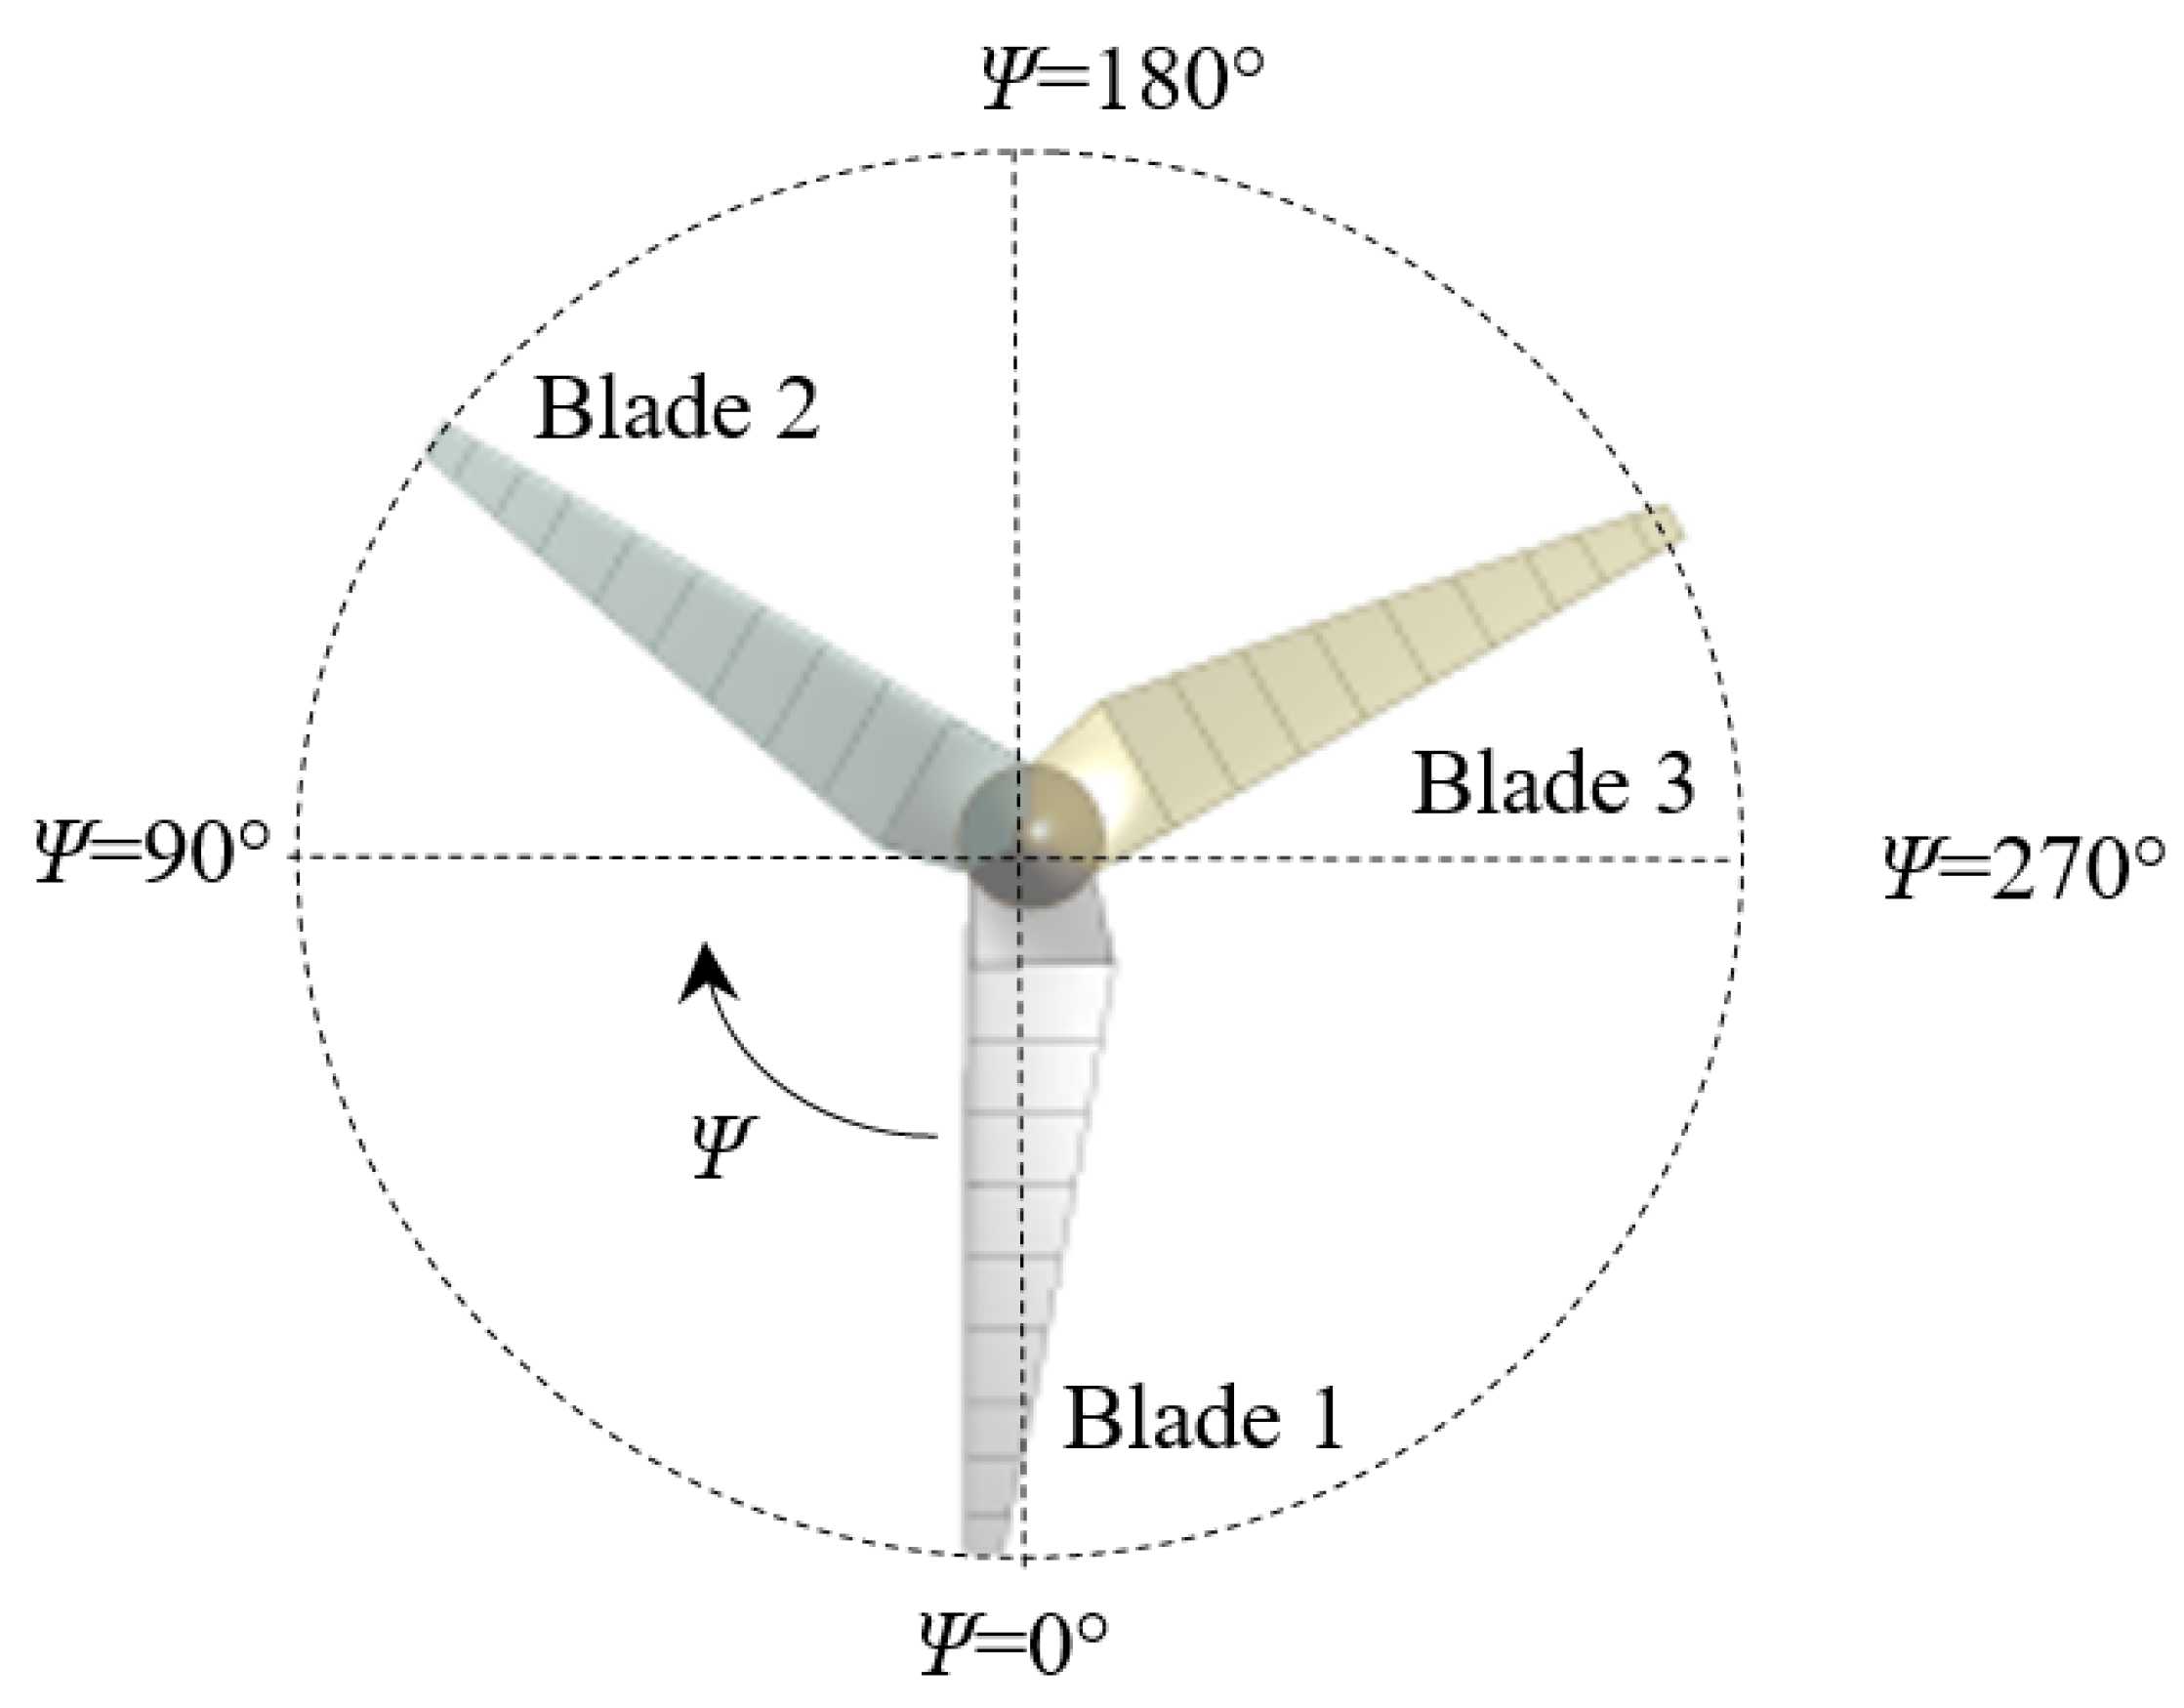
Its structural parameters are shown in Table 1, and its azimuth angle along with a wind turbine model are shown in Figure 2.

2.2. Computational Domain and Yawed Flow

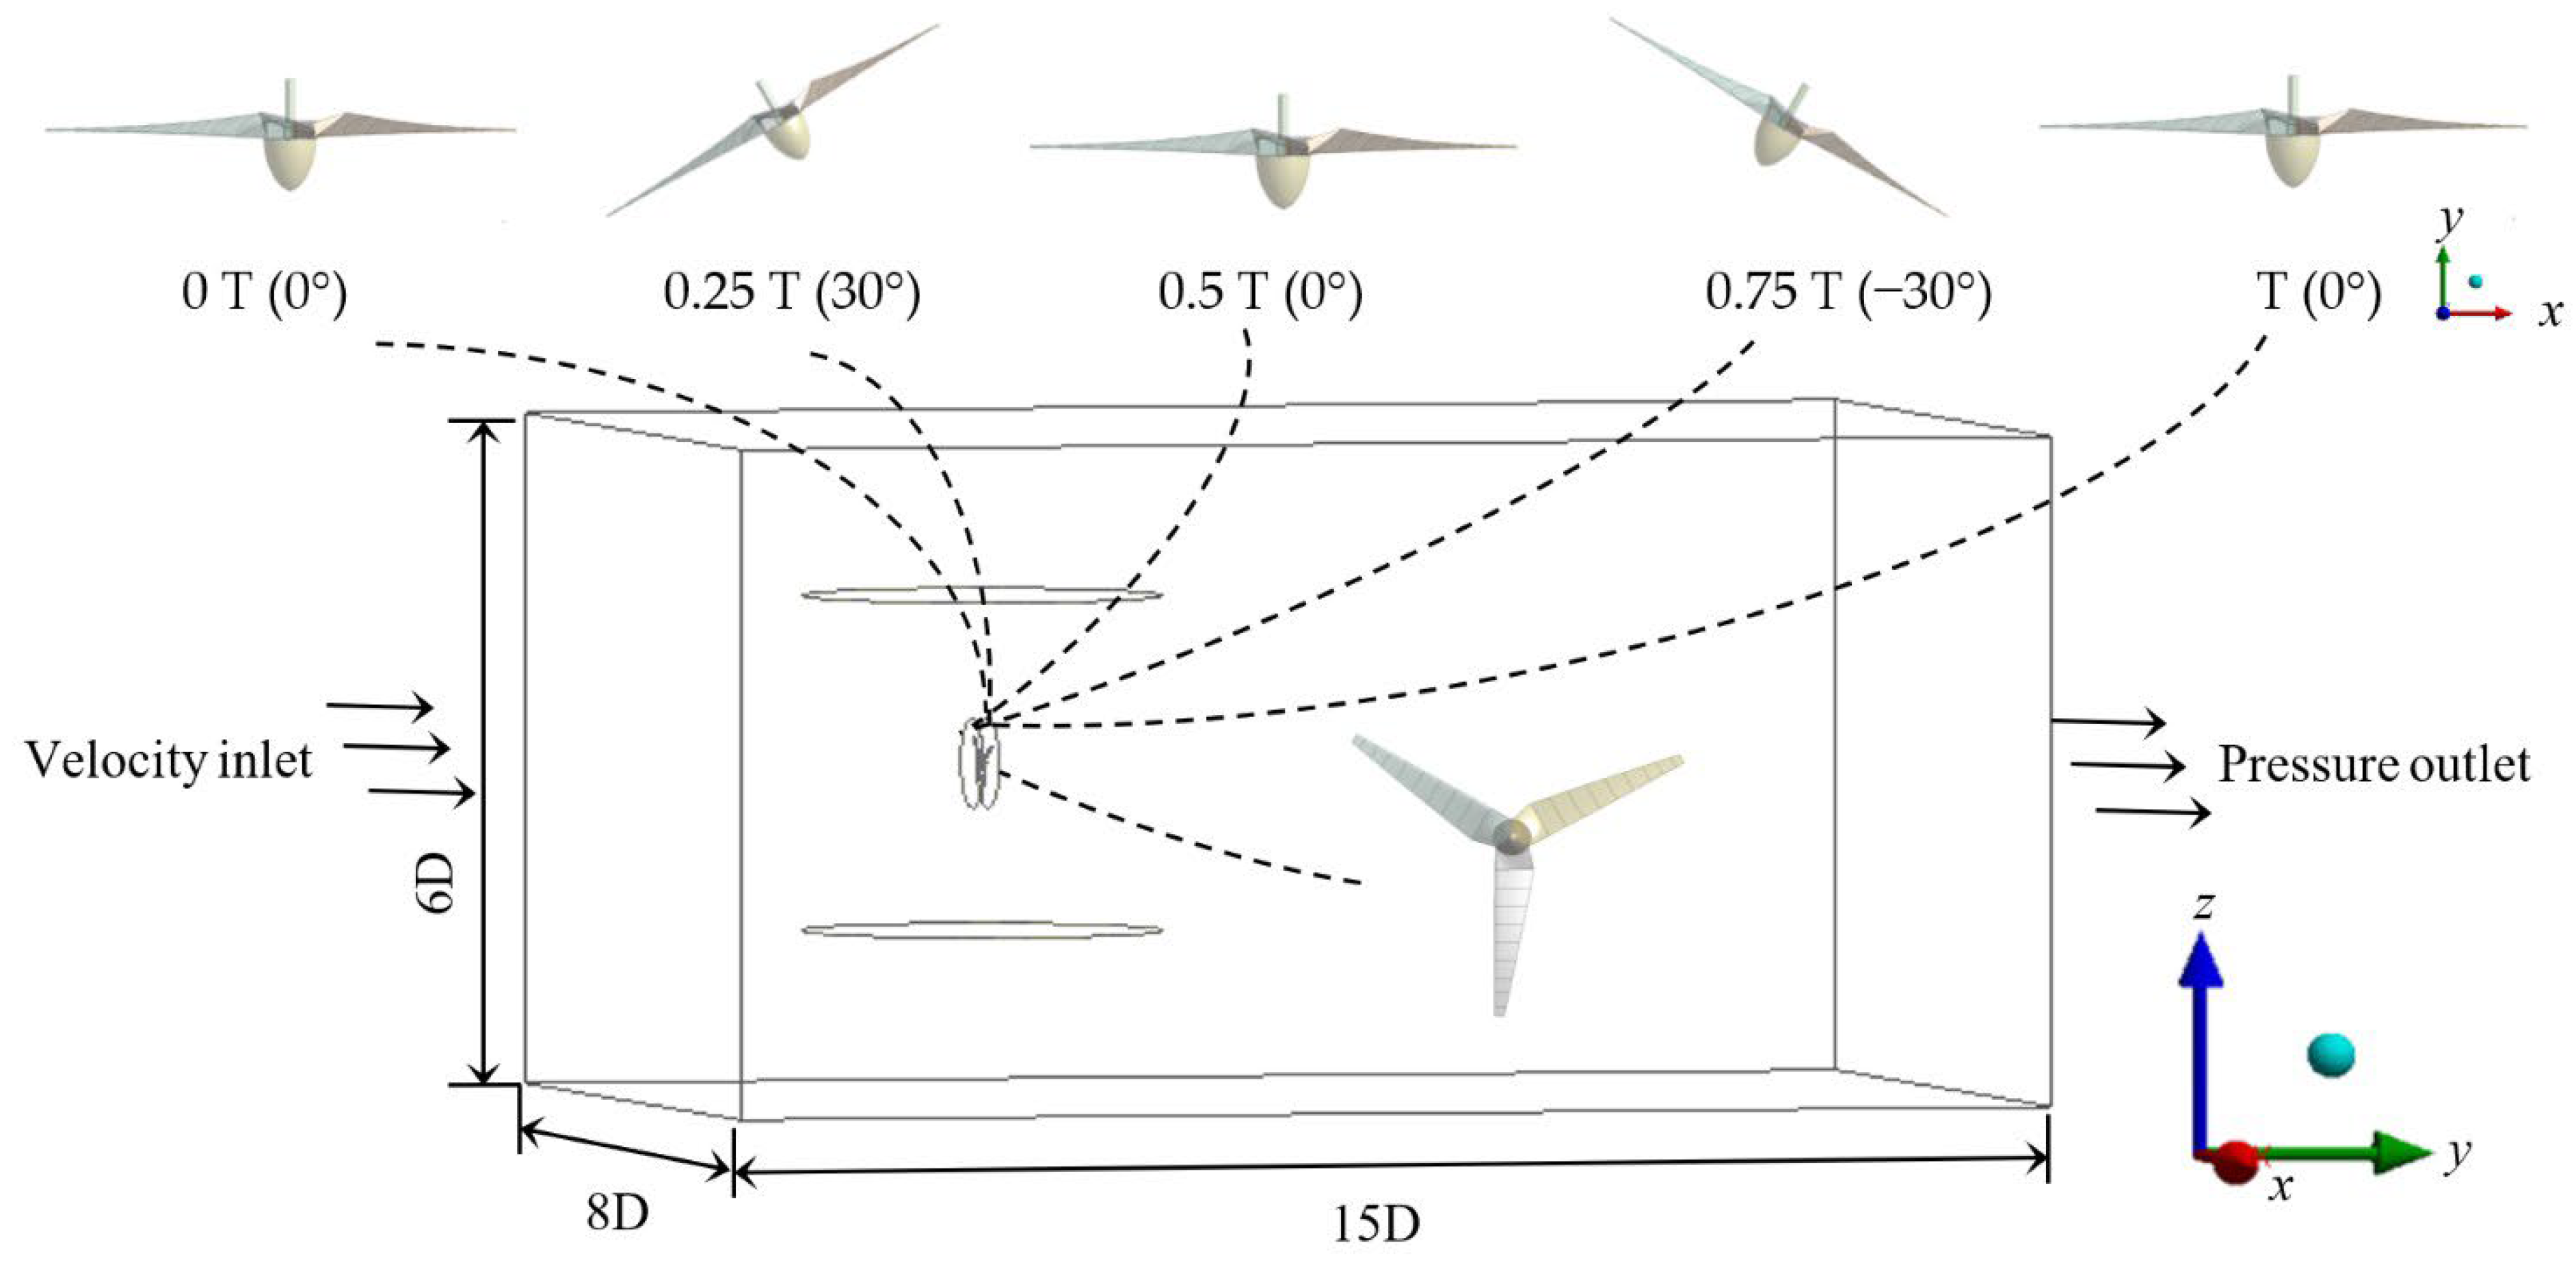
In the numerical simulation, a realistic wind field was simulated using the rectangular computational domain, as illustrated in Figure 3. The length, width, and height of the calculation domain were 15D, 8D, and 6D, respectively. The wind turbine rotation domain was nested within the cylinder’s yaw rotation domain, which was used to define the wind turbine rotation motion, and the built-in encryption cylinder yaw rotation domain was used to define the yaw dynamic rotation rules. The wind turbine rotated clockwise. The geometric center of the rotational axis of the wind turbine was defined as the coordinate origin. The flow direction was in the positive direction of the y axis, the yaw axis of rotation was the z axis, and the width of the computational domain was the x axis. When blade 1 was turned to the downward position in the z axis, the azimuth angles of blades 1, 2, and 3 were 0°, 120°, and 240°, respectively. The data on wind turbine blade rotation to this position under various yaw angles was extracted for the average wind load and minimum fatigue load on the blades being minimized in this “shutdown” position [6].
Dynamic yaw motion is developed using a proprietary approach that combines user-defined functions to replicate the motion of wind turbine blades. The periodic variation in yaw angle over time is defined using the trigonometric function. This method of simulation calculation is supported by the literature [18], although the author of that study only provided a research conclusion regarding the aerodynamic properties of a wind turbine with a dynamic deflection of 30°. In order to make the rotation of the wind turbine relatively stable and to more effectively examine the stress on the wind turbine blades during the yaw process, the original method was modified in this study by using multiple phases of reciprocating motion.
Specifically, as shown in Figure 3, by designating the rotation plane when the wind turbine rotor is not yawing as the dividing line, the positive yaw time (rotating along the axis of the wind turbine tower to the counterclockwise position) can be defined as ranging from 0 T to 0.5 T. Furthermore, the negative yaw time (rotating along the axis of the wind turbine tower to the clockwise position) can be defined as ranging from 0.5 T to 1.0 T.
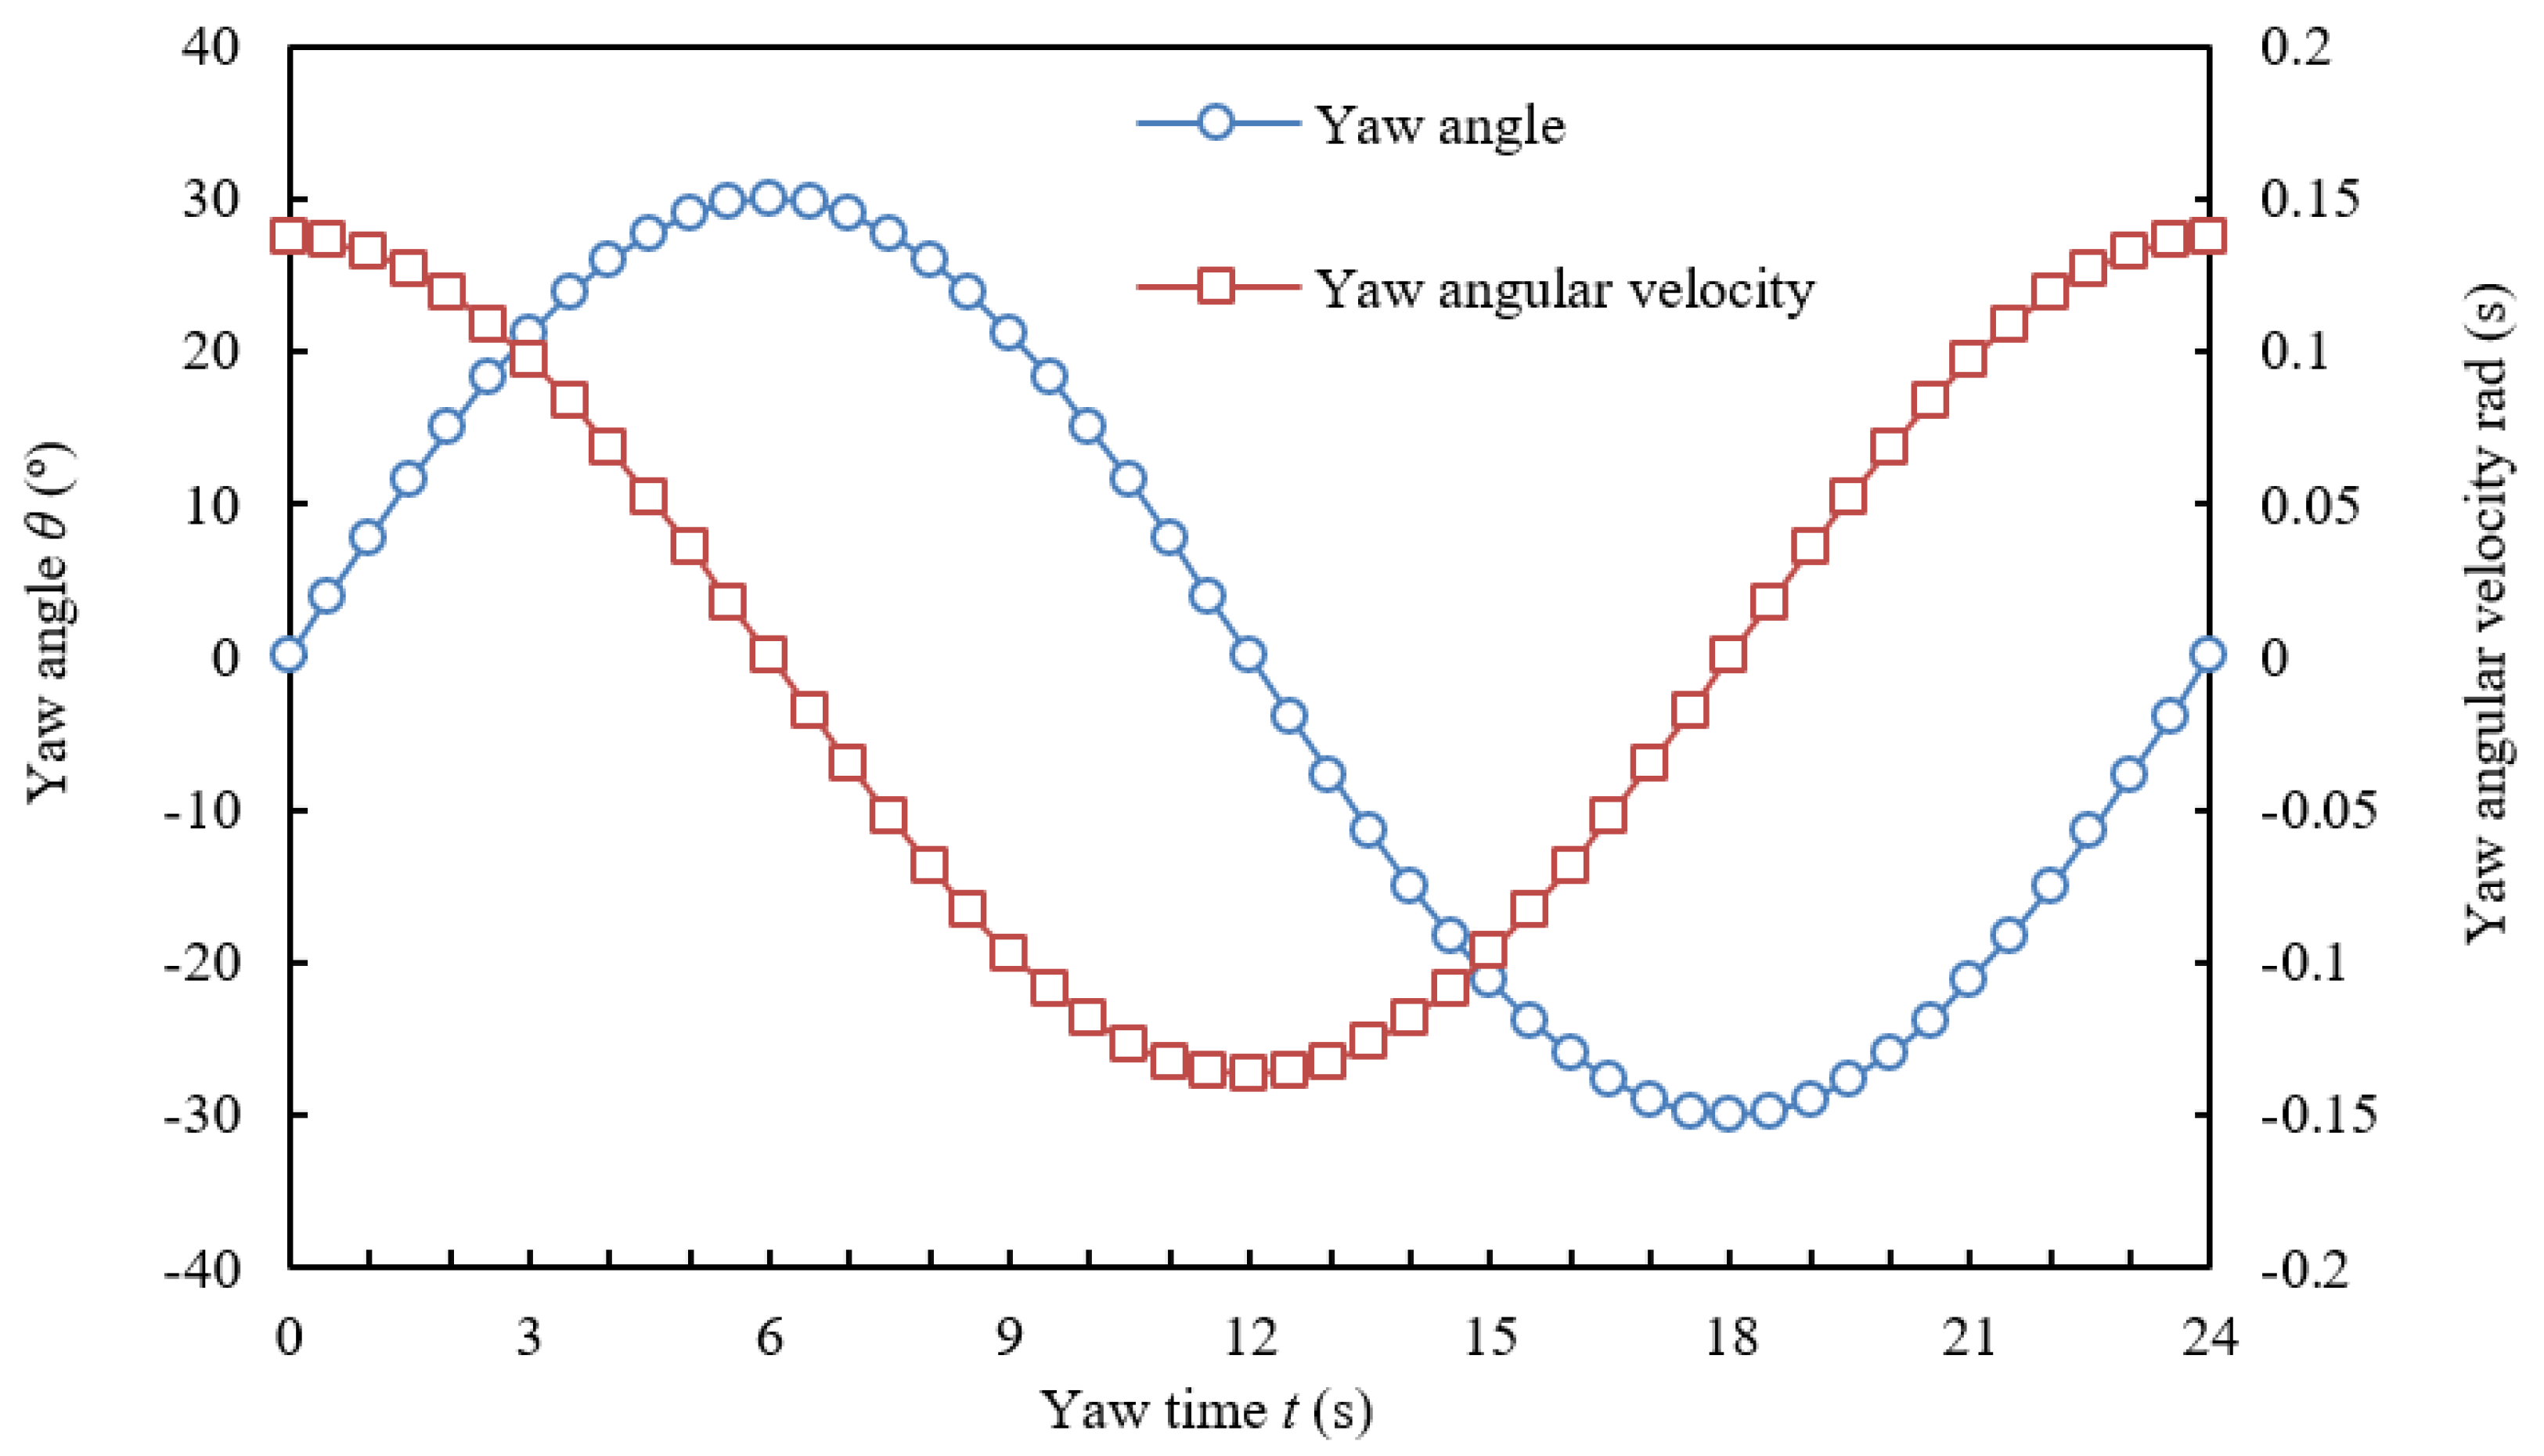
In accordance with International Electrotechnical Commission standards, the wind direction is set to deflect 30° in 6 s, and the deflection period of periodic dynamic yaw is set as T = 24 s. The initial yaw angle is 0°, where the axis of rotation of the wind turbine at the initial position is consistent with the actual incoming wind direction. The changes in yaw angle and yaw velocity with time are shown in Figure 4. The trigonometric function describing yaw change with time can be expressed as
θ = 30 sin π t 12
where t is the yaw time.
The induced velocities of the blades change with the azimuth angle when the wind turbine is operating in a yawing mode. The induced velocity distribution law is described using the yaw model:
W = W 0 1 + r R tan χ 2 cos ψ θ 0
In both Equation (2) and Figure 5, W is the induced velocity; χ is the included angle between the wind direction in the wake and the impeller shaft, that is, the oblique angle of the wake; and θ is the yaw angle. In Equation (2), R is the radius of the plane of rotation of the wind turbine, and θ0 is the angle of the blade pointing to the deepest part of the wake. When the yaw angle is positive, θ0 = 90°. When the yaw angle is negative, θ0 = 270°. W0 is the average induced velocity obtained by the normal and tangential induced velocities. In Figure 5, v0 is the speed of the incoming wind, n is the normal unit vector of the impeller plane, ω is the angular velocity of the yaw rotation, and v’ is the wake wind speed.

2.3. Computational Grid and Numerical Method

As shown in Figure 6, an unstructured tetrahedral grid was generated in the computational domain using Mesh from Ansys Workbench (v.2021) softwis (Ansys, Canonsburg, PA, USA). Since the blade of wind turbine is an irregular curved body model, a tetrahedron was selected for mesh division. The quality of the grid was checked and the independence was verified, and it was determined that the total number of grids was approximately 5.34 million.
The one-way fluid–solid coupling method was applied in this study to calculate the simulation results.
In the aerodynamic calculation, the effective CFD (Ansys, Canonsburg, PA, USA) calculation code was used for non-steady-state simulation calculation. The double-precision SIMPLE algorithm and standard k-epsilon turbulence model were used. The rated wind speed of the wind turbine was set as the inlet wind speed, and the velocity inlet boundary condition was specified as the inlet of the computational zone. The relative pressure was set to 0 MPa at the pressure outlet, and the symmetric boundary conditions were chosen as the boundaries of the computational domain. The blade surfaces assumed a non-slip wall. The time-step size was equivalent to an azimuthal angle increment of 5°, coupled with 50 pseudotime subiterations, and the value residual error was set to 1 × 10⁻⁴.
The interpreted UDF was imported into Fluent, and the compiled custom functions were used to control the cylindrical deflection domain in the model. The z axis was regarded as the rotating center in the cylindrical rotating domain. The y axis was regarded as the rotation center of the wind turbine. When the rotating domain of the wind turbine rotated normally, it also followed the rotation of the cylindrical rotation domain to achieve dynamic yaw. The simulation calculation of the aerodynamic load under dynamic yaw was completed.
The structural field incorporated the aerodynamic data while accounting for the centrifugal force rotating at a certain clockwise speed and the gravity stress directed vertically downward along the z-axis. The wind turbine’s rotating axis was the fixed constraint, and the stress distribution of the blades was determined after that.

3. Results and Discussion

3.1. Wind Turbine Thrust and Power Characteristics

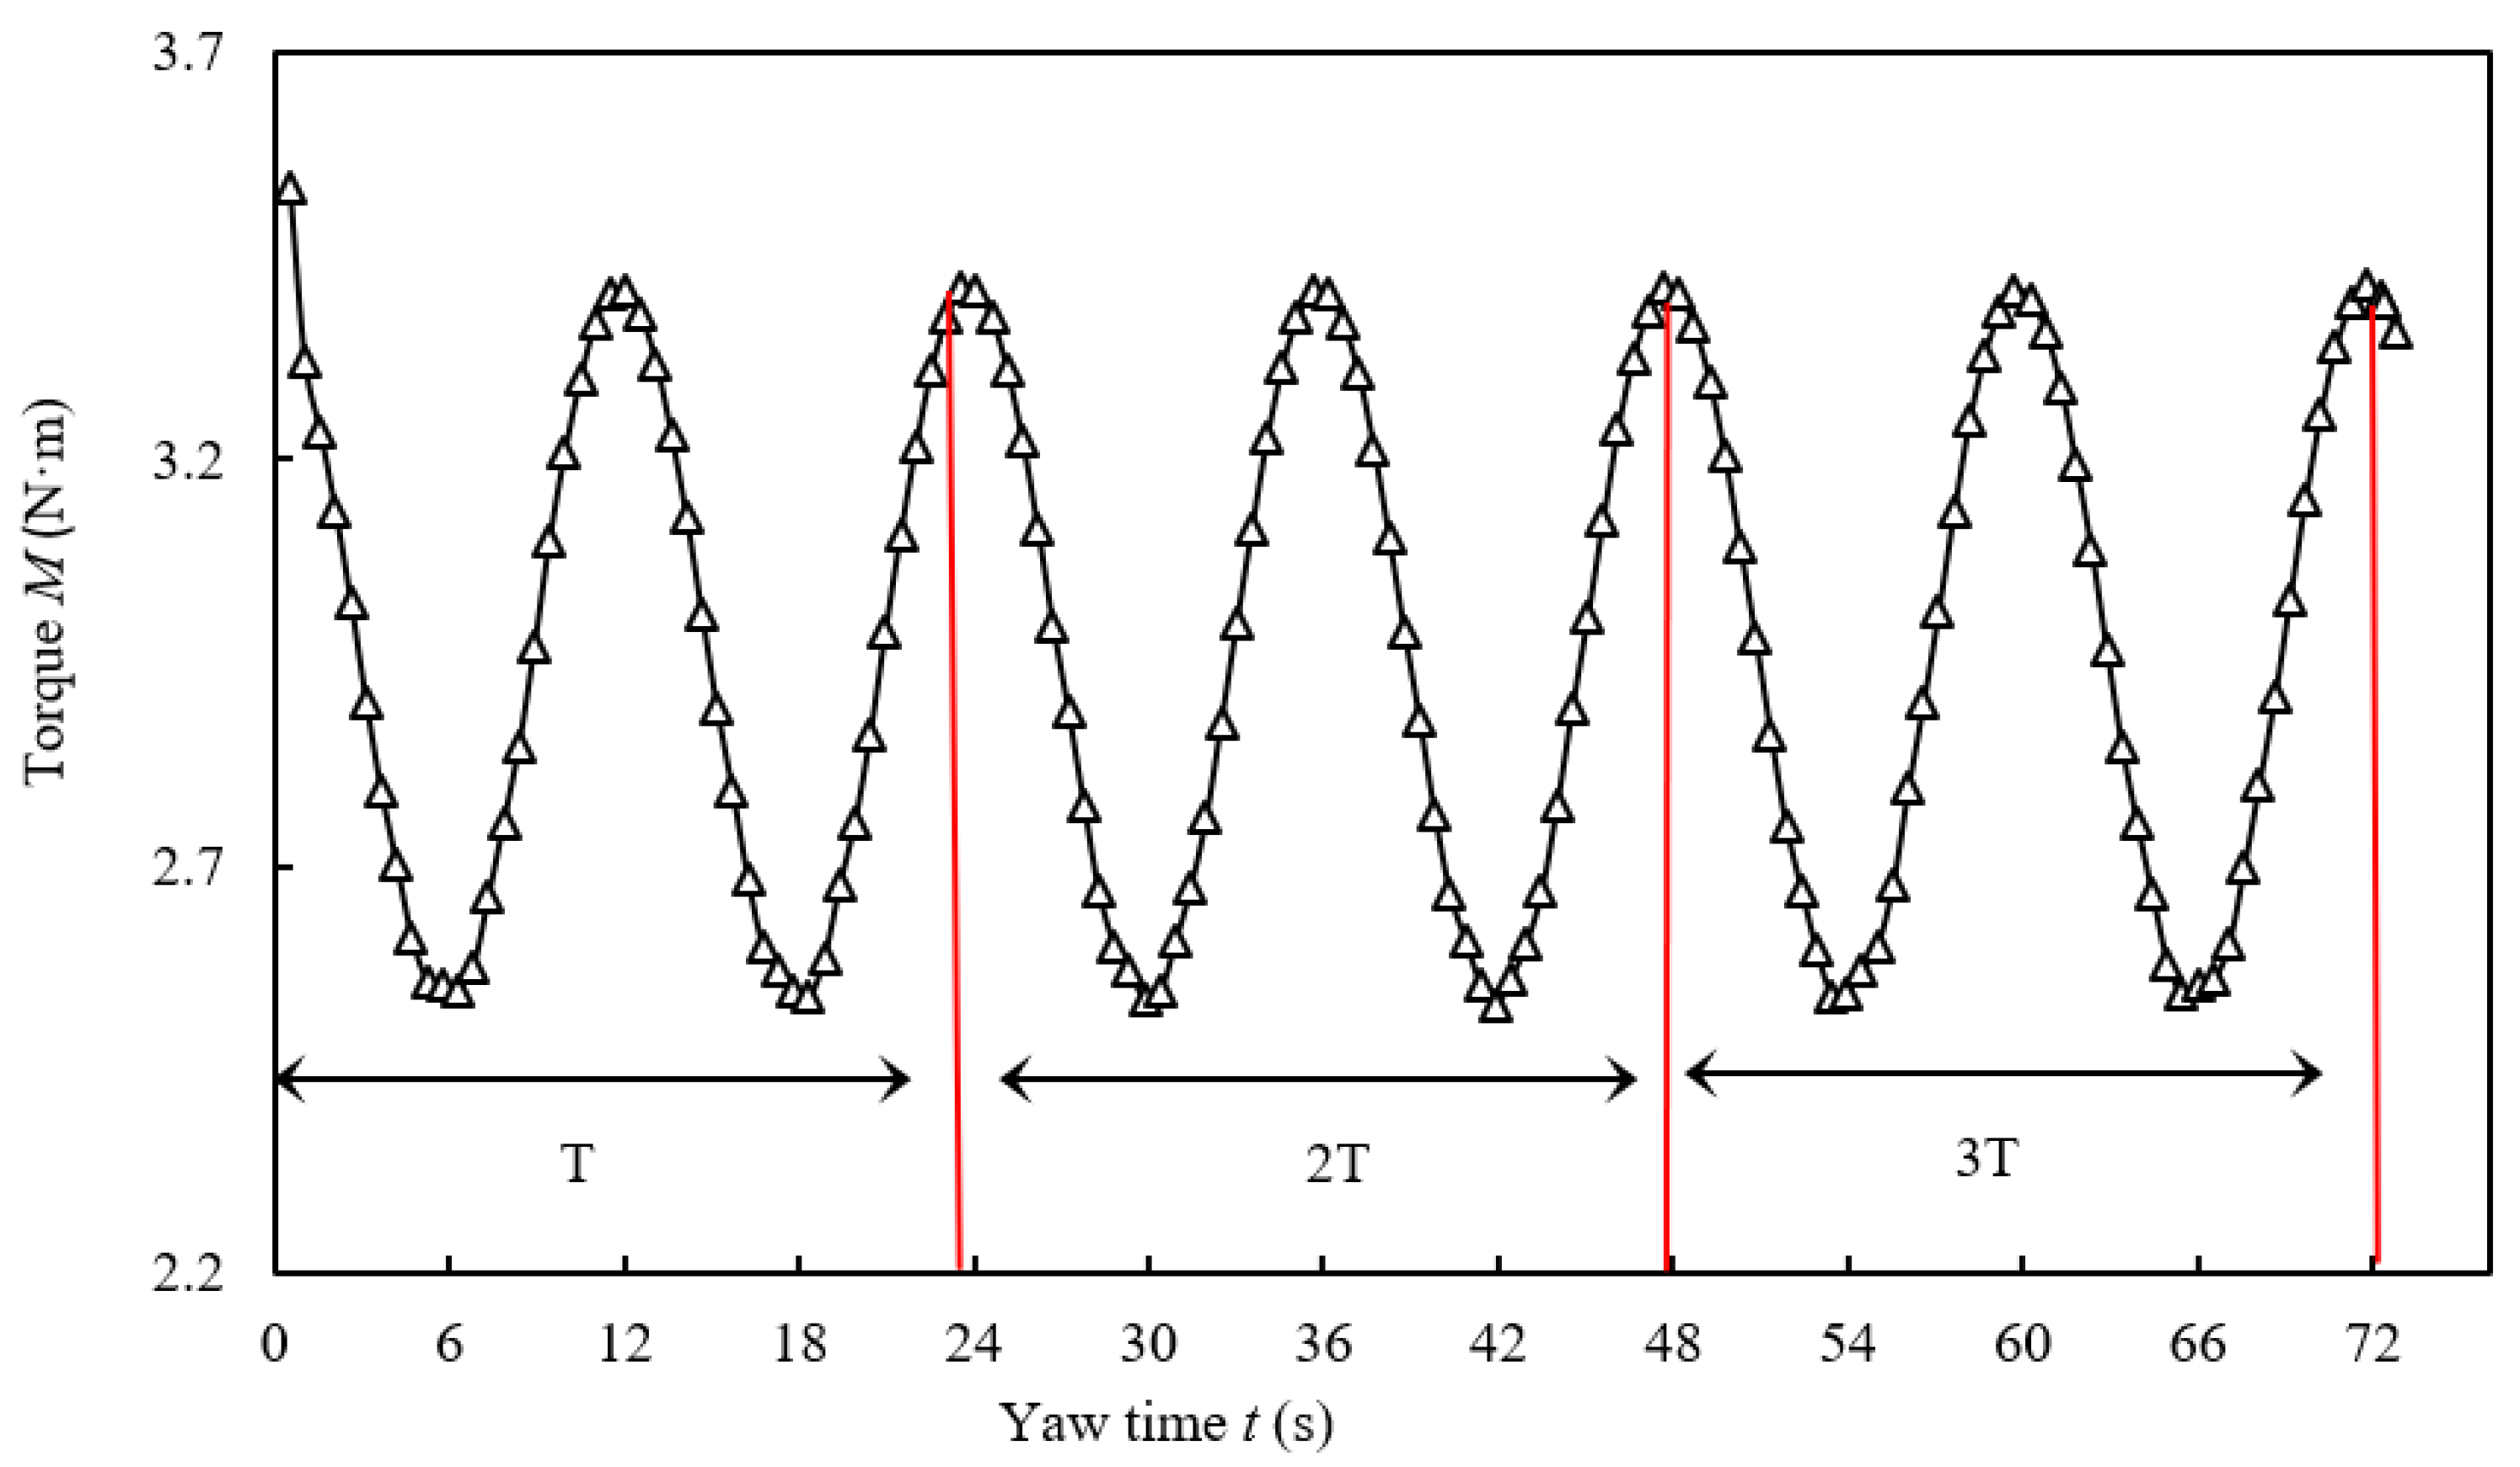
As an example, taking the inlet wind speed as 8 m/s and, in the rotating domain, taking the rotational speed of λ = 5, the calculation time was set as three times the dynamic yaw period; that is, 72 s. Through CFD simulation, the output torque of the wind turbine was selected to analyze the variation over time of the wind turbine model. As shown in Figure 7, the three-blade torque showed marked cyclical changes during the deflection period. The output torque of the wind turbine was the highest at a yaw angle of 0°. The wind turbine’s torque progressively declined to a minimum between the adjacent peaks as the yaw angle rose, then gradually rose to a maximum. Nevertheless, when the yaw angle was ±30°, the torque is the lowest.
The research indicates that the fluctuations of the wind turbine’s output torque curves remained essentially the same in the second and third cycles, indicating that the calculation stabilized in the second deflection cycle under the prevailing dynamic yaw state. We then investigated the data in the second cycle, at yaw times of 24 to 48 s. On the horizontal timeline, times of 24 s, 36 s, and 48 s corresponded to a yaw angle of 0°, while times of 30 s and 42 s corresponded to a maximum yaw angle of 30° during positive and negative yaws, respectively. Additionally, in accordance with the definitions of positive and negative yaw angles, blades 1 and 3 deflected in the same direction during the same yaw period, whereas blade 2 deflected in the opposite way.
As shown in Figure 8, the axial thrust of a single blade of the wind turbine was distributed in a cosine state with respect to yaw fluctuation. The extreme values of blades 1 and 2 appeared at the same position, while the axial thrust of blade 2 was greater than that of blade 1, and the maximum thrust of blade 3 was observed during the negative yaw process. The axial thrust of blade 1, blade 2, and blade 3 increased by 0.55%, 0.54%, and 1.75%, respectively, compared to the non-yaw condition. The minimum axial thrusts of blades 1, 2, and 3 were observed in the negative and positive yaw half-cycles, and the three blades showed minimum values at a yaw angle of ±30°. The axial thrust of blade 1, blade 2, and blade 3 decreased by 19.97%, 15.4%, and 17.8%, respectively, compared to without yaw.
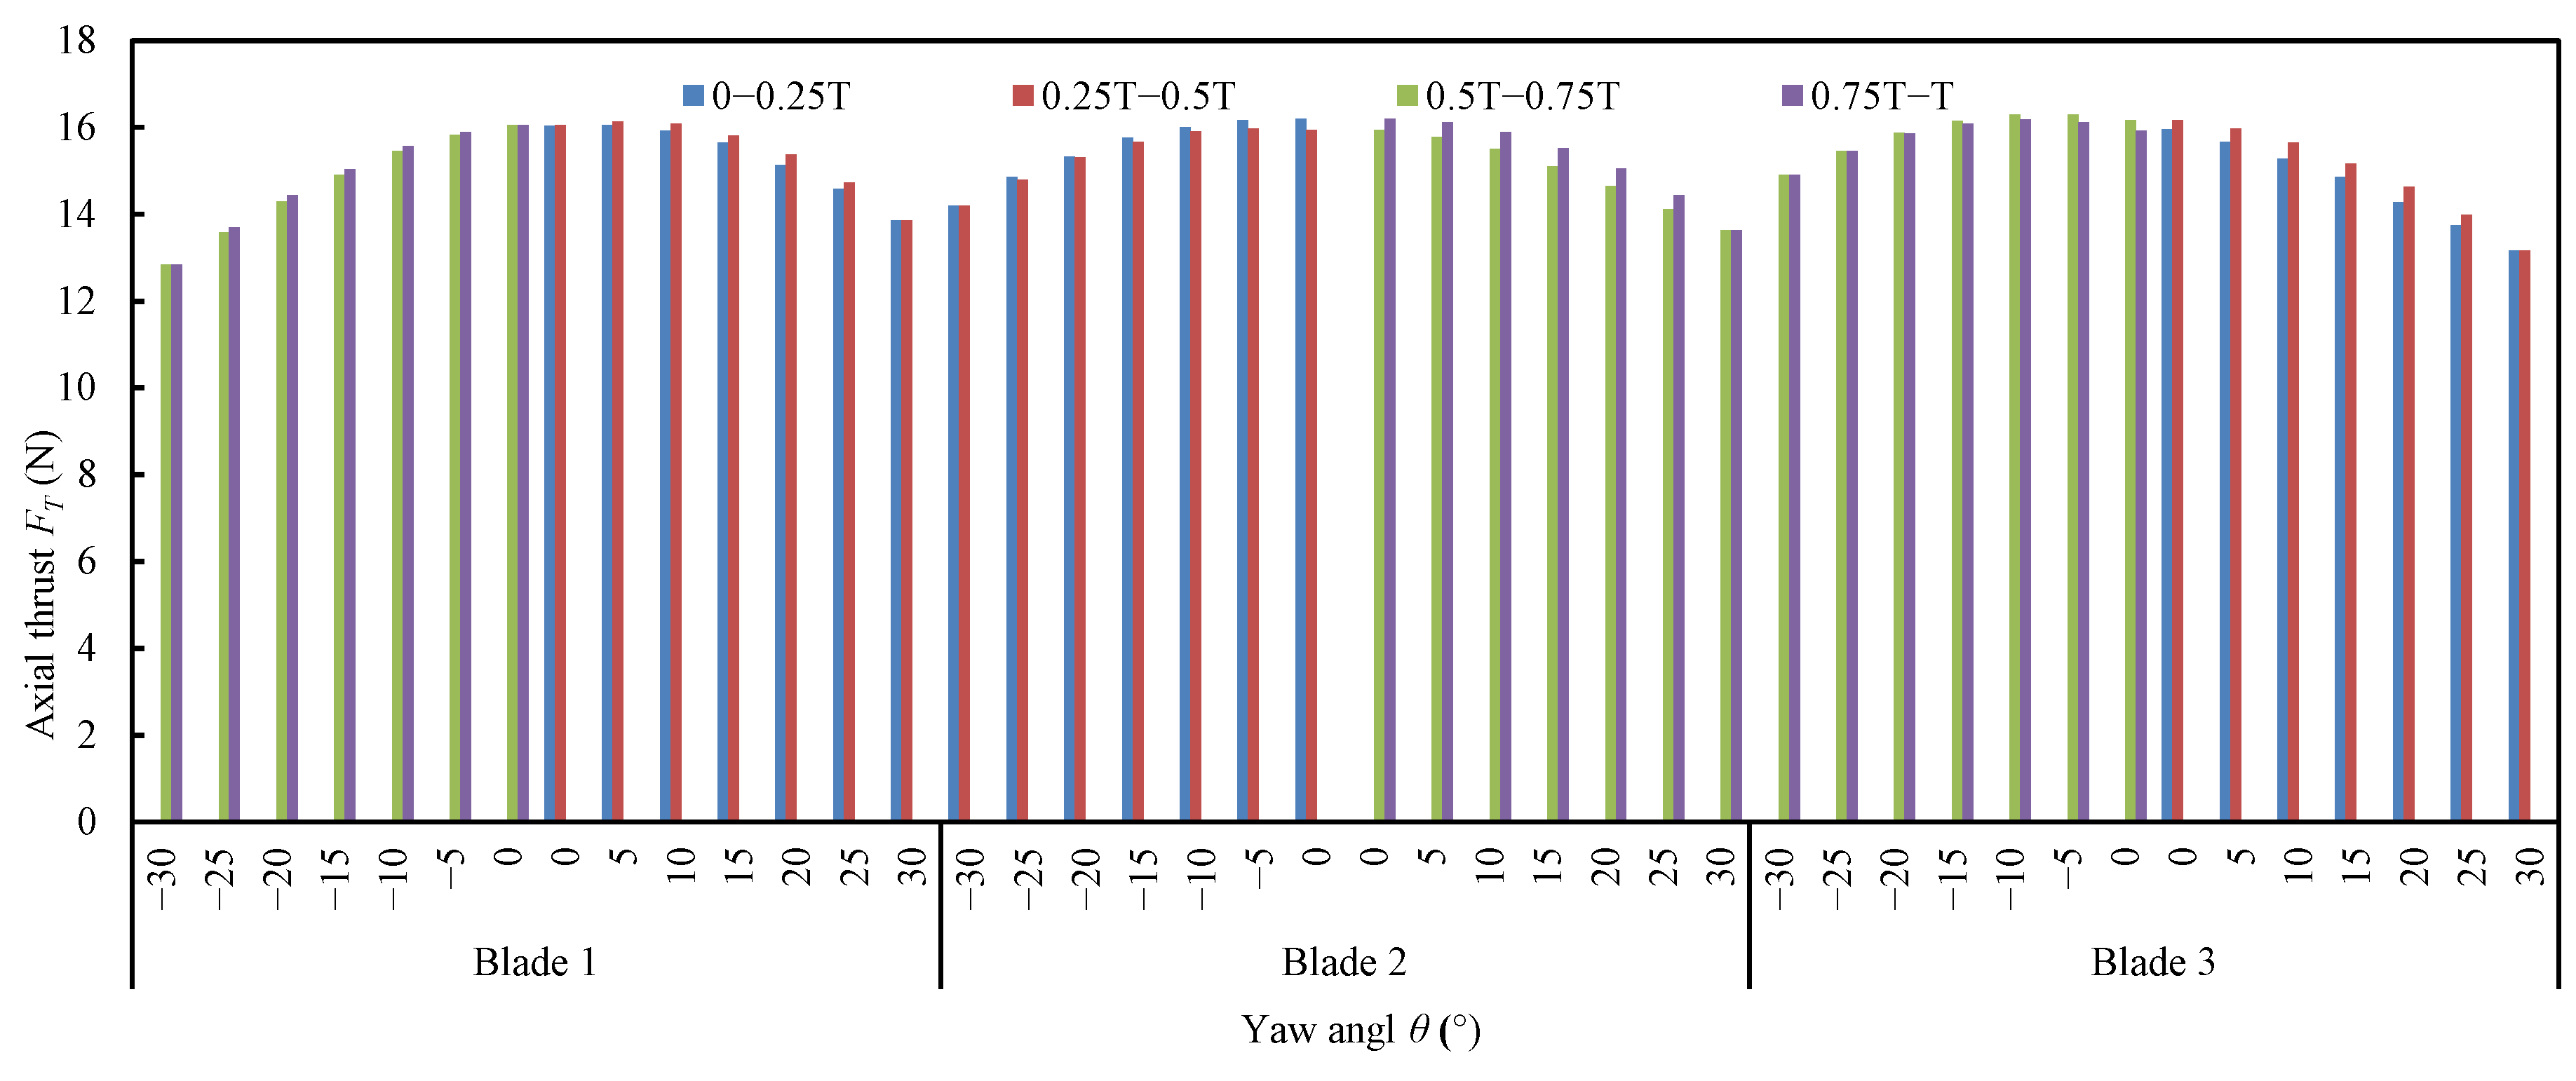
The histogram in Figure 9 demonstrates that during positive yaw, downwind deflection always has a lower axial thrust than upwind deflection at the same deflection angle. When the yaw is negative, the axial thrust of blade 1 against the wind is always less than the downwind deflection, and the axial thrust of blade 2 against the wind is always greater than the downwind deflection. The axial thrust of blade 3 against wind deflection is basically flat at yaw angles of −30° to −20°, and the axial thrust of upwind deflection at angles of −20° to 0° is greater than that of downwind deflection. There are two main reasons for the different changes in the blades: one is the relative position of the blades, and the other is the change in the relative wind speed. The change in azimuth with time can be expressed as
ψ = 360 2 π ω t 1 360
where ω is the angular velocity of the wind turbine. In the calculation results, the quotient is the number of rotation rings of the wind turbine, and the remainder is the azimuth angle of the wind turbine.
When the analyses of Equations (1) and (3) are combined, it becomes clear that the spatial location of the blades is constantly changing and that no blade is ever entirely in the same position, which causes the relative wind speed to fluctuate constantly as well.
The output power of the wind turbine under dynamic yaw is shown in Figure 10. The blade power is nearly cosine-distributed with respect to yaw fluctuations. Smaller values of output power appeared at t = 30 s and t = 42 s, and larger values were found at t = 24 s and t = 48 s. The output power gradually dropped with the increases in yaw angle, as shown in Figure 3, when paired with the relationship between yaw angle and time. At maximum yaw, the output power was at its lowest, and as the yaw angle decreased, it steadily rose. When facing the direction of the incoming wind, the wind turbine produced the most electricity. The same conclusion was reached in [13] in a study of power output at a fixed yaw angle. At the same time, under the influence of wind turbine rotation and wake flow, the induced speed of the blades at the same yaw angle position differed between positive and negative yaws, resulting in the minimum output power of the wind turbine at positive yaw t = 30 s (θ = 30°), which was reduced by 25.58%. The maximum power was found at zero yaw (θ = 0°), where the average value within a yaw cycle was 194.91 Pa.

3.2. Analysis of Stress Characteristics

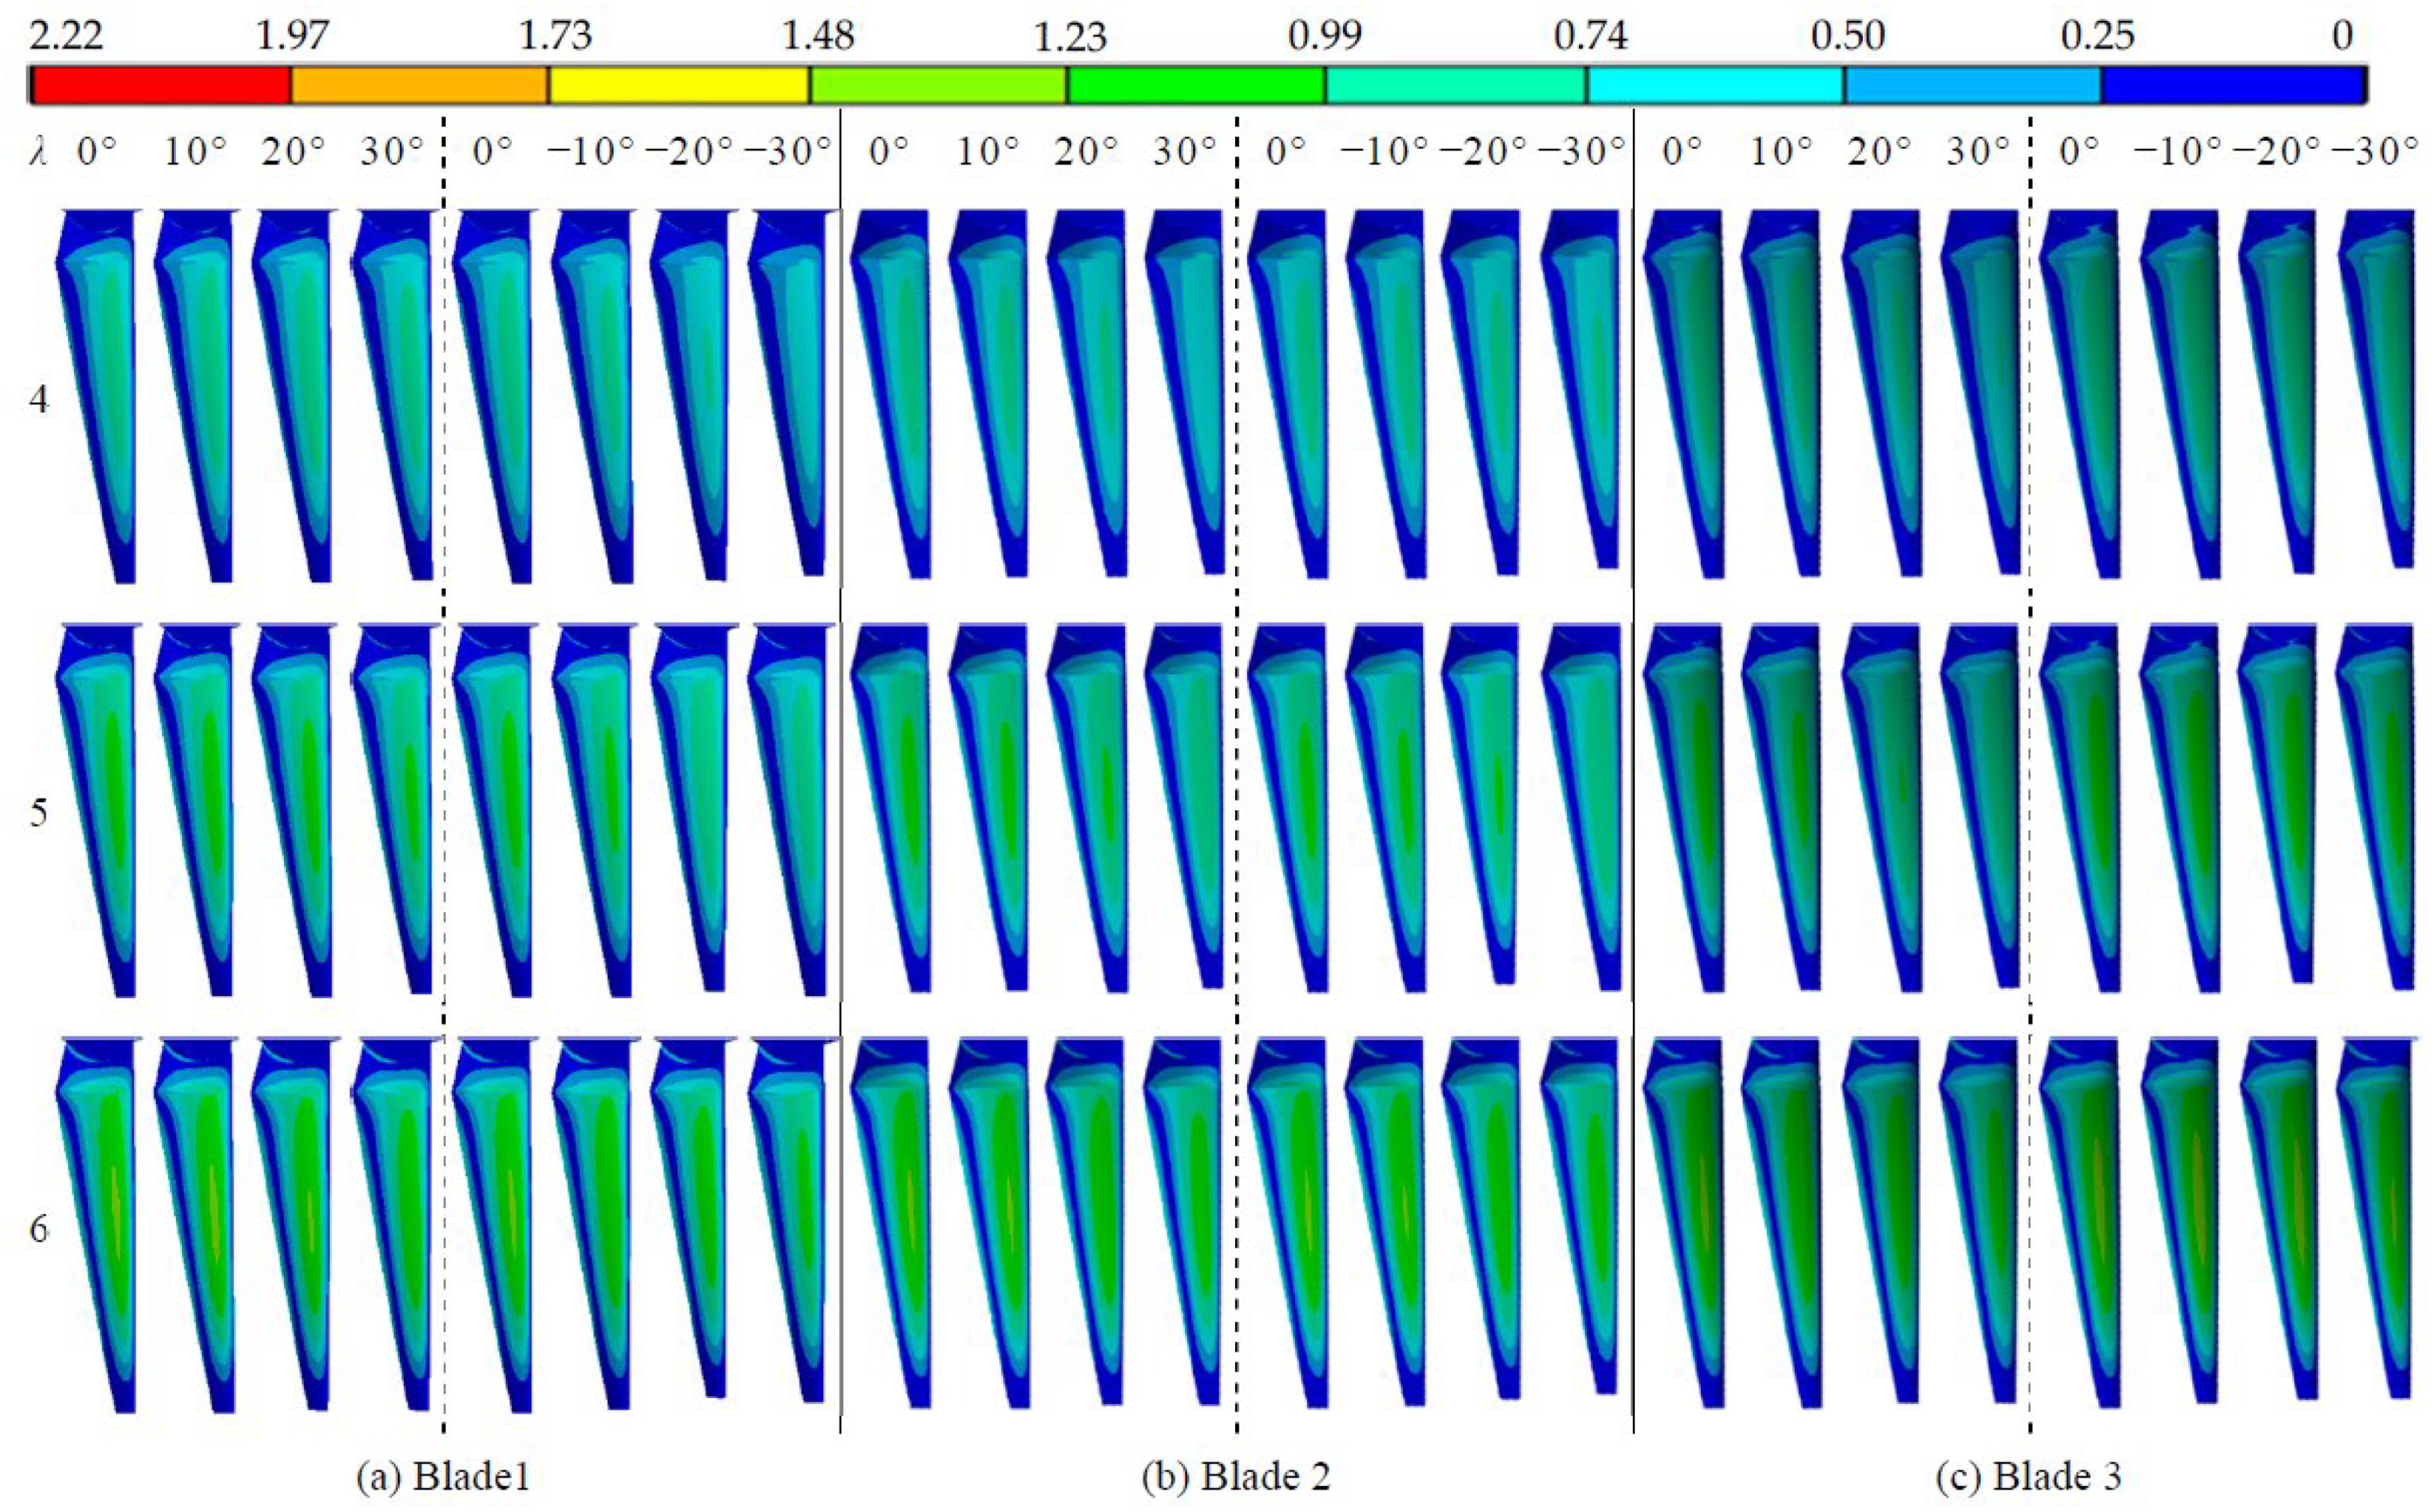
At the azimuth angle shown in Figure 3, the blades in various yaw states were selected to analyze the influence of yaw on blade stress. The equivalent stress characteristics of the three blades at the rated wind speed of 8 m/s were analyzed at different blade tip speed ratios (λ = 4, 5, 6).

3.2.1. Analysis of Blade Surface Stress

The simulation result illustrates that the equivalent stress distribution on a blade surface during a change from maximum yaw to zero yaw (30°→0°, −30°→0°) was opposite to that during a change from zero yaw to maximum yaw (0°→30°, 0°→−30°). Therefore, stress cloud diagrams under dynamic yaw conditions (30°→0°, −30°→0°) are not shown.
Shown in Figure 11 are the variations in the stress distributed on the windward side of the three blades under the dynamic yaw condition (0°→30°, 0°→−30°). When the wind turbine blades yawed to the same position, the stress at the same position of the blades increased with the increase in tip speed ratio, and the stress variation was more obvious. Stress concentrations occurred concurrently at the positions of the radial direction, the maximum and intermediate chord lengths, and both. The stress-concentration area decreased obviously with increases in yaw. The concentrated stress region was at its largest at a yaw angle of θ = 0°, and smallest at θ = ±30°. In the process of positive yaw, θ ∈ (0°→30°), the stress-concentration of blade 1 decreased the most slowly with increases in the yaw angle, and the stress-concentration area in the middle part of blade 3 decreased the most quickly. In the process of negative yaw, θ ∈ (−30°→0°), with increases in yaw angle, the area of concentrated stress in blade 3 decreased the most slowly, while the rate of blade 2’s reduction in downwind yaw was moderate, and that of blade 1 in headwind yaw decreased the most quickly. The results show that the maximum stress always occurred at the position of maximum chord length on the windward side of blade 1 during yaw. To compare the changes in concentrated stress at the maximum chord length more clearly, only the maximum stress position of the blade is shown in the cloud chart at λ = 6 and yaw angle = 0°. As shown in Figure 12, under the dynamic yaw condition (0°→30°, 0°→−30°), the stress variation trend on the leeward side of the three blades was consistent with that on the windward side. The speed of the stress concentration was lowered to ordinals of blades 3, 2, and 1 in the process of increasing the positive yaw, with increases in the yaw angle. The speed of the stress concentration was lowered to ordinals of blades 1, 2, and 3 during the negative yaw process.

3.2.2. Analysis of Stress in the Wingspan Direction

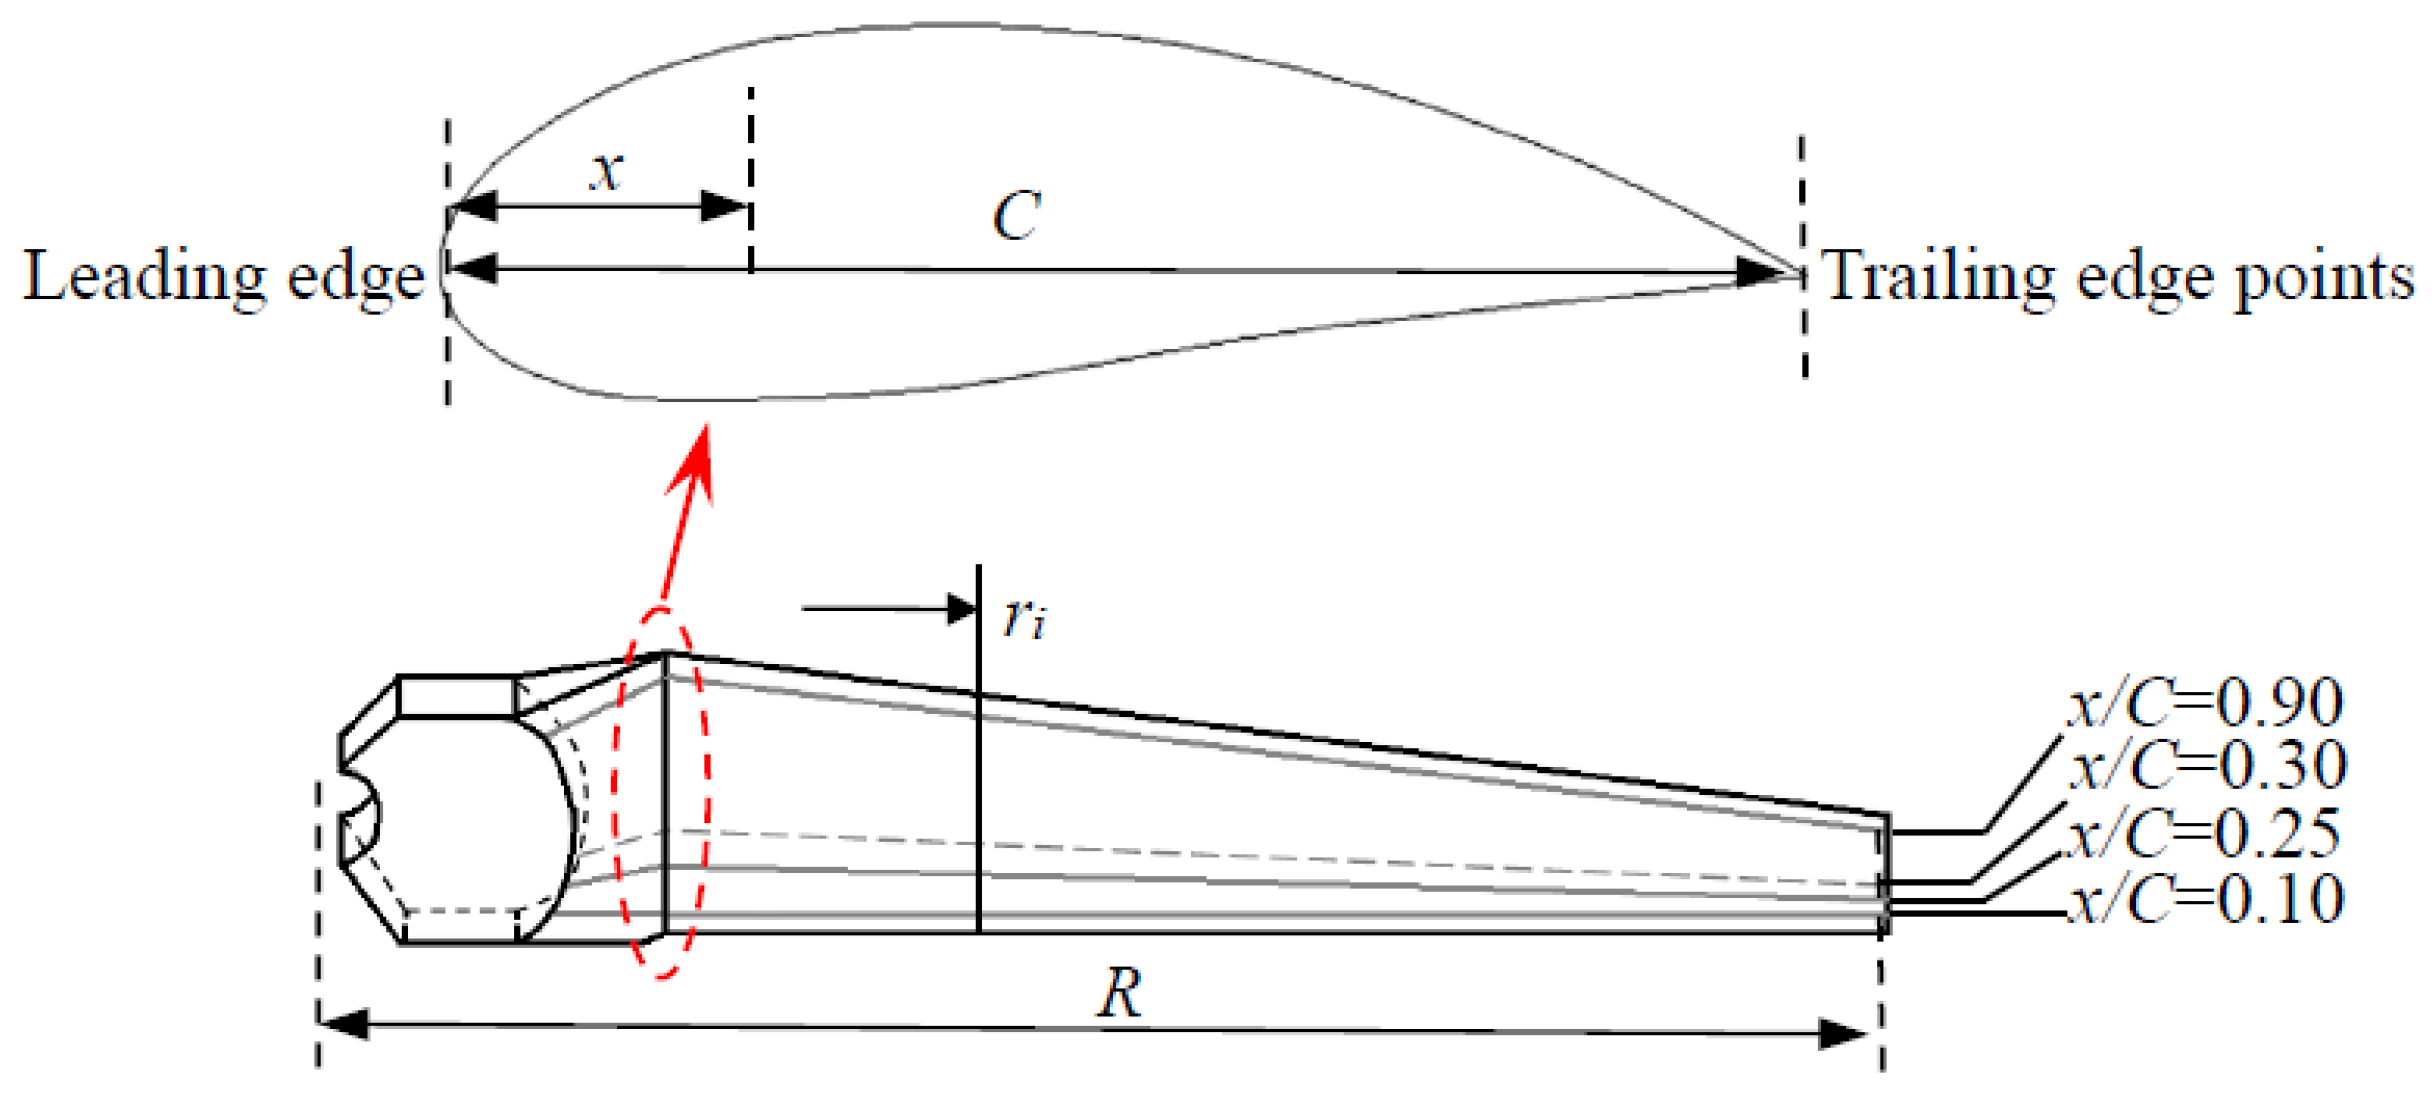
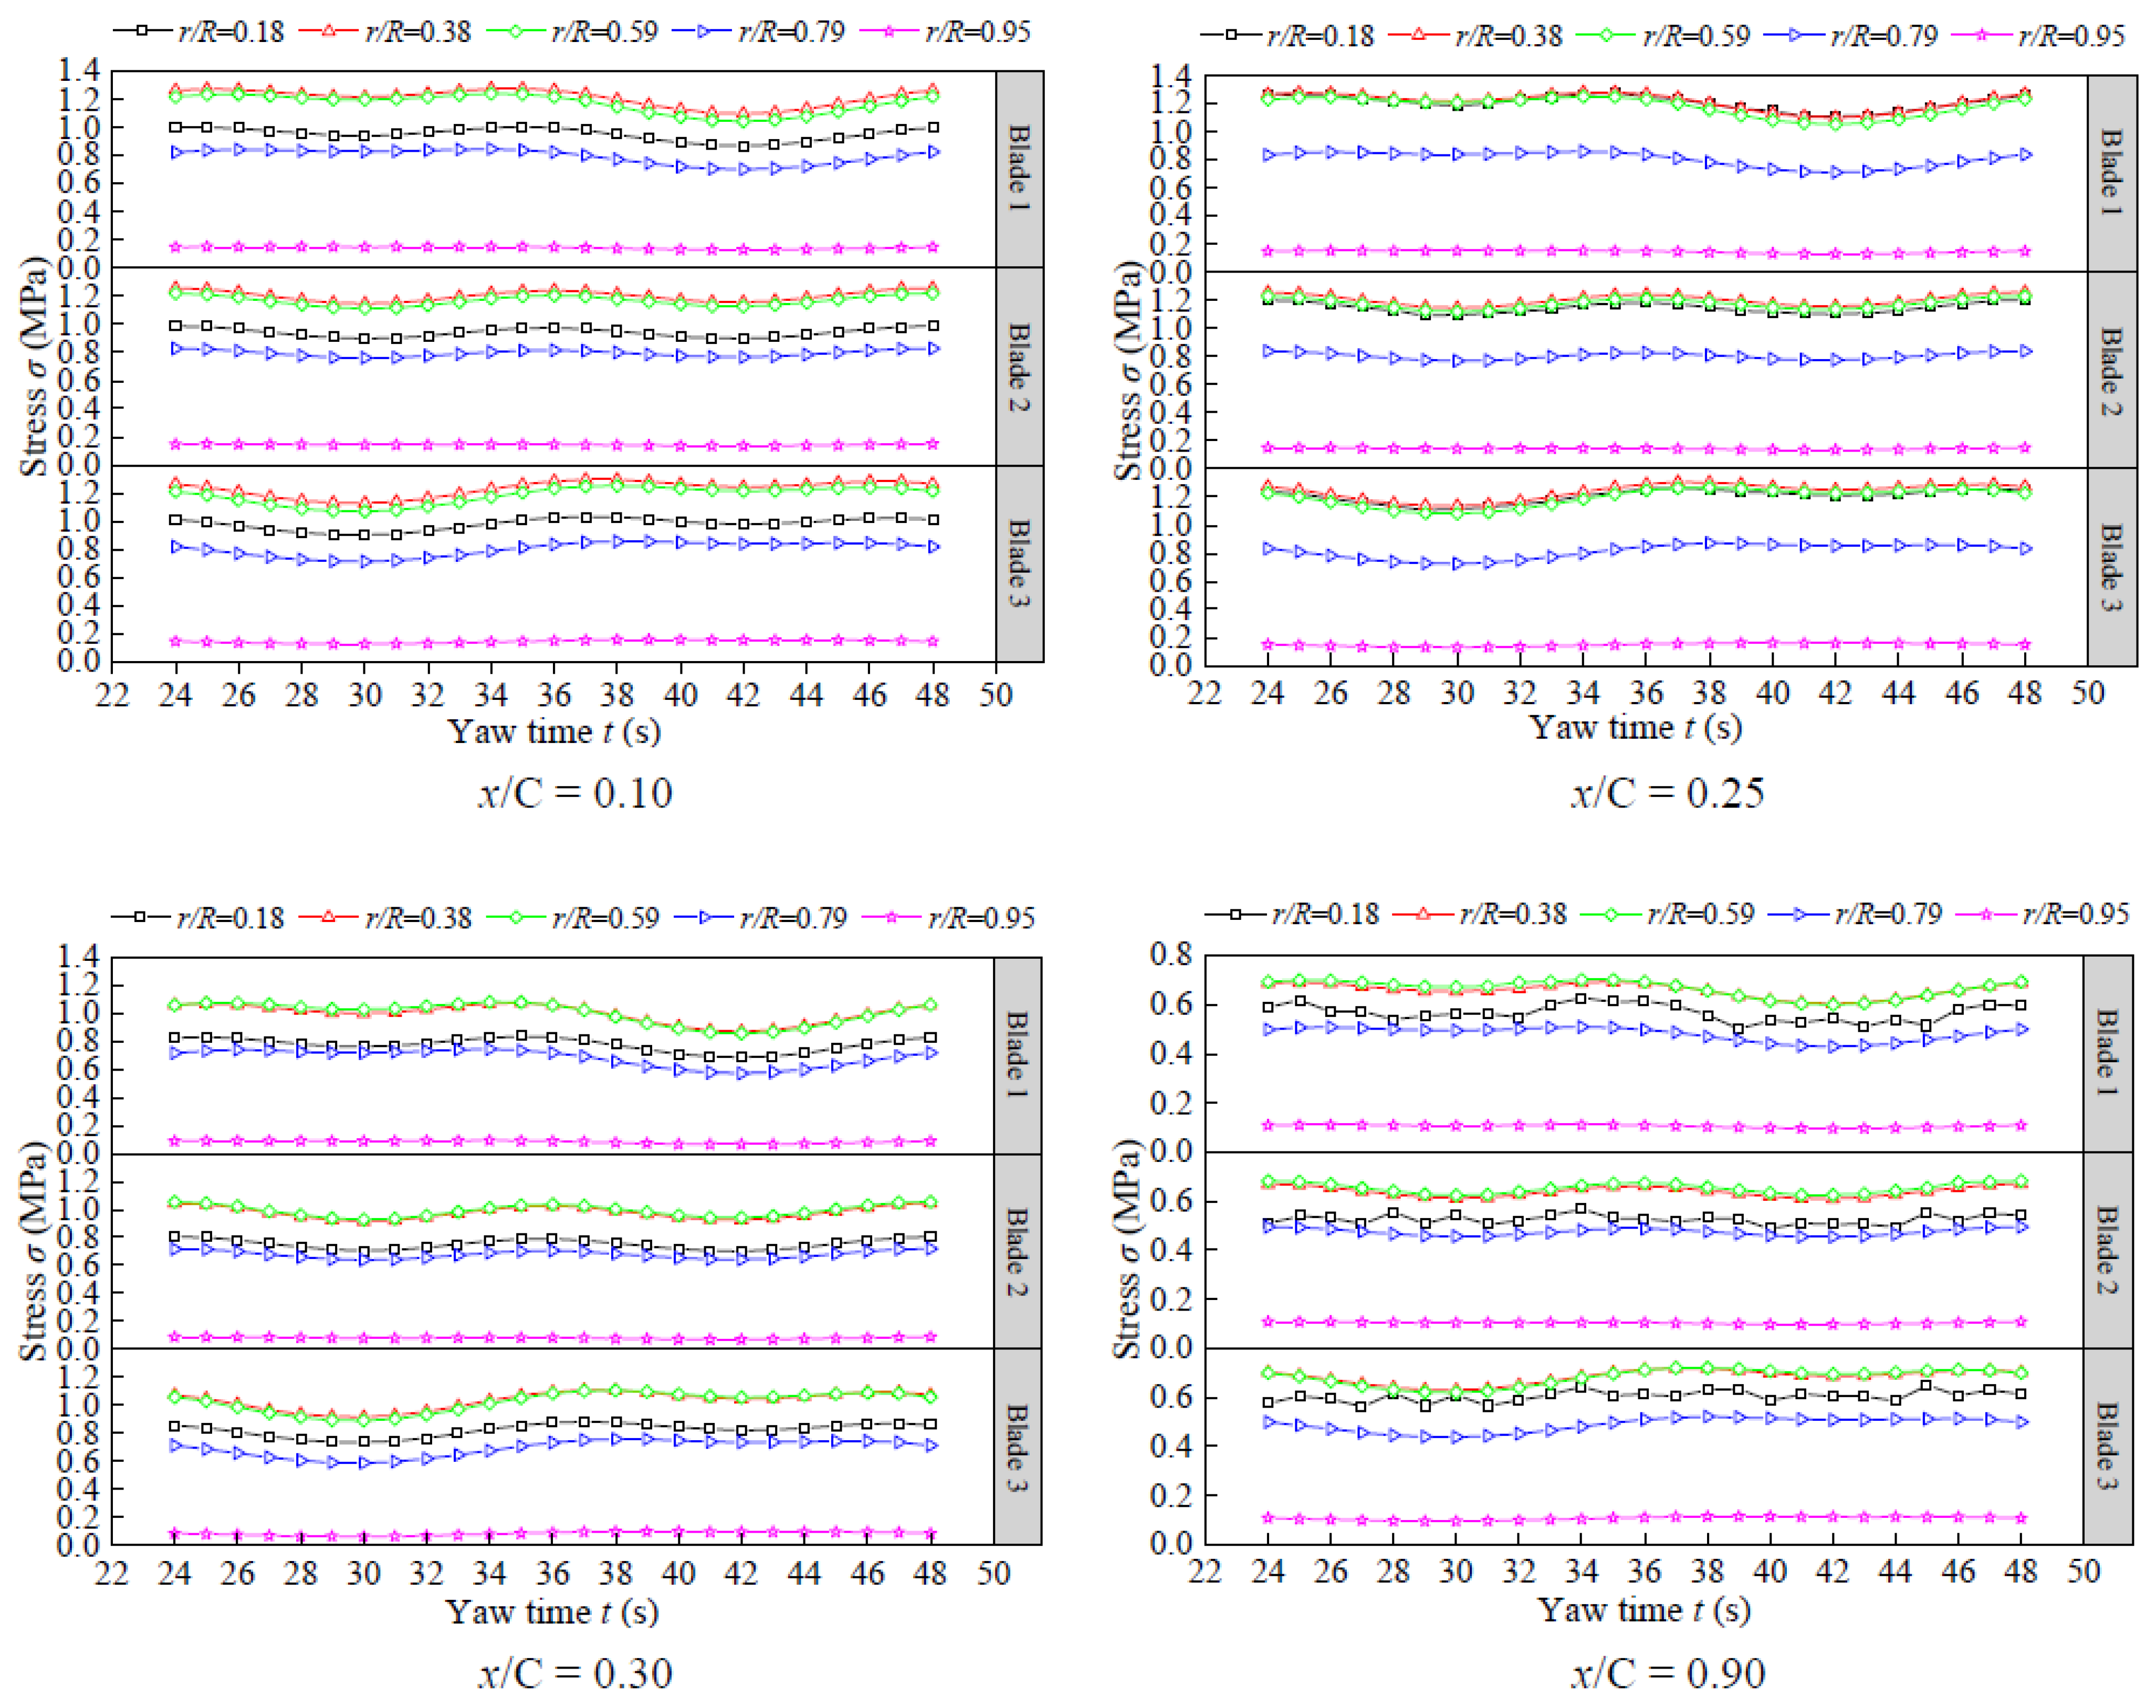
As shown in Figure 13, the radius of the blade is R, the chord length of the aerofoil section is C, and the distance from the center of rotation to a certain aerofoil is ri. The dimensionless chord length positions of x/C = 0.10, 0.25, 0.30, and 0.90 are the leading-edge position of the blade, the position of the aerodynamic center line, the position of the highest point of the blade back [46], and the position of the trailing edge of the blade, respectively, where x is the distance from the aerofoil section to the leading-edge point.
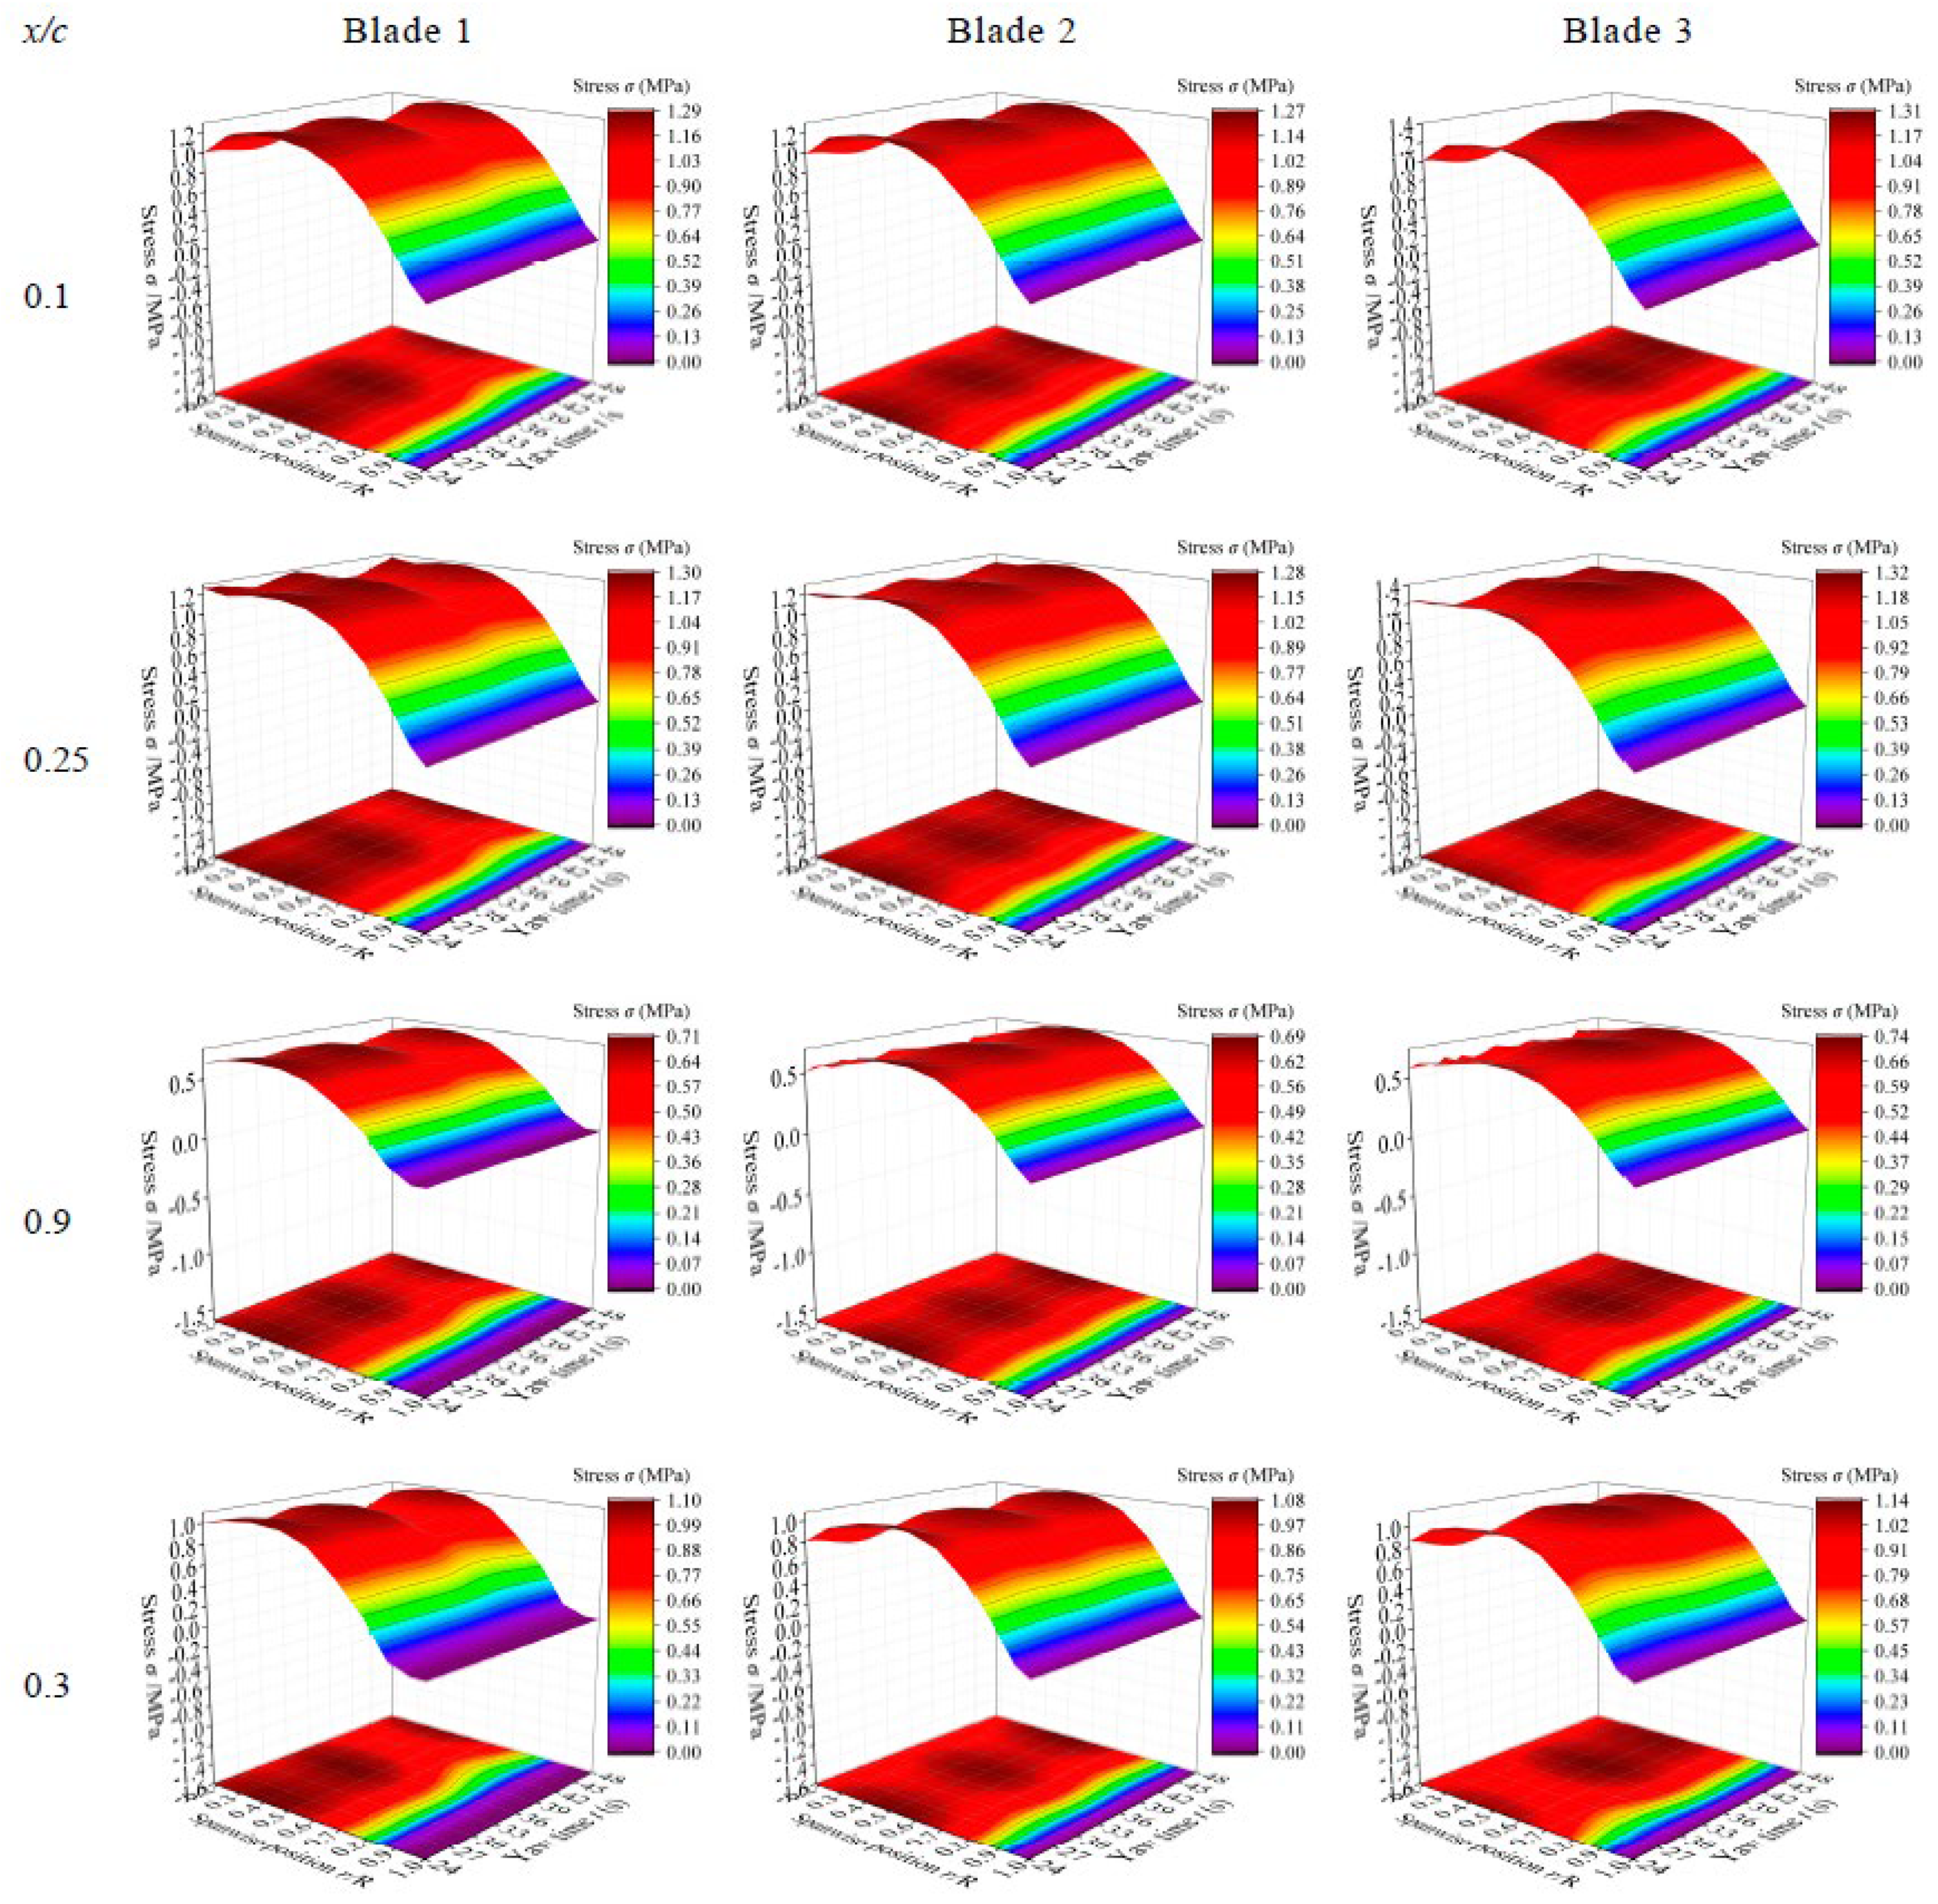
Figure 14 shows the 3D stress surfaces of a blade leading edge, aerodynamic center line, the highest point on the blade back, and the blade trailing edge along the spanwise stress with time and yaw angle in one cycle. Near the root of the blade, obvious fluctuations first decreased, then increased, then decreased, then increased. With changes in the yaw angle, the stress in the blade tip area’s outward direction did not change noticeably. From the middle to the tip, the force on the blade rapidly dropped after initially increasing and then decreasing along the spanwise direction. The shape of the blade was distorted as the cross-sectional dimensions expanded outward with different twist degrees along the spanwise direction, and the aerofoil’s interface size and stiffness steadily decreased along the spanwise direction.
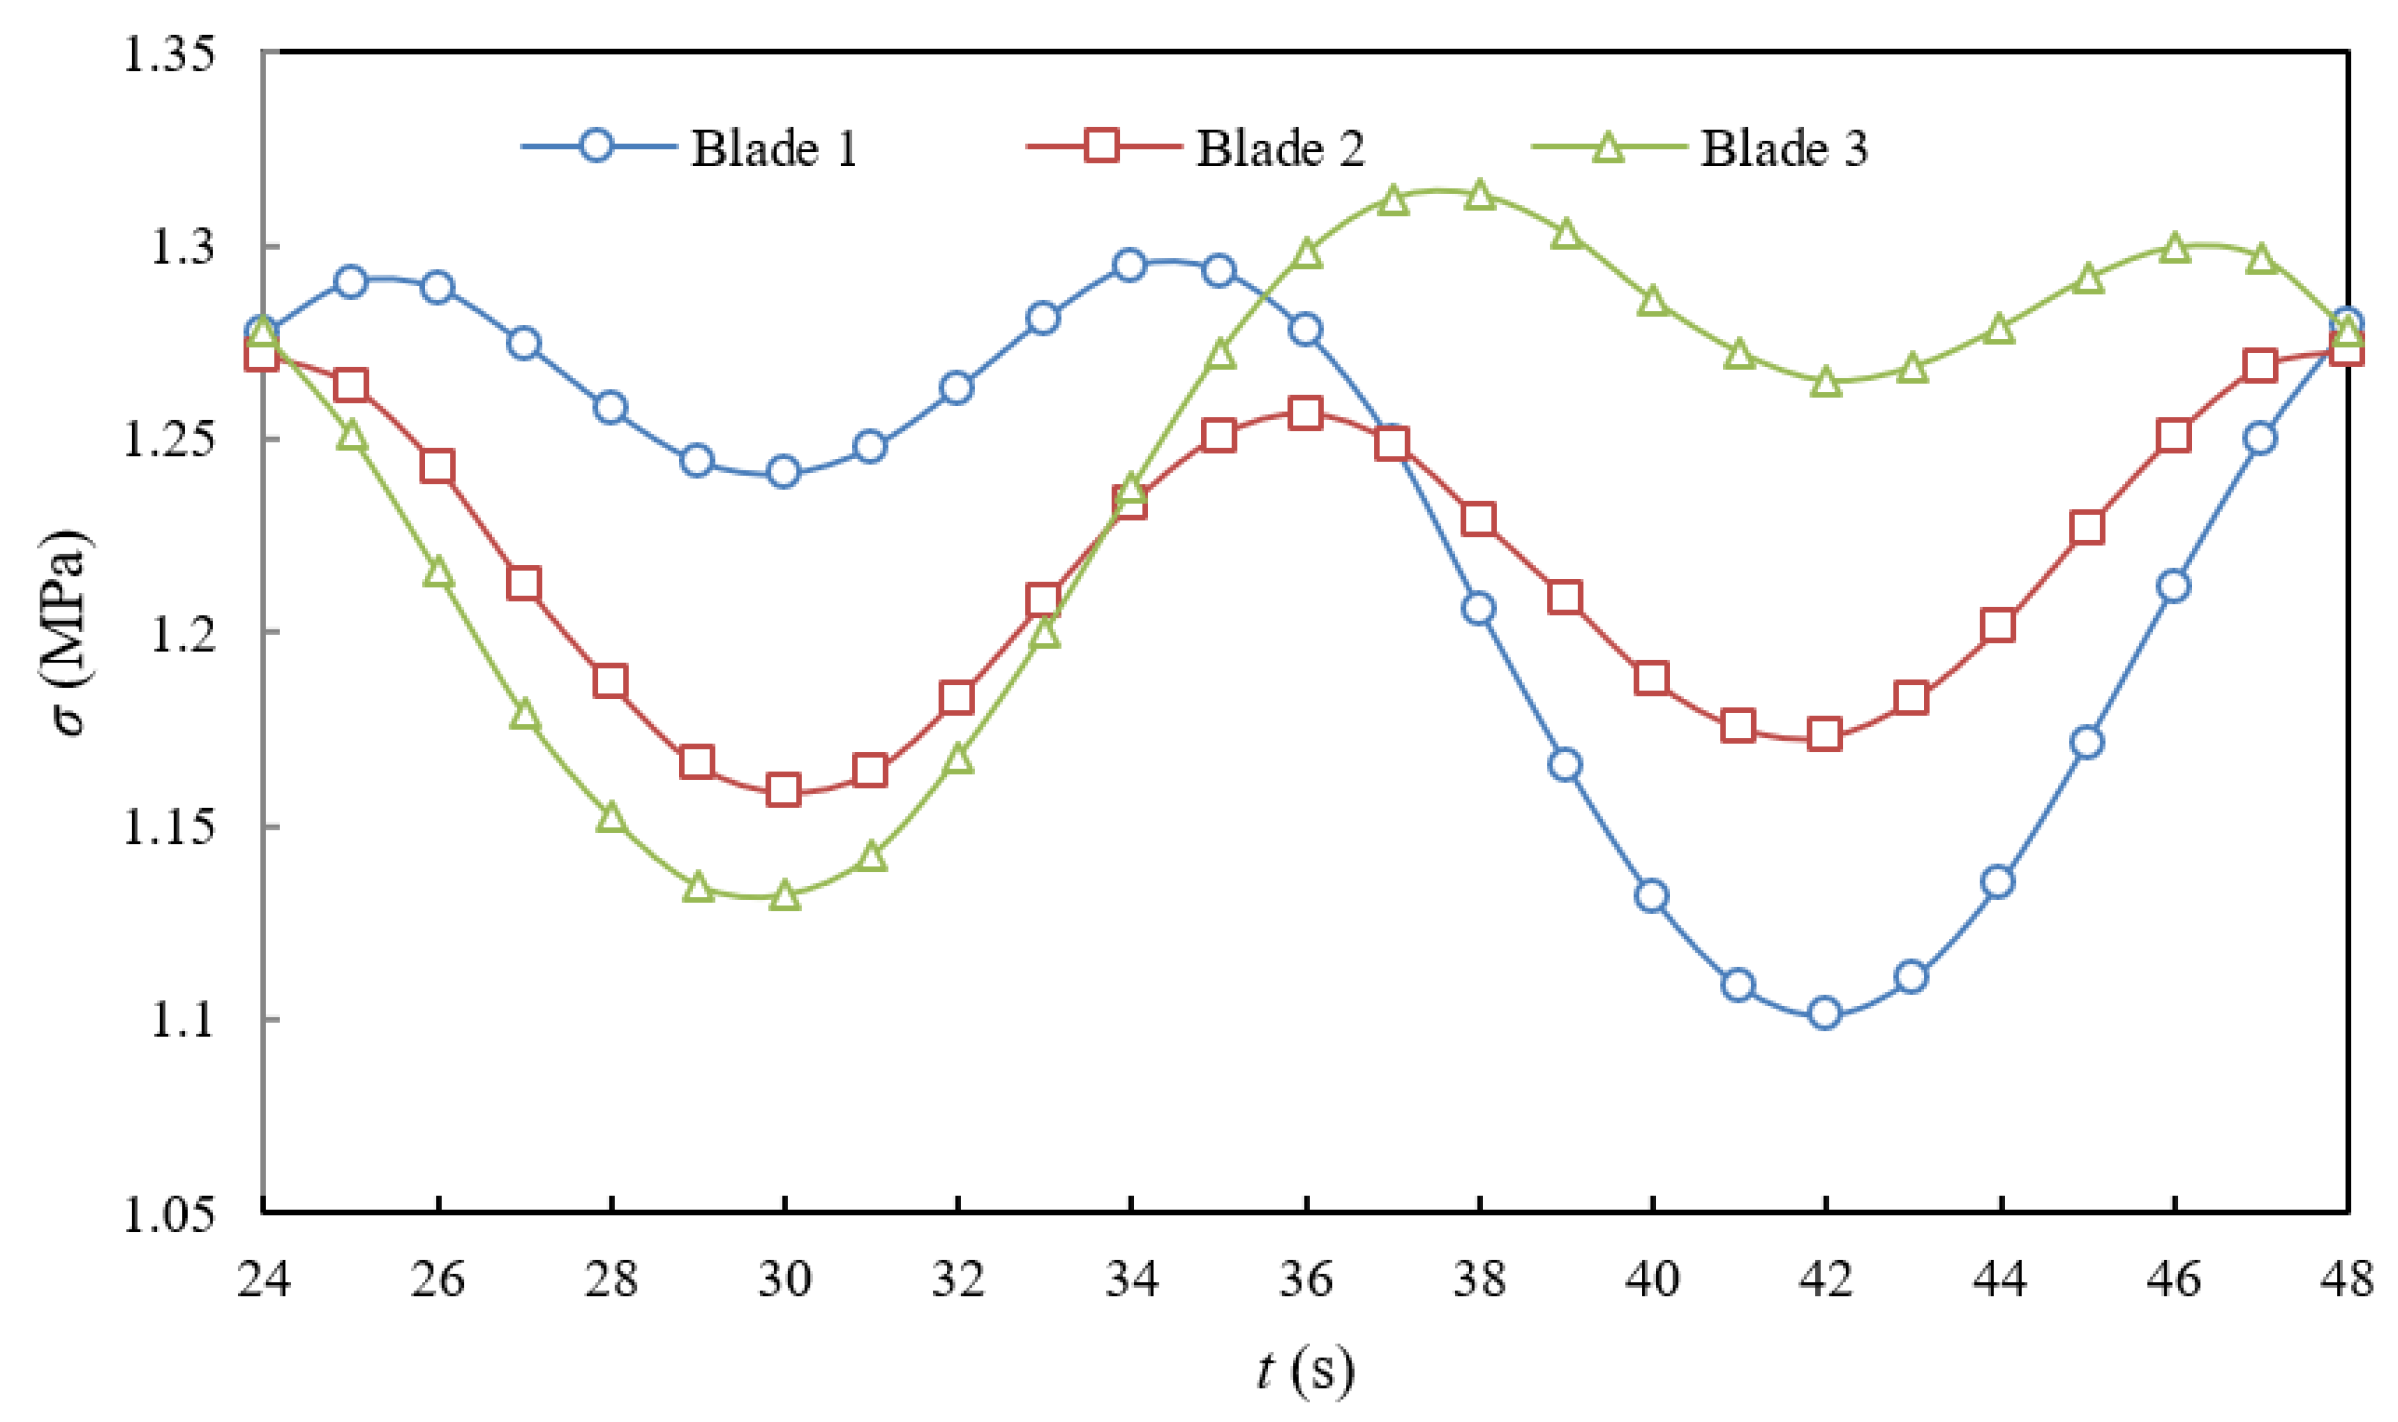
Figure 15 shows curves of the stress change along the spanwise direction under λ = 5.0. In one deflection cycle of the wind turbine, the stress-concentration region of the three blades was near the middle part of the blades at r/R ∈ (0.38, 0.59). Under the influence of a yaw state, the stress on a blade from the root to the middle fluctuated markedly with increases and decreases in the yaw angle. In contrast to the stress near the tip, which was less impacted by the yaw condition, the stress varied slightly from the middle to the tip with the yaw angle. At the position of the blade’s maximum chord length r/R = 0.18, the stress on the aerodynamic center line was not substantially different from that on the middle position of the blade, while the stresses on the other three positions were all lower than that on the middle position. The stress at the blade’s windward surface trailing edge fluctuated with the yaw angle, while that at the other three changed only slightly. The greatest stress values of the three blades were determined from the location of the aerodynamic center line by examining the scale stress value of the time–domain diagram of the stress surface. Therefore, the position of the maximum stress value in the middle of the aerodynamic center line (r/R = 0.49) was selected and the stress changes of the three blades within one cycle were analyzed, as shown in Figure 14. As shown in Figure 16, during a yaw cycle, the stress of the three blades showed a cosine fluctuation, while the stress value of blade 3 was greater during negative yaw, which increased by 2.22%, and the minimum value of blade 1 occurred at a negative yaw of θ = −30°, which decreased by 13.85%.
The stress in the wind turbine blades demonstrated a cosine distribution with regard to yaw fluctuation, as per the analysis above. In a single yaw period, blade 1 showed a large range of stress fluctuations during negative yaw angle deflection, with the minimum stress occurring at a yaw angle of −30°. Blade 2 showed a gentle fluctuation in overall stress, and blade 3 had greater stress fluctuations at positive yaw angles, with the minimum occurring at a positive yaw of θ = +30°.
Figure 17 shows the dynamic changes in maximum stress during yaw dynamics:
  • At a tip speed ratio of 4, the stress of downwind deflection was greater than that of upwind deflection within one deflection period, except at −25° and −5° yaw angles. There was a significant difference in the stresses of downwind and upwind deflections for a particular yaw angle, and the stress of upwind deflection was always greater than that of downwind deflection at other yaw angles.
  • At a tip speed ratio of 5, the downwind yaw stress was less than the headwind yaw stress at yaw angles of −20° and 15°, and the differences in stress at a given yaw angle within a yaw period were inconspicuous.
  • At a tip speed ratio of 6, the stress of downwind deflection was less than that of headwind deflection at yaw angles of −10°, 10°, 20°, and 25°. At one yaw angle, downwind deflection stresses were greater than headwind deflection stresses, and the stress differential between downwind and headwind deflection stresses rose steadily.
The mean blade stress was higher at a positive yaw angle than at a negative yaw angle for the same yaw angle in the three working circumstances.

4. Conclusions

By analyzing the distribution characteristics of blade stress, axial thrust, and wind turbine power output under periodic dynamic yaw conditions, the following conclusions were drawn:
(1) During dynamic yaw, the distribution of blade stress on the windward side is consistent with that on the leeward side. The distribution trend of blade stress shows an increase, followed by a decrease, from the inside out along the span direction, and the stress values near the blade root exhibit significant fluctuations. When the azimuth angle of the blade is 0°, the maximum stress value is located at the maximum chord length of the blade.
(2) Within the range of a 10° to 30° yaw variation period, the stress value during positive yaw is greater than that during negative yaw. With the increase in the tip speed ratio, the stress values of dynamic windward yaw gradually exceed those of leeward yaw, and the highest stress value occurs in the range of −5° to 15°. The stress value of the blade is presented as a cosine distribution during yaw fluctuations, and the maximum stress value can increase by 2.22%, while the minimum stress value can decrease by 13.85%.
(3) The three-blade axial thrust is presented as a cosine distribution with yaw fluctuations. The axial thrust exhibits varying degrees of fluctuation with dynamic yaw, with a maximum increase of 1.75% and a minimum decrease of 19.97%.
(4) The output power of the wind turbine decreases with the increase in the yaw angle, and exhibits a cosine variation with yaw fluctuations, with a maximum reduction of 25.58%.
The results of this study can support the effective and sustainable use of wind energy in the circular economy by serving as a theoretical foundation for structural design of wind turbines and yaw control systems that take dynamic yaw operation into account. In future research, the impact of aeroelastic coupling on blade stress will be considered, as well as the optimization design of blades based on existing research results.

Author Contributions

Methodology, L.Z.; Validation, Y.B.; Writing—original draft, Y.Z.; Writing—review & editing, X.G. and J.W.; Supervision, J.W. All authors have read and agreed to the published version of the manuscript.

Funding

This research was funded by the Inner Mongolia Agricultural University high-level/Excellent Doctor talent introduction research project, grant number NDYB2021-29; the Scientific Research Projection of Higher Schools of Inner Mongolia, grant number NJZY23115; the Inner Mongolia Autonomous Region Natural Science Fund, grant number 2023QN05039; the Inner Mongolia Autonomous Region Natural Science Fund, grant number 2019MS05022; the National Nature Science Foundation of China, grant number 52066013; and the National Nature Science Foundation of China, grant number 52066014.

Institutional Review Board Statement

Not applicable.

Informed Consent Statement

Not applicable.

Data Availability Statement

Not applicable.

Conflicts of Interest

The authors declare no conflict of interest.

References

  1. Chu, L.K. The role of energy security and economic complexity in renewable energy development: Evidence from G7 countries. Environ. Sci. Pollut. Res. 2023, 30, 56073–56093. [Google Scholar] [CrossRef]
  2. Zhao, J.; Dong, K.; Dong, X.; Shahbaz, M. How renewable energy alleviate energy poverty? A global analysis. Renew. Energy 2022, 186, 299–311. [Google Scholar] [CrossRef]
  3. Younis, M.A.A.; Quteishat, A. Selection of wind turbine systems for the sultanate of oman. Comput. Syst. Sci. Eng. 2023, 45, 343–359. [Google Scholar] [CrossRef]
  4. Kumar, A.; Pal, D.; Kar, S.K.; Mishra, S.K.; Bansal, R. An overview of wind energy development and policy initiatives in India. Clean Technol. Environ. Policy 2022, 24, 1337–1358. [Google Scholar] [CrossRef] [PubMed]
  5. Zhang, J.; Wang, H. Development of offshore wind power and foundation technology for offshore wind turbines in China. Ocean Eng. 2022, 266, 113256. [Google Scholar] [CrossRef]
  6. Tian, W.; Ozbay, A.; Hu, H. A wind tunnel study of wind loads on a model wind turbine in atmospheric boundary layer winds. J. Fluids Struct. 2019, 85, 17–26. [Google Scholar] [CrossRef]
  7. Morăraș, C.I.; Goanță, V.; Husaru, D.; Istrate, B.; Bârsănescu, P.D.; Munteanu, C. Analysis of the effect of fiber orientation on mechanical and elastic characteristics at axial stresses of GFRP used in wind turbine blades. Polymers 2023, 15, 861. [Google Scholar] [CrossRef]
  8. Mohammadi, M.; Bastankhah, M.; Fleming, P.; Churchfield, M.; Bossanyi, E.; Landberg, L.; Ruisi, R. Curled-Skewed Wakes behind Yawed Wind Turbines Subject to Veered Inflow. Energies 2022, 15, 9135. [Google Scholar] [CrossRef]
  9. Ahmadi, M.H.B.; Yang, Z. Wake Structure in Yawed Approaching Flows for an Axial-Flow Wind Turbine. ASME. J. Eng. Gas Turbines Power 2022, 144, 111016. [Google Scholar] [CrossRef]
  10. Dai, J.; Yang, X.; Yang, W.; Gao, G.; Li, M. Further Study on the Effects of Wind Turbine Yaw Operation for Aiding Active Wake Management. Appl. Sci. 2020, 10, 1978. [Google Scholar] [CrossRef] [Green Version]
  11. Li, X.; Qiu, Y.; Feng, Y.; Wang, Z. Wind turbine power prediction considering wake effects with dual laser beam LiDAR measured yaw misalignment. Appl. Energy 2021, 299, 117308. [Google Scholar] [CrossRef]
  12. Ali, Q.S.; Kim, M.H. Unsteady aerodynamic performance analysis of an airborne wind turbine under load varying conditions at high altitude. Energy Convers. Manag. 2020, 210, 112696. [Google Scholar] [CrossRef]
  13. Song, K.; Kang, Y. A Numerical Performance Analysis of a Rim-Driven Turbine in Real Flow Conditions. J. Mar. Sci. Eng. 2022, 10, 1185. [Google Scholar] [CrossRef]
  14. Li, Z.; Wen, B.; Dong, X.; Peng, Z.; Qu, Y.; Zhang, W. Aerodynamic and aeroelastic characteristics of flexible wind turbine blades under periodic unsteady inflows. J. Wind Eng. Ind. Aerodyn. 2020, 197, 104057. [Google Scholar] [CrossRef]
  15. Song, K.; Wang, W.Q.; Yan, Y. The hydrodynamic performance of a tidal-stream turbine in shear flow. Ocean Eng. 2020, 199, 107035. [Google Scholar]
  16. Ye, Z.; Wang, X.; Chen, Z.; Wang, L. Unsteady aerodynamic characteristics of a horizontal wind turbine under yaw and dynamic yawing. Acta Mech. Sin. 2020, 36, 320–338. [Google Scholar] [CrossRef]
  17. Wang, X.; Ye, Z.; Kang, S.; Hu, H. Investigations on the Unsteady Aerodynamic Characteristics of a Horizontal-Axis Wind Turbine during Dynamic Yaw Processes. Energies 2019, 12, 3124. [Google Scholar] [CrossRef] [Green Version]
  18. Ye, Z.L.; Wang, X.D.; Yin, Z.M.; Wang, L. Unsteady Aerodynamic Characteristics of Wind Turbine Under Dynamic Yaw. J. Eng. Thermophys. 2019, 40, 565–572. [Google Scholar]
  19. Wen, B.; Tian, X.; Dong, X.; Peng, Z.; Zhang, W.; Wei, K. A numerical study on the angle of attack to the blade of a horizontal-axis offshore floating wind turbine under static and dynamic yawed conditions. Energy 2019, 168, 1138–1156. [Google Scholar] [CrossRef]
  20. Ke, S.; Yu, W.; Wang, T.; Ge, Y. Aerodynamic performance and wind-induced effect of large-scale wind turbine system under yaw and wind-rain combination action. Renew. Energy 2019, 136, 235–253. [Google Scholar] [CrossRef]
  21. Ke, S.; Wang, T.; Ge, Y.; Wang, H. Wind-induced fatigue of large HAWT coupled tower-blade structures considering aeroelastic and yaw effects. Struct. Des. Tall Spec. Build. 2018, 27, e1467. [Google Scholar] [CrossRef]
  22. Wang, W.; Matsubara, T.; Hu, J.; Odahara, S.; Nagai, T.; Karasutani, T.; Ohya, Y. Experimental investigation into the influence of the flanged diffuser on the dynamic behavior of CFRP blade of a shrouded wind turbine. Renew. Energy 2015, 78, 386–397. [Google Scholar] [CrossRef]
  23. Dai, L.; Yao, S.; Wang, X.; Kang, S. Fluid-structure interaction performance of wind turbine blade under yawed condition. Acta Energiae Solaris Sin. 2017, 38, 945–950. [Google Scholar]
  24. Zhang, J.W.; Wang, J.W.; Yan, S.J. The effect of yaw speed and delay time on power generation and stress of a wind turbine. Int. J. Green Energy 2022, 20, 153–165. [Google Scholar] [CrossRef]
  25. Meng, H.; Lien, F.S.; Glinka, G.; Geiger, P. Study on fatigue life of bend-twist coupling wind turbine blade based on anisotropic beam model and stress-based fatigue analysis method. Compos. Struct. 2019, 208, 678–701. [Google Scholar] [CrossRef]
  26. Tohid Bagherpour, T.; Li, X.M.; Manolas, D.I.; Riziotis, V. Modeling of material bend-twist coupling on wind turbine blades. Compos. Struct. 2018, 193, 237–246. [Google Scholar] [CrossRef]
  27. Boujleben, A.; Ibrahimbegovic, A.; Lefrançois, E. An efficient computational model for fluid-structure interaction in application to large overall motion of wind turbine with flexible blades. Appl. Math. Model. 2020, 77, 392–407. [Google Scholar] [CrossRef]
  28. Liu, L.; Bian, H.; Du, Z.; Xiao, C.; Guo, Y.; Jin, W. Reliability analysis of blade of the offshore wind turbine supported by the floating foundation. Compos. Struct. 2019, 211, 287–300. [Google Scholar] [CrossRef]
  29. Zhang, C.; Chen, H.; Huang, T. Fatigue damage assessment of wind turbine composite blades using corrected blade element momentum theory. Measurement 2018, 129, 102–111. [Google Scholar] [CrossRef]
  30. Chen, X. Experimental Investigation on Structural Collapse of a Large Composite Wind Turbine Blade under Combined Bending and Torsion. Compos. Struct. 2017, 160, 435–445. [Google Scholar] [CrossRef]
  31. Chen, X.; Tang, J.; Yang, K. Modeling multiple failures of composite box beams used in wind turbine blades. Compos. Struct. 2019, 217, 130–142. [Google Scholar] [CrossRef] [Green Version]
  32. Stanciu, M.D.; Nastac, S.M.; Tesula, I. Prediction of the Damage Effect on Fiberglass-Reinforced Polymer Matrix Composites for Wind Turbine Blades. Polymers 2022, 14, 1471. [Google Scholar] [CrossRef]
  33. Ye, J.; Chu, C.; Cai, H.; Hou, X.; Shi, B.; Tian, S.; Chen, X.; Ye, J. A multi-scale model for studying failure mechanisms of composite wind turbine blades. Compos. Struct. 2019, 212, 220–229. [Google Scholar] [CrossRef] [Green Version]
  34. Baqersad, J.; Niezrecki, C.; Avitabile, P. Full-field dynamic strain prediction on a wind turbine using displacements of optical targets measured by stereophotogrammetry. Mech. Syst. Signal Process. 2015, 62–63, 284–295. [Google Scholar] [CrossRef]
  35. Baqersad, J.; Niezrecki, C.; Avitabile, P. Extracting full-field dynamic strain on a wind turbine rotor subjected to arbitrary excitations using 3D point tracking and a modal expansion technique. J. Sound Vib. 2015, 352, 16–29. [Google Scholar] [CrossRef] [Green Version]
  36. Wu, R.; Zhang, D.; Yu, Q.; Jiang, Y.; Arola, D. Health monitoring of wind turbine blades in operation using three-dimensional digital image correlation. Mech. Syst. Signal Process. 2019, 130, 470–483. [Google Scholar] [CrossRef]
  37. Haselbach, P.U. An advanced structural trailing edge modelling method for wind turbine blades. Compos. Struct. 2017, 180, 521–530. [Google Scholar] [CrossRef] [Green Version]
  38. Fernandez, G.; Usabiaga, H.; Vandepitte, D. An efficient procedure for the calculation of the stress distribution in a wind turbine blade under aerodynamic loads. J. Wind Eng. Ind. Aerodyn. 2018, 172, 42–54. [Google Scholar] [CrossRef]
  39. Santo, G.; Peeters, M.; Van Paepegem, W.; Degroote, J. Dynamic load and stress analysis of a large horizontal axis wind turbine using full scale fluid-structure interaction simulation. Renew. Energy 2019, 140, 212–226. [Google Scholar] [CrossRef]
  40. Jiang, Y.; Liu, S.; Zao, P.; Yu, Y.; Zou, L.; Liu, L.; Li, J. Experimental evaluation of a tree-shaped quad-rotor wind turbine on power output controllability and survival shutdown capability. Appl. Energy 2022, 309, 1183505. [Google Scholar] [CrossRef]
  41. Liew, J.; Lio, W.H.; Urbán, A.M.; Holierhoek, J.; Kim, T. Active tip deflection control for wind turbines. Renew. Energy 2019, 149, 445–454. [Google Scholar] [CrossRef] [Green Version]
  42. Collet, D.; Alamir, M.; Di Domenico, D.; Sabiron, G. Data-driven fatigue-oriented MPC applied to wind turbines Individual Pitch Control. Renew. Energy 2021, 170, 1008–1019. [Google Scholar] [CrossRef]
  43. Farag, W.; El-Hosary, M.; Kamel, A. Analysis of Various Yaw Control Techniques for Large Wind Turbines. J. Eng. Res. 2019, 7, 215–231. [Google Scholar]
  44. Chen, W.; Liu, H.; Lin, Y.; Li, W.; Sun, Y.; Zhang, D. LSTM-NN Yaw Control of Wind Turbines Based on Upstream Wind Information. Energies 2020, 13, 1482. [Google Scholar] [CrossRef] [Green Version]
  45. Toosi, M.E.N.; Rahmati, M. A Novel Wake Control Approach for Power Generation Improvement of Three Wind Turbines in a Wind Farm. ASME. J. Eng. Gas Turbines Power 2022, 144, 121001. [Google Scholar] [CrossRef]
  46. Wang, J.; Jia, R.; Wu, K.; Wang, J. Effects of a tip vane on pressure distribution of wind turbine blade. J. Eng. Thermophys. 2006, 27, 760–762. [Google Scholar]
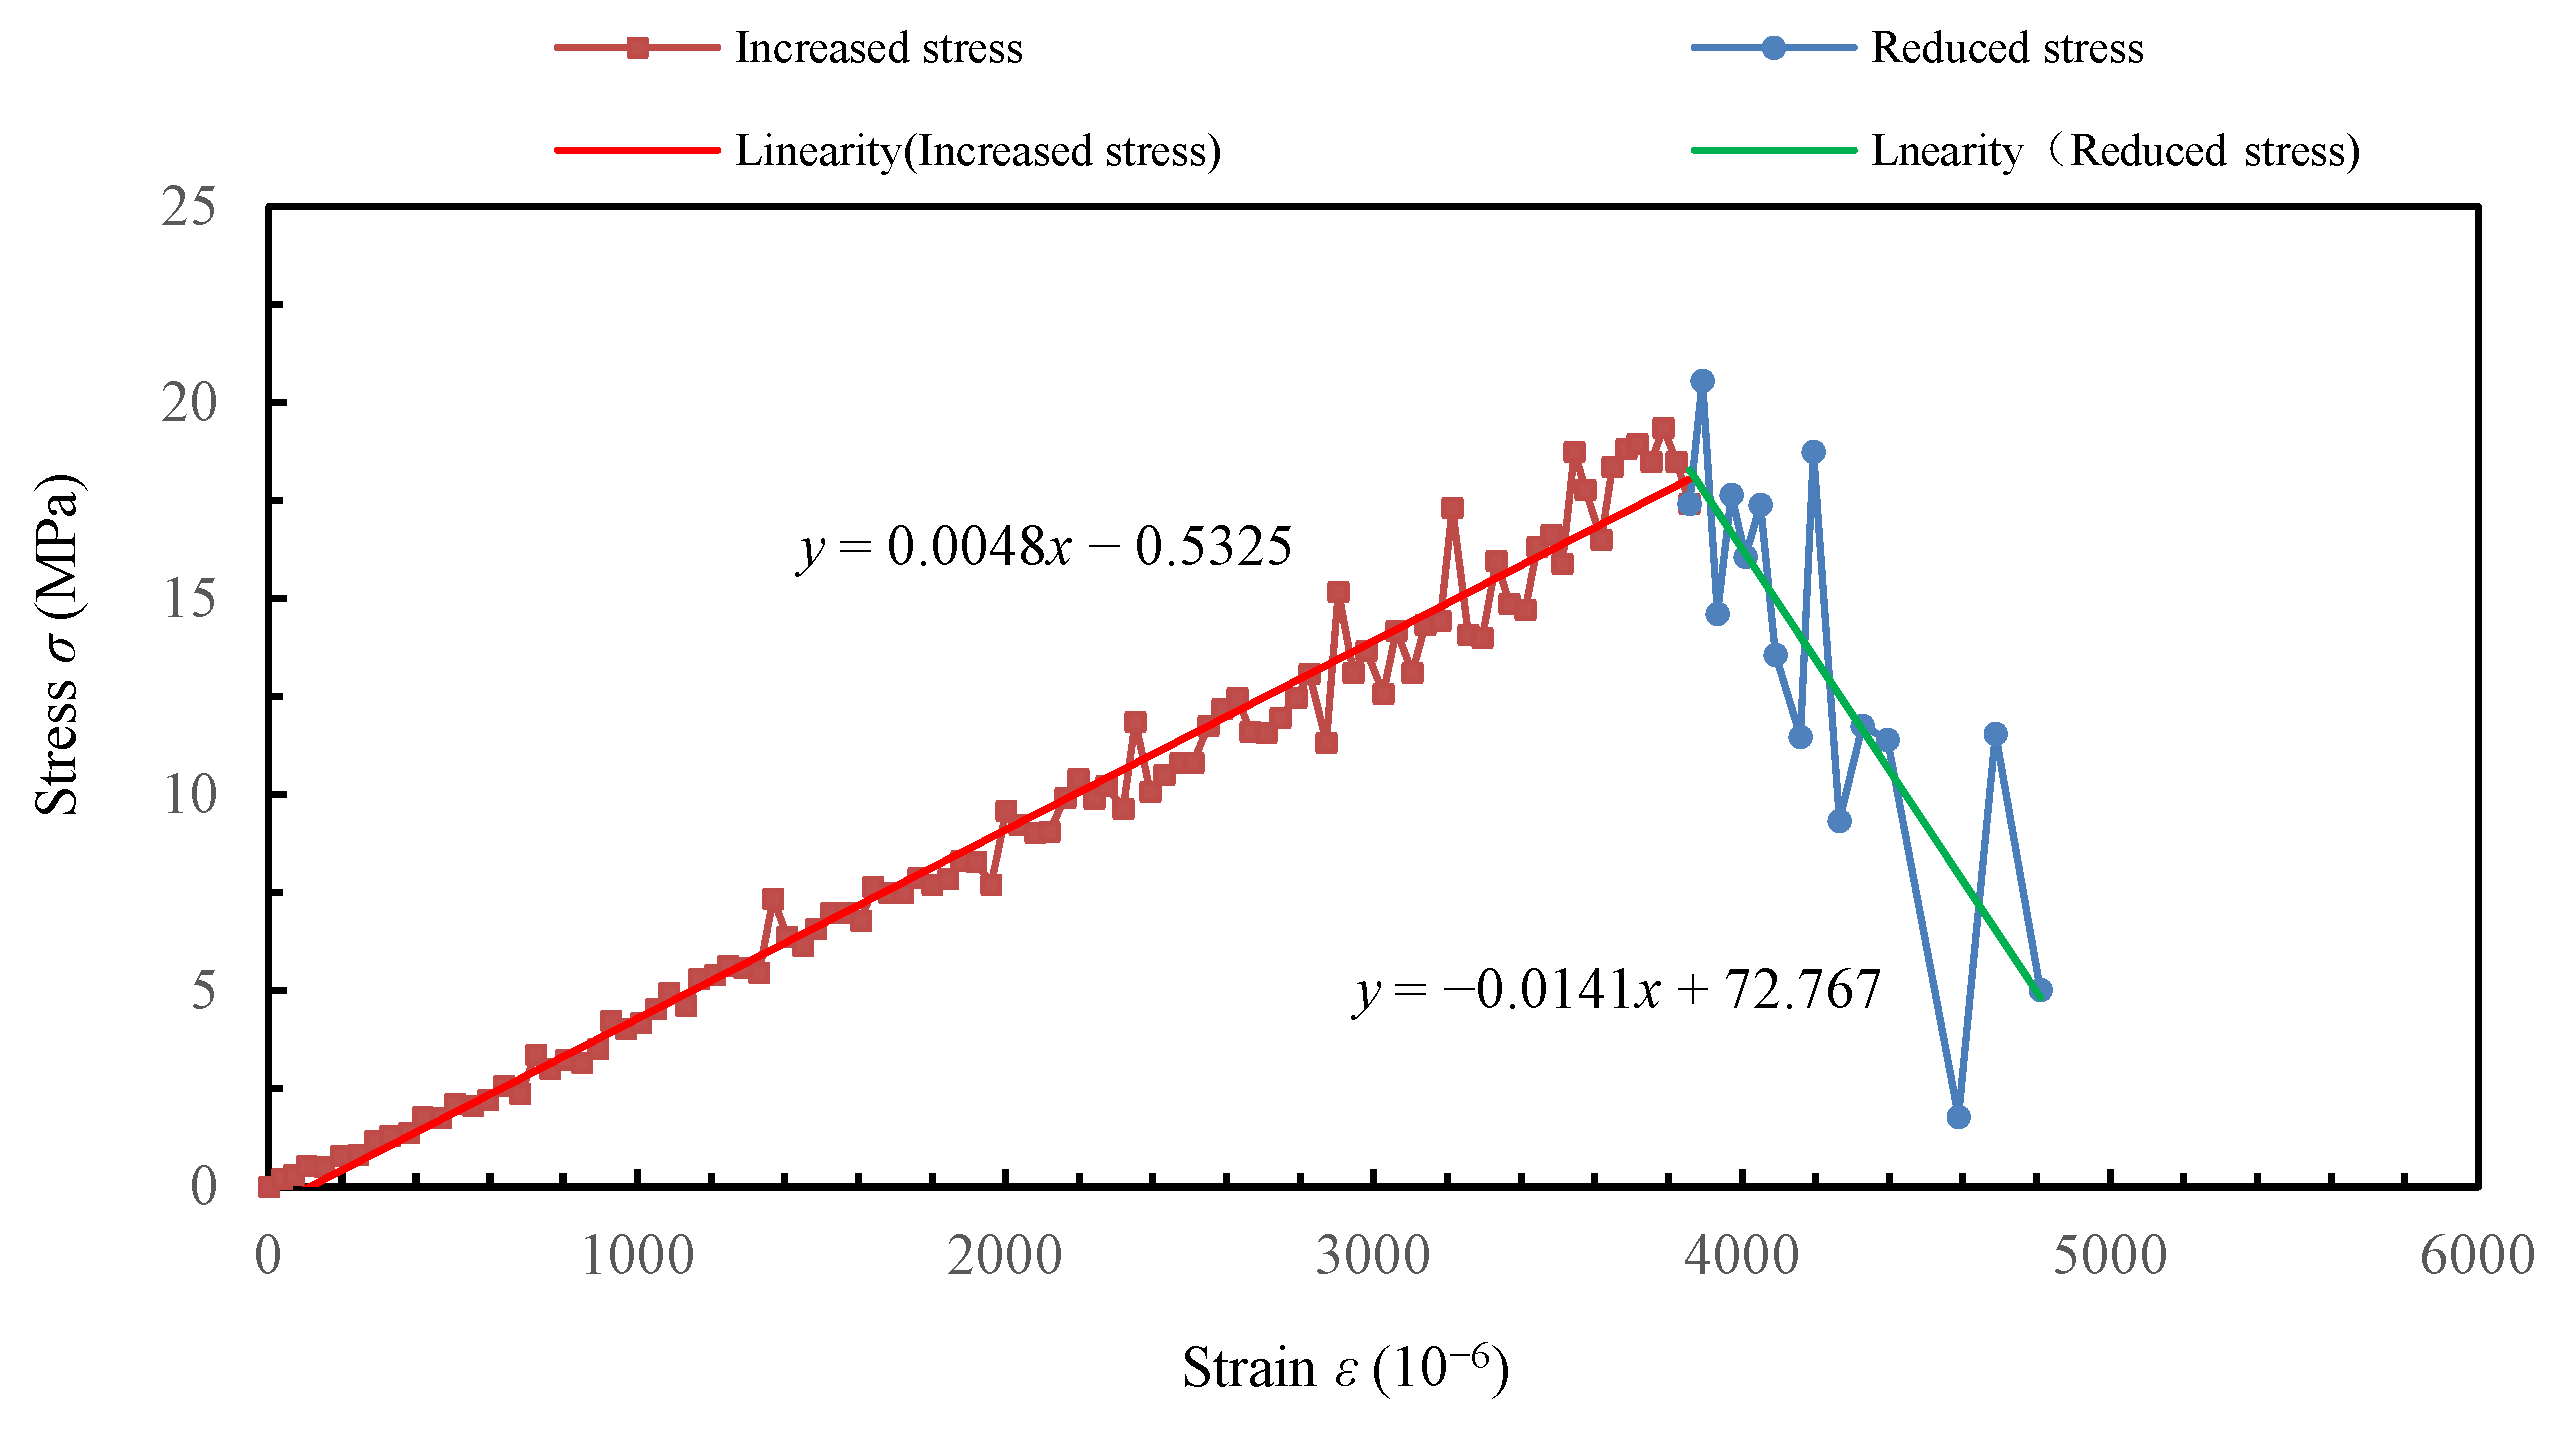
Figure 1. The stress–strain curve of a wind turbine blade.
Applsci 13 08418 g001
Figure 2. Azimuth angle and number of blades. ψ is the blade azimuth angle.
Applsci 13 08418 g002
Figure 3. Three–dimensional view of the computational domain with sizes and boundary conditions.
Applsci 13 08418 g003
Figure 4. Yaw curves over time.
Applsci 13 08418 g004
Figure 5. Induced velocity of a yawed wind turbine.
Applsci 13 08418 g005
Figure 6. Meshing.
Figure 6. Meshing.
Applsci 13 08418 g006
Figure 7. Torque of the wind turbine under dynamic yaw.
Applsci 13 08418 g007
Figure 8. Axial thrust of a single blade.
Applsci 13 08418 g008
Figure 9. Comparison of axial thrusts of single blades at the same yaw position.
Applsci 13 08418 g009
Figure 10. Output power response of wind turbine under dynamic yaw.
Applsci 13 08418 g010
Figure 11. Stress distributions of wind turbine blades on the windward side of the wind turbine (unit: MPa).
Applsci 13 08418 g011
Figure 12. Stress distributions of wind turbine blades on the leeward side of the wind turbine (unit: MPa).
Applsci 13 08418 g012
Figure 13. Dimensionless chord length position.
Applsci 13 08418 g013
Figure 14. Time−domain diagram of 3D stresses at key positions of the blade.
Applsci 13 08418 g014
Figure 15. Stress distribution along the spanwise direction.
Applsci 13 08418 g015
Figure 16. Stress fluctuations in the aerodynamic center lines of the blades.
Applsci 13 08418 g016
Figure 17. Time−domain diagram of maximum stress variation with yaw angle.
Applsci 13 08418 g017
Table 1. Structural parameters of the wind turbine used in this study.
Geometric ParameterSymbolValue
Aerofoil profileNACA 4415
Rotor orientationUpwind
Blade numberN3
Wind speed (m·s−1)U8
Rotor diameter (m)D1.4
MaterialWood composite
Elasticity modulus (GPa)E4.8
Poisson’s ratioμ0.33
Density (kg m−3)ρ625
Disclaimer/Publisher’s Note: The statements, opinions and data contained in all publications are solely those of the individual author(s) and contributor(s) and not of MDPI and/or the editor(s). MDPI and/or the editor(s) disclaim responsibility for any injury to people or property resulting from any ideas, methods, instructions or products referred to in the content.