Article

Identification of Factors Influencing the Operational Effect of the Green Wave on Urban Arterial Roads Based on Association Analysis

1
School of Urban Construction and Transportation, Hefei University, Hefei 230601, China
2
Anhui Province Transportation Big Data Analysis and Application Engineering Laboratory, Hefei 230601, China
*
Author to whom correspondence should be addressed.
Appl. Sci. 2023, 13(14), 8372; https://doi.org/10.3390/app13148372
Submission received: 14 June 2023 / Revised: 14 July 2023 / Accepted: 15 July 2023 / Published: 19 July 2023

Abstract

:
Green wave control is an important technology that synchronizes traffic signals to improve traffic flow on urban arterial roads. Current research has focused on optimizing and evaluating control schemes; however, their operational effect is easily affected by a variety of traffic and travel factors. This means it is important to study methods to identify the factors influencing the operational effect of the green wave on arterial roads. In this study, we conducted innovative research to identify these factors and made breakthroughs in optimizing and evaluating schemes of green wave control. We use the number of stops, travel time, and delays as representative evaluation indicators to assess the effects of four influencing factors: design speed, signal timing, pedestrian crossing, and heavy vehicles. An association analysis that combines sensitivity analysis and grey relational analysis was used to rank these factors in their degree of correlation. A case study was conducted based on the traffic data on Eshan Road in Wuhu City to verify the proposed method. The results of simulations in Vissim 7.0 showed that pedestrian crossing and heavy vehicles were the more important factors influencing the operational effect of the green wave. Moreover, implementing measures related to traffic management helped improve the effect to an extent greater than by optimizing the scheme for green wave control alone. Additionally, optimizing control schemes in the context of implementing measures related to traffic management significantly improved the operational effect of the green wave.

1. Introduction

On main urban roads, vehicles often encounter red lights at single-point signal-controlled intersections, which results in poor traffic flow. Green wave control technology, has therefore received close attention as an important means of urban traffic management [1,2,3]. It determines the traffic offset, which allows vehicles to enter a coordinated road and pass through several intersections without stopping based on the design speed and spacing between intersections [4]. Although green wave control can improve traffic efficiency on arterial roads, it often fails to achieve the desired operational effect owing to various factors [5,6], which has prompted extensive research.
Most research has focused on algorithms to optimize the green wave based on two classical strategies: bandwidth maximization and cost minimization. The former is based on graph-based and numerical methods and mathematical models. For example, Ji et al. [7] considered the influences of cruising speed and residual queues on traffic offset at a red light, and then optimized the classical bidirectional green wave graphic method. Zhang et al. [8] analyzed the shortcomings of the existing traditional numerical solution algorithm to solve the two-way green wave bandwidth problem and then improved it. Ma et al. [9] proposed a method to optimize the timing of traffic lights based on deep reinforcement learning to dynamically adjust the offset. Chen et al. [10] proposed a variable cycle-based method to optimize the bandwidth of the green wave and used it to optimize the green split in real time. Liang et al. [11] proposed an overlapping phase-based signal-control logic and a bus priority control algorithm under two-way signal coordination on arterial roads. Methods of optimization designed to minimize the cost seek to reduce the number of stops, queue length, and delays. For example, Yu et al. [12] proposed a coordinated green wave control model to optimize the distribution of adjacent intersections by minimizing delays. To minimize queue length, Zheng et al. [13] proposed two methods that use AI to coordinate traffic on arterial roads. The above studies investigated algorithms to optimize the green wave, but when applied to arterial roads different algorithmic models differed in adaptability [14]. Although different indicators were evaluated and verified by using traffic simulation, a unified method to assess the operational effect of the green wave on arterial roads remains elusive. As a consequence, no method is available to evaluate schemes of green wave control uniformly based on different algorithmic models.
Among the researchers who have sought to develop a unified method, Tian [15] evaluated the coordination-related performance of an adaptive system of signal control by using travel time and the number of stops as indicators. Chia et al. [16] evaluated the advantages and disadvantages of driving-based, coordination-based, and adaptive control strategies. Wang et al. [17] evaluated green wave coordination based on travel time, number of stops, and intersection delays. Ma et al. [18] selected delays, queue length, stopping rate, speed, and saturation to establish a grade evaluation and ranking model of operational efficiency on arterial roads. Liu et al. [14] designed an indicator to assess green wave-based coordination to evaluate different control schemes. Zhuo et al. [19] proposed a method of assessment based on grey relational analysis by using the travel time and the single-vehicle delay of the green wave as evaluation indicators. Lin [6] took the rate of use of green lights, delays, and number of stops as evaluation indicators and calculated the grey relational degree between several schemes and the ideal scheme. The above examples show that researchers have used the number of stops, travel time, delay, speed, and queue length to assess schemes of green wave control [6,17,18,19] based on simulations [14] and grey relational analyses [6,19]. These methods can be used to evaluate schemes of green wave control comprehensively and identify the optimal one. However, the operation of the green wave is affected design speed, signal timing, pedestrian crossing, and heavy vehicles, factors that interfere with achieving the desired objectives [20,21,22,23,24]. Moreover, the above studies did not interrelate the evaluation indicators. As a result, the most important factors influencing the operational effect of the green wave were not identified.
While many studies have been conducted on optimizing green wave control schemes, little work has been devoted to their assessment, and even fewer have investigated methods to identify the factors influencing their operational effects. Analyzing the association between the evaluation indicators and influencing factors can identify the most important factors influencing the operational effect of the green wave. This is important as it can be used to develop measures to optimize the operational effect of green wave control schemes.
This study makes the following innovative contributions on the identification of factors influencing the operational effect of the green wave on urban arterial roads: First, we combine sensitivity analysis and grey relational analysis to identify the most important factors influencing the operational effect of the green wave, and propose a method to identify the influencing factors. Second, we collected, cleaned, and matched traffic-related information such as data on multiple associated intersections on arterial roads. The effectiveness of the proposed method, which was verified in combination with actual cases, revealed that measures related to traffic management may be more effective for improving the operational effect of the green wave than those related to optimizing control schemes.
The remainder of this paper is arranged as follows: in Section 2, we detail the method used to calculate and analyze the association between the evaluation indicators and factors influencing the operational effect of the green wave. Section 3 describes the collection and matching of traffic-related data from a case study on the effects of the green wave on Eshan Road, Wuhu City, China. Section 4 contains a discussion and an analysis of the results, and Section 5 summarizes the conclusions of this study.

2. Methods

2.1. General Idea

The general idea of this paper is shown in Figure 1 and consists of two main parts. The first part is about the analysis of evaluation indicators and influencing factors. Through a literature review, it was found that there are many evaluation indicators for the operational effect of green wave with the most commonly used representative indicators being the average number of stops, average travel time, and average delay [6,17,18,19]. Therefore, we selected these three indicators for analysis. There are also many factors influencing the operational effect of the green wave. Physical factors such as the geometric design of intersections and spacing between intersections may prevent implementation of green wave schemes at intersections of arterial roads. However, the focus of this study was on arterial road intersections where green wave schemes have been implemented. Therefore, using a relatively reasonable geometric design and spacing of intersections, we selected non-physical influencing factors related to the operational effect of the green wave for further research. Based on the literature review, we selected four representative influencing factors for analysis: design speed, signal timing, pedestrian crossing, and heavy vehicle travel [20,21,22,23,24].
The second part is about the correlation analysis between evaluation indicators and influencing factors. To evaluate the operational effect of the green wave objectively, traffic simulation software such as Vissim was used to output the values of evaluation indicators under different conditions. To facilitate analysis, the value of influence corresponding to multiple evaluation indicators was further calculated so that the relationship between the value of influence and the influencing factors could be analyzed. Because the factors and the value of influence lack a data sequence directly used for association analysis, and the relationship between them is unclear, sensitivity analysis and grey relational analysis were combined to analyze the influencing factors and value of influence. Sensitivity analysis is mainly used to obtain a data sequence of the factors and value of influence. Grey relational analysis is mainly used to evaluate the ranking of the factors in their degree of correlation.

2.2. The Values of Evaluation Indicators and Influential Factors

2.2.1. The Values of Evaluation Indicators

(1)
Average number of stops
This refers to the number of stops made by vehicles passing through the green wave on a road in a coordinated direction. The value is denoted by “S” and is measured as number of stops/vehicle. The average number of stops was selected as the evaluation indicator to reflect the coordination effect of green wave control [6].
(2)
Average travel time
This refers to the time taken by vehicles to pass through the green wave in a coordinated direction. The value is denoted by “T” and is measured in hours/vehicle. The average travel time is selected as the evaluation indicator to reflect the traffic efficiency of the green wave [19].
(3)
Average delay
This refers to the time lost by vehicles while passing through signalized intersections on the green wave road. The value is denoted by “D” and is measured as s/pcu. The average delay is selected as the evaluation indicator to reflect the traffic benefit of the green wave [19].
S, T, and D can be obtained through Vissim simulation [14].
We needed to calculate the value of influence E based on S, T, and D data on the three indicators above to facilitate subsequent association analysis. The smaller the E, the smaller the influence on the operational effect of the green wave. This implied a better operational effect of the green wave. The E is calculated as follows.
We used Equations (1)–(3) to process the Sij, Tij and Dij data relating to the S, T, and D to obtain non-dimensional S′ij, T′ij and D′ij data. Then, the Eij of E was calculated using Equation (4):
S i j = S i j S ¯ ,
T i j = T i j T ¯ ,
D i j = D i j D ¯ ,
E i j = S i j ω S + T i j ω T + D i j ω D ,
where i indicates that there are multiple influential factors, and j indicates that each influential factors has multiple values. S ¯ , T ¯ and D ¯ are the average values of S, T and D, and ω S , ω T and ω D are the weights of S, T and D, which was set to 1/3 to ensure simplicity of calculation. The range for value of influence E is (0, +∞).

2.2.2. The Values of Influential Factors

(1)
Design speed of the green wave
This refers to the optimal design speed of the vehicle starting from the starting intersection to ensure that it encountered a green light when arriving at the next intersection. The value is denoted by “V” and is generally in the range of 50–55 km/h [20]. We thus regard it as a factor influencing the operational effect of the green wave from the perspective of scheme optimization. Correspondingly, the value of i is 1, indicating the first influencing factors.
(2)
Signal timing scheme
The signal timing scheme includes a signal cycle, phase, and running time for each phase [21]. We thus regarded it as a factor influencing the operational effect of the green wave from the perspective of scheme optimization. To simplify the calculation, we used the signal cycle for quantitative analysis. The value was denoted by “C”, unit: s. Correspondingly, the value of i was 2, indicating the second influencing factors.
(3)
Pedestrian crossing
This refers to the behavior of pedestrians crossing the street at a non-signal crosswalk [22,23], which easily causes interference to vehicles on the green wave road, resulting in a reduction in speed. We thus regarded it as a factor influencing the operational effect of the green wave from the perspective of traffic management. We calculated the number of interferences caused by pedestrian crossing for quantitative analysis. The value is denoted by “L”, unit: times. Correspondingly, the value of i was 3, indicating the third influencing factors.
L was calculated as follows:
① The pedestrian flow Pm through the zebra crossing of the non-signal crosswalk m was calculated during the studied cycle. The number of interferences Lm of non-signal crosswalk m was calculated according to Equation (5).
L m = k P m ,
where Pm is the flow of pedestrians crossing the non-signal crosswalk m; k is the ratio of influence that can be determined by calculating the mean of the ratio of actual interference to vehicles due to pedestrian crossings to the flow of pedestrians during the observation cycle.
② The average number of interferences L due to all non-signal crosswalks using Equation (6) was calculated:
L = m = 1 n L m ω m ,
where ω m is the weight of the mth non-signal crosswalk.
(4)
Heavy vehicle traffic
Heavy vehicles travel at a slow speed, occupy adjacent lanes, and thus interfere with the normal movement of other vehicles [24]. They also affect the speed of traffic on the green wave road by increasing the number of stops and the average travel time. We thus regarded it as a factor influencing the operational effect of the green wave from the perspective of traffic management. We calculated the ratio of heavy vehicles on the road for quantitative analysis. The value is denoted by “H”, unit: %. Correspondingly, the value of i was 4, indicating the fourth influential factors.
H was calculated as follows:
① The number of heavy vehicles QnH and the total number of vehicles Qn entering the upstream intersection of the road n in the studied cycle were obtained. Equation (7) was then used to compute the ratio Hn of heavy vehicles on road n.
H n = Q n H Q n ,
where QnH and Qn are the number of heavy vehicles and the total number of vehicles on road n, respectively.
② The length ln of each road was taken as the weight, and the ratio H of heavy vehicles on the entire studied road was then calculated according to Equation (8):
H = n = 1 N l n l H n ,
where l is the total length of the studied road and ln is the length of the nth road.

2.3. Association Analysis of Evaluation Indicators and Influential Factors

2.3.1. Sensitivity Analysis of Influential Factors and Value of Influence

Sensitivity analysis is a method to measure the degree of influence of parameters on a system and can be divided into single-factor and multi-factor sensitivity analysis. Single-factor analysis refers to the technique in which the value of one uncertain factor is changed within a specific range at a given time while other factors are kept fixed, and then changes in the corresponding model are examined [25,26]. Single-factor sensitivity analysis, on the one hand, is an effective numerical processing method that can be used to obtain a data sequence of influential factors and the value of influence. On the other hand, by adjusting each influencing factor one by one, observing its impact on the value of influence can help determine which factors have a greater impact on the value of influence. Therefore, based on the theory of this method, the influencing factors of the operational effect of the green wave are taken as uncertain factors. The value of influence reflects the behavior characteristics of the system. A single-factor sensitivity analysis is proposed to calculate the values of influencing factors and value of influence. Specific analysis methods are as follows:
We used the value of influence as the index of sensitivity analysis and used influencing factors as the uncertain factors. The actual values of the design speed, signal timing, pedestrian crossing, and heavy vehicles were used as benchmark values to set the variation range in their values, as shown in Equations (9)–(12):
V j V 0 Δ V , V 0 + Δ V ,
C j C 0 Δ C , C 0 + Δ C ,
L j L 0 Δ L , L 0 + Δ L ,
H j H 0 Δ H , H 0 + Δ H ,
among these, V0, C0, L0, and H0, respectively, represent the actual values of V, C, L, and H; Vj, Cj, Lj, and Hj, respectively, represent the jth value of V, C, L, and H; and j values generally range from 1 to 5; that is, j = 1, 2, 3, 4, 5 [25,26], and Δ V, Δ C, Δ L, and Δ H, respectively, represent the variations of V, C, L, and H.
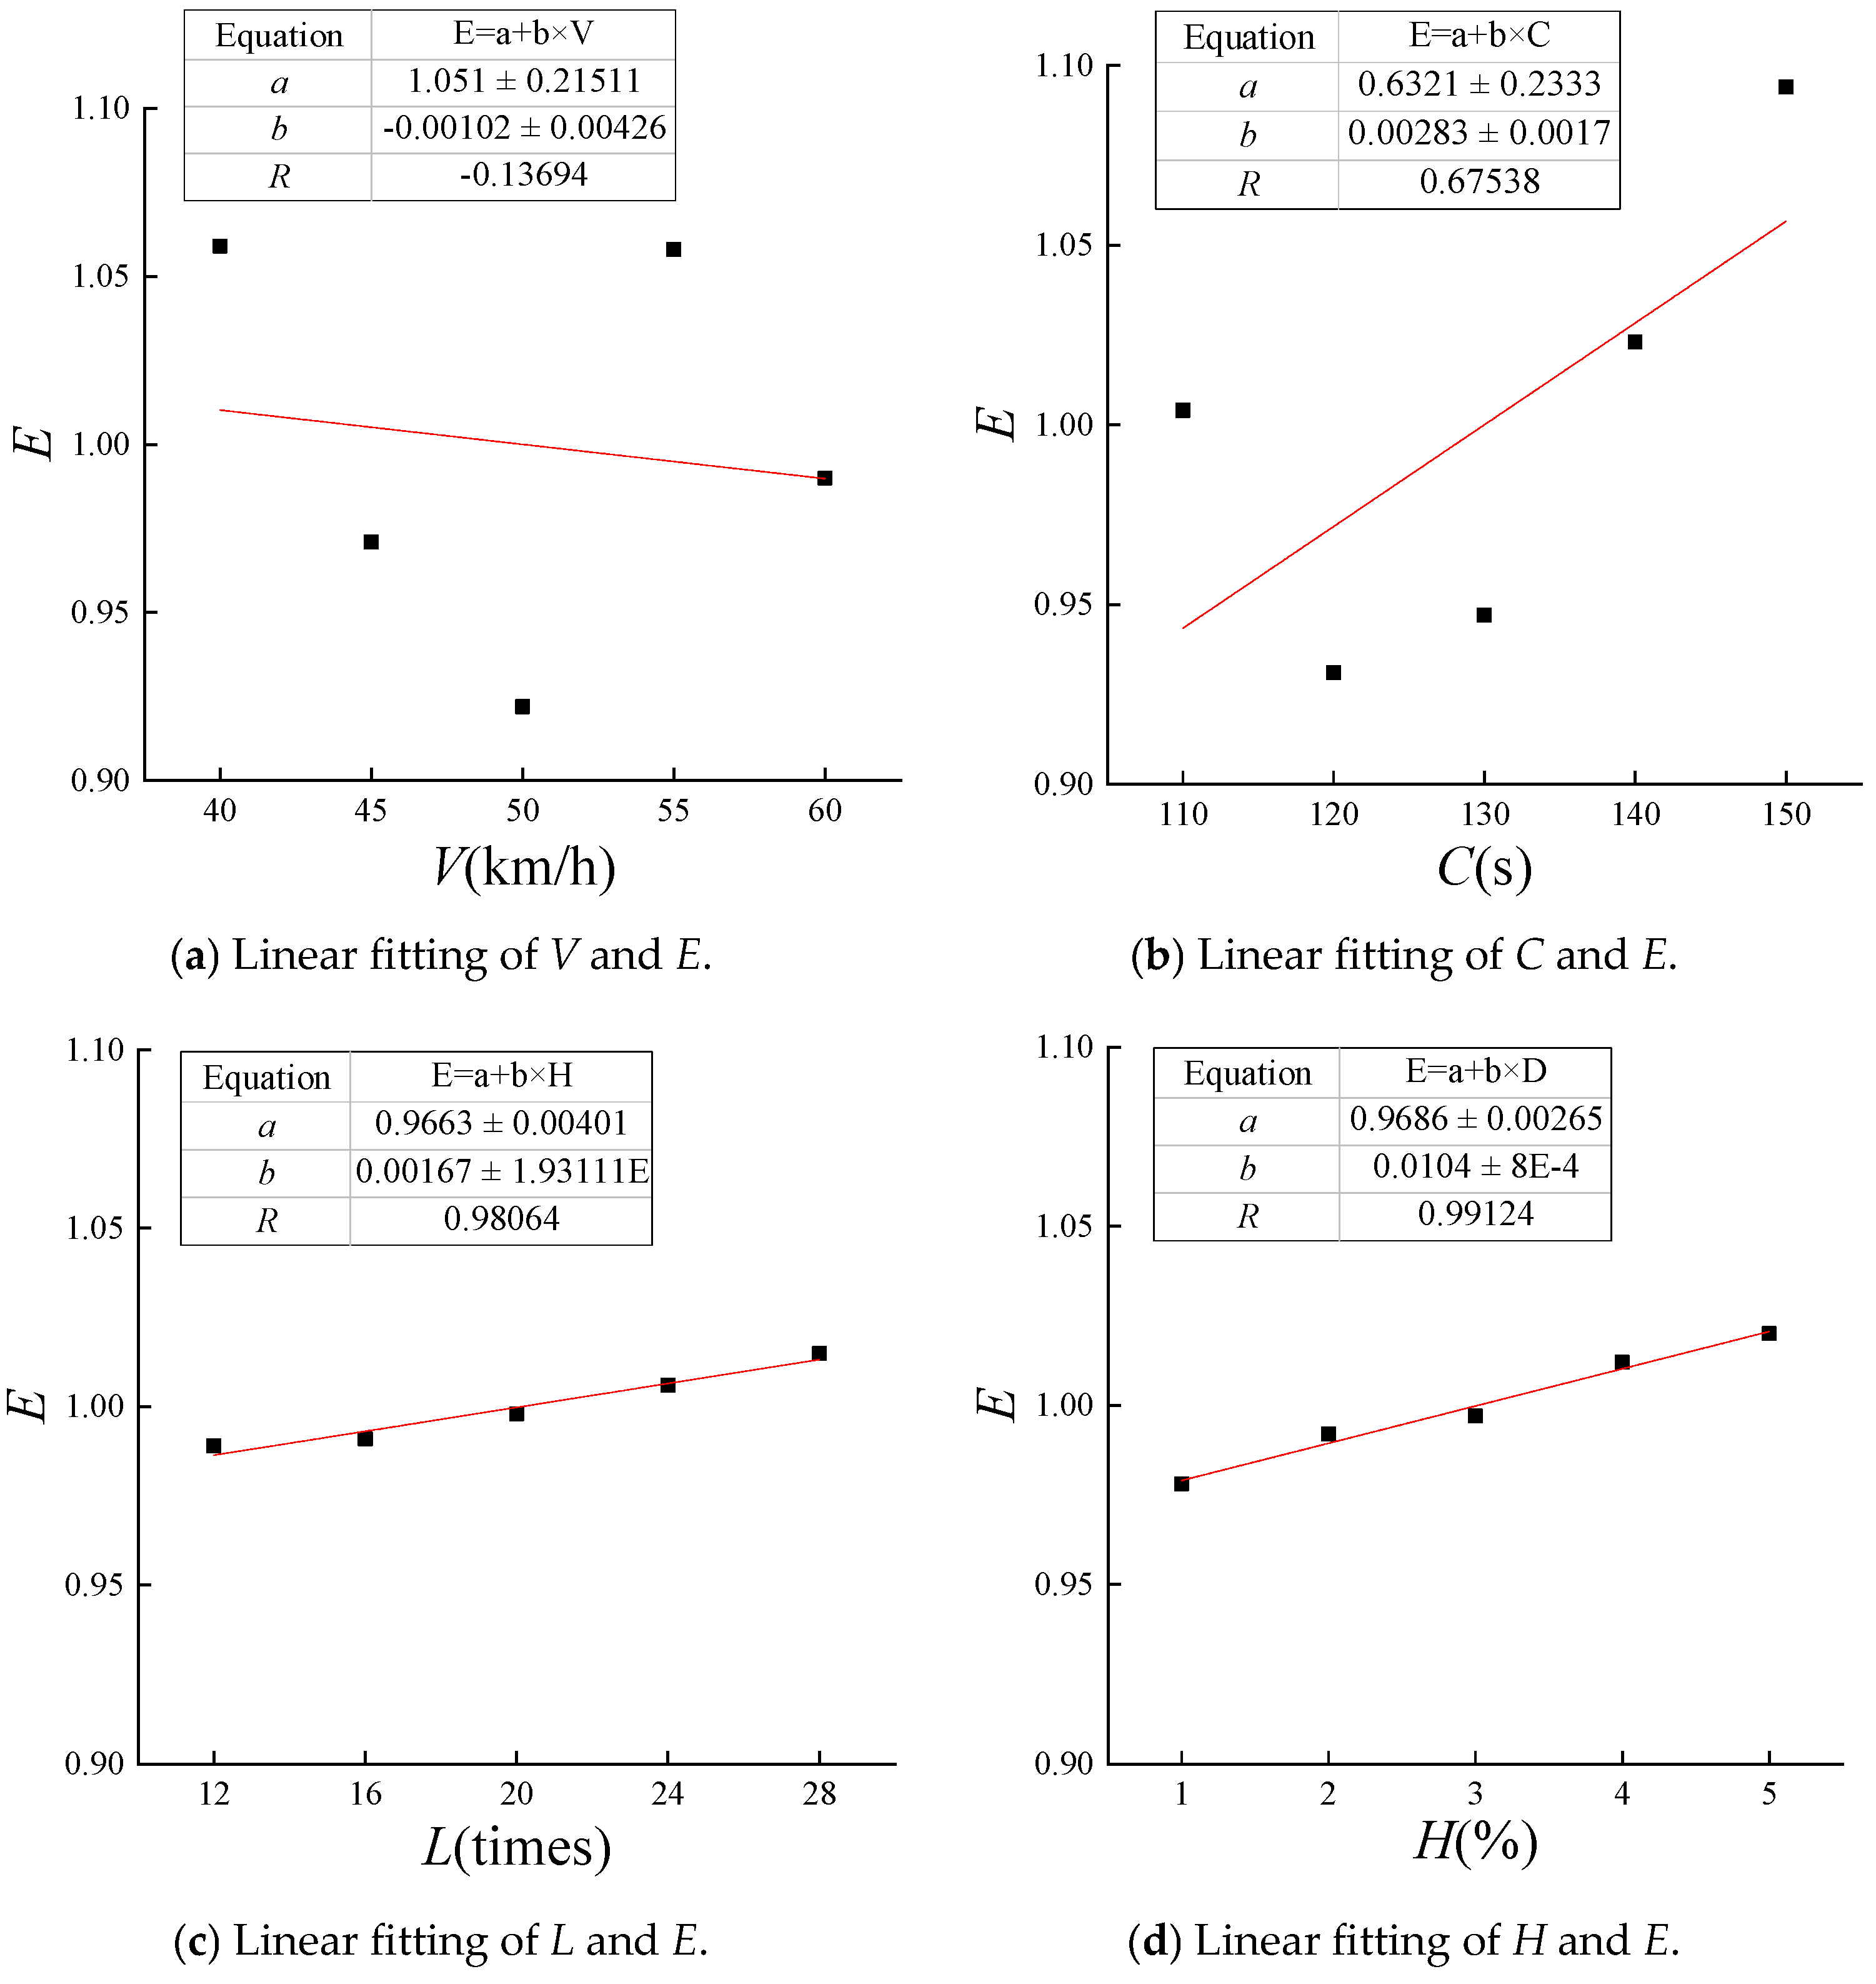
Under the premise that the benchmark values of other uncertain factors are taken, 5 different values of an uncertain factor are taken within its variation range, and the corresponding values of influence are calculated, respectively. For example, the values of C, L, and H are C0, L0, and H0, respectively, and the values of V are Vj (j = 1, 2, 3, 4, 5). V is the first influencing factor, so the value of i is 1. The Vissim simulation software is used to output the values of S1j, T1j and D1j corresponding to S, T, and D, and then Eij of E is calculated by Equations (1)–(4). After all the numerical Eij of E is calculated, the effects of V, C, L, and H on E are further analyzed by simple regression analysis. Origin software can be used to draw the diagram of the linear fitting of V, C, L, H and E, respectively. If the correlation coefficients R of V, C, L, H and E pass the test, V, C, L, H and E are obviously shown to be correlated; otherwise, there is no correlation.

2.3.2. Grey Relational Analysis of Influential Factors and Value of Influence

Grey relational analysis is used to measure the degree of correlation of factors, and it determines whether the reference and comparison sequences are closely related by determining the degree of geometric similarity between them. The more similar their geometric shapes, the greater the degree of correlation between them [25]. It is defined as: a certain parameter Yi is the target parameter, and the values Yij on its sequence constitute a reference sequence, denoted as Y = {Yij}. The values Xij of the influence parameters Xi on the same sequence form the comparison sequence, denoted X = {Xij} [27,28,29]. Grey relational analysis does not need to make explicit assumptions about the linear or correlation relationship between evaluation indicators and influencing factors. The degree of correlation can be calculated between different factors and the operational effect of the green wave. Therefore, by referring to the theory of this method, we constructed the associated data sequence of the influencing factors and value of influence. The method of grey correlation analysis of factors and value of influence is proposed to evaluate the ranking of influential factors in degree of correlation. Specific analysis methods are as follows:
The V, C, L, and H are taken as the comparison sequence X, as shown in Equation (13):
X = X 1 X 4 = x 11 x 15 x i j x 41 x 45 = V C L H =   V 1 V 2 V 3 V 4 V 5   C 1 C 2 C 3 C 4 C 5   L 1 L 2   L 3 L 4 L 5 H 1 H 2 H 3 H 4 H 5 ,
where xij is the jth value of the ith influential factor; the value of i ranges from 1 to 4; and the value of j ranges from 1 to 5.
The E is taken as the reference sequence Y, as shown in Equation (14):
Y = Y 1 Y 4 = y 11 y 15 y i j y 41 y 45 = E 1 E 4 =   E 11 E 12 E 13 E 14 E 15   E 21 E 22 E 23 E 24 E 25   E 31 E 32 E 33 E 34 E 35   E 41 E 42 E 43 E 44 E 45 ,
where yij is the jth value of influence corresponding to the ith influential factor.
Because the dimensions and values of V, C, L, and H are different such that they cannot be directly compared, xij and yij are standardized according to Equations (15) and (16) to form x′ij and y′ij:
x i j = x i j m i n x i j m a x x i j m i n x i j ,
y i j = y i j m i n y i j m a x y i j m i n y i j .
Equation (17) was used to calculate the absolute differences in the values of x′ij and y′ij to form a difference matrix Δij:
Δ i j = x i j y i j .
Equations (18) and (19) eliminate the maximum and minimum values from the difference matrix, respectively.
Δ m a x = m a x Δ i j ,
Δ m i n = m i n Δ i j .
The difference matrix was used to calculate the correlation coefficients lij from Equation (20). Then Equation (21) was used to form the sequence of correlation coefficients L:
l i j = Δ m i n + ρ Δ m a x Δ i j + ρ Δ m a x ,
L = l i j ,
where ρ is the coefficient of resolution, 0 < ρ < 1. The smaller the ρ, the greater the difference between correlation coefficient and another correlation coefficient, and the stronger is their capability of discrimination. In general, ρ is 0.5.
The degree of correlation Qi is calculated from Equation (22):
Q i = 1 n j = 1 n l i j ,
where Qi is the change in the interval [0, 1]. The closer Qi is to 1, the stronger the correlation. The closer Qi is to 0, the worse the correlation. According to the value of Qi, the influencing factors can be divided into three levels. If Qi is greater than 0.7, the corresponding ith influential factor is important; if Qi is between 0.5 and 0.7, the ith influencing factor is relatively important; if Qi is less than 0.5, the ith influencing factor is not important [30].

3. Results

As a national hub and an important node transportation corridor in China, Wuhu City widely uses green wave control technology on its arterial roads [31]. We chose Eshan Road in Wuhu City, as the green wave road for our case study. As shown in Figure 2, it is an arterial road with a coordinated direction from east to west for a total length of 5.8 km. It has six signalized intersections and three non-signaled crosswalks. We numbered the six intersections from west to east as 1, 2, 3, 4, 5, and 6 and the three non-signaled crosswalks as 7, 8, and 9. We used traffic data on a working day (21 September 2020) during the peak cycle (8:30–9:30) for calculation and analysis.

3.1. Data

We used bayonets and other equipment, installed by the municipal traffic management department to collect traffic data on arterial roads in the presence of the green wave and stored it in a database, which provided data support for the research and case verification.

3.1.1. Original Datasets

The first original datasets used here consisted of data collected by the bayonet equipment at major road intersections. Some of the data are shown in Table 1. The license plate information of the vehicles was concealed with “*”.
The second original dataset contained information on the canalization of the intersections and schemes of green wave control obtained from the local traffic police department and Baidu maps. Some of them are shown in Table 2.
The third original dataset contained information on the roads, and was obtained from Wuhu’s traffic police department. Some of them are shown in Table 3.

3.1.2. Data Matching

The first, second, and third original datasets were matched by the field “number of intersections” to obtain data on the trajectories of the vehicles. We then processed and cleaned the data to remove erroneous information and obtained information on the trajectories of vehicles for analysis. Some of the data are shown in Table 4.
We used the above data on the trajectories of vehicles to calculate the total flow through this section, and the ratios of heavy and light vehicles. The recorded times on the trajectories of the vehicles were then used to calculate the interval during which each passed through the green wave. This was used in turn along with the length of the road to obtain the average speeds of heavy and light vehicles. These data provide an important basis for the simulation and association analysis of traffic.

3.2. Association Analysis

3.2.1. Sensitivity Analysis

According to the data in Table 2, V0 = 50 km/h and C0 = 130 s.
The data required for L were obtained from the data in Table 3, and are shown in Table 5. We observed the three non-signaled crosswalks to calculate the average ratio between the actual number of interferences caused by pedestrians crossing the street and the flow of pedestrian in 15 min units at 20%, i.e., k = 20%.
The data required for H were drawn from the data in Table 4, and their results are shown in Table 6.
Following this, we used Equations (5)–(8) to determine that L0 = 20 times and H0 = 3%.
Given V0, C0, L0, and H0, we used the steps provided in Section 2.3 to determine Vj, Cj, Lj, and Hj; j = 1, 2, 3, 4, 5; and we formulated 20 schemes. They are denoted by A1–A5, B1–B5, C1–C5, and D1–D5, and are shown in Table 7.
The schemes for green wave control were calculated using a commonly applied graphic-based method [7,11]. When C0 = 130 s, the schemes corresponding to the range of V of 40–60 km/h are shown in Table 8. When V0 = 50 km/h, the schemes corresponding to the range of C of 110–150 s are shown in Table 9. The bandwidths in Table 8 and Table 9 are the average values of the bandwidths from east to west and west to east, respectively.
Single-factor sensitivity analysis was adopted; that is, the value of certain influencing factors changed with the scheme, and the actual value of other factors was adopted (in Table 7). Traffic data are shown in Table 10. The speeds of heavy and light vehicles were assumed to be 35 and 50 km/h, respectively. Through the Vissim simulation software, S, T, and D were output. Then, the E was calculated by Equations (1)–(4). The results are shown in Table 11.
Simple regression analysis was conducted on V, C, L, H, and E in Table 11. Origin software was used to draw a diagram of the linear fitting of V, C, L, H, and E. The results are depicted in Figure 3.
Figure 3a,b shows that the correlation coefficients R of the diagram of linear fitting corresponding to V, C, and E were −0.137 and 0.675, respectively. When the number of observed data items was n = 5, Rn-2 = 0.878 was obtained by querying the test table of correlation coefficients [32]. Because the absolute values of R were smaller than for Rn-2, no significant linear correlation was obtained among design speed, signal timing, or their values of influence. When V = 50 km/h, E was at a minimum, as shown in Figure 3a, and had its minimum value when C = 120 s as shown in Figure 3b.
Figure 3c,d shows that the correlation coefficients R of L, H, and E were 0.981 and 0.991, respectively. Because the absolute values of R were greater than Rn-2, pedestrian crossing and heavy vehicle travel significantly correlated positively with the value of influence. That is, as L and H increased, E gradually increased. This correlation was stronger for heavy vehicle traffic.

3.2.2. Grey Relational Analysis

We used Equation (13) to form the comparison sequence X as follows:
X = V C L H =   40     45     50     55     60 110 120 130 140 150   12   16     20     24     28 1         2         3         4         5 .
We also used Equation (14) to form the reference sequence Y as follows:
Y = E 1 E 2 E 3 E 4 = 1.059 0.971 0.922 1.058 0.990 1.004 0.931 0.947 1.023 1.094 0.989 0.991 0.998 1.006 1.015 0.978 0.992 0.997 1.012 1.020 .
Normalization was carried out through Equations (15) and (16), and the difference matrix was then obtained through Equation (17):
Δ = 1.000 0.105 0.500 0.239 0.500 0.446 0.250 0.405 0.187 0.000 0.000 0.179 0.151 0.093 0.000 0.000 0.089 0.043 0.065 0.000 .
We also used Equations (18)–(21) to obtain the sequence of correlation coefficients L as follows:
L = 0.333 0.827 0.500 0.677 0.500 0.528 0.667 0.553 0.728 1.000 1.000 0.736 0.768 0.844 1.000 1.000 0.848 0.921 0.885 1.000 .
Finally, we used Equation (22) to calculate the degrees of correlation as QV = 0.567, QC = 0.695, QL = 0.870, and QH = 0.931. They were thus ranked as QH > QL > QC > QV.
The above results showed that QL and QH were higher than 0.7. They were thus important factors affecting the operational effect of the green wave that should be prioritized when formulating optimization measures. The QV and QC were 0.5–0.7, and thus they were relatively important factors in the optimization. Therefore, measures to optimize the green wave should start from two perspectives: appropriately restricting heavy vehicle traffic and pedestrian crossings in the context of traffic management, and optimizing signal timing and design speed to improve the operational effect.

3.3. Simulation-Based Verification

We designed four simulation-based schemes of verification to test the validity of the results of the above analysis. The results were used to verify the effect of the optimization and formulate optimal measures.
Scheme 1: No optimization measure was implemented. This was the control scheme.
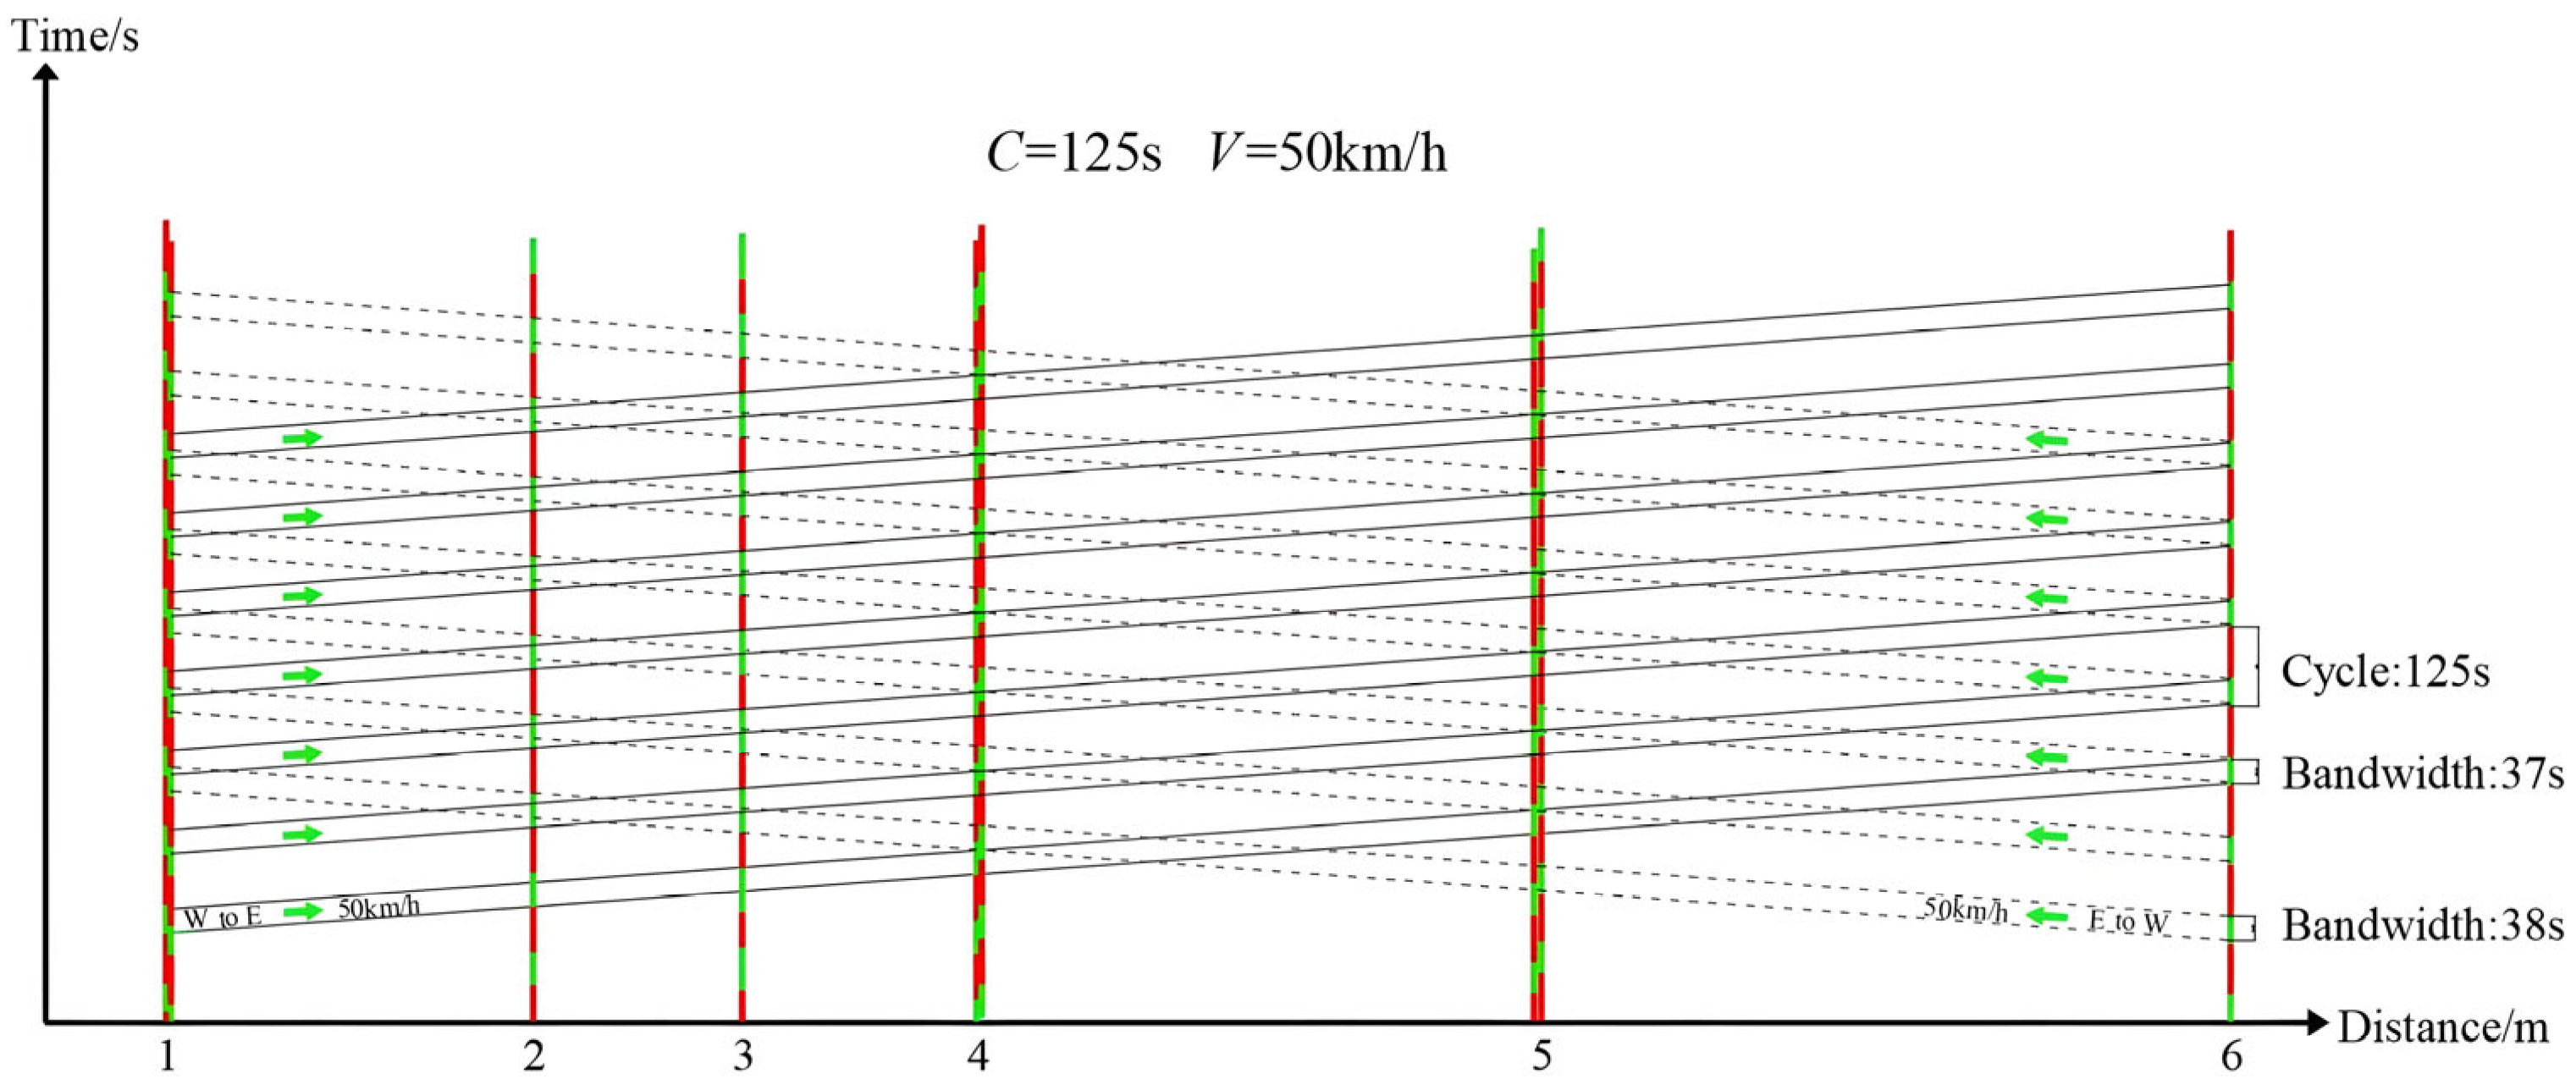
Scheme 2: We optimized signal timing and design speed (scheme optimization). Webster’s method [33] was used to optimize the scheme for signal timing at the key intersection, and the optimal cycle was calculated to be 125 s. We analyzed the trajectory and bandwidth at different design speeds, and obtained an optimal design speed of 50 km/h. The optimal schemes for green wave control were calculated and represented graphically [7,11], as shown in Table 12. The time–distance diagram is shown in Figure 4.
Scheme 3: Limiting heavy vehicle traffic and pedestrian crossing (traffic management). This involved restricting heavy vehicles on the road through detours. The zebra crossing was eliminated to isolate the road.
Scheme 4: This involved optimizing the signal timing and design speed on the premise of limiting heavy vehicle traffic and pedestrian crossing. That is, we adopted the measures of Schemes 2 and 3 for the overall optimization of the system.
The S, T, and D were output by Vissim software according to the above four schemes, and the E was calculated according to Equations (1–4). The schemes and their results are shown in Table 13.
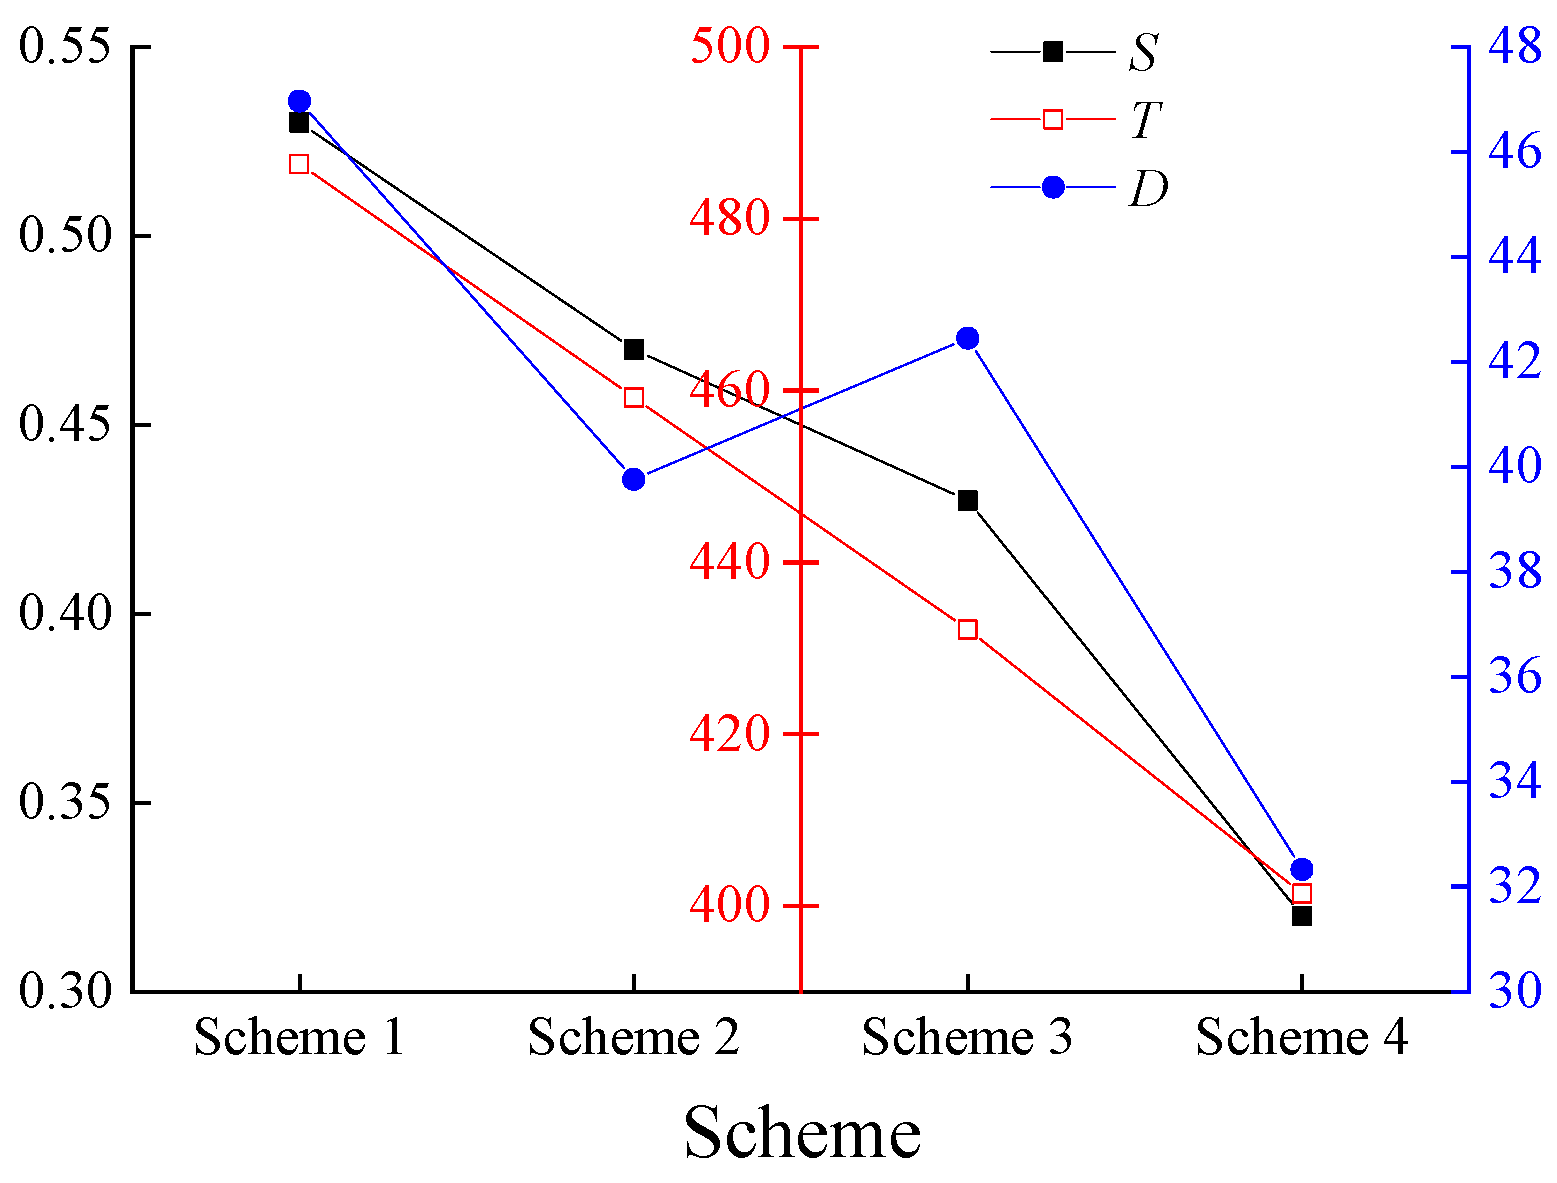
The S, T, D, and E of the different schemes were compared as shown in Figure 5 and Figure 6.
Figure 5 and Figure 6 show that compared with Scheme 1, the average number of stops in Scheme 2 was smaller by 11.3%; the average travel time was shorter by 5.6%; the average delay was shorter by 15.4%; and the value of influence was smaller by 10.9%. The average number of stops in Scheme 3 was smaller by 18.9%; the average travel time was shorter by 11.1%; the average delay by 9.6%; and the value of influence decreased by 13.3% compared with Scheme 1. The average number of stops in Scheme 4 was smaller by 39.6%; the average travel time was shorter by 17.5%; the average delay by 31.2%; and the value of influence decreased by 29.8%.

4. Discussion

4.1. Identification of Influential Factors

A sensitivity analysis of the influential factors on the green wave road in Wuhu City showed there was no significant linear correlation among design speed, signal timing, and value of influence. When V = 50 km/h and C = 120 s, E was at a minimum, as shown in Figure 3a,b. This shows that both the design speed and the signal timing needed to be optimal for the green wave to perform well. There is more support for this view in the literature. For example, Tajalli et al. claimed that jointly optimizing the signal timing and the design speed of the green wave road significantly reduced traffic congestion [34]. However, the degrees of correlation of V, C, and E calculated by using grey relational analysis were 0.567 and 0.695, respectively. This showed that they are important factors influencing the operational effect of the green wave but not the most critical ones. That is, optimizing the scheme may not be the major means of ensuring the operational efficiency of the green wave. The correlation coefficients corresponding to L, H, and E were 0.981 and 0.991, respectively. This shows that they significantly correlated positively, and heavy vehicle traffic was more relevant to the green wave. Figure 3c,d show that E increased with L and H. This showed that the greater L and H, the greater the interference to the operational effect of the green wave. This was also supported by some studies. For example, Ci et al. claimed that pedestrian crossing is one of the most important factors influencing delays at intersections [23]. Ghanim et al. claimed that heavy vehicles occupied more space on the road and affected the speed of vehicles behind them [24]. The results of grey relational analysis showed that the degrees of correlation of L, H, and E were 0.870 and 0.931, respectively. This showed that pedestrian crossing and heavy vehicle travel influenced the operational effect of the green wave, and the latter was the most critical factor. Therefore, optimizing management may be the major means of ensuring operational efficiency of the green wave. This is also a new point of view put forward in this paper.

4.2. Effect of Different Optimization Measuress

To verify the validity of the results of identifying the factors influencing the operational effect of the green wave, we used four schemes and tested them by using simulations. Scheme 1 was the control scheme without any optimization. Scheme 2 optimized signal timing and design speed. Compared with Scheme 1, the average delay decreased to 15.4%. This indicated that the average delay was reduced by optimizing signal timing and design speed in the scheme used to control the green wave. This finding supported the view of Zhang et al.; that is, optimizing the signal cycle at each intersection of the green wave on arterial roads reduced overall delay [35]. Compared with Scheme 1, the average number of stops and average travel time in Scheme 3 decreased by 18.9 and 11.1%, respectively, showing that in the context of traffic management, reducing the ratio of heavy vehicles and pedestrian crossings reduced the average number of stops and average travel time. This supported Shelmakov’s view that strengthening the management of road traffic and banning large vehicles can improve the efficiency of traffic at intersections [36]. Scheme 4 optimized both the factors related to traffic management and those related to the optimization of schemes for green wave control. Compared with Scheme 1, the three evaluation indicators underwent the largest decline in Scheme 4: 39.6, 17.5, and 31.2%. This showed that the combined optimization of the scheme for green wave control and traffic management yielded the best results.
Further comparisons of the reduction in the values of influence of Scheme 2, 3, and 4 showed that Scheme 2 underwent the smallest decrease, 10.9%. Because there was no clear linear correlation among design speed, signal timing and value of influence, improving overall efficiency in this case depended on finding the optimal scheme for green wave control. Improvements to the operational effect of the green wave are thus limited. Scheme 3 recorded the second-smallest reduction in its value of influence, 13.3%. This is because pedestrian crossings, heavy vehicle traffic, and the value of influence correlated positively. This meant that such measures of traffic management as limiting pedestrian crossings and heavy vehicles can help improve the operational effect of the green wave. Scheme 4 recorded the largest decrease in the value of influence, 29.8%. This was larger than the sum of reductions recorded by Schemes 2 and 3 (24.2%) and indicated that optimizing schemes for green wave control under the premise of implementing measures of traffic management can significantly improve the operational effect of the green wave.

5. Conclusions

In this study, we made breakthroughs in optimizing and evaluating schemes of green wave control. Representative evaluation indicators and influencing factors were selected, and a sensitivity analysis and grey relational analysis were combined to conduct innovative research into methods to identify the factors influencing the operational effect of the green wave, for which we collected data on traffic on Eshan Road in Wuhu City. Following this, we proposed different methods of optimization and verified their effects through simulations in Vissim software. The results showed a significant positive correlation among pedestrian crossings, heavy vehicle traffic, and the value of influence. These are important factors influencing the operational effect of the green wave; however, there was no prominent linear correlation among design speed, signal timing, and value of influence. Through this study, it was found that measures related to traffic management may be more effective in improving the effect of the green wave than relying solely on optimizing the scheme for green wave control. Additionally, optimizing schemes for green wave control under the premise of implementing measures related to traffic management significantly improved the operational effect.
The significance of this paper is that it provides an effective method to identify factors influencing the operational effect of the green wave. It also provides feasible measures for improving its operational effect, which is important for improving traffic efficiency on arterial roads by guiding urban traffic management. Due to limitations imposed by the collected data, we selected representative evaluation indicators and influencing factors based on conventional analysis. In addition, only data on the traffic on a specific green wave road were used, which hindered generalizing the results of this study to green wave control at large. Especially in the analysis of the influencing factors, signal timing is a complex factor. How to carry out correlation analysis of influencing factors through traffic data of multiple green wave roads to determine their degree of influence under different conditions, is the next research work to be carried out.

Author Contributions

Conceptualization, Z.L. and X.Z.; methodology, Z.L.; software, R.W.; validation, Z.L., X.Z. and R.W.; formal analysis, X.Z.; investigation, Z.L.; resources, Z.L.; data curation, Y.L.; writing—original draft preparation, X.Z.; writing—review and editing, Z.L.; visualization, Y.X.; supervision, Z.L.; project administration, Y.X.; funding acquisition, Z.L. All authors have read and agreed to the published version of the manuscript.

Funding

This work was supported by the General Project of Anhui Natural Science Foundation in 2022 (grant no. 2208085ME147), 2022 Provincial Quality Engineering Project for Universities (grant no. 2022xjzlts035) and Hefei University Postgraduate Cooperative Education Base Project (grant no. 2021Yjyxm07).

Data Availability Statement

The data used to support the findings of this study are available from the corresponding author upon request.

Conflicts of Interest

The authors declare no conflict of interest.

References

  1. Ma, C.; He, R. Green wave traffic control system optimization based on adaptive genetic-artificial fish swarm algorithm. Neural Comput. Appl. 2019, 31, 2073–2083. [Google Scholar] [CrossRef]
  2. Lu, K.; Tian, X.; Jiang, S.; Xu, J.; Wang, Y. Optimization model for regional green wave coordinated control based on ring-and-barrier structure. J. Intell. Transp. Syst. 2022, 26, 68–80. [Google Scholar] [CrossRef]
  3. Yao, J.; Tang, Q.; Wang, P. A Multiroute Signal Control Model considering Coordination Rate of Green Bandwidth. J. Adv. Transp. 2021, 2021, e4310403. [Google Scholar] [CrossRef]
  4. Qu, D.Y.; Wan, M.F.; Wang, Z.L.; Xu, X.H.; Wang, J.Z. Green Wave Coordinate Control Method for Arterial Traffic Based on Traffic Wave Theory. J. Highw. Transp. Res. Dev. 2017, 11, 4. [Google Scholar] [CrossRef]
  5. Guo, H.Y.; Wang, J.S. Coordinated control and evaluation of traffic trunk lines. Shandong Jiaotong Keji 2021, 4, 102–105. [Google Scholar]
  6. Lin, Q.H.; Sun, X.F.; Hong, W.T. On the Control Effect Evaluation of Green Wave Coordination System of Urban Arteries. Munic. Eng. Technol. 2020, 38, 36–39. [Google Scholar] [CrossRef]
  7. Ji, L.; Cheng, W. Method of Bidirectional Green Wave Coordinated Control for Arterials under Asymmetric Release Mode. Electronics 2022, 11, 2846. [Google Scholar] [CrossRef]
  8. Zhang, J.; Zhang, J.; Zhu, Q.; Luo, Y.; Lv, F.; Gao, H. Optimization of Trunk Phase Difference for Seeking Maximum Bidirectional Green Wave Bandwidth. J. Phys. Conf. Ser. 2023, 2437, 012074. [Google Scholar] [CrossRef]
  9. Ma, Z.; Cui, T.; Deng, W.; Jiang, F.; Zhang, L. Adaptive Optimization of Traffic Signal Timing via Deep Reinforcement Learning. J. Adv. Transp. 2021, 2021, e6616702. [Google Scholar] [CrossRef]
  10. Chen, Z.M.; Liu, X.M.; Wu, W.X. Optimization Method of Intersection Signal Coordinated Control Based on Vehicle Actuated Model. Math. Probl. Eng. 2015, 2015, e749748. [Google Scholar] [CrossRef] [Green Version]
  11. Liang, Z.; Xiao, Y.; Flötteröd, Y.-P. An Overlapping Phase Approach to Optimize Bus Signal Priority Control under Two-Way Signal Coordination on Urban Arterials. J. Adv. Transp. 2021, 2021, e6624130. [Google Scholar] [CrossRef]
  12. Yu, L.; Hu, X. Study on control and optimization algorithm of dynamic green wave used in city traffic intelligent control. J. Intell. Fuzzy Syst. 2018, 35, 2785–2792. [Google Scholar] [CrossRef]
  13. Zheng, Y.; Guo, R.; Ma, D.; Zhao, Z.; Li, X. A Novel Approach to Coordinating Green Wave System With Adaptation Evolutionary Strategy. IEEE Access 2020, 8, 214115–214127. [Google Scholar] [CrossRef]
  14. Liu, X.M.; Wei, X.D.; Dong, L.X.; Shang, C.L. Evaluation of green wave coordinated control effect of trunk line based on vehicle trajectory data. J. Guilin Univ. Technol. 2022, 1, 1–11. [Google Scholar]
  15. Tian, Z.; Ohene, F.; Hu, P. Arterial Performance Evaluation on an Adaptive Traffic Signal Control System. Procedia-Soc. Behav. Sci. 2011, 16, 230–239. [Google Scholar] [CrossRef] [Green Version]
  16. Chia, I.; Wu, X.; Dhaliwal, S.S.; Thai, J.; Jia, X. Evaluation of Actuated, Coordinated, and Adaptive Signal Control Systems: A Case Study. J. Transp. Eng. Part A Syst. 2017, 143, 05017007. [Google Scholar] [CrossRef]
  17. Wang, H.; Miao, Q.; Zhang, Y.; Wen, X. Green Wave Zone Evaluation Method Based on Electronic Police Data. In Proceedings of the 2021 2nd International Conference on Big Data and Informatization Education (ICBDIE), Hangzhou, China, 2–4 April 2021; Volume 2021, pp. 155–158. [Google Scholar] [CrossRef]
  18. Ma, C.; Ao, G.C.; Shao, Y.M. Evaluation of Urban Arterial Road Traveling Efficiency in Signal Coordination Control. J. Transp. Inf. Saf. 2012, 30, 62–65. [Google Scholar]
  19. Zhuo, X.; Shi, W.R.; Qian, Z.D. Traffic evaluation method for urban arterial green wave coordination control system. J. Fuzhou Univ. Nat. Sci. Ed. 2015, 43, 369–376. [Google Scholar]
  20. Pan, Y.; Jia, S.P. A Two-way Green Wave Coordinated Control Model for Urban Arterial Line Considering Speed Fluctuation lnterval. Sci. Technol. Eng. 2019, 19, 336–342. [Google Scholar]
  21. Wang, Y.; Yang, X.; Liu, Y.; Liang, H. Evaluation and Application of Urban Traffic Signal Optimizing Control Strategy Based on Reinforcement Learning. J. Adv. Transp. 2018, 2018, e3631489. [Google Scholar] [CrossRef]
  22. Fan, Z.D.; LI, M.L.; Ran, J.; Zhang, Y. Construction of vehicle speed prediction model based on lateral interference degree and number of traffic accidents. Highw. Automot. Appl. 2021, 2, 34–36+42. [Google Scholar]
  23. Ci, Y.S.; Zheng, S.N.; Zhao, H.T. Empirical model of road segment vehicle delay based on numerical distribution of pedestrians’ crossing. J. Chongqing Jiaotong Univ. Nat. Sci. 2018, 37, 76–80. [Google Scholar]
  24. Ghanim, M.S.; Abu-Lebdeh, G. Characterization of heavy vehicle headways in oversaturated interrupted conditions: Towards development of passenger car equivalency factors. Int. J. Transp. Sci. Technol. 2019, 11, 589–602. [Google Scholar] [CrossRef]
  25. Miqdady, T.; de Oña, R.; de Oña, J. Traffic Safety Sensitivity Analysis of Parameters Used for Connected and Autonomous Vehicle Calibration. Sustainability 2023, 15, 9990. [Google Scholar] [CrossRef]
  26. Bouadi, M.; Jia, B.; Jiang, R.; Li, X.; Gao, Z. Optimizing sensitivity parameters of automated driving vehicles in an open heterogeneous traffic flow system. Transp. A Transp. Sci. 2022, 18, 762–806. [Google Scholar] [CrossRef]
  27. Wu, B.; Wang, X.Y.; Liu, T.; Dong, N.B.; Zhang, J.X.; Zhang, P. Identification of Traffic Accidents Causation in Rural-urban Fringe Based on Correlation Analysis. J. Wuhan Univ. Technol. Transp. Sci. Eng. 2022, 46, 948–952. [Google Scholar]
  28. Canbulut, G.; Köse, E.; Arik, O.A. Public transportation vehicle selection by the grey relational analysis method. Public Transp. 2022, 14, 367–384. [Google Scholar] [CrossRef]
  29. Li, W.; Zhao, X.; Liu, S. Traffic Accident Prediction Based on Multivariable Grey Model. Information 2020, 11, 184. [Google Scholar] [CrossRef] [Green Version]
  30. Liu, Y.; Huang, X.; Duan, J.; Zhang, H. The assessment of traffic accident risk based on grey relational analysis and fuzzy comprehensive evaluation method. Nat. Hazards 2017, 88, 1409–1422. [Google Scholar] [CrossRef]
  31. Zhang, T.; Cao, Y.G.; Zhao, Y.; Lin, L.L. The design and innovation of elevated station in the middle of Wuhu rail transit project. Railw. Stand. Des. 2023, 67, 109–116. [Google Scholar] [CrossRef]
  32. Wang, S.X.; Qiao, P.; Zhang, Z.Z.; Tan, X.Q.; Zhu, P. Difference research in quota consumption based on regression analysis ression analysis. J. Transp. Sci. Eng. 2010, 26, 19–22. [Google Scholar] [CrossRef]
  33. Jia, H.; Lin, Y.; Luo, Q.; Li, Y.; Miao, H. Multi-objective optimization of urban road intersection signal timing based on particle swarm optimization algorithm. Adv. Mech. Eng. 2019, 11, 1687814019842498. [Google Scholar] [CrossRef] [Green Version]
  34. Tajalli, M.; Mehrabipour, M.; Hajbabaie, A. Network-Level Coordinated Speed Optimization and Traffic Light Control for Connected and Automated Vehicles. IEEE Trans. Intell. Transp. Syst. 2021, 22, 6748–6759. [Google Scholar] [CrossRef]
  35. Zhang, J.; Shang, H.; Li, X.; Yao, Y. An integrated arterial coordinated control model considering green wave on branch roads and pedestrian crossing time at intersections. J. Manag. Sci. Eng. 2020, 5, 303–317. [Google Scholar] [CrossRef]
  36. Shelmakov, S.V.; Grigoreva, T.U. Methodology and examples for assessing the environmental performance of certain road traffic management measures. IOP Conf. Ser. Mater. Sci. Eng. 2021, 1159, 012039. [Google Scholar] [CrossRef]
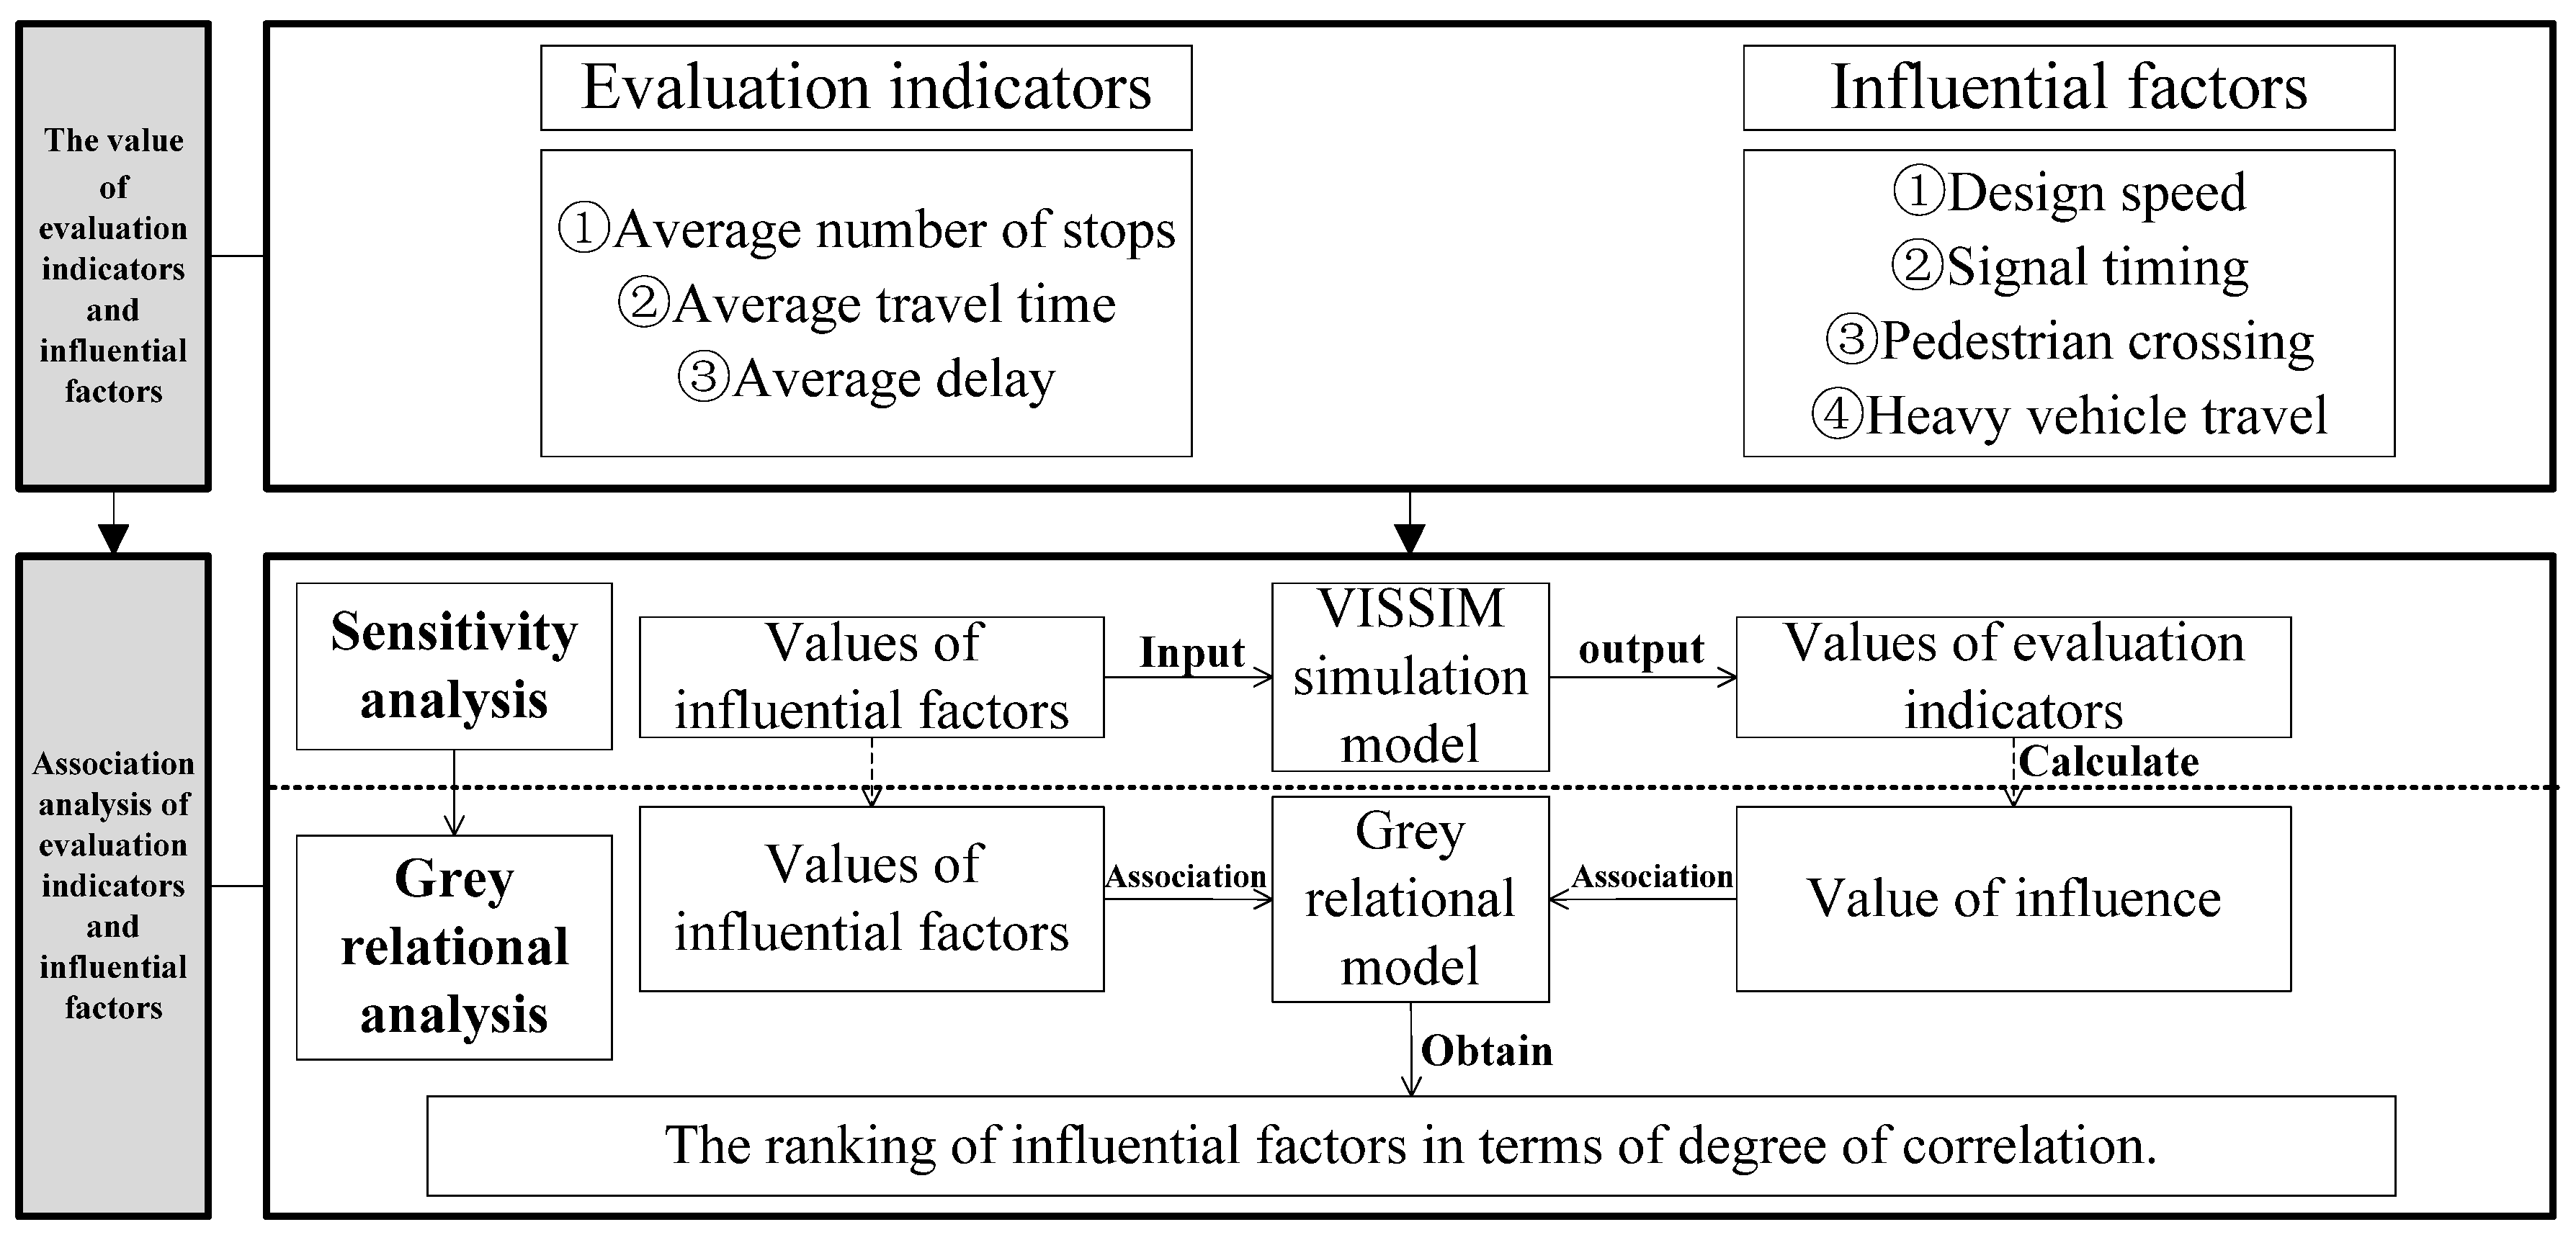
Figure 1. General idea.
Applsci 13 08372 g001
Figure 2. Eshan Road (from Changjiang Road to Jiuhua Road) in Wuhu City.
Applsci 13 08372 g002
Figure 3. Linear fitting of V, C, L, H, and E.
Applsci 13 08372 g003
Figure 4. Time–distance diagram.
Applsci 13 08372 g004
Figure 5. S, T, and D of different schemes.
Applsci 13 08372 g005
Figure 6. E of different schemes.
Applsci 13 08372 g006
Table 1. Bayonet data.
Intersection NumberDirectionLicense PlateVehicle TypesRecorded Time
1East *B2N13*Small vehicle2020/9/21 08:47
1West *A268H*Small vehicle2020/9/21 08:47
1South *B8549*Small vehicle2020/9/21 08:47
1North*A097A*Heavy vehicle2020/9/21 08:47
Table 2. Data on the canalization of the intersections and schemes of green wave control.
Intersection NumberIntersection CanalizationGreen Wave Schemes
DirectionTurning DirectionNumber of LanesVCPhaseTimingOffset
1East Left-turn250 km/h130 sApplsci 13 08372 i00137114 s
East Straight3
West Left-turn2Applsci 13 08372 i0023
West Straight3
SouthLeft-turn2Applsci 13 08372 i00337
SouthStraight4
NorthLeft-turn2Applsci 13 08372 i00426
NorthStraight4Applsci 13 08372 i00527
Table 3. Road information.
Upstream Intersection NumberDownstream Intersection NumberRoad Length
(m)
Number of
Non-Signal Crosswalks
Flow of Pedestrian Crossing (p/h)
1213000/
238000/
349000/
451300180
5615002230
Table 4. Data on the trajectories of vehicles.
License
Plate
Type of
Vehicle
Upstream Intersection NumberDownstream Intersection NumberRoad Length
(m)
Starting TimeEnding Time
*PD0851*Small vehicle1213002020/9/21 08:502020/9/21 08:51
*P5N512*Small vehicle238002020/9/21 08:512020/9/21 08:52
*P28B96*Small vehicle349002020/9/21 08:462020/9/21 08:48
*PD0209*Small vehicle4513002020/9/21 09:152020/9/21 09:17
*PD0304*Heavy vehicle5615002020/9/21 09:282020/9/21 09:29
Table 5. Data required for L.
Non-Signalled Crosswalks m ω m Pm (p/h)k
71/38020%
81/3145
91/385
Table 6. Data required for H.
Road
(W to E)
ln (m)Qnh (pcu/h)Qn (pcu/h)Road
(E to W)
Qnh (pcu/h)Qn (pcu/h)
1–213000 3146–5451372
2–380014352 5–4411268
3–4900559694–32 137
4–5130042949 3–22 68
5–61500389282–141769
Table 7. The values of the influential factors.
SchemesV (km/h)SchemesC(s)SchemesL (Times)SchemesH (%)
A140B1110C112D11
A245B2120C216D22
A350B3130C320D33
A455B4140C424D44
A560B5150C528D55
Table 8. Schemes for green wave control with C0 = 130 s, the range of V of 40–60 km/h (unit: s).
IntersectionPhaseTimingVOffsetBandwidthVOffsetBandwidthVOffsetBandwidthVOffsetBandwidthVOffsetBandwidth
1Applsci 13 08372 i0063740
km/h
601245
km/h
11832.550
km/h
1143555
km/h
1011.560
km/h
2814.5
Applsci 13 08372 i0073
Applsci 13 08372 i00837
Applsci 13 08372 i00926
Applsci 13 08372 i01027
2Applsci 13 08372 i01139068646299
Applsci 13 08372 i01246
Applsci 13 08372 i01322
Applsci 13 08372 i01423
3Applsci 13 08372 i01530495149106119
Applsci 13 08372 i01674
Applsci 13 08372 i01726
4Applsci 13 08372 i0182659120117117123
Applsci 13 08372 i01921
Applsci 13 08372 i02026
Applsci 13 08372 i02128
Applsci 13 08372 i02229
5Applsci 13 08372 i023293156504646
Applsci 13 08372 i02418
Applsci 13 08372 i02529
Applsci 13 08372 i02623
Applsci 13 08372 i02731
6Applsci 13 08372 i0284700000
Applsci 13 08372 i02950
Applsci 13 08372 i03016
Applsci 13 08372 i03117
Table 9. Schemes for green wave control with V0 = 50 km/h, the range of C of 110–150 s (unit: s).
IntersectionPhaseCTimingOffsetBandwidthCTimingOffsetBandwidthCTimingOffsetBandwidthCTimingOffsetBandwidthCTimingOffsetBandwidth
1Applsci 13 08372 i03211025948.512020116301303711435140375511.5150276414.5
Applsci 13 08372 i0338163823
Applsci 13 08372 i0342520373727
Applsci 13 08372 i0352529262933
Applsci 13 08372 i0362735272940
2Applsci 13 08372 i03711030481203560130396414041721504374
Applsci 13 08372 i0384646465358
Applsci 13 08372 i0391719222224
Applsci 13 08372 i0401720232425
3Applsci 13 08372 i0411102534120255013030491402912815031135
Applsci 13 08372 i0425667747984
Applsci 13 08372 i0432928263235
4Applsci 13 08372 i044110293312020108130261171402512715023137
Applsci 13 08372 i0451625212834
Applsci 13 08372 i0462920262523
Applsci 13 08372 i0471620283132
Applsci 13 08372 i0482035293138
5Applsci 13 08372 i04911028301202550130295014021591502153
Applsci 13 08372 i0501520183739
Applsci 13 08372 i0512825292121
Applsci 13 08372 i0521620232530
Applsci 13 08372 i0532330313639
6Applsci 13 08372 i054110390120430130470140480150520
Applsci 13 08372 i0554044505255
Applsci 13 08372 i0561516161921
Applsci 13 08372 i0571617172122
Table 10. Flow-related data (Unit: pcu/h).
Intersection NumberEastWestSouthNorth
Left-Turn StraightLeft-TurnStraightLeft-TurnStraightLeft-TurnStraight
Applsci 13 08372 i058Applsci 13 08372 i059Applsci 13 08372 i060Applsci 13 08372 i061Applsci 13 08372 i062Applsci 13 08372 i063Applsci 13 08372 i064Applsci 13 08372 i065
1392 608 432 622 206 264 156 205
2184 919 335 403 126 235 164 165
3/423 300 1082 //345 /
4398 1285 286 1038 153 203 105 165
5429 1502 91 1058 111 219 132 405
61147 1220 187 1161 154 109 176 237
Table 11. Sensitivity schemes and outputs.
SchemesV (km/h)C (s)L (times)H (%)STDE
A1401302030.72520.6549.521.059
A2451302030.58487.1350.220.971
A3501302030.53486.3946.970.922
A4551302030.74524.1647.511.058
A5601302030.68513.5443.280.990
B1501102030.73525.6936.071.002
B2501202030.58487.8940.840.929
B3501302030.53486.3946.970.945
B4501402030.60490.8751.911.023
B5501502030.62517.7757.861.092
C1501301230.53482.8946.060.989
C2501301630.53485.2046.090.991
C3501302030.53486.3946.970.998
C4501302430.54488.2647.021.006
C5501302830.55488.7047.331.015
D1501302010.52481.6045.600.978
D2501302020.53485.1746.390.992
D3501302030.53486.3946.970.997
D4501302040.54494.7447.411.012
D5501302050.54495.1648.471.020
Table 12. Scheme for green wave control with a design speed of 50 km/h and signal cycle of 125 s (unit: s).
Intersection 1Intersection 2Intersection 3Intersection 4Intersection 5Intersection 6
PhaseTimingPhaseTimingPhaseTimingPhaseTimingPhaseTimingPhaseTiming
Applsci 13 08372 i06634Applsci 13 08372 i06731Applsci 13 08372 i06826Applsci 13 08372 i06925Applsci 13 08372 i07033Applsci 13 08372 i07145
Applsci 13 08372 i07212Applsci 13 08372 i07354Applsci 13 08372 i07470Applsci 13 08372 i07528Applsci 13 08372 i07618Applsci 13 08372 i07746
Applsci 13 08372 i07834Applsci 13 08372 i07919Applsci 13 08372 i08029Applsci 13 08372 i08125Applsci 13 08372 i08233Applsci 13 08372 i08315
Applsci 13 08372 i08420Applsci 13 08372 i08521 Applsci 13 08372 i08620Applsci 13 08372 i08718Applsci 13 08372 i08819
Applsci 13 08372 i08925 Applsci 13 08372 i09027Applsci 13 08372 i09123
Offset108Offset59Offset50Offset109Offset54Offset0
Table 13. Schemes used for simulation-based verification and their outputs.
Simulation SchemesV (km/h)C (s)L (times)H (%)STDE
Scheme 1501302030.53486.3946.971.156
Scheme 2501252030.47459.2139.761.030
Scheme 350130000.43432.1942.451.002
Scheme 450125000.32401.4232.330.812
Disclaimer/Publisher’s Note: The statements, opinions and data contained in all publications are solely those of the individual author(s) and contributor(s) and not of MDPI and/or the editor(s). MDPI and/or the editor(s) disclaim responsibility for any injury to people or property resulting from any ideas, methods, instructions or products referred to in the content.