Abstract
The wheel of high-speed trains requires high strength and hardness while imposing high demands on plasticity and toughness, resulting from the needs of working conditions. The fracture toughness KQ, as an important indicator of dynamics, often varies in the wheel, which affects the overall performance of the wheel. This work performs tests and analyses on typical samples with large fracture differences in fracture toughness at the same position and uniformly distributed on the same wheel. The mechanism of fracture toughness fluctuation is investigated, and the factors affecting fracture toughness are identified. The test mainly focuses on macroperformance, microfracture morphology, inclusion category and shape influence, pearlite lamellar spacing, and pearlite block size. Optical microscopy (OM), scanning electron microscopy (SEM), energy dispersive spectroscopy (EDS), electron backscatter diffraction (EBSD), and quantitative metallographic technology were employed to investigate the mechanism and influence factors on fracture toughness fluctuation. The analysis shows that the width of the ductile laceration zone is directly correlated with the toughness, and the toughness level is influenced by the cleavage size, pearlite lamellar spacing, and pearlite block uniformity.
1. Introduction
When a train’s speed exceeds 200 km/h, the dynamic conditions of the train change significantly. The increased speed puts greater stress on the high-speed wheels, leading to notable changes in their operating conditions. Consequently, the main failure mode for these wheels after the speed increase is fatigue stripping of the tread. To ensure the safe and stable operation of the wheels, they must possess high strength, resistance to stripping, and overall fatigue resistance. Therefore, high-speed train wheels are characterized by their high technological content, added value, and associated risks. They impose higher demands on toughness and plasticity than conventional wheels (below 160 km/h). Research has shown that enhancing wheel toughness, especially fracture toughness, is the key to the production of high-speed train wheels [1,2,3].
High-speed train wheels are usually manufactured using high-quality carbon steel with a carbon content ranging from 0.48 to 0.60%. These wheels are formed through a combination of forging and rolling processes [4]. Due to the wear and fatigue resistance requirements, high speed trains often need to exhibit higher strength and hardness. As the train speed increases, especially when it surpasses 200 km/h, there is a significant rise in traction power, dynamic forces between the wheel and the rail, and braking power, which puts higher demands on the toughness of the high speed train wheel [5,6,7].
According to research studies [8,9,10], when the carbon content of the wheel steel grade is the same, high-speed train wheels require higher hardness than ordinary wheels. At the wheel wear limit, the hardness is about 10 HB higher. However, the toughness requirements remain the same. Currently, an effective method is to adopt a micro-alloyed composition design to achieve high strength and hardness without compromising the toughness level of the wheel [11,12,13,14,15]. This study mainly focuses on investigating the fluctuation of fracture toughness in the case of micro-alloyed material.
Ensuring the safety of high-speed wheels is an increasing concern. The braking process generates energy concentration, which, mixed with mechanical forces and heat, can lead to fatigue damage in the wheel tread [16]. Fracture mechanics research indicates that the most fundamental approach to preventing brittle fracture in wheels is to increase the allowable crack length and allowable stress of the wheel material, thereby improving its toughness.
ac = (YKIC/σc)2
In the formula, ac represents the allowable crack length in the wheel, σc denotes the allowable stress, KIC represents the fracture toughness, and Y is the crack shape coefficient, typically ranging from 0.5 to 1.1. It is worth noting that improving the toughness of wheel materials is a shared goal pursued by various countries, considering the development trend of wheel materials. Therefore, it is necessary to analyze the factors influencing wheel toughness, such as smelting and physical metallurgy of wheel materials, microstructure control, etc. These factors can help identify methods for enhancing wheel toughness.
Cracks in the wheel rim can lead to serious consequences [17]. Research shows that rim cracks generally originate from a depth of 10 to 20 mm beneath the wheel tread [18] and propagate around the rim under the action of contact fatigue loads. These cracks are difficult to detect before expanding out of the rim surface. Hence, the rate at which fatigue cracks propagate is an important factor affecting wheel safety. Fracture toughness testing is conducted to evaluate the ability of the wheel to resist crack propagation and assess the rate under fatigue loads. Given the non-uniformity of fracture toughness in high-speed wheels, this study focuses on understanding the reasons behind the very low fracture toughness observed in wheels and exploring methods to improve fracture toughness.
2. Materials and Experimental Methods
2.1. Materials
ER7 is a commonly used material for high-speed train wheels in Europe. Table 1 presents its chemical composition. Figure 1 illustrates the fracture toughness test setup for high-speed wheels. Six test pieces are evenly distributed around the rim with each sample collected from a specific location on the rim as depicted in Figure 1. The sample size conforms to compact 30 mm thick tensile test pieces (CT 30), featuring a chevron notch with an aperture angle of 90° in ASTM E399 standards. For ER7 high-speed train wheels, the fracture toughness requirement, denoted as KQ, necessitates an average value exceeding 80 MPa·m1/2, with each sample having a value above 70 MPa·m1/2. The six samples are evenly distributed around the circumferential direction of the wheel rim. In production, the KQ average value can consistently reach more than 80 MPa·m1/2. However, occasionally, there may be individual KQ values below 70 MPa·m1/2, and difference values within the maximum and minimum can reach up to 40 MPa·m1/2. It is well known that many factors affect the fracture toughness level, but the issue of uniformity must be discussed [19].

Table 1.
Chemical composition of the ER7 wheel.
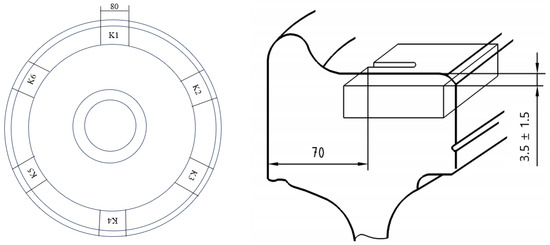
Figure 1.
Wheel fracture toughness test position.
When the fracture toughness of the ER7 material is tested, the toughness value often fluctuates. A typical wheel is selected for analysis, and the fracture toughness KQ results are shown in Table 2.

Table 2.
KQ values of typical ER7 wheels.
From the results of fracture toughness KQ, sample 1 obviously deviates from the normal level. Since the samples are uniformly distributed, it is first necessary to determine whether the fluctuation was due to the macroscopic property differences or not, especially the uneven heating and quenching. Therefore, typical samples 1, 4, and 5 are selected for hardness testing.
2.2. Experimental Methods
2.2.1. Macroanalysis
The BRIN400D of Foundrax, produced by Foundrax Engineering Products Ltd., Wessex Park, Somerton, Somerset, TA11 6SB, England, was used to test the hardness of samples 1, 4, and 5. The hardness tests were conducted on both the upper and lower surfaces of each fracture toughness sample. The Brinell hardness test was performed using a 10 mm diameter ball indenter and a 3000 kg test force (HBW 10/3000).
In addition, a 1:1 hydrochloric acid solution was heated to 75 °C, and a hot acid leaching experiment was carried out on three different positions of the wheel (samples 1, 4, and 5) for 15 min to analyze macrostructure.
2.2.2. SEM Analysis of Fracture Morphology Analysis
The two samples with the highest and lowest fracture toughness (samples 1 and 4) were selected for analysis. The fracture morphology and inclusion analysis mainly focus on the surface and sub-surface of the cracked zone of the fracture toughness sample, as shown in Figure 2. The fracture surface of the specimen was cleaned by an ultrasonic wave, and then the fracture morphology of the fracture toughness specimen was observed by a scanning electron microscope (SEM), using model LEO 438VP (LEO Electron Microscopy Co., LTD, Neu-Isenbur, Germany). The inclusions were found from the scanning images of fracture morphology, and the inclusion species and composition were analyzed by EDS.
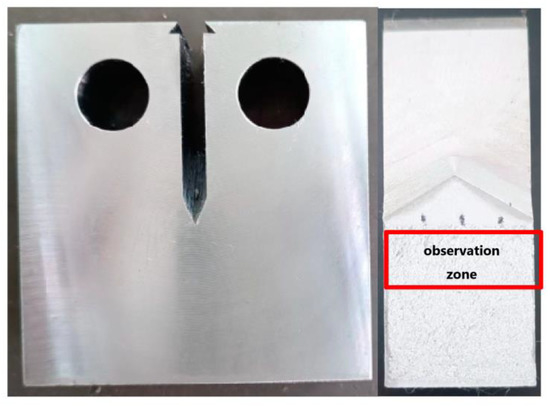
Figure 2.
Fracture morphology and inclusion analysis location.
2.2.3. Inclusion Analysis
Similarly, the two samples with the highest and lowest fracture toughness (samples 1 and 4) were analyzed. The metallographic sample with a size of 20 mm × 20 mm was prepared, ground from coarse to fine with sandpaper, and polished on the polishing machine. The sample was then corroded with an etchant. The diamond suspension (polycrystal or single crystal) and alcohol are mixed 1:1 in the polishing process, and the surface of the sample must be blown dry in time after cleaning to prevent corrosion and rust caused by water staying for a long time. Use a diamond suspension of 1 micron or finer for final polishing. And then the metallographic observation was carried out with a nitrate alcohol solution below 4%, and the microscopic structure was observed and collected with an OLYMPUS GX71 (made by the Olympus Corporation of Japan, Tokyo, Japan) optical microscope.
2.2.4. Analysis of Pearlite Lamellar Spacing
The pearlite layer spacing of the sample was analyzed by SEM [20,21,22]. The test is positioned on the radial cross-section of the sample, and the test is performed in three areas, that is, the upper, middle, and lower areas of the tread surface, and the number of analysis points at each position is greater than 200. From this test, the average pearlite lamellar spacing at each point and the average pearlite lamellar spacing in different regions are calculated.
2.2.5. Analysis of EBSD
The size of pearlite blocks was measured from the EBSD ferrite interface diagram. The EBSD step size was 0.5 μm, and the statistical size of the cleavage surface and pearlite clusters/blocks was above 100. Part of the fracture was treated with nickel plating to protect the original appearance of the fracture. SEM and EBSD were used to observe the microstructure of the fracture profile and analyze the propagation path of cleavage cracks in the pearlite structure.
3. Results and Discussion
3.1. Macroanalysis
Hardness testing of fracture toughness samples was performed; the test results are shown in Table 3.

Table 3.
Typical samples 1, 4, and 5 hardness values.
From the hardness test results, there is no direct relationship between fracture toughness and hardness. The macrostructure is shown in Figure 3.

Figure 3.
Macromorphology of different positions of the wheel. (A) Macromorphology of sample 1; (B) Macromorphology of sample 4; (C) Macromorphology of sample 5.
The macrostructure test results show that there is slight general porosity, center porosity, and regional segregation in all samples, and there is obvious coarse dendritic segregation. There is no obvious difference in the uniformity of the macrostructure. So, there is no obvious relationship between toughness and the corresponding positional macroproperty [23].
3.2. SEM and EBSD Analysis
The microscopic appearance is shown in Figure 4 and Figure 5. It shows that the fracture surface has three major areas: one is the prefabricated fatigue crack area, and the other is the cleavage or quasi-cleavage crack propagation area. In the middle of the two areas, there is a certain width of the transition zone, which is the ductile laceration zone.
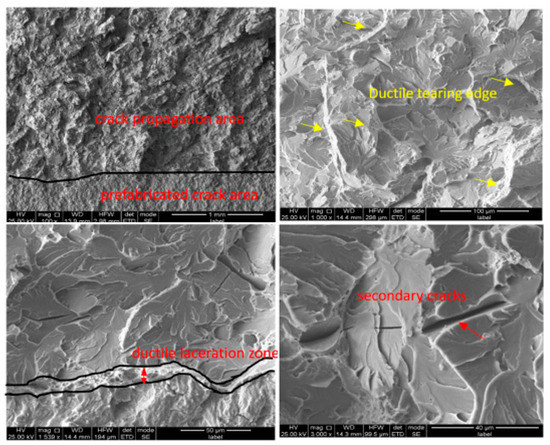
Figure 4.
Microscopic morphology of fracture surfaces in Sample 1.
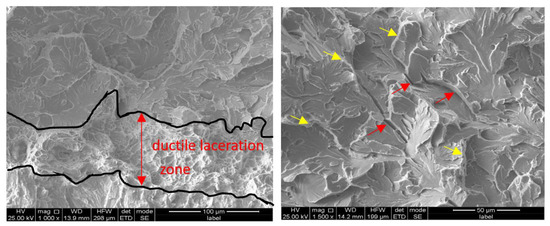
Figure 5.
Microscopic morphology of fracture surfaces in Sample 4.
For sample 1, the fracture surface is flat, the ductile laceration zone is narrow, and the edges are not neat, even though there is almost no ductile laceration zone in some areas. The brittle zone is a line-source fracture. The pattern is cleavage, a small amount of tearing ridge, and secondary cracks; the location of the secondary crack is located in the sub-surface of the fracture, about 5–15 mm, and the cleavage pattern is extremely large and uneven.
For sample 4, a large number of small areas of ductile tear were found around the cleavage plane, as shown in the yellow arrow (Figure 5). More secondary cracks were found in the crack propagation zone, as shown by the red arrow. The fracture is rough, with a wide ductile laceration zone. The fracture pattern is cleavage, with more tearing ridges and secondary cracks, and the cleavage river pattern is small and uneven.
It can be seen that the cracks in the samples started from the matrix structure, and the crack growth zone was mainly composed of the cleavage planes of different sizes and the ductile tearing edges around them. Secondary cracks could be found in almost all of the samples. The most significant difference between the two samples is the width of the ductile tear zone. Using a micrometer to measure, the maximum width of the ductile tear zone of sample 1 is 10.5 μm, and sample 4 is 83.4 μm. There is a good relationship between the width of the ductile tear zone and fracture toughness.
The results of SEM analysis show that the microfracture morphology directly reflected the fracture toughness trend of the material, and the width of the ductile laceration zone at the transition between the fatigue fracture and the tear zone is positively correlated with KQ. The worst sample has almost no obvious ductile laceration zone. There is no direct correlation between KQ and the size of the secondary crack.
Samples 1 and 4 were assessed by OM. The test results are shown in Figure 6 and Figure 7 and Table 4. The microstructure of the samples is lamellar pearlite and pro-eutectoid ferrite along the grain boundary, and grain size is fine, but no large inclusions which the test results were graded according to ISO 4967, as shown in Table 4. In the inclusion class, there is no relationship between inclusions and fracture toughness. So, it needs further analysis.
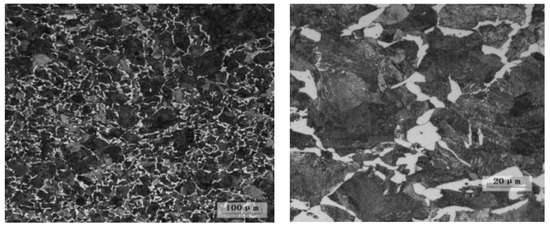
Figure 6.
Microstructure analysis by OM Samples 1 and 4.
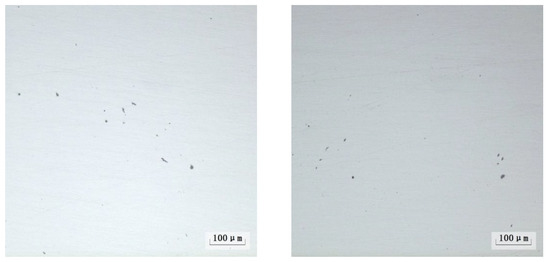
Figure 7.
Inclusions analysis by OM Samples 1 and 4.

Table 4.
Inclusion analysis by OM.
It is analyzed for the microscopic morphology and EDS of the inclusions in samples 1 and 4, as shown in Figure 8 and Figure 9. The results show that there are small and fewer inclusions in sample 1. The crack initiation source does not appear in the inclusions. There are a little more and larger inclusions in the ductile band of Sample 4, but the inclusions do not expand. There is no obvious concentrated crack source, and the crack initiation source does not appear at the inclusions.
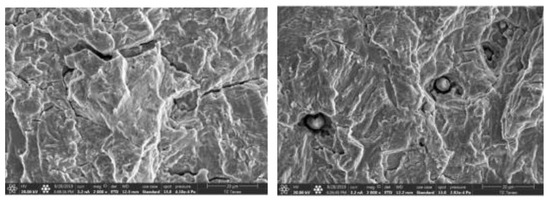
Figure 8.
Analysis of microscopic inclusions in Sample 1.
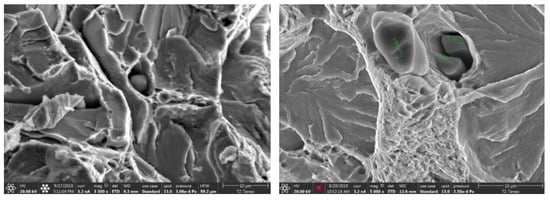
Figure 9.
Analysis of microscopic inclusions in Sample 4.
The microscopic analysis results of the inclusions in the fracture toughness specimens show that various types of inclusions are found in the fatigue zone, ductile laceration zone, and brittle zone. Some of the inclusions are embedded in the matrix, and some of the inclusions are detached, but the inclusions have no expansion and no source of cracking.
Samples were qualitatively analyzed for inclusions by EDS. The types of inclusions in the samples are detected, as shown in Figure 10 and Figure 11.
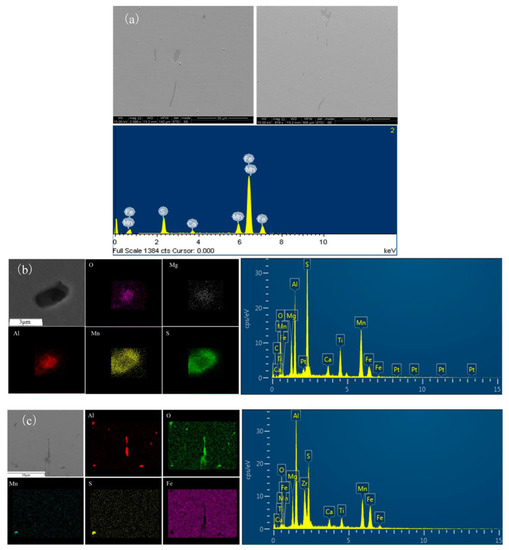
Figure 10.
Inclusion characteristics in Sample 1. (a) Pure sulfide inclusion (MnS); (b) mixed inclusions (MnS-wrapped oxides); and (c) pure Al2O3 inclusion.
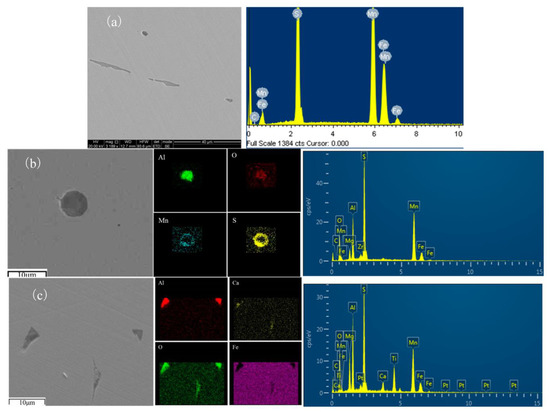
Figure 11.
Inclusion characteristics in Sample 4. (a) Pure sulfide inclusion (MnS); (b) mixed inclusions (MnS-wrapped oxides); and (c) mixed inclusions (alumina and calcium oxide).
For Sample 1, inclusions mainly include MnS with elongated and elliptical shapes (Figure 10a) and MnS-wrapped oxides with elongated and elliptical shapes (Figure 10b). Oxides (Figure 10c) are abundant and concentrated, with sharp edges and angles.
For Sample 4, inclusions mainly include MnS with elongated and elliptical shapes (Figure 11a) and MnS-wrapped oxides with elongated and elliptical shapes (Figure 11b). Oxides (Figure 11c) are less and triangular.
Combined with the analysis results of SEM and EDS, it can be seen that the big inclusion is mainly a sulfide-wrapped alumina inclusion, whose main components are Mn, S, O, and Al. It is a mature technology of inclusion modification that helps to improve the plastic and toughness of steel [24,25,26,27]. In addition, there are more oxides in the sample with lower fracture toughness, and the oxides are mainly diamond- and triangle-shaped. Sharp edges and angles will lead to stress concentration, which is detrimental to toughness.
The microstructure of the rim of the railway vehicle wheel is lamellar pearlite and a small amount of ferrite, and the heat treatment method is to force cooling by water to form fine pearlite on the rim [28]. The distance of the pearlite layer directly affects the mechanical properties of the wheel rim. The smaller the lamellar spacing, the higher the strength and hardness, and the better the plasticity and toughness [29,30,31,32]. The quantitative measurement results of the pearlite lamellar spacing by SEM are shown in Figure 12 and Figure 13. The minimum distance between the pearlite lamella at different positions in sample 1 is 0.178 μm, the maximum is 0.232 μm, and the average is 0.210 μm. There are large aggregated grains in the pearlite area, and the pearlite is mostly arranged in parallel.
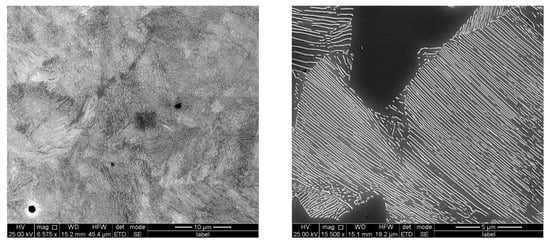
Figure 12.
Quantitative analysis of Sample 1 pearlite lamella.
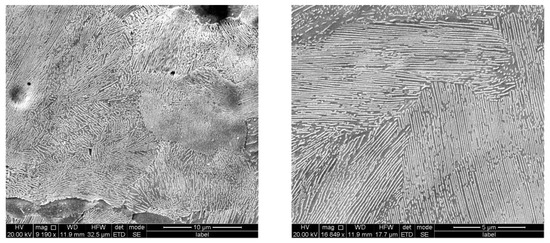
Figure 13.
Quantitative analysis of Sample 4 pearlite lamella.
The minimum distance between the pearlite lamella at different positions in sample 4 is 0.178 μm, the maximum is 0.201 μm, and the average is 0.189 μm. The pearlite is uniform, and the pearlite is arranged in different directions.
The test results show that the finer the pearlite lamellar spacing, the higher the fracture toughness KQ, and there is a linear correlation between the pearlite lamellar spacing and the fracture toughness KQ. The reason for the low fracture toughness of Sample 1 is related to the large pearlite lamellar spacing, the coarse grains in the pearlite region, and the poor uniformity of the pearlite lamellar spacing [33,34,35].
It is generally believed that grain size has a great influence on the toughness of steel, but under the OM, the grain size of high-speed train wheels can reach 7.5 grade or more, and some even reach 9.0 grade, but in this case, the wheel fracture toughness fluctuation is still not eliminated, nor has it improved the wheel fracture toughness value [36,37,38]. Therefore, general grain size measurement alone cannot explain the high and low fracture toughness. By analyzing EBSD to determine the fracture toughness of the specimens, it was found that there are large differences in ferrite orientation. It can be judged that a pearlite block of pearlitic structure (the same ferrite orientation) has an obvious hindering effect on the cleavage crack. Therefore, the reason for the toughness difference can be analyzed by measuring the size of the pearlite block. The ferrite orientation of Samples 1 and 4 was determined by EBSD. The results are shown in Figure 14.
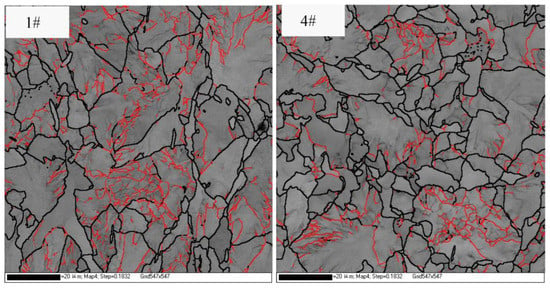
Figure 14.
Ferrite interface. (Black lines represent interfaces with an orientation difference greater than 15°, and red lines represent interfaces with an orientation difference of 5–15°).
The results show there are several large sizes (≥20 μm) of pearlite block, which points to the non-uniformity of grain size distribution. However, sample 1 has more red lines and shows more pearlite block, i.e., lower fracture toughness. It reflects fracture toughness fluctuations of the same wheels associated with the uneven pearlite block.
The step size of the EBSD orientation analysis was 200 nm. Due to the small size of the cementite lamellar layer in the pearlite lamellar, only a small amount of the cementite phase could be seen in the EBSD image, and the distribution was irregular and scattered. The region with the same ferritic orientation can be considered to belong to the same pearlite pellet, and the direction difference between adjacent pearlite pellets is usually greater than 15°, forming a large Angle grain boundary. There are also a large number of small Angle grain boundaries below 8° between the ferrite inside the pearlite pellet. In most cases, the continuous orientation difference between the ferrites in the pellet gradually disappears within the crystal. Sometimes, this small Angle grain boundary can be continuously extended to separate independent pellets. From the above results, it can be found that the average size of pearlite pellets obtained by using the grain boundary map of the EBSD orientation difference is about 10 μm.
3.3. Results Discussion
In general, for typical lamellar pearlite steels, it is feasible to observe local pearlite lamels by scanning electron microscopy. The analysis shows that the structure of the fracture toughness sample is mainly pearlite. There is a thin film of ferrite distributed among the pearlite pellets, and the ferritic content is not more than 10%. Microscopic fracture mechanics has shown that when a crack crosses a grain boundary at a large Angle, the forward direction of the crack front often changes. The analysis shows that in the crack initiation region of the sample, the crack rapidly propagates in the mode of cleavage fracture, forming a symbolic river pattern. The river pattern spreads to the adjacent pearlite structure, resulting in the formation of shear cracks at the cleavage crack source.
The above observations indicate that the dominant role of cleavage fracture in pearlite fracture is understood and that in the pearlite–ferrite type of wheel steel, the structural unit that determines toughness is pearlite rather than ferrite. When cleavage fracture occurs in pearlite pellets, the propagation mode of cleavage fracture in pearlite pellets is important. In the study of controlling factors of pearlite steel plasticity, it is considered that the slip band can pass through multiple pearlites, and it is considered that the original austenite grain boundary still controls the growth of cleavage cracks.
After the fracture was etched with a subsaturated picric acid solution, the interaction between the cleavage plane and the structure of the fracture was observed. It can be seen from the figure that the torn edge is always located between the two grains with the largest difference in order. The grain boundary and the surrounding tear edge form a cleavage plane, and the cleavage plane does not pass through multiple grains, which indicates that the large grain difference can make the cleavage crack growth path turn the influence of the outer pearlite lamellar size on toughness. Another important feature of the wheel steel fracture structure is the slip line inside the structure.
The difference in wheel toughness is mainly reflected in the dimple band, crack source, and cleavage pattern. When the toughness is high, there is a certain width of the dimple band at the fracture edge of the sample; when the toughness is abnormal or extremely low, it is a complete brittle fracture and no dimple appears. Therefore, it can be judged that the dimple band is directly related to the toughness value, and a wider dimple band means a higher toughness level. Secondly, there are obvious concentrated crack sources on the sub-surface of the specimens with low fracture toughness. The size of the cleavage pattern is consistent with the grain size of the matrix, and the large cleavage pattern is caused by the coarse grain size, which represents the brittleness trend of the material. Therefore, there is a single abnormally low toughness of the wheel; the main difference is whether there is a ductile belt at the fracture. According to a large amount of data on the fracture toughness of the wheel, the toughness of the vast majority of the samples is normal; that is, the vast majority of the samples have a certain width of the ductile belt when they break, not a completely brittle fracture, and the complete brittle fracture belongs to accidental or a few samples.
From the other characteristics of the fracture, although the fracture of the samples with different toughness has more secondary cracks and there are coarse grains on the cleavage surface, the samples with abnormal toughness have a concentrated crack source on the coarse cleavage surface. Therefore, it can be inferred that during the fracture of the samples, more cracks are generated at the grain boundary between the coarse grains and fine grains, forming a fracture-concentrated crack source and leading to brittle fracture. The uniform fine crystal in the toughness fracture will produce a certain dimple region, increase the fracture energy, and have a high toughness.
Further analysis by OM shows that there is no inclusion in the sample, and for the occasional abnormal reduction in toughness, combining the results of SEM and OM shows that there are a certain number of large grains in the sample, but not all large grains will lead to the reduction in toughness. Grains of different sizes have a different tendency to form concentrated crack sources, mainly due to the different interface stresses of grain sizes. The authors believe that wheel fracture is carried out along the grain, regardless of brittleness or toughness. When the size of the grain reaches a certain size difference, there is a large stress there, and brittle fracture will occur, resulting in fluctuations in toughness. The critical grain size or interface stress still needs further study.
In conclusion, the relationship between grain size and toughness fluctuation is proportional to the average grain size and toughness, and there is a random fluctuation in fracture toughness. One of the principles is that there is a critical difference in grain size, which will cause a concentrated crack source during fracture, resulting in brittle fracture and an abnormal decline in toughness.
Faccoli et al. believe that the fracture toughness of the steels is not significantly altered by the heat treatments, but a decrease is registered only for ER7 steel [2]. In terms of crack propagation curves, none of the tested steels exhibited significant variation as a consequence of thermal alterations, meaning that their fracture mechanics properties are stable even under severe shoe braking conditions. But through testing and analysis, the fluctuation of fracture toughness on the wheels of high-speed trains eliminated the possibility of uneven macroperformance. It has to do with the inclusion’s shape and amount. The width of the ductile laceration zone and the size of the cleavage river pattern are closely related to fracture toughness, but there is no correlation for the secondary cracks. Then, pearlite lamellar spacing and uniformity of the grain affect the value of fracture toughness.
For ER7 high-speed train wheels, it is not the average grain size but the maximum grain size in the microstructure that affects the fracture toughness fluctuations. A small number of coarse grains (or abnormal grains) after the transformation of pearlite leads to a larger pearlite cluster size, which has a small hindrance to crack propagation. Therefore, in order to improve the fracture toughness of ER7 wheels on high-speed trains, it is necessary not only to refine the grain size but also to make the grain size uniform. Fracture toughness fluctuations in the same wheels are associated with the uneven pearlite block. Moreover, the coarse original austenite grains cannot be eliminated in the subsequent process, and the heat treatment process fails to effectively precipitate homogeneous ferrite.
4. Conclusions
According to the results of the hardness test of the sample and the macroanalysis of the wheel rim, there is no direct correlation between the fracture toughness and the hardness and macrostructure of the same rim.
The results show that, despite a certain amount of class A inclusions in the sample by OM, there is no correlation between the inclusions and fracture toughness. In conjunction with the analysis results from SEM and EDS, it shows that the sample contains more oxides, which have lower fracture toughness, and that sharp edges and angles reduce toughness.
Analysis of fracture morphology shows that the width of the ductile laceration zone between the fatigue fracture and the tear zone is directly correlated with the fracture toughness. The size of the cleavage river pattern is negatively correlated with fracture toughness, but the size of the secondary cracks is not directly related to fracture toughness.
The pearlite lamellar spacing of the sample was analyzed using SEM. This showed that the pearlite lamellar spacing affects the level of fracture toughness (KQ) of the wheel. The finer the pearlite lamellar spacing, the higher the fracture toughness (KQ). It is also related to the uniformity of the pearlite grain and lamellar spacing.
Through EBSD analyses, it was found that there are large differences in ferrite orientation. It can be judged that the pearlite block with pearlitic structure (same ferrite orientation) has a significant hindering effect on the cleavage crack. Therefore, fracture toughness fluctuations in the same wheels are associated with the uneven pearlite block.
Author Contributions
Methodology, T.J. and C.L.; Formal analysis, T.J.; Resources, Z.S.; Data curation, Z.W.; Writing—original draft, T.J. and Z.S.; Writing—review & editing, C.L. and Z.W. All authors have read and agreed to the published version of the manuscript.
Funding
This work was financially supported by the Key R&D Program of Shanxi Province through Contract No. 201703D111008. This work was also supported by the Taiyuan Heavy Industry Railway Transit Equipment Co., Ltd. This work was also supported by Xinglong Zhao and Xiaofeng Zhang.
Data Availability Statement
The data presented in this study are available in the article.
Conflicts of Interest
The authors declare no conflict of interest.
References
- Faccoli, M.; Petrogalli, C.; Ghidini, A. On Mechanical Properties of New Railway Wheel Steels for Desert Environments and Sand Caused Wheel Damage Mechanisms. J. Mater. Eng. Perform. 2019, 28, 2946–2953. [Google Scholar] [CrossRef]
- Faccoli, M.; Ghidini, A.; Mazzù, A. Changes in the Microstructure and Mechanical Properties of Railway Wheel Steels as a result of the Thermal Load Caused by Shoe Braking. Met. Mater. Trans. A 2019, 50, 1701–1714. [Google Scholar]
- Faccoli, M.; Petrogalli, C.; Lancini, M.; Ghidini, A.; Mazzù, A. Rolling Contact Fatigue and Wear Behavior of High-Performance Railway Wheel Steels under Various Rolling-Sliding Contact Conditions. J. Mater. Eng. Perform. 2017, 26, 3271–3284. [Google Scholar]
- Ostash, O.P.; Anofriev, V.H.; Andreiko, I.M.; Muradyan, L.A.; Kulyk, V.V. On the concept of selection of steels for high-strength railroad wheels. Mater. Sci. 2013, 48, 697–703. [Google Scholar] [CrossRef]
- Cong, T.; Han, J.; Hong, Y.; Domblesky, J.P.; Liu, X. Shattered rim and shelling of high speed railway wheels in the very-high-cycle fatigue regime under rolling contact loading. Eng. Fail. Anal. 2019, 97, 556–567. [Google Scholar]
- Tarafder, S.; Sivaprasad, S.; Ranganath, V.R. Comparative assessment of fatigue and fracture behaviour of cast and forged railway wheels. Fatigue Fract. Eng. Mater. Struct. 2007, 30, 863–876. [Google Scholar] [CrossRef]
- Zhang, L.; Wang, Z.; Wang, Q. The effect of wheel polygonal wear on temperature and vibration characteristics of a high speed train braking system. Mech. Syst. Signal Process. 2023, 186, 109864. [Google Scholar] [CrossRef]
- Khan, M.R.; Dasaka, S.M. Wheel-rail interactions in high speed railway networks during rapid train transit. Mater. Today Proc. 2018, 5, 25450–25457. [Google Scholar] [CrossRef]
- Ma, Y. Study on Toughening Mechanism and Production Process Optimization of Wheel Steel for High Speed Train. Ph.D. Thesis, Central Iron & Steel Research Institute, Beijing, China, 2012. [Google Scholar]
- Zhu, K.; Xu, Y.J.; Jing, T.; Hou, H.L. Fracture behavior of a composite composed by Ti-aluminide multi-layered and continuous-SiCf-reinforced Ti-matrix. Rare Met. 2017, 36, 925–933. [Google Scholar] [CrossRef]
- Huang, Y.L.; Jia, L.N.; Kong, B. Microstructure and room temperature fracture toughness of Nb–Si-based alloys with Sr addition. Rare Met. 2018. [Google Scholar] [CrossRef]
- Kumar, A.S.; Kumar, B.R.; Datta, G.; Ranganath, V. Effect of microstructure and grain size on the fracture toughness of a micro-alloyed steel. Mater. Sci. Eng. A Struct. Mater. Prop. Microstruct. Process. 2010, 527, 954–960. [Google Scholar] [CrossRef]
- Sakamoto, H.; Toyama, K.; Hirakawa, K. Fracture toughness of medium-high carbon steel for railroad wheel. Mater. Sci. Eng. 2000, 285, 288–292. [Google Scholar] [CrossRef]
- Wang, P.; Li, Z.; Lin, G.; Zhou, S.; Yang, C.; Yong, Q. Influence of vanadium on the microstructure and mechanical properties of medium-carbon steels for wheels. Metals 2018, 8, 978. [Google Scholar] [CrossRef]
- Li, D.; Hui, S.X.; Ye, W.J.; Li, C.L. Microstructure and mechanical properties of a new high-strength and high-toughness titanium alloy. Rare Met. 2016. [Google Scholar] [CrossRef]
- Ostash, O.P.; Kulyk, V.V.; Lenkovskiy, T.M. Relationships between the fatigue crack growth resistance characteristics of a steel and the tread surface damage of railway wheel. Arch. Mater. Sci. Eng. 2018, 90, 49–55. [Google Scholar] [CrossRef]
- Ekberg, A.; Kabo, E. Fatigue of railway wheels and rails under rolling contact and thermal loading-an overview. Wear 2005, 258, 1288–1300. [Google Scholar] [CrossRef]
- Beretta, S. Application of multiaxial fatigue criteria to materials containing defects. Fatigue Fract. Eng. Mater. Struct. 2010, 26, 551–559. [Google Scholar] [CrossRef]
- Sevillano, J.G.; Ibabe, J.M.R.; Meizoso, A.M. Analysis of brittle fracture toughness of UIC R7 steel. In Proceedings of the 8th International Wheelset Congress, Madrid, Spain; 1985. [Google Scholar]
- Bower, A.F.; Johnson, K.L. The influence of strain Harding on cumulative plastic deformation in rolling and sliding line contact. J. Mech. Phys. Solids 1989, 37, 471–493. [Google Scholar] [CrossRef]
- Fan, J. A micro/macroscopic analysis for cyclic plasticity of dual-phase materials. J. Appl. Mech. 1999, 66, 124–136. [Google Scholar] [CrossRef]
- Peng, X.; Ponter, A.R.S. A constitutive law for a class of two-phase with experimental verification. Int. J. Solid Struct. 1994, 31, 1099–1111. [Google Scholar] [CrossRef]
- Zhang, X.; Jia, Y.; Sheng, L.; Yuan, L.; Li, J. Characterization of segregation degree for large size metal component and application on high speed train wheel. Anal. Chim. Acta 2022, 1203, 339719. [Google Scholar] [CrossRef] [PubMed]
- Liu, Z.; Kobayashi, Y.; Nagai, K.; Yang, J.; Kuwabara, M. Morphology control of copper sulfide in strip casting of low carbon steel. ISIJ Int. 2006, 46, 744–753. [Google Scholar] [CrossRef]
- Ma, Y.; Pan, T.; Jiang, B.; Cui, Y.; Su, H.; Peng, Y. Study of the effect of sulfur contents on fracture toughness of railway wheel steels for high speed train. Acta Metall. Sin. 2011, 47, 978–983. [Google Scholar]
- Mizoguchi, S.; Takamura, J. Control of oxides as inoculants metallurgy of oxides in steel process. In Proceedings of the Sixth International Iron and Steel Congress 1990, Nagoya, Japan, 21–26 October 1990; pp. 2331–2342. [Google Scholar]
- Krajnc, L.; Mrvar, P.; Medved, J. Thermodynamic characterization of multiphase non-metallic inclusions in re-sulphurised steel grades. Mater. Technol. 2014, 48, 923–929. [Google Scholar]
- Wu, S.; Li, X.-C.; Zhang, J.; Shang, C.-J.; Misra, R.D.K. Microstructural refinement and mechanical properties of high speed niobium-microalloyed railway wheel steel. Steel Res. Int. 2015, 86, 775–784. [Google Scholar] [CrossRef]
- Clayton, P. The relations between wear behavior and basic material properties for pearlitic steels. Wear 1980, 60, 75–93. [Google Scholar] [CrossRef]
- Heller, W.; Schweitaer, R. Hardness microstructure and wear behaviors of rail steels. In Proceedings of the Second International Heavy Haul Railway Conference, Colorado Springs, CO, USA, 25–30 September 1982; pp. 282–286. [Google Scholar]
- Hodson, W.H.; Preston, R.R. Production processes to yield superior rail steel. Transp. Rec. 1988, 1774, 150–162. [Google Scholar]
- Sugino, K.K.; Ageyama, K.; Masumoto, H. Development of weldable high strength steel. In Proceedings of the International Heavy Haul Conference, Colorado Springs, CO, USA; 1982; pp. 113–121. [Google Scholar]
- Mishra, K.; Singh, A. Effect of interlamellar spacing on fracture toughness of nano-structured pearlite. Mater. Sci. Eng. A Struct. Mater. Prop. Microstruct. Process. 2017, 706, 22–26. [Google Scholar] [CrossRef]
- Modi, O.P.; Desmukh, N.; Mondal, D.P. Effect of interlamellar spacing on the mechanical properties of 0.65 percent C steel. Mater. Charact. 2001, 46, 347–352. [Google Scholar] [CrossRef]
- Ray, K.K.; Mondal, D. The effect of interlamellar spacing on strength of pearlite in annealed eutectoid and hypoeutectoid plain carbon steels. Acta Metall. Mater. 1991, 39, 2201–2208. [Google Scholar] [CrossRef]
- Park, Y.J.; Bernstein, I.M. The process of crack initiation and effective grain size for cleavage fracture in pearlitic eutectoid steel. Metall. Trans. A 1979, 10, 1653–1664. [Google Scholar] [CrossRef]
- Hyzak, J.M.; Bernstein, I.M. The role of microstructure on the strength and toughness of fully pearlitic steels. Metall. Trans. 1976, 7, 1217–1224. [Google Scholar] [CrossRef]
- Q’Donnelly, B.E.; Reuben, R.L.; Baker, T.N. Quantitative assessment of strengthening parameters in ferrite-pearlite steels from microstructural measurements. Metall. Sci. J. 2013, 11, 45–51. [Google Scholar] [CrossRef]
Disclaimer/Publisher’s Note: The statements, opinions and data contained in all publications are solely those of the individual author(s) and contributor(s) and not of MDPI and/or the editor(s). MDPI and/or the editor(s) disclaim responsibility for any injury to people or property resulting from any ideas, methods, instructions or products referred to in the content. |
© 2023 by the authors. Licensee MDPI, Basel, Switzerland. This article is an open access article distributed under the terms and conditions of the Creative Commons Attribution (CC BY) license (https://creativecommons.org/licenses/by/4.0/).