1. Introduction
Grain milling plants process raw wheat to produce flour. The operations performed include, among others, the cleaning, sorting, separating and grinding stages. During these operations, the materials are usually moved with pneumatic systems that use compressed air. At the end of the process, before the air can be released back into the atmosphere, it must be purified from the suspended flour particles to comply with the current regulations [
1]. To this end, filters and cyclone separators are commonly adopted to purify the discharged air stream [
2,
3,
4]. To enhance the separating performance, and filter even the finest particles that cyclones alone fail to separate, cyclone and bag filters can be combined, to simultaneously exploit both the cyclonic and the filtering effects [
5]. The filtering elements, often bags made of fabric or synthetic materials, tend to entrap flour particles which decreases the separation efficiency over time [
6]. Periodic pulse jets of compressed air are commonly adopted to remove the entrapped particulate [
7,
8]. The clogging of the filter bags, however, still tends to increase during the normal functioning of the device due to the deep deposition and retention of particles [
9]. Other common malfunctions of cyclone bag filters include the wear and the tear of fabric sleeves. Generally, according to the manufacturers and end-users of these devices, the maintenance is limited to the substitution of the worn-out clogged sleeves at fixed time intervals of about a year, when the system pressure drop reaches a critical set-point value. Indeed, this operation is time-consuming and requires stopping and then restarting the entire processing line. Unplanned maintenance operations are sometimes required in the case of sleeve ruptures that can be detected only when the damage is severe and the plant needs to be stopped for timely intervention. Indeed, without being able to monitor what is happening inside the filter, these failures are detected when the discharged air stream appears white due to the massive presence of unfiltered flour. The ability to monitor the plant and detect the onset of failures could certainly generate a competitive advantage for companies. Indeed, by detecting the failures earlier, the operators could schedule predictive maintenance interventions at a convenient moment, instead of having to abruptly stop the plant and perform reactive maintenance.
This kind of optimization is crucial in the current industrial environment, which is characterized by scarcity of resources, frequent reductions in customer demand due to global crises, and ever-increasing competition among industrial players. In this scenario, to successfully stay in business, the companies need to define and leverage appropriate strategies that can generate competitive advantages.
The shift to Industry 4.0, which has been unfolding globally in recent years, involves a transition towards a highly digitized and interconnected business environment built upon several innovative technologies that have been evolving over the last decades [
10]. The implementation of Industry 4.0 enabling technologies is undeniably a highly beneficial approach, able to dramatically optimize the company’s performance. Indeed, the deployment of novel cutting-edge technologies, often combined with lean organization approaches, generally results in streamlined processes and operations, as well as increased efficiency and productivity levels [
11]. No less important is the reduced environmental impact, that can be obtained by efficiently using the resources and optimizing the operating and maintenance processes [
12].
Digital twins are key components of Industry 4.0. First introduced in [
13], digital twins can be defined as virtual replicas of technical assets, integrating knowledge and data resulting from modeling and simulation activities, with historical and real-time data captured by sensors during the real operation [
14]. The digital twin functioning is based on Industry 4.0 technologies, such as simulation, Internet of Things, artificial intelligence and machine learning, cloud computing and blockchain technology [
15]. The digital models developed can replicate multiscale physical systems, from single components and devices to entire plants and even cities. Furthermore, digital twins can be leveraged in human-robot systems for a plethora of different applications [
16]. By creating digital twins of their systems, the companies can gain several benefits, including data collection and analysis, constant monitoring of the system functioning, identification of trends and patterns, problem detection and optimization of maintenance activities, as well as process enhancement and minimization of human decision making [
17]. An important application of industrial digital twins, indeed, is in the maintenance sector [
18,
19,
20,
21,
22]. In particular, the application of the digital twin to preventive maintenance has received much interest in recent years. Predictive maintenance has been applied in various sectors, such as intelligent manufacturing, the power industry, construction industry, aerospace industry, and shipbuilding industry. The manufacturing sector is where the largest number of applications of the digital twins oriented to preventive maintenance can be found; in particular, the digital twins have been implemented in several areas, such as process equipment, automobile manufacturing, cyber-physical systems, product life cycle management and fault diagnosis [
21].
In general, most of the applications of predictive maintenance based on digital twin technology are developed from a physics-based model representation type; a few works can still be found in the literature in which the digital twins were developed based on a hybrid-approach model representation type, integrating real data with the results obtained from numerical simulations [
19]. Indeed, digital twins can be developed based on historical data measured by sensors, simulation results, or as an integration of both [
23,
24,
25,
26,
27,
28]. The available data can be analyzed by means of non-deep learning methods, such as regression models, or deep-learning methods, such as deep neural networks. Among these latter, mass customization system and Social Internet of Things emerged as a valid application of interconnecting deep learning technology and digital twin technology to keep the system in good working condition [
29].
With reference to industrial equipment, the simulations are often performed with Computational Fluid Dynamics (CFD) techniques, that allow the characterization of the system and its functioning in-depth under different operating conditions. The simulations can be performed to test what-if scenarios and alternative configurations without having to carry out experimental tests, thus minimizing the use and the waste of resources. In addition, the simulations allow monitoring of the values of the parameters of interest at each point of the device, resulting in a series of “virtual sensors” [
30,
31]. This allows monitoring of the system functioning, even at locations where physical sensors could not be installed. An example of a simulation applied to milling operations is presented in [
32] where a multiscale DEM-PBM approach was used to model the breakage behavior in a co-milling process. The use of discrete element modeling for the interactions and the collisions between the particles, combined with population balance modeling, utilized to describe the breakage events and the evolution of the particle size distribution, allowed the authors to gain insights into the mechanism of kernel breakage and thus optimize its performance. CFD simulation has been extensively applied to all kinds of industrial plants and devices in the last decades [
33,
34], including food industry applications [
35,
36,
37,
38,
39]. With reference to filtering devices, CFD simulation was used to optimize the functioning of cyclone separators [
40,
41,
42,
43], fabric filters [
8,
44], as well as cyclone separators combined with cartridge or fabric filters [
5,
45,
46]. Both Refs. [
45] and [
5] highlight how combining cyclones with filtering inserts can be beneficial; the separation efficiency is higher in the combined system compared to standard cyclones, while the average cleaning intervals are longer compared to cartridge filters. Furthermore, in addition to higher efficiency, cyclone-bag filters decrease the floor space demand, as they allow the combination of two otherwise separate operations.
In this study, CFD simulation was used to characterize in detail the functioning of a cyclone bag separator for industrial grain milling plants. The analysis started from a validated model [
46] and was extended to evaluate the device functioning at increasing clogging levels. The simulations allowed the characterization of the fluid flow inside the domain and define a location for a new sensor, that would enable the detection of clogging and failure conditions. Moreover, they would be able to know, for a given operating condition, the flow distribution inside the filter, allowing an accurate control of the sleeve cleaning system, and increasing the cleaning frequency on those sleeves most affected by the airflow. The simulation results were validated with experimental tests by reproducing in the real pilot plant, the simulated conditions. The data collected during both the simulation and the experimental campaigns were integrated to generate a digital model of the plant, that was connected to its physical counterpart by means of a LabView Data Acquisition module. The generated digital twin collects and analyses the data at different time scales, allowing it to detect abnormal values, identify variations and trends in the functioning, as well as estimate the remaining useful life (RUL) of the device. In this way, it is possible to enhance the system performance by continuously monitoring the plant and its conditions, thus being able to react to functioning variations in a timely manner and optimize the maintenance operations. The contribution of this article to the existing literature can be summarized in four points. (i) development of a simulative model capable of locally reproducing filter behavior as the degree of sleeve clogging changes; (ii) conceptualization of a digital twin-based predictive maintenance model developed based on a hybrid-approach model representation type, on the basis of simulative results and experimental data; (iii) development of a control model, based on a non-deep learning method, for routine sleeve cleaning operations, depending on specific operating conditions, to ensure better operating conditions and increase RUL; (iv) application of digital twin technology in a context, such as wheat and cereal milling, for which no specific study is yet present in the literature.
2. Materials and Methods
2.1. Pilot Plant
The study was conducted on an industrial-scale pilot plant reproducing the suction system commonly used in the milling industry to draw the finer particles of bran and flour out of machines and keep the working environment clean (see
Figure 1).
The system consists of a bag filter, a fan, piping, connections, flow control valves, and sensors. A schematic representation of the pilot plant is reported in
Figure 2.
The main element under study is the cyclone bag filter, which consists of a cylindrical steel body with a conical bottom, that contains 31 fabric sleeves. The airflow enters tangentially inside the separator, so that a percentage of the bran and flour dust, particularly the coarser ones, are initially separated by a cyclonic effect and do not impact against the sleeves. The percentage of dust that is separated by the cyclonic effect is collected in the conical bottom and can be extracted, and recovered, thanks to a rotary valve; the remaining particles remain trapped in the fabric of the sleeves, gradually decreasing their permeability. This results in rapid clogging of the sleeves, causing the need for their rapid replacement. Indeed, a compressed air cleaning system is installed on the filter, which, at regular time intervals, flows compressed air counter currently through the sleeves to remove the dust trapped in them. This flow, however, can clean the sleeves only partially, as the dust that has penetrated deeper into the porous matrix is not removed. Moreover, since to date, it is not possible to know the actual state of each sleeve, the sequence of sleeve cleaning is decided a priori and remains unchanged throughout the entire life cycle.
Once the permeability of the sleeves is no longer sufficient to ensure proper airflow, the sleeves must be replaced. Usually, sleeve replacement is performed when a differential pressure sensor, installed upstream and downstream of the sleeves, measures a pressure drop higher than a threshold value (generally set at about 15 mbar). The intervention of sleeve replacement is very time-expensive and requires stopping the production process for the time needed to complete the substitution. Therefore, to minimize the number of replacement interventions, all sleeves are usually replaced together. To maximize the uptime of the filter and its performance during this time interval, it is therefore highly desirable that the clogging of different sleeves occurs as uniformly as possible. On the one hand, it is therefore preferable to maximize the percentage of dust separated by the cyclonic effect and, at the same time, it is important to foresee the occurrence of abnormalities in filter operation so that timely action can be taken to restore proper operating conditions. Finally, it would be very useful to know the actual working conditions of each sleeve, since it would allow the optimization of the cleaning operations by increasing the frequency of the air jets on the sleeves most affected by airflow and decreasing the frequency on the others.
2.2. Numerical Simulation
The functioning of the cyclone bag filter was investigated through CFD simulation at optimal operating conditions, i.e., with clean sleeves, and at increasing clogging levels. The aim of these simulations was to evaluate the impact of the clogging on the system’s functioning. The first quantity evaluated was the pressure drop. However, this information by itself is not exhaustive, as a variation in the pressure drop could be caused by several issues that could not be related to clogging, such as a variation in flow rate, the presence of broken sleeves, or a combination of both aspects. To this end, the simulations performed were exploited to determine if, and how, the gradual increase in the clogging level of the filtering sleeves would impact other physical quantities that could be measured by installing additional sensors on the device.
Firstly, to perform the simulations, a 3D model of the cyclone bag filter was developed with Ansys SpaceClaim [
47]. The real dimensions of the filter were reproduced, and all 31 sleeves were modeled inside the device. The thickness of the sleeve walls was not directly reproduced as a separate volume in the geometry, as it would result in a dramatic increase in the computational weight of the simulation. Instead, the physical presence of the filtering medium was accounted for in the simulation settings. The geometrical features of the system are reported in
Table 1.
According to the manufacturers and the end-users of these filters, as well as the results of previously performed simulations validated in [
45], the clogging tends not to be uniform along the sleeve length. To this end, a division into three sectors was introduced, resulting in top, middle, and bottom sectors being defined for each of the 31 sleeves. The geometry generated is presented in
Figure 3.
The domain was then discretized in a finite number of volumes with Ansys Meshing [
48], generating a tetrahedral mesh, appropriately refined to accurately reproduce the airflow even in the narrowest gaps between the sleeves. To decrease the number of volumes, and thus the computational time, the conversion of the tetrahedral mesh volumes to polyhedra was performed. This operation resulted also in an increase in both the mesh quality and the convergence properties [
49,
50]. Finally, Ansys Fluent [
51,
52] was used to simulate the functioning of the filter by solving the flow field and turbulence equations at each volume node. The fabric filtering sleeves were reproduced with the “porous jump” model, a 1D simplification that allows for the calculation of the pressure drop introduced by a porous medium without having to directly model the momentum field inside it. To this end, the thickness of the sleeves and their permeability had to be specified. A number of iterations sufficient to guarantee the convergence and the stability of the solutions were performed for each simulation. The settings and the boundary conditions considered are summarized in
Table 2.
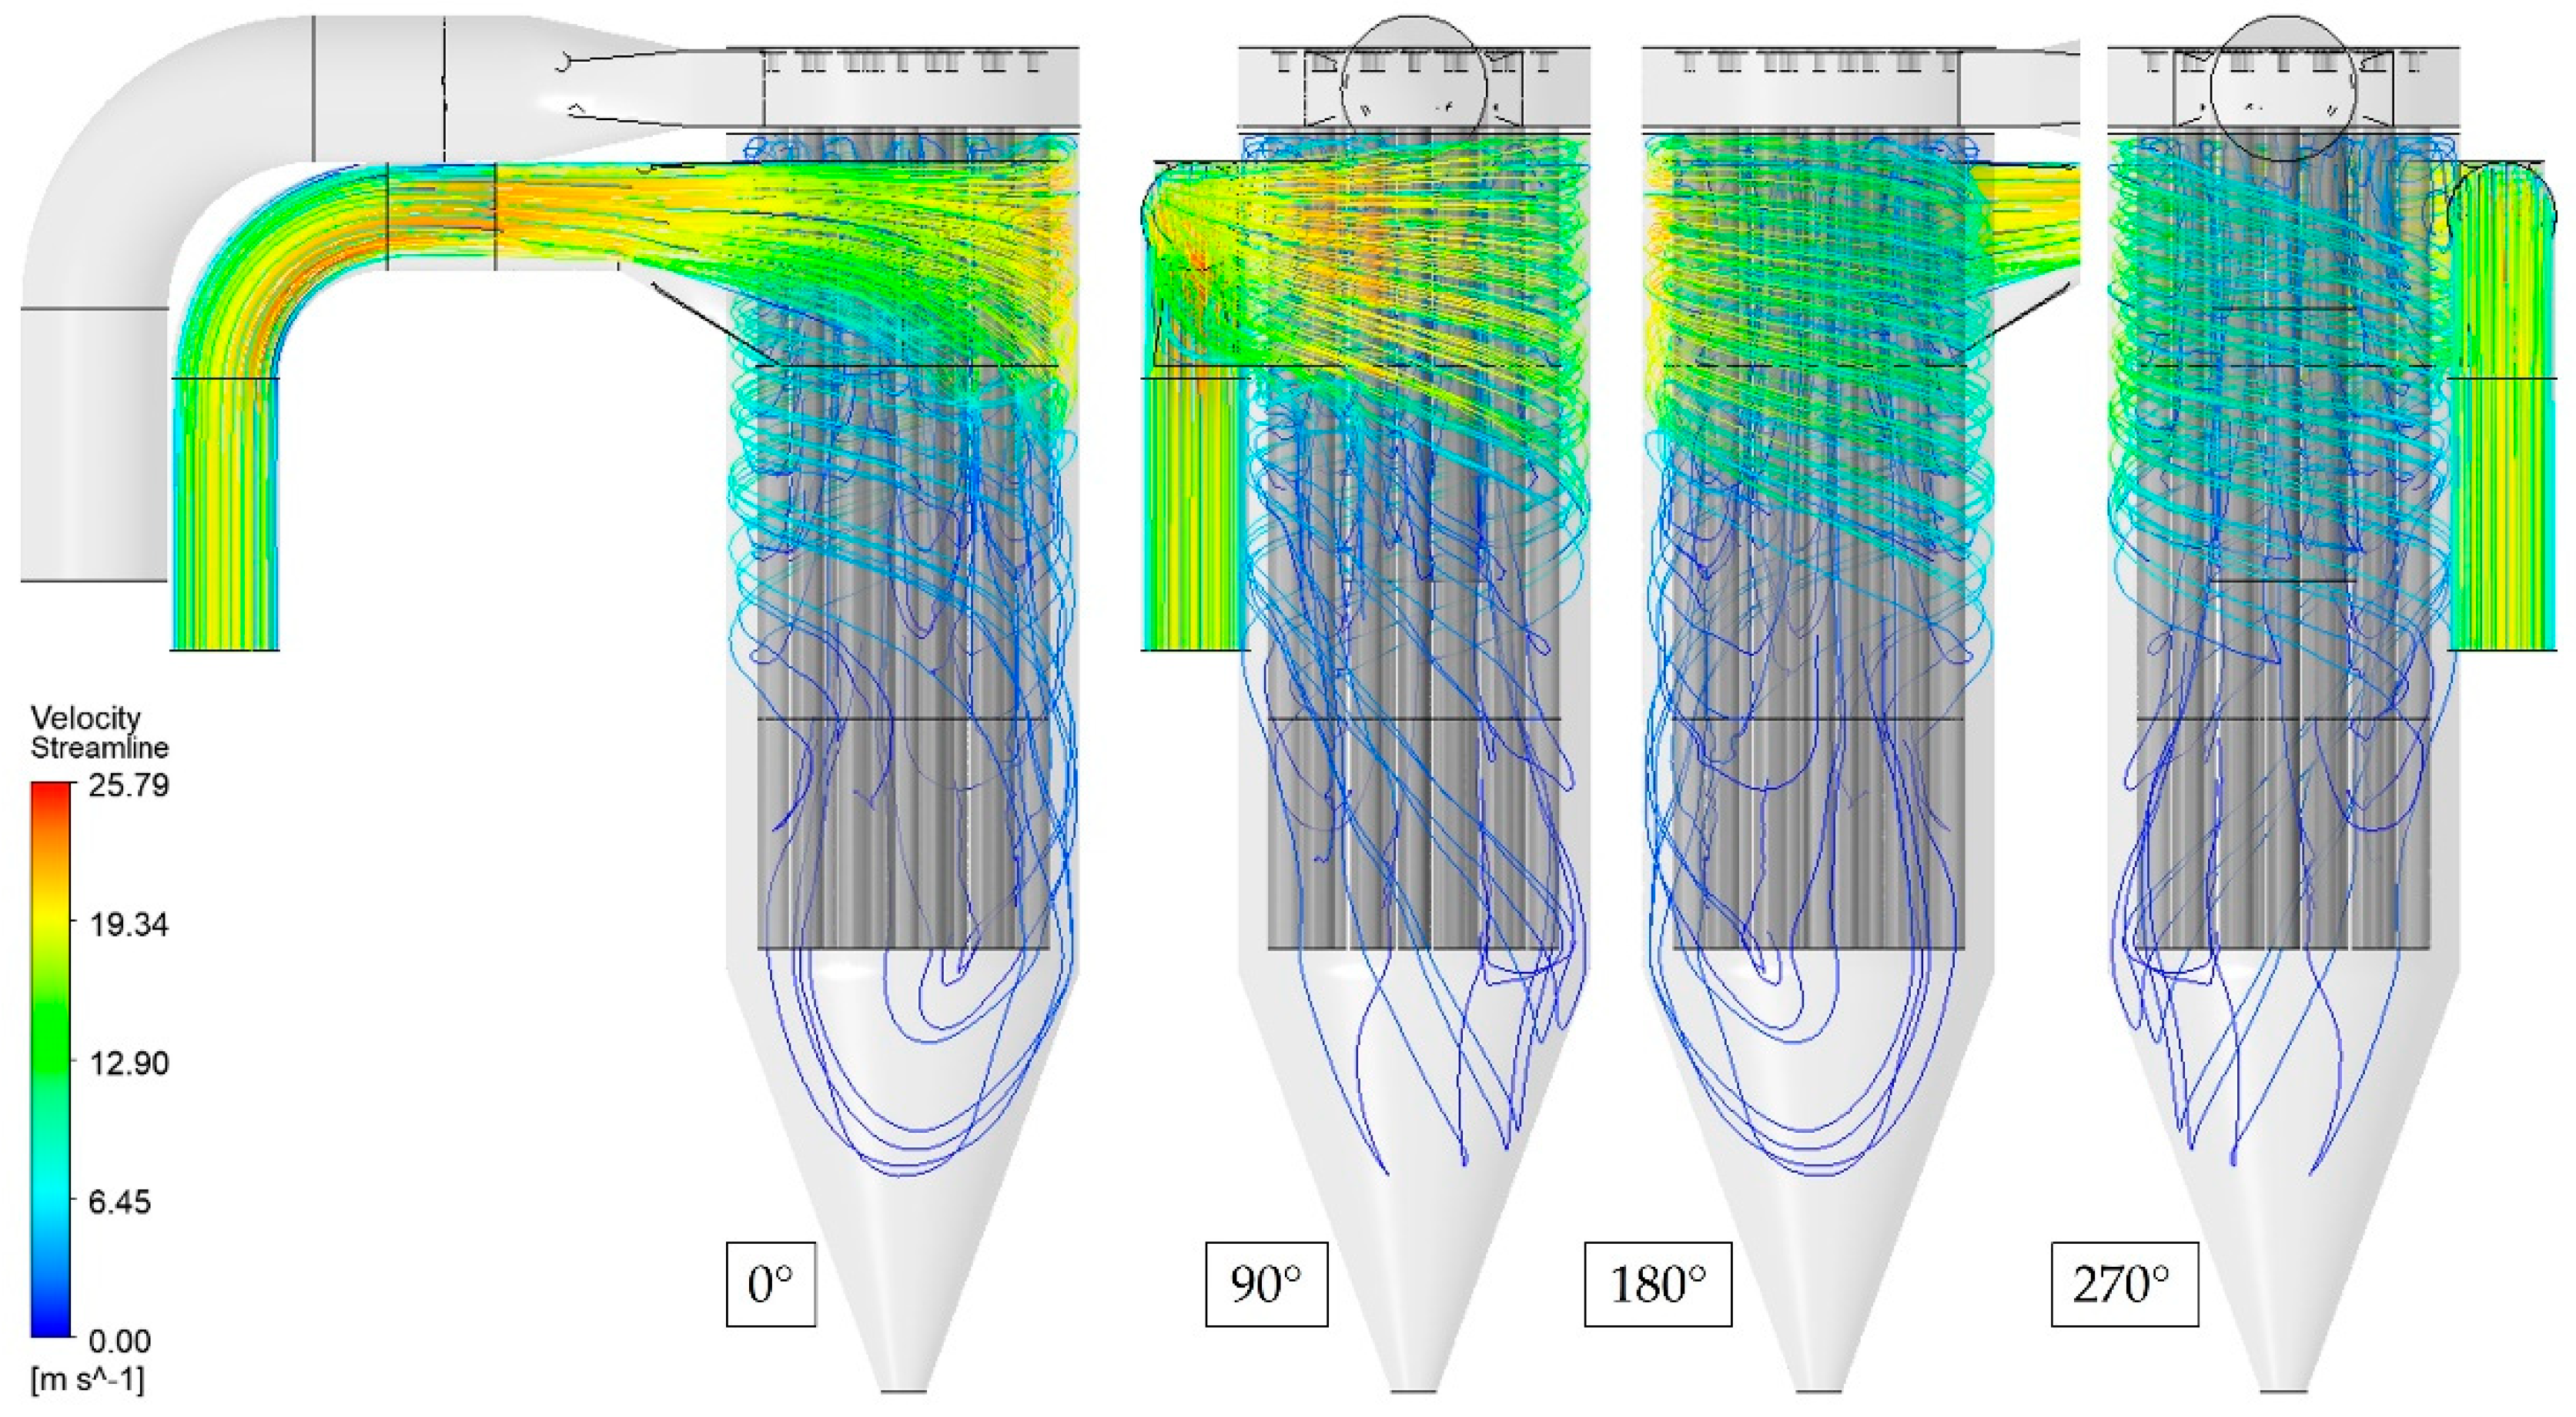
Apart from the division into sectors along the sleeve length, a non-uniformity in clogging among sleeves of the same sector was also hypothesized. To confirm these assumptions, a first simulation with completely clean sleeves was carried out. The flow rates of the air processed by each sleeve, as well as the velocity streamlines inside the domain, were evaluated, confirming both hypotheses. A division of the sleeves into four groups was then performed, clustering the sleeves that processed comparable flow rates into the same group. This division allowed the definition of a “clogging sequence” based on the position of the sleeves with reference to the inlet of the particulate-laden airflow and the magnitude of the flow rate passing through the filtering medium. A simulation campaign was carried out by gradually increasing the levels of clogging, reproduced in the simulation by decreasing the permeability value of the sleeves. In particular, the obstruction conditions of each case were based on the distribution of the flow rates calculated in the previous one, e.g., the conditions of the second simulation were defined according to the results of the first one, and so on. To model the different clogging conditions, the permeability of the filtering medium was gradually decreased, proportionally to the obstruction percentage, according to Equation (1).
where
αc is the sleeve permeability for the case under study,
α is the permeability of the clean sleeve and
c% is the obstruction percentage of the sleeve. The conditions simulated are presented in
Table 3, with the indication of the percentage of clogging of each group of sleeves divided into three longitudinal sectors.
The results of the simulations and the flow field inside the device were finally analyzed to assess the impact of the filter obstruction, with the aim of identifying some locations for additional sensors that would allow monitoring and evaluating the clogging conditions during the real-time functioning of the filter. To this end, the evaluation of the tangential velocity values in the near wall region was performed on four longitudinal lines, displaced at 90° from the other (
Figure 4).
The results of the simulations were also used to quantify the air flow rate passing through each sleeve under different clogging conditions. We referred specifically to the flow rate filtered by the top sector of each sleeve, which is the sector most impacted by the compressed air jet. The results were then used to modify both the sequence and the frequency of cleaning operations with compressed air according to the magnitude of the air flow rate. Since CFD simulations are time-expensive they were launched in advance, building a database containing all their results. This database can then be used for real-time control of the system.
2.3. Data Measurement and Collection
The system draws air from the outdoor environment through an intake duct, having an internal diameter of 400 mm, that leads directly to the inlet volute of the cyclonic bag filter. The flow rate of air is measured by a KIMO differential pressure device equipped with a Debimo air flow measuring blade. The operating principle of this device replicates that of the pitot tube, in which the velocity is calculated based on the difference between total pressure and static pressure; in this case, the measurement is not made at a single point, as in the case of a standard pitot tube, but is obtained by averaging the measurements taken at five different points uniformly distributed along the diameter of the pipe section. The conversion of the differential pressure value into velocity is made according to Equation (2).
where
CM is a conversion coefficient, depending on the geometry of the device, provided by the manufacturer. The technical specifications of the device are provided in
Table 4.
The outlet section of the filter, at the head of the cylindrical body, is connected to the suction section of the fan. The fan, located downstream of the filter, generates a vacuum in the same, and throughout the upstream section. A butterfly valve is installed in the pipeline connecting the filter to the fan. This valve, together with the control of the fan frequency by means of an inverter, allows the regulation of the flow rate processed by the system. The duct at the outlet of the fan returns the flow of purified air to the outdoor environment. At the ends of the filter, the pressure drop generated by the filter itself is monitored with an Endress Hauser Deltabar S PMD75, whose technical specifications are given in
Table 5.
An EE650 hot-wire anemometer was selected to measure the velocities inside the filter, and it was installed in the location identified by the CFD simulations. To install the sensor, a hole was drilled in the cylindrical body wall. The anemometer was then inserted from the outside, and, using the graduated scale, it was placed at the desired acquisition point (taking into account the thickness of the wall). The technical specifications of the sensor are given in
Table 6.
2.4. Experimental Method
Since the pilot plant is not installed in a mill and the air is drawn from the outdoor environment, the airflow is clean; therefore, the sleeve clogging conditions must be artificially reproduced.
The reduction in sleeve permeability was experimentally reproduced by making portions of the sleeves impermeable to the flow, proportionally to the desired percentage of permeability reduction. To reduce the permeability as evenly as possible along the sleeves, completely free sections of filtering material and sections with zero permeability were alternated. The impermeability of the filter fabric was achieved by using food-grade film, which was wrapped over the defined portions of the sleeve according to the desired clogging condition. The choice was made for two reasons: (1) good adhesion of the film on itself, without the need to use adhesives that could damage the surface of the fabric sleeves; (2) flexibility and ease of shaping of the film that allows it to adhere properly to the sleeves, especially with the vacuum created during the system functioning, that tends to suck the film, making it adhere perfectly to the surface.
The specific clogging conditions of Case 1, Case 6 and Case 8 were experimentally reproduced. Permeability values on the various sectors and the respective lengths of the sections to be coated with the plastic film are given in
Table 7.
To have a more homogeneous permeability along each sector, it was decided to divide the area to be covered with film into two bands of equal size, interposing the clean zones in between them, as shown in
Figure 5.
2.5. Digital Twin Development
Based on the results of the simulations, a location for the installation of an additional velocity sensor was determined. Experimental tests were performed by varying the operating conditions, i.e., reproducing three different clogging levels and changing the inlet air flow rate.
For each clogging condition, the air flow rate was varied gradually between 1.89 m
3/s (corresponding to an inlet velocity at the filter of 15 m/s) and 2.83 m
3/s (corresponding to an inlet velocity at the filter of 22.5 m/s). Pressure drops at the ends of the filter and air velocity at the point were recorded by means of a data acquisition system developed in LabView which collected data from all the sensors every 2 s [
54]. The duration of each test was approximately 1 h. Experimental results were then compared with simulation results for validation.
Based on the historical and simulation data collected, a virtual replica of the device was generated. Specifically, the historical data refer to the pressure drop at the ends of the filter and the tangential velocity measured inside the filter at the point identified through simulations. The results of the simulations used in the construction of the digital twin consist of the value of the flow rate passing through each sleeve under the different simulated clogging conditions. This digital model was then connected to the physical counterpart for the near real-time monitoring of the filter, with data logging performed at appropriate time intervals according to the standard operating time scales, as well as trend analysis of the system functioning. Indeed, the trend analysis performed as a moving average of a set number of time steps would allow for the early detection of the onset of malfunctions and the estimation of the remaining useful life. Additionally, simulation data allow real-time correction of the sequence and frequency of compressed air jets, depending on the air flow absorbed by each sleeve, to preserve the correct operating conditions for as long as possible.
2.6. Generation of a Model for Predicting the Service Life of Sleeves from the Historical Data Collected
To develop the digital twin of the cyclone bag filter, first, the digital model was generated based on simulation results and historical experimental data measured by the sensors installed on the plant. Thanks to the data collected, it was possible to model the behavior of the filter at different flow rates, including the variations in the system pressure drop and tangential velocity as the clogging level increased. The connection between the digital and the physical twin was performed using the LabView software connected to a data acquisition (DAQ) module. The sensor data (pressure drop and tangential velocity) were recorded every 30 s, and then a moving average was performed every 60-time steps, in accordance with the typical time scales of these plants. Therefore, one measurement period i corresponds to 30 min.
As described above, currently, sleeve replacement is carried out when the pressure drop generated by the sleeves exceeds a certain threshold value. As a first step, therefore, it is possible to develop a Residual Useful Life (RUL) prediction model based on the trend of pressure drop monitored in real time. The method used to develop such a model is based on the calculation of the sleeve clogging rate per unit of time at time t (Cr,t) to estimate the residual remaining time to reach the maximum admissible clogging (expressed as maximum allowable pressure drop, Δpmax and equal to 15 mbar).
The sleeve clogging rate was estimated by measuring the pressure drop increase per measurement period. To have a prediction as stable as possible, since the air filtration process is susceptible to fluctuations in air flow rate values and consequently in pressure drops, and since the clogging rate is very low (usually sleeves are replaced every year or every year and a half approximately), it was decided to use the moving average method. The pressure drop value at the time t (Δ
pt) was calculated as the average of the values of the previous
n measurement periods, where
n must be sufficiently high to smooth pressure drop fluctuations but not too large, to average between measurement periods in which sleeve permeability has not changed too much.
In addition, especially at the beginning of the sleeve life, since the clogging rate is very slow, there would be a very overestimated prediction of the RUL. For this reason, the value of RUL calculated with the Equations (3)–(5) is always compared with the value of RUL calculated with reference to a planned replacement operation one and a half years after sleeve replacement. The lowest RUL value between the two is always considered.
The pressure value alone, however, can make an accurate prediction only when the operating conditions remain in the standard range. When, for example, the breakage of a sleeve occurs, due to the abrasive effect on it of flour and bran dust, or due to repeated impact with other sleeves, there would be a reduction in pressure drop at the ends of the filter. This reduction in pressure drops, according to Equations (3)–(5) would lead to the calculation of a higher RUL value, when in fact replacement should be planned as soon as possible. Therefore, additional monitoring needs to be combined with pressure drop monitoring for a more accurate assessment of RUL. In this study, we focused on the measured tangential velocity value at the point identified through fluid dynamic simulations. Under standard operating conditions, there is an increasing velocity trend at this point. In the event of a sleeve rupture, a discontinuity in the velocity trend would be recorded at this point, which would then allow the anomaly to be identified.
The presence of simulation and historical data under different conditions lays the foundation for the continuous estimation of the filter clogging level based on the sensor measurements. Furthermore, it allows estimating an expected range of values for the measured data, making it possible to generate immediate alarms if the deviation from the estimates is higher than a limit value. Thanks to continuous data acquisition, it is possible to monitor the trends in the measured values, correlating them to the possible failures potentially affecting the plant [
2,
55,
56]. In particular, the filter condition is estimated based on the difference in the values measured at consecutive measurement periods (see
Table 8). To allow for a better comprehension of the monitored conditions, the trends in the measurements are schematically represented by arrows, in particular: ↑ represents an increase in a measured value compared to previous data; ↑↑ represents a strong increase; → represents a slight variation, lying within the accuracy range of the sensor, that may be traced back to measurement inaccuracies; ↓ and ↓↓ represent a decrease in the measured value and a strong decrease, respectively.
This deviation can be compared to defined reference values (δ
p, Δ
p, δ
v, Δ
v) to detect fault conditions. In particular, δ
p and δ
v account for the sensor accuracy: the clogging rate, as well as possible minor malfunctions, can be monitored according to the variation between the pressure drop and velocity measurements of two consecutive time periods and their comparison with δ
p and δ
v, respectively. Δ
p and Δ
v, on the other hand, represent maximum allowable variations in standard operating conditions, and a variation between consecutive measurements higher than these critical values is likely to indicate severe failures. In this way, it is possible to automatically schedule alarms, and eventually plant arrests, whenever a severe failure is detected. Furthermore, by performing an adequate moving averaging of the data, it is possible to perform a continuous estimation of the RUL (
Figure 6). Thanks to the digital twin, the system monitoring and the detection of failures can be automatically and constantly performed, minimizing human decision making and possible human errors (
Figure 7).
In particular, the method was used to report the occurrence of sleeve breakage and, consequently, generate an alarm and a request for a replacement intervention when the velocity variation between two consecutive time periods exceeded the value of Δv and, at the same time, a pressure drop reduction greater than a threshold value δp was recorded. Obviously, the values of Δv and δp must be defined and calibrated according to the filter geometry, sensors’ characteristics, and operating conditions. In this study, they were set to 0.2 m/s and 0.1 mbar, respectively.
2.7. Generation of a Model for the Real-Time Adjustment of the Sequence and Frequency of Compressed Air Jets
From the simulations conducted under different sleeve clogging conditions, the air flow rate through each sleeve was derived. In particular, the focus was on the upper part of the sleeve (sector 1), as this is where the compressed air jet is most effective in removing the particles trapped in the fabric. The basic hypothesis, supported by experimental evidence reported by both the filter manufacturer and the end users, is that the greater the air flow through the sleeve, the greater the clogging rate. Based on this, it would therefore be recommended to associate the frequency with which compressed air is injected through the sleeve with the air flow rate through it.
Based on the framework described in the previous paragraph, the digital twin can detect whether the system is operating under standard clogging conditions or not.
In the first case, the measured pressure drop value allows the identification of the actual clogging condition. From there, thanks to the simulation performed under those specific clogging conditions, the model is able to trace the air flow rate through each sleeve, and based on that, it can define the optimal sequence and frequency of cleaning operations.
4. Discussion
The results show that the results of the simulations and experimental results are in good agreement. The trends of measured and simulated pressure drops as the air velocity at the filter inlet changes are parallel. The deviation between the curves could be related to the uncertainty in the air velocity measurement with the KIMO sensor, which, due to space constraints, was installed close to a curve. More significant deviations are observed for the pressure drops for case 8, which could be related to the fact that coating the sleeve with the food-grade film is not perfectly equivalent to clogging the sleeve evenly. Obviously, this difference increases as the level of fouling increases, and this is why deviation is more pronounced for case 8 than for case 6.
The velocity trends at the measured point inside the filter are also in agreement. There are more significant deviations in this case, and this may be mainly related to three aspects, which may also explain why the deviations increase as the air flow rate at the filter inlet increases:
The data extracted from the simulation is exclusively related to the tangential component of the velocity vector, while the anemometer reading, although correctly positioned, without taking into account human error, is partially affected by the other velocity components, due to its construction characteristics.
The way the sleeves are constrained to the head of the filter allows them to oscillate, given even the 3 m length, is not constrained to the base or anywhere else. The oscillation can impact the flow field distribution, even significantly affecting the velocity value measured by the sensor.
The presence of areas completely obstructed by the film alternating with completely clean areas affects airflow differently than a sleeve that is uniformly obstructed.
Thus, it can be concluded that the experimental results confirm the correlations between pressure drops and air flow rate and between the measured velocity at the identified point inside the filter and air flow rate. They also confirm that pressure drops increase as sleeve clogging increases and that the air velocity at the identified point inside the filter increases if clogging proceeds in a standard manner.
In this study, it was not possible to validate the model for the real-time adjustment of the sequence and frequency of compressed air jets, whose results are reported in
Table 9. In fact, by using food-grade film to artificially reproduce sleeve clogging, compressed air injections would have been ineffective. It will be necessary in future activities to test and validate this model in a real production setting in order to verify the effectiveness of the proposed method and to optimize both the sequence and the frequency based on experimental evidence.
The digital twin developed, demonstrated that it can accurately predict the sleeves’ RUL and identify failures. At present, it has been trained with data under normal clogging conditions. Future activities will have to focus on experimenting with many more operating conditions to increase its robustness to make it industrially viable. Moreover, simulation results can be used to expand the capabilities of the digital twin by providing data that are of great operational interest but would be physically difficult to acquire (e.g., the upward velocity within the sleeves, the impact velocity against the sleeves, the flow rate filtered by each sleeve, etc.).


