Abstract
Nanofluidic energy absorption system (NEAS) with cascade energy absorption characteristics can absorb energy on different levels simultaneously in one system, which greatly enriches its functions and applications. The pore structure and size distribution of porous media play a crucial role in the design and construction of cascade nanofluidic systems. In this paper, two cascade pore models were constructed using carbon nanotubes with different diameters, one was the model of two tubes with both one end immersed in water (DNEAS), and the other was the model of two tubes end to end, with the end of the big tube immersed in water (SNEAS). The effects of temperature-coupled pore size on the infiltration processes of water molecules into two models were investigated. The fitting correlations between critical pore size difference and temperature were established. The microscopic mechanism of temperature effect was illuminated. With the increase in temperature, systems displaying cascade characteristics transformed into a single-stage system without cascade characteristics. Due to the significant size effect of system temperature, the critical pore difference increased with both system temperature and the pore size. The research results expanded the basic database of cascade nanofluidic systems and provided guidance for the application design of cascade nanofluidic systems.
1. Introduction
Nanofluidic energy absorption system (NEAS) is a kind of energy absorption system smaller and lighter, with higher energy absorption density [1,2]. It has promising applications in the fields of mechanical, thermal, and electrical energy storage [3,4,5,6], for example, anti-crash energy absorbing materials or a high efficiency buffers in the aerospace field [7]. The functional component of a NEAS are nanoporous medium and liquid. With the development of fabrication technologies, more diverse nanoporous media [8,9,10] can be prepared, which greatly enriches the functions and applications of NEAS. It was demonstrated in previous studies that the liquid infiltration behavior in the nano-environment is sensitive to the internal factors such as size and configuration of nanopores [11,12,13], types and concentrations of functional liquids [14,15,16,17,18], and the amount of residual gas [19,20,21], as well as external factors such as temperature [22,23,24,25], loading rate [26,27], and electric field [28,29,30,31,32]. Among which, the size of nanopores plays a decisive role in the influence of infiltration pressure, and configuration influences the transport behavior during the liquid molecules infiltration process.
In previous experimental studies, our team observed two-stage energy absorption characteristics in NEAS composed of ZSM-5 zeolite with two-stage pore structure and deionized water [33]. Sun Yueting also reported two energy absorption platforms during compression test with NEAS composed of ZSM-5 zeolite/β zeolite and deionized water [34]. In addition, there is a limited amount of literature available on the investigation of cascade nanofluidic systems. The cascade NEAS has multiple platforms on the pressure-volume curve, corresponding to multiple pressure thresholds. Thus, it can absorb energy on different levels simultaneously in one system and greatly expand the scope of NEAS. For example, it can be engineered as a lightweight material for the vehicle body or a collision avoidance system in modern automobiles, which can absorb vibrations to enhance ride comfort while also absorbing impact to ensure safety. However, NEAS composed of nano-porous media with different pore size does not necessarily exhibit cascade energy storage characteristics due to the existence of viscous dissipation between liquid–solid phases. It is crucial to determine the critical pore size difference of establishing the NEAS cascade energy storage characteristic, which is indispensable in designing and implementing such a system.
Of all the external effected influences, temperature plays a key role in determining the motion of molecules. The liquid viscosity [35,36] and hydrophobicity [37,38] at the nanoscale are both influenced by temperature, which was utilized for nanofluids forced convection heat transfer [39,40,41] in recent research. The alteration of system temperature will undoubtedly impact the formation of cascade NEAS, and it is widely believed that temperature is one of the most influential factors in manipulating fluid dynamics. Over the past decade, there were great achievements in transporting water through narrow CNTs in experiments and computer simulations [38,42,43]. However, the temperature-dependent transport behavior of liquid infiltrate through nano channels with multiple pore sizes remains unexplored.
Because the pore size distribution of most porous materials use in application is non-uniform [44], it is challenging to experimentally investigate the cascade energy storage properties of nanoporous media. Molecular dynamics simulation provided a novel approach for investigating this field. LAMMPS is a classical molecular dynamics code with a focus on materials modeling. It was used by many scholars to conduct molecular dynamics simulations of liquid transport in nano channels [45]. Cao et al. explored the working mechanism of nano porous energy absorption systems under high-speed impact loading conditions through molecular dynamic simulation., and illuminated the effects of pipe diameter and loading rate [46,47]. Barry et al. established an improved carbon nanocone model using LAMMPS software, and verified the correctness of using LAMMPS software for numerical simulation [48]. Majumder et al. reported molecular dynamics simulations showing spontaneous and continuous filling of a nonpolar carbon nanotube with a one-dimensionally ordered chain of water molecules [49]. Liu et al. conducted research on the temperature-dependent intrusion/adsorption of water molecules into hydrophobic carbon nanotubes and nanoporous carbon [50]. Liu et al. investigated the flow of aqueous solution of sodium chloride driven by the temperature gradient and the performance of voltage generation in CNT [51].
In the present work, molecular dynamics simulations were conducted on two distinct pore configurations to investigate the impact of temperature-coupled pore size of porous media on characteristics of cascade NEAS. The fitting correlation between critical pore size difference and temperature was obtained, and the microscopic mechanism of temperature effect was illuminated. The research findings expanded the fundamental database of cascade NEAS and offer guidance for its application design.
2. Establishment of Molecular Dynamics Model
The pore structure of nanoporous media is intricate, with variations in the sizes of open pores and potential reductions in diameter within individual pore channels [52]. Based on this, two cascade pore models based on carbon nanotubes (CNTs) were developed in this study. One was the model of two tubes with both one end immersed in water (DNEAS), and the other was the model of two tubes connected end to end with the end of the big tube immersed in water (SNEAS). Figure 1a shows the model of DNEAS. Figure 1b shows the model of DNEAS.

Figure 1.
Schematic diagram of the model of NEAS. (a) The model of DNEAS; (b) The model of SNEAS.
In the current model, the carbon nanotubes ranges from CNT(6,6) to CNT(22,22), with the pore sizes ranging from 8.14 Å to 29.83 Å. For intuitive comparison of the pore size influence on energy absorption, the volume of carbon nanotubes was set to be the same in model construction, which was 12.786 nm3. The density of water molecules in the reservoir was 0.998 g/cm3, and the number of water molecules was determined according to the size of the reservoir. To simulate a real NEAS, periodic boundaries were set in the xy direction. The bottom and top plane of the reservoir were rigid carbon atoms. The bottom plane of the reservoir can be moved along the axis, acting like a rigid “piston” to change the volume and the pressure of the reservoir. The top plane of the reservoir where the CNTs immersed in was fixed. Nose-Hoover hot bath [53] was used for system temperature control, the time cascade was set to 1 fs, and the real-time morphology and characteristics of the system were recorded every 1 ps during calculation.
The MD simulations were carried out using LAMMPS, which is a classical molecular dynamics software from Sandia National Laboratory [54]. The COMPASS [55] class2 forcefield was used to describe the solid–liquid Van Der Waals (VDW) interaction, and an extended simple point charge force field potential (SPC/E) was used to simulate water molecules [56]. The non-bonded interatomic (intermolecular) VDW action was calculated by 12-6 Lennard–Jones action potential. The calculation formula was as follows [29]:
where the potential function parameter is: , , , , , , [57]. The cutoff distance for the VDW interaction was set to be 1.3 nm, which was typically used in the MD simulations of water [58]. The SHAKE program was used to constrain the internal geometry of water molecules [59]. The long-range Columbic potential was calculated using the particle–particle particle–mesh (PPPM) method [60].
The pressure of the reservoir was calculated by the molecular interaction potential among water molecules. Select a cubic sampling volume near the entrance of the nanotubes in the three-dimensional reservoir, and Virial’s expression was used [61]:
where is the total number of water molecules in the sampling area; is the Boltzmann constant; is the system temperature, K; and is the volume of the sample area, m3. The second term is to calculate the contribution of two-body action to potential and pressure in each water molecule. The pressure and the volume change of the cell during loading are collected and recorded to determine the infiltration pressure.
The reliability of the MD simulation model was verified with our previous experimental data as published in reference [32]. In the experimental, pressure-volume performance tests were conducted on NEAS composed of ZSM-5 zeolite and deionized water. The critical infiltrate pressure of the system was about 24.86 MPa, and the pores water molecules mainly infiltrated in was around 21.14 Å. Molecular dynamics simulation of water molecules intrude into CNT(15,15) was carried out. The corresponding pore size was 20.34 Å, and water molecules infiltrate under a pressure of 25.45 MPa. Considering that ZSM-5 zeolite used in the experiment has a certain pore size distribution, 21.14 Å was only the average pore size. Hence, it was justifiable that the critical infiltration pressure derived from the experiment marginally deviates from the MD simulation outcomes.
3. Results and Analysis
3.1. Cascade Infiltration Process of Water Molecules into CNTs
Taking the combination of CNT(16,16)+CNT(13,13) as an example, Figure 2 and Figure 3 show the transient process of water molecules invading into carbon nanotubes in DNEAS and SNEAS, respectively. Driven by external pressure, water molecules first invade into CNTs with large pore size and then invade into the smaller CNTs. However, due to the viscous dissipation during water molecules transporting in CNT, the pressure increased gradually during the process of water molecules filling CNT. Although the infiltration pressure was strongly dependent on the pore size of nanoporous media, systems with CNTs featuring multiple pore sizes did not necessarily exhibit cascade energy storage characteristics. When the difference in pore size between CNTs is not significant, water molecules may begin to infiltrate into the smaller tube before the larger one is filled. In such cases, the pressure-volume characteristic curve of the large tube penetration process will merge with that of the small tube penetration process, resulting in a lack of cascade characteristics within the system.

Figure 2.
Instantaneous process of water molecules invading carbon nanotubes in DNEAS.

Figure 3.
Instantaneous process of water molecules invading carbon nanotubes in SNEAS.
The critical infiltration pressure of the system is known to vary with temperature, and the response of the critical infiltration pressure to system temperature change differs from different pores size. In Figure 4, we further extract the pressure-volume characteristics of DNEAS and SNEAS at different system temperatures. As depicted in the figures, when the system temperature was elevated, there was a reduction in the critical infiltration pressure difference between the two tubes. This phenomenon has the potential to cause the loss of cascade characteristics in NEAS. Apply solid line to represent systems with cascade characteristics and dash line to represent systems without cascade characteristics in Figure 4. For DNEAS in Figure 4a, it displays cascade characteristics at system temperatures of 280 K, 300 K, and 320 K. For SNEAS in Figure 4b, it displays cascade characteristics at system temperatures of 280 K and 300 K. Obviously, for NEASs with different configuration, although the components are both CNT(17,17) and CNT(13,13), DNEAS displays cascade characteristics at 320 K, while SNEAS does not.
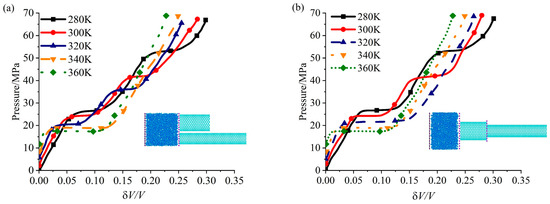
Figure 4.
Variation curves of pressure—volume characteristics of NEASs at different temperatures (CNT17,17+CNT13,13). (a) DNEAS; (b) SNEAS.
The above analysis raises two questions: How do temperature changes affect the cascade characteristics of NEAS? What is the minimum difference between larger and smaller pores for a potential multistage NEAS to display cascade characteristics at different temperatures? We will address these questions in detail by analyzing the critical pore difference and the critical infiltration pressure in the following sections.
3.2. Analysis of Critical Pore Difference
According to the pressure-volume characteristic curve of the system, we can identify whether the system display cascade characteristics under quasi-static loading procedure. Figure 5 shows the pore distribution diagram of cascade characteristics of NEASs at different system temperatures, applying red dots and black dots to distinguish whether the NEAS displays cascade characteristics. Extracting the critical pore difference of cascade NEASs at different system temperatures, the relationships between the critical pore difference of cascade NEASs at different temperatures were drawn in Figure 6. In Figure 5a and Figure 6a, Figure 5b and Figure 6b correspond to DNEAS and SNEAS, respectively.
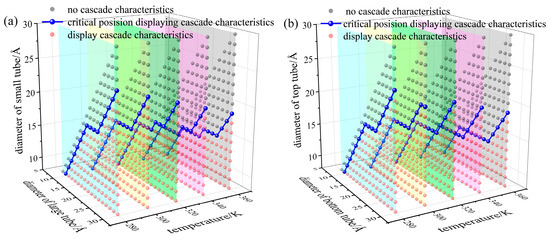
Figure 5.
Pore size distribution of NEASs at different system temperature. (a) DNEAS; (b) SNEAS.
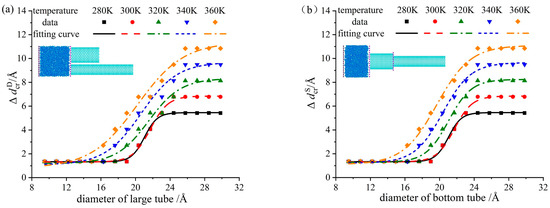
Figure 6.
Critical pore difference varying with the larger tube at different temperatures. (a) DNEAS; (b) SNEAS.
As can be seen from Figure 5, with the increase in temperature, systems displaying cascade characteristics transform into a single-stage system without cascade characteristics. The critical pore difference increases with the lift of system temperature. The smaller the pore size is, the more sensitive the critical infiltration pressure is to temperature. Thus, the changing degree of the critical infiltration pressure of CNT with small pore size is greater than that of CNT with larger pore size under the same temperature gradient. That is, the critical pore difference increases with the increase in the pore size when the system temperature remains unchanged, as shown in Figure 6.
Define the pore difference as the difference between pore size of the large tube and the small tube in DNEAS, , where is pore size of the large tube, and is pore size of the small tube. Define the pore difference as the difference between pore size of the top tube and the bottom tube in SNEAS, , where, is pore size of the bottom tube, and is pore size of the top tube. The minimum pore difference between large and small tubes which enables NEAS to display cascade characteristics is defined as the critical pore difference, written as for DNEAS and for SNEAS. Fitting the dots in Figure 6, the correlation between the critical pore difference and system temperature of DNEAS and SNEAS can be obtained.
In DNEAS:
where the pore of the large is = 8.14~29.83 Å, temperature is T = 280~360 K, the fitting error is 2.81%.
In SNEAS:
where the pore of the bottom tube is = 8.14~29.83 Å, temperature is T = 280~360 K, the fitting error is 3.07%.
3.3. Analysis of Critical Infiltration Pressure
Critical infiltration pressure Pin is defined as the initial pressure for liquid molecules invade nanoporous medium. NEAS with cascade characteristics have second-order critical infiltration pressure. Figure 7 shows the critical infiltration pressure of both large/bottom tube and small/top tube in a certain NEAS at different system temperatures. It can be seen from the figures, the critical infiltration pressure of the small tube (in DNEAS) and the top tube (in SNEAS) decreases with the increase in system temperature. The smaller the pore size, the faster the critical infiltration pressure decreases.
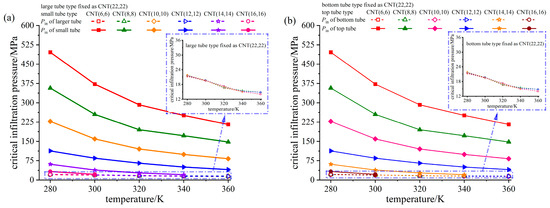
Figure 7.
Critical infiltration pressure of NEASs at different temperatures. (a) DNEAS; (b) SNEAS.
To further illuminate the influence of pore configuration on infiltration process, we calculated the process of water molecules invading into a single tube, namely single tube NEAS, the diameter of which corresponds to the CNTs in DNEAS/SNEAS. Fixing the type of the large/bottom tube (in DNEAS/SNEAS, respectively) as CNT(22,22), the critical infiltration pressure of small/top tube (in DNEAS/SNEAS, respectively) is compared with that of the corresponding single tube NEAS at different temperatures, as shown in Figure 8.
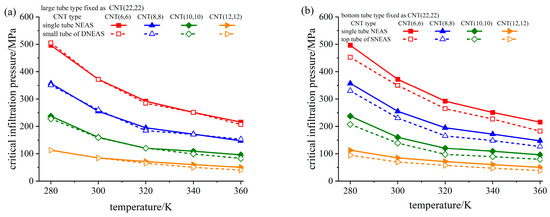
Figure 8.
Comparison of critical infiltration pressure of small/top tube in different NEASs at different temperatures. (a) DNEAS; (b) SNEAS.
As can be seen from Figure 8a, the critical infiltration pressure of the small tube in DNEAS and the critical infiltration pressure of the corresponding single tube basically coincided. In our previous study, infiltration of water molecules into the large tube and the small tube in DNEAS were independent to each other [62]. Thus, the influence of system temperature on the critical infiltration pressure of DNEAS is a superposition of the corresponding single tubes NEAS.
Yet, things were a little different in SNEAS. As can be seen from Figure 8b, the critical infiltration pressure of the top tube in SNEAS was lower than that of the corresponding single tube, and the smaller the pore size, the greater the difference. In SNEAS, the critical infiltration pressure of the top tube decreased with the increase in the diameter of the bottom tube, at a certain temperature [62]. Thus, the critical infiltration pressure of the top tube in SNEAS was lower than that of the corresponding single tube.
The number of hydrogen bond in water determines the density, surface tension, boiling point, and other key properties of water [63]. The change of surface tension will directly lead to the change of critical infiltration pressure. To further analyze mechanism of temperature effect on the cascade characteristics of SNEAS, the number of hydrogen bonds at the entrance of the top CNTs of SNEASs is extracted for comparative analysis in Figure 9, as well as the number of hydrogen bonds of the corresponding single tube NEAS. SNEASs composed of CNT(16,16)+CNT(8,8) and CNT(16,16)+CNT(12,12) were taken as examples. It can be seen from the figure that the number of hydrogen bonds at the entrance of CNT(16,16) in all the three studied systems were consistent at different system temperatures. Consequently, the critical infiltration pressure of water molecules invading into CNT(16,16) were the same, which coincided with the rule found in Figure 7b. With the decrease in pore size, the sensitivity of all system parameters to system temperature increased. With the lift of system temperature, the free energy of the system increased, the intermolecular forces decreased [64], and it was easier to lose hydrogen bonds for water molecules during invading. For the top tube CNT(8,8)/CNT(12,12) in SNEAS, the number of hydrogen bonds at their entrance was less than that of the corresponding single tube NEAS, and decreased significantly with the increase in system temperature.
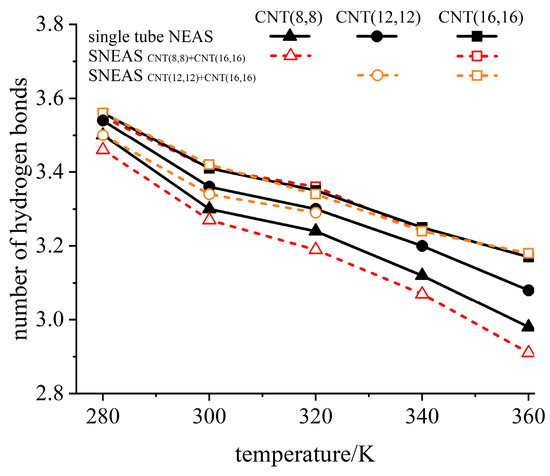
Figure 9.
The relationship between the number of hydrogen bonds and system temperature.
3.4. Analysis of System Energy Absorption
For a NEAS, the total energy absorbed was composed of stored interfacial energy and frictional dissipative energy [23]. Figure 10 shows the variation trend of total energy absorbed of NEASs at different temperatures. As can be seen from the figures, the total energy absorbed by the system decreases with the increase in temperature. Because the neutral and defection-free nanotubes were relatively “smooth” to the flow of water molecules, the friction resistance of the molecular flow was small [7]. The total energy absorbed by the system mainly depended on the interfacial energy stored during the infiltration process. The amount of stored interfacial energy was determined on the critical infiltration pressure and the pore volume of the system. As the pore volume of different CNTs was set to be constant in model construction, the amount of stored interfacial energy mainly depended on the critical infiltration pressure.
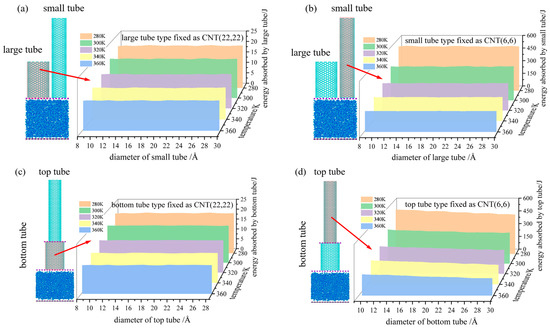
Figure 10.
The total energy absorbed of a certain tube in the constructed NEAS at different temperatures. (a) Total energy absorbed by the large tube; (b) total energy absorbed by the small tube; (c) total energy absorbed by the bottom tube; (d) total energy absorbed by the top tube.
For DNEAS, the total energy absorbed by large (Figure 10a) or small (Figure 10b) tubes were independent to each other. Thus, the energy absorbed by DNEAS was the superposition of the corresponding single tube NEASs. For SNEAS, the total energy absorbed by the bottom tube was constant and independent to the changing of top tube size (Figure 10c). The critical infiltration pressure decreased with the increase in pore size, which was more obvious under lower system temperature [65]. The total energy absorbed by the top tube decreased with the increase in the bottom tube size. The lower the system temperature, the more obvious the decrease trend.
4. Conclusions
The cascade NEAS featured multiple platforms on the pressure-volume curve, enabling it to absorb energy at various levels simultaneously within a single system and significantly broaden the scope of NEAS. Pore size distribution and system temperature are of crucial importance to build cascade NEAS.
The lift of system temperature may transform a NEAS displaying cascade characteristics into a single-stage NEAS. The higher the system temperature, the larger the critical pore difference for NEASs to display cascade characterizes. In DNEAS, the infiltration process of water molecules into two tubes are independent to each other. In SNEAS, water molecules will lose some hydrogen bonds during invading and transporting through the bottom tube, the critical infiltration pressure of the top tube was lower than that of the corresponding single tube. The fitting correlation between critical pore difference and system temperature was for DNEAS, and for SNEAS. It is hoped to be helpful for the design and application of cascade NEAS.
Cascade NEAS exhibited greater potential for application than single-stage NEAS. The infiltration of water molecules into nanopores, as discussed in this study, is driven by pressure. By manipulating system temperature as a driving force, it is possible to achieve hierarchical energy storage and release through control of said temperature.
Author Contributions
Conceptualization, Y.Z. and Y.D.; methodology, Y.Z. and H.X.; validation, H.W. and H.X.; formal analysis, H.X. and S.L.; investigation, H.W.; resources, W.W.; data curation, H.W.; writing—original draft preparation, H.W.; writing—review and editing, Y.Z.; supervision, Y.D.; project administration, Y.Z.; funding acquisition, Y.Z. All authors have read and agreed to the published version of the manuscript.
Funding
This research study was funded by National Natural Science Foundation of China (grant No. 51974246 and 51806173), and Innovative Talent Promotion Program “Young Science and Technology Star Project” of Shaanxi Province in China (grant No. 2021KJXX-40).
Institutional Review Board Statement
Not applicable.
Informed Consent Statement
Not applicable.
Data Availability Statement
The data presented in this study are available within the article.
Conflicts of Interest
The authors declare no conflict of interest.
References
- Chen, X.; Qiao, Y. Science and prospects of using nanoporous materials for energy absorption. MRS Online Proc. Libr. 2007, 205, 1041. [Google Scholar] [CrossRef]
- Liu, Z.; Huang, X.; Liu, R. Voltage generation induced by thermo-driven ion solution flow in CNTs for low-grade thermal energy harvesting. Int. J. Heat. Mass. Transfer. 2023, 202, 123751. [Google Scholar] [CrossRef]
- Fraux, G.; Coudert, F.X.; Boutin, A.; Fuchs, A.H. Forced intrusion of water and aqueous solutions in microporous materials: From fundamental thermodynamics to energy storage devices. Chem. Soc. Rev. 2017, 46, 7421. [Google Scholar] [CrossRef] [PubMed]
- Giacomello, A.; Casciola, C.; Grosu, Y.; Meloni, S. Liquid intrusion in and extrusion from non-wettable nanopores for technological applications. Eur. Phys. J. B 2021, 94, 163. [Google Scholar] [CrossRef]
- Grosu, Y.; Mierzwa, M.; Eroshenko, V.A.; Pawlus, S.; Chorażewski, M.; Nedelec, J.M.; Grolier, J.P.E. Mechanical, thermal, and electrical energy storage in a single working body: Electrification and thermal effects upon pressure-induced water intrusion-extrusion in nanoporous solids. ACS. Appl. Mater. Interfaces 2017, 9, 7044–7049. [Google Scholar] [CrossRef] [PubMed]
- Chen, H.; Xu, Y.; Tong, Y.; Hu, J. The investigation of nanofluidic energy absorption system based on high porosity aerogel nano-materials. Microporous Mesoporous Mater. 2019, 277, 217–218. [Google Scholar] [CrossRef]
- Xu, B.; Wang, B.; Park, T.; Qiao, Y.; Zhou, Q.; Chen, X. Temperature dependence of fluid transport in nanopores. J. Chem. Phys. 2012, 136, 184701. [Google Scholar] [CrossRef]
- Ashok, D.; Bahubalendruni, M.; Mertens, A.J. A novel nature inspired 3D open lattice structure for specific energy absorption. Proc. Inst. Mech. Eng. E J. Process. Mech. Eng. 2022, 263, 2434–2440. [Google Scholar] [CrossRef]
- Pinna, A.; Pia, G.; Casula, M.F.; Delogu, F.; Sogne, E.; Falqui, A.; Pilia, L. Fabrication of nanoporous Al by vapor-phase dealloying: Morphology features, mechanical properties and model predictions. Appl. Sci. 2021, 11, 6639. [Google Scholar] [CrossRef]
- Jee, H.; Jeon, K.; Park, M.J.; Lee, J. Fabrication of large area, ordered nanoporous structures on various substrates for potential electro-optic applications. Appl. Sci. 2021, 11, 12136. [Google Scholar] [CrossRef]
- Li, M.; Xu, L.; Lu, W. Nanopore size effect on critical infiltration depth of liquid nanofoam as a reusable energy absorber. J. Appl. Phys. 2019, 125, 044303. [Google Scholar] [CrossRef]
- Wu, K.; Chen, Z.; Li, J.; Xu, J.; Wang, K.; Li, R.; Wang, S.; Dong, X. Ultrahigh water flow enhancement by optimizing nanopore chemistry and geometry. Langmuir 2019, 35, 8867–8873. [Google Scholar] [CrossRef] [PubMed]
- Maziar, F.T.; Xu, W.; Marshall, B.D.; Ravikovitch, P.I.; Müller, E.A. Significant effect of rugosity on transport of hydrocarbon liquids in carbonaceous nanopores. Energy Fuels 2022, 36, 10026–10042. [Google Scholar]
- Aluru, N.R.; Aydin, F.; Bazant, M.Z.; Blankschtein, D.; Brozena, A.H.; de Souza, J.P.; Elimelech, M.; Faucher, S.; Fourkas, J.T.; Koman, V.B.; et al. Fluids and electrolytes under confinement in single-digit nanopores. Chem. Rev. 2023, 123, 2737–2831. [Google Scholar] [CrossRef] [PubMed]
- Xu, Z.; Wu, S.; Tian, S.; Huang, D.; Xiong, G.; Luo, T. Molecular-level understanding of the effect of water on oil transport in graphene nanochannels. J. Phys. Chem. 2023, 127, 3671–3681. [Google Scholar] [CrossRef]
- Leong, I.W.; Tsutsui, M.; Murayama, S.; Hayashida, T.; He, Y.; Taniguchi, M. Quasi-stable salt gradient and resistive switching in solid-state nanopores. ACS. Appl. Mater. Interfaces 2020, 12, 52175–52181. [Google Scholar] [CrossRef]
- Ma, P.; Zheng, J.; Zhao, D.; Zhang, W.; Lu, G.; Lin, L.; Zhao, Z.; Huang, Z.; Cao, L. The selective transport of ions in charged nanopore with combined multi-physics fields. Materials 2021, 14, 7012. [Google Scholar] [CrossRef]
- Liu, L.; Chen, X.; Lu, W.; Han, A.; Qiao, Y. Infiltration of electrolytes in molecular-sized nanopores. Phys. Rev. Lett. 2009, 102, 184501. [Google Scholar] [CrossRef]
- Qiao, Y.; Cao, G.; Chen, X. Effects of gas molecules on nanofluidic behaviors. J. Am. Chem. Soc. 2007, 129, 2355–2359. [Google Scholar] [CrossRef]
- Sun, Y.; Li, P.; Qiao, Y.; Li, Y. Time-dependent gas-liquid interaction in molecular-sized nanopores. Sci. Rep. 2014, 4, 6547. [Google Scholar] [CrossRef]
- Zhang, Y.; Luo, R.; Zhou, Q.; Chen, X.; Dou, Y. Effect of degassing on the stability and reversibility of glycerol/ZSM-5 zeolite system. Appl. Sci. 2018, 8, 1065. [Google Scholar] [CrossRef]
- Kong, X.; Qiao, Y. Thermal effects on pressure-induced infiltration of a nanoporous system. Philos. Mag. Lett. 2005, 85, 331–337. [Google Scholar] [CrossRef]
- Zhang, Y.; Li, N.; Luo, R.; Zhang, Y.; Chen, X. Experimental study on thermal effect on infiltration mechanisms of glycerol into ZSM-5 zeolite under cyclic loadings. J. Phys. D 2015, 49, 025303. [Google Scholar] [CrossRef]
- Salman, S.; Zhao, Y.; Zhang, X.; Su, J. Effect of temperature on the coupling transport of water and ions through a carbon nanotube in an electric field. J. Chem. Phys. 2020, 153, 184503. [Google Scholar] [CrossRef]
- Fraux, G.; Boutin, A.; Fuchs, A.; Coudert, F.X. Structure, dynamics and thermodynamics of intruded electrolytes in ZIF-8. J. Phys. Chem. C 2019, 25, 123. [Google Scholar] [CrossRef]
- Surani, F.B.; Kong, X.; Panchal, D.; Qiao, Y. Energy absorbed of a nanoporous system subjected to dynamic loadings. Appl. Phys. Lett. 2005, 87, 163111. [Google Scholar] [CrossRef]
- Sun, Y.; Rogge, S.M.; Lamaire, A.; Vandenbrande, S.; Wieme, J.; Siviour, C.R.; Van Speybroeck, V.; Tan, J.C. High-rate nanofluidic energy absorption in porous zeolitic frameworks. Nat. Mater. 2021, 20, 1015–1023. [Google Scholar] [CrossRef] [PubMed]
- Xu, B.; Qiao, Y.; Li, Y.; Zhou, Q.; Chen, X. An electroactuation system based on nanofluids. Appl. Phys. Lett. 2011, 98, 221909. [Google Scholar] [CrossRef]
- Ritos, K.; Borg, M.K.; Mottram, N.J.; Reese, J.M. Electric fields can control the transport of water in carbon nanotubes. Philos. Trans. R. Soc. A 2016, 374, 20150025. [Google Scholar] [CrossRef]
- Russell, W.S.; Lin, C.Y.; Siwy, Z.S. Gating with charge inversion to control ionic transport in nanopores. ACS. Appl. Nano Mater. 2022, 5, 17682–17692. [Google Scholar] [CrossRef]
- Zhang, X.; Liu, Y.; Su, J. Promoting Electroosmotic water flow through a carbon nanotube by weakening the competition between cations and anions in a lateral electric field. Langmuir 2022, 38, 3530–3539. [Google Scholar] [CrossRef]
- Zhang, Y.; Zhang, J.; Luo, R.; Dou, Y. Experimental study on the effects of applied electric field on liquid infiltration into hydrophobic zeolite. Energies 2023, 16, 5065. [Google Scholar] [CrossRef]
- Zhang, Y.; Zhou, Q.; Chen, X.; Dou, Y. Nanofluidic Energy Absorption/Conversion System and Its Application, 1st ed.; Xi ’an Jiaotong University Press: Xi ’an, China, 2019; pp. 67–72. [Google Scholar]
- Sun, Y. Study on Energy Dissipation Mechanism of Liquid System of Nanometer Porous Material for Vehicle. Doctor’s Thesis, Tsinghua University, Beijing, China, 2015. [Google Scholar]
- Gu, H.; Marth, J.D.; Orban, P.C.; Mossmann, H.; Rajewsky, K. Deletion of a DNA polymerase β gene segment in T cells using cell type-specific gene targeting. Science 1994, 265, 100–103. [Google Scholar] [CrossRef] [PubMed]
- Zhang, L.; Wu, K.; Chen, Z.; Li, J.; Yu, X.; Yang, S.; Hui, G.; Yang, M. Quasi-continuum water flow under nanoconfined conditions: Coupling the effective viscosity and the slip length. Ind. Eng. Chem. Res. 2020, 59, 20504–20514. [Google Scholar] [CrossRef]
- Vaitheeswaran, S.; Rasaiah, J.C.; Hummer, G. Electric field and temperature effects on water in the narrow nonpolar pores of carbon nanotubes. J. Chem. Phys. 2004, 121, 7955–7965. [Google Scholar] [CrossRef] [PubMed]
- Thiemann, F.L.; Schran, C.; Rowe, P.; Müller, E.A.; Michaelides, A. Water flow in single-wall nanotubes: Oxygen makes It slip, hydrogen makes it stick. ACS. Nano 2022, 16, 10775–10782. [Google Scholar] [CrossRef]
- Alghamdi, M.; Memon, A.A.; Muhammad, T.; Ali, M.R. A numerical investigation of a photovoltaic thermal system contained a trapezoidal channel with transport of silver and titanium oxide using the water as base fluids. Case Stud. Therm. Eng. 2023, 47, 103056. [Google Scholar] [CrossRef]
- Usman, M.A.A.; Alghamdi, M. A forced convection of water aluminum oxide nanofluid flow and heat transfer study for a three dimensional annular with inner rotated cylinder. Sci. Rep. 2022, 12, 16735. [Google Scholar] [CrossRef]
- Laouira, H.; Mebarek-Oudina, F.; Hussein, A.K.; Kolsi, L.; Merah, A.; Younis, O. Heat transfer inside a horizontal channel with an open trapezoidal enclosure subjected to a heat source of different lengths. Heat. Transfer. 2020, 49, 406–423. [Google Scholar] [CrossRef]
- Bui, A.T.; Thiemann, F.L.; Michaelides, A.; Cox, S.J. Classical quantum friction at water–carbon interfaces. Nano Lett. 2023, 23, 580–587. [Google Scholar] [CrossRef]
- Zhao, J.; Liu, L.; Culligan, P.J.; Chen, X. Thermal effect on the dynamic infiltration of water into single-walled carbon nanotubes. Phys. Rev. E Stat. Nonlin. Soft. Matter. Phys. 2009, 80, 061206. [Google Scholar] [CrossRef]
- Faucher, S.; Aluru, N.; Bazant, M.Z.; Blankschtein, D.; Brozena, A.H.; Cumings, J.; Pedro de Souza, J.; Elimelech, M.; Epsztein, R.; Fourkas, J.T.; et al. Critical knowledge gaps in mass transport through single-digit nanopores: A review and perspective. J. Phys. Chem. C 2019, 123, 21309–21326. [Google Scholar] [CrossRef]
- Alessio, A.; Stavros, K. Molecular simulation of water in carbon nanotubes. Chem. Rev. 2008, 108, 5014–5034. [Google Scholar]
- Cao, G. Working mechanism of nanoporous energy absorption system under high speed loading. J. Phys. Chem. C 2012, 116, 8278–8286. [Google Scholar] [CrossRef]
- Cao, G. Nanofluidic energy damper: Modeling, simulation and analysis. Mol. Phys. 2022, 7, 237–259. [Google Scholar] [CrossRef]
- Cox, B.J.; Hill, J.M. Carbon nanocones with curvature effects close to the vertex. Nanomaterials 2018, 8, 624. [Google Scholar] [CrossRef] [PubMed]
- Chen, X.; Cao, G.; Han, A.; Punyamurtula, V.K.; Liu, L.; Culligan, P.J.; Kim, T.; Qiao, Y. Nanoscale fluid transport: Size and rate effects. Nano Lett. 2008, 8, 2988–2992. [Google Scholar] [CrossRef]
- Hummer, G.; Rasalah, J.G.; Noworyta, J.P. Water conduction through the hydrophobic channel of a carbon nanotube. Nature 2001, 414, 188–190. [Google Scholar] [CrossRef]
- Majumder, M.; Chopra, N.; Andrews, R.; Hinds, B.J. Nanoscale hydrodynamics: Enhanced flow in carbon nanotubes. Nature 2005, 44, 438. [Google Scholar] [CrossRef]
- Liu, L.; Zhao, J.; Culligan, P.J.; Qiao, Y.; Chen, X. Thermally responsive fluid behaviors in hydrophobic nanopores. Langmuir 2009, 25, 11862–11868. [Google Scholar] [CrossRef]
- Hoover, W.G. Canonical dynamics: Equilibrium phase-space distributions. Phys. Rev. A 1985, 31, 1695–1697. [Google Scholar] [CrossRef] [PubMed]
- Kumar, G.; Mishra, R.R. Introduction to molecular dynamics simulations. Lect. Notes Appl. Comput. 2022, 99, 1–19. [Google Scholar]
- Sun, H. Compass: An ab initio force-field optimized for condensed-phase applications—Overview with details on alkane and benzene compounds. J. Phys. Chem. B 1998, 102, 7338–7364. [Google Scholar] [CrossRef]
- Berendsen, H.J.C.; Grigera, J.R. The missing term in effective pair potentials. J. Phys. Chem. 1987, 91, 6269–6271. [Google Scholar] [CrossRef]
- Werder, T.; Walther, J.H. On the water− carbon interaction for use in molecular dynamics simulations of graphite and carbon nanotubes. J. Phys. Chem. B 2003, 107, 1345–1352. [Google Scholar] [CrossRef]
- Joseph, S.; Aluru, N.R. Why are carbon nanotubes fast transporters of water. Nano Lett. 2008, 8, 452–458. [Google Scholar] [CrossRef] [PubMed]
- Ryckaert, J.P.; Ciccotti, G. Numerical integration of the cartesian equations of motion of a system with constraints: Molecular dynamics of n-alkanes. J. Comput. Phys. 1977, 23, 327–341. [Google Scholar] [CrossRef]
- Hockney, R.W.; Eastwood, J.W. Computer Simulation Using Particles, 1st ed.; CRC Press: Boca Raton, FL, USA, 1988; pp. 266–304. [Google Scholar]
- Aidan, P.T.; Steven, J.P.; Mattson, W. General formulation of pressure and stress tensor for arbitrary many-body interaction potentials under periodic boundary conditions. Chem. Phys. 2009, 131, 154107. [Google Scholar]
- Zhang, Y.; Xiao, H. Research on the influence of pore size on the characteristics of cascade nanofluidic energy absorption systems. J. Mol. Sci. 2023; accepted. [Google Scholar]
- Chakraborty, S.; Kumar, H.; Dasgupta, C.; Maiti, P.K. Confined water: Structure, dynamics, and thermodynamics. Acc. Chem. Res. 2017, 50, 2139–2146. [Google Scholar] [CrossRef]
- Fecko, C.J. Ultrafast hydrogen-bond dynamics in the infrared spectroscopy of water. Science 2003, 301, 1698–1702. [Google Scholar] [CrossRef] [PubMed]
- Lu, H.M.; Jiang, Q. Size-dependent surface tension and tolman’s length of droplets. Langmuir 2005, 21, 779–781. [Google Scholar] [CrossRef] [PubMed]
Disclaimer/Publisher’s Note: The statements, opinions and data contained in all publications are solely those of the individual author(s) and contributor(s) and not of MDPI and/or the editor(s). MDPI and/or the editor(s) disclaim responsibility for any injury to people or property resulting from any ideas, methods, instructions or products referred to in the content. |
© 2023 by the authors. Licensee MDPI, Basel, Switzerland. This article is an open access article distributed under the terms and conditions of the Creative Commons Attribution (CC BY) license (https://creativecommons.org/licenses/by/4.0/).