Abstract
Trajectory similarity search (TSS) is a common operation for spatiotemporal data analysis. However, the existing TSS methods are mainly focused on GPS trajectories produced by moving objects such as vehicles. Further, these corresponding optimization strategies cannot be directly applied in the metro scenario because the metro passenger trajectory is totally different from the GPS trajectory. To fill this gap, we systematically analyze the unique spatiotemporal characteristics of metro passenger trajectories and propose a similarity search solution named PMMTss for the metro system. The core idea of this solution has two key points: first, we design a multi-layer index based on the spatiotemporal feature of metro trajectories, and all points of a trajectory are stored in this index. Second, we design a parallel multi-way merging-based trajectory similar search method, in which the candidate trajectory segments are merged and filtered. We evaluate this solution on a large dataset (Shenzhen Metro data for 3 consecutive months, 6.976 million trajectories with 260 million records). When lengths of input trajectories are 16, 32, and 64, respectively, the corresponding search times are 0.004 s, 0.016 s, and 0.036 s, respectively. Compared to the baseline PPJion+, the query times are reduced by 99.7%, 98.8%, and 97.6%, respectively.
1. Introduction
A modern metro system plays a crucial role in public transportation systems due to its efficiency, punctuality, and comfort. As the urban population and the metro network grows, the number of records collected by the automatic fare collection (AFC) system in the metro is growing rapidly. In the case of the Shenzhen Metro system, as of January 2019, there are eight lines with a total of 166 stations, and the number of active smart cards has exceeded 10 million. Every day, three million passengers choose the metro as their traffic way on average. In detail, each record contains information such as smart card ID, timestamp, station name, and the flag of entry or exit. The entire metro system collects 24 million records per day on average, the corresponding number of records produced in each month is 690 million, and the corresponding number of records produced in six months is 4.2 billion. These historical ticket records not only contain the trajectory of individual passenger, but also contain the movement patterns of millions of passengers [1,2]. How to manage and mine this valuable dataset is a popular research topic.
The ability to store and analyze this trajectory dataset is the foundation for the downstream applications [3,4]. For example, in an epidemic investigation, it is necessary to quickly determine which passengers have a spatiotemporal intersection with a passenger who is tested positive for COVID-19. However, it is a challenging task to conduct a similarity search on a dataset with millions of passenger trajectories. Currently, the most existing trajectory similarity research is focusing on GPS trajectories produced by moving objects, such as vehicles and mobile devices. The corresponding indexes and filtering strategies are designed according to the spatiotemporal features of GPS trajectories. However, these trajectories produced by smart cards in metro transportation systems present totally different spatiotemporal features from GPS trajectories. Thus, it is hard to apply these GPS-oriented solutions to trajectory similarity searches in metro transportation systems.
To fill this gap, in this paper, we design and implement a trajectory similarity search solution for millions of metro passengers. The core idea of this solution has two points, the first is a point-based multi-layer spatiotemporal index and the second is a parallel multi-way merging-based search algorithm. Compared with the traditional method, our solution does not generate complete trajectories in advance, all points in a trajectory are scattered and stored in the spatiotemporal index. In detail, it first partitions all points into different groups by station name in the first layer, then it further divides the timeline into different intervals in the second layer and each point in a group is assigned to a particular interval. As to the search algorithm, it is executed in multiple rounds. In the first round, a group of tasks takes a query trajectory as input, and get candidate points from the index, generating candidate trajectory segments. In other rounds, candidate trajectory segments are merged by the same trajectory identity and the filtering strategy is conducted. Finally, a group of trajectories is returned, each of which satisfies that the similarity between it and the query trajectory is large than a predefined threshold.
To evaluate the proposed method, we design and conduct a group of extensive experiments. We first implement PPJoin+ [5], the state-of-art string similarity search algorithm, as the baseline for evaluation. Then, we conduct a systematic comparison between PMMTss and PPJion+. Finally, we evaluate the effectiveness of the indexing and the filtering strategy of PMMTss.
In summary, our key contributions are as follows.
First, we design and implement an effective similarity search method called PMMTss for metro passenger trajectories. PMMTss has two key points, a multi-layer spatiotemporal index, and a parallel multi-way merging-based trajectory search algorithm. PMMTss provides a flexible search interface and implements a filtering strategy to speed up the search process.
Second, we extend the PPJoin+, which is the state-of-the-art of string similarity search algorithm, to support trajectory similarity search for metro systems.
Third, we evaluate the PMMTss on a large-scale real-world dataset, which contains 6.785 million trajectories collected from the Shenzhen Metro in three consecutive months. The experimental results show that: (1) the lengths of sample trajectories are 16, 32, and 64, respectively, and the corresponding search times are 0.004 s, 0.016 s and 0.036 s, respectively. (2) Compared with the benchmark PPJion+, the search time is reduced 99.7%, 98.8% and 97.6%, respectively. In summary, our solution achieves a highly efficient search and low-cost deployment simultaneously.
2. Background and Motivation
In this section, we first introduce trajectory similarity search in the metro transportation system. Then, we discuss the different spatiotemporal characteristics between the metro and GPS trajectories. Thirdly, we illuminate the reason why we choose PPJion+ as the baseline experiment. Finally, we introduce the motivation of our research.
2.1. Trajectory Similarity Search in Metro System
Trajectory similarity search (TSS) is widely used in epidemic prevention and control during epidemics. For example, in an epidemic investigation, it is necessary to quickly determine which passengers have a spatiotemporal intersection with a passenger who is tested positive for COVID-19. From the view of a technical perspective, it is a trajectory spatiotemporal intersection (TSI), which is a subset of trajectory similarity search (TSS).
We take an example described in Figure 1 to illuminate the difference between trajectory spatiotemporal intersection and trajectory similarity search. As shown in Figure 1, there are three trajectories, including , and , were produced by three different passengers in the metro system. The y-axis and z-axis represent a plane for the metro network, and the x-axis means the time dimension. and show the same travel pattern, they visit the same station sequence at different time stamps, while and do not share the same travel pattern. Thus, the similarity score of TSS between and is larger than that between and . As we can see from Figure 1, and share two common spatiotemporal points, which means that they almost simultaneously enter and exit these two stations. However, and do not share any common spatiotemporal point. Thus, the score of TSI between and is larger than that between and .
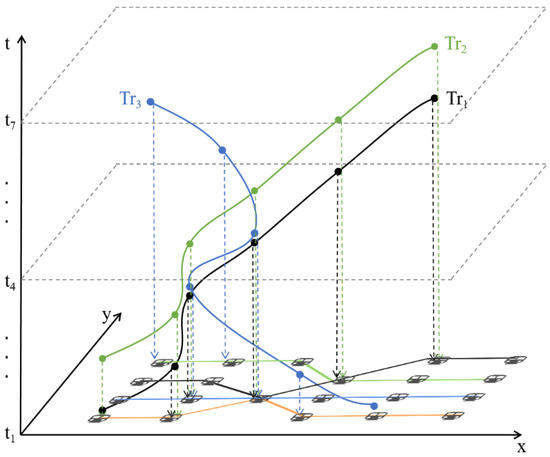
Figure 1.
The difference between trajectory spatiotemporal intersection (TSI) and trajectory similarity search (TSS).
2.2. Comparison between the Characteristics of Metro Trajectory and GPS Trajectory
There are significantly different characteristics between metro trajectory and GPS trajectory. Details are listed in Table 1. The main reason for these differences lies in the data sampling methods of the two trajectories. Specifically, GPS trajectories usually use positioning devices for high-frequency data recording, so each GPS trajectory usually consists of thousands of trajectory points per trip. However, the metro trajectory is produced by the smart card records collected by the automatic fare collection (AFC), and each trip of metro trajectory has only two points, namely, the original and destination stations and the spatiotemporal information. In addition, due to the precision of GPS positioning devices, the GPS trajectory usually has serious noises, while the metro trajectory is very accurate. Thus, it is hard to apply GPS-oriented solutions to trajectory similarity searches in metro transportation systems.

Table 1.
Characteristic differences between metro trajectory and GPS trajectory.
2.3. The Baseline Based on PPJion+
Having systematically analyzed the characteristics of the metro trajectory and the GPS trajectory, we believe that the trajectory similarity search for the metro system is more similar to the string similarity when compared with the GPS trajectory similarity search. This is because the location of a trajectory point in the metro system is a specific station. Based on this feature, we can divide the timeline into different intervals. Then, we can treat each point in a trajectory as a character in a string. Thus, we only need to compare the time dimension when we measure the similarity of two different points. Further, we can measure the similarity of two different metro trajectories.
Ref. [6] has conducted a comprehensive performance evaluation on different string similarity search methods. The results show that PPJoin+ [5] is the best one among these methods. PPJoin+ has designed three filtering strategies: length filtering, position-based prefix filtering, and position-based suffix filtering, respectively. These filtering strategies effectively reduce unnecessary calculations on candidate trajectories, accelerating the search procedure.
Although GLTC [7] has studied trajectory similarity problems in metro transportation systems, it did not adopt the solution of PPJoin+ because it is hard to apply PPJion+ to the scenario of GLTC. PPJion+ was originally used to solve the string similarity search in a string set. It designs a uniform index for a string set and three corresponding filtering strategies. We can extend PPJion+ in trajectory similarity search if we take a point in trajectory as a character in a string. However, the limitation is that PPJion+ can only handle one type of trajectory produced by the same device. Meanwhile, GLTC involved two types of trajectories: one is the trajectory produced by the smart card and the other is the trajectory produced by the Wi-Fi signal of a mobile device. It is hard to build a uniform index for different types of trajectories with totally different sampling rates and accuracy.
Therefore, we chose PPJoin+ as the baseline for evaluating our solution, PMMTss.
2.4. Motivation
We have extended PPJoin+ to support trajectory similarity search in metro scenarios and performed a comprehensive evaluation on PPJoin+. The experimental results show that it still takes several seconds for PPJion+ to perform the similarity search for massive metro trajectories. For example, given a sample trajectory with a length of 64 points, it takes 15 s to perform the similarity search among the 6.95 million trajectories. It shows that there is great potential to improve the search performance of PPJoin+. We deeply analyzed the execution procedure of the PPJion+, and we found that it produces a full trajectory in advance; then, we build an index and searched for the target trajectory among the trajectories. Although PPJion+ have designed a group of effective filtering strategy, it still has to access all items in the trajectory set.
In summary, we try to explore a solution for trajectory similarity search for metro scenarios. This solution can efficiently organize the trajectory and offer a fast and accurate search service. This is the motivation for our study.
3. Related Work
Trajectory similarity search is a foundational operation for many spatiotemporal analysis applications. It can be used for a real-time recommendation system [2,8,9] and urban planning scenarios [3,10]. Many works [10,11,12,13,14,15,16,17,18,19,20,21,22,23,24] are devoted to further exploration of the similarity of the trajectory.
Many works have been done on trajectory similarity search for different purposes [12,13,14,16,17,18,19,20,21,22,23,24]. Generally, these works adopt a two-stage search solution. Before these two stages, it abstracts spatiotemporal features from the trajectory dataset and builds an index for all trajectories. In the filtering stage, unnecessary computations are pruned via this index. In detail, based on this index and a predefined similarity measure function, the upper and lower bounds of similarity between the input trajectory and the candidate trajectory can be inferred. In the refinement stage, these candidate trajectories are validated by the similarity measure function and a threshold. A candidate will be saved in the final result if its similarity score is larger than the threshold.
Further, these index-based methods can be classified into three categories: spatial partition tree [20,21], spatiotemporal grid [15,20], and distributed index, respectively [18,19]. The first category firstly builds a partition tree by the MBR (minimum bounding rectangle) of the trajectory dataset, whose MBR does not intersect with the MBR of the target trajectory and can be pruned. The second category firstly divides the time and space dimensions into a set of uniform grids and assigns each grid with a unique geographical code. For a given target trajectory, it can quickly identify a grid that has an intersection of the region produced by the target trajectory. The third often builds a two-layer distributed index, the global index and the local index. The search algorithm adopts the global and local index to accelerate the filtering and refining stages. In order to handle a large volume of trajectory datasets, a set of studies resort to big data technology to conduct trajectory similarity searches. For example, a group of studies is implemented on Map Reduce [16,24], while a group of studies is implemented on Spark [12,16,19,21]. Other parallelized trajectory similarity search algorithms are implemented on CPU [15,18,23] or GPU clusters [22].
However, most studies of them take GPS trajectory as the research object, and few works have been proposed to discuss trajectory similarity search in metro scenarios. In addition, their corresponding optimal strategies of aforementioned solutions are designed for GPS trajectory, it is hard to apply such kind of solution on trajectory similarity search in the metro scenario. The reason is that metro trajectories have significantly different spatiotemporal characteristics from GPS trajectories. For example, the sampling rate and positioning accuracy, details already discussed in Section 2.1.
GLTC [7] has studied trajectory similarity join and data fusion in the metro transportation system. The differences between PMMTss and GLTC are two fold. Firstly, the problems they addressed are different. PMMTss is to resolve trajectory similarity search while GLTC is to address trajectory similarity join. The former is a kind of lightweight query on one trajectory dataset, which takes a query trajectory and a threshold as inputs, and outputs a set of similar trajectories. The latter is a compute-intensive task, which conducts pair-wise trajectory similarity calculation across different trajectory datasets. Secondly, the similarity measure functions are different. The trajectory similarity function of PMMTss is to measure the same type of trajectories produced by smart cards, which is derived from Jaccard and LCSS. It is an explicit method, which means that the more times they appear in the same station at the same time, the more similar they are. The trajectory similarity function of GLTC is to measure two different types of trajectories, one is the trajectory produced by the smart card records and the other is the trajectory produced by the Wi-Fi signal records of mobile devices. It is an implicit method, which needs to infer the possible route in advance, and then the function can be applied.
Our study plans to fill this gap, it is one of the first to delicately design an index and algorithm for trajectory similarity search in the metro system.
4. Problem Definition
The purpose of a metro trajectory similarity search is to find a group of passengers whose trajectories have a high degree of spatiotemporal overlap with the target trajectory. To help understand metro trajectory similarity search, the following definitions are provided.
Definition 1.
(Point): A point of a GPS trajectory is commonly represented by three fields, time, longitude and latitude, . However, in a metro trajectory, the longitude and latitude of a point can be replaced by a station name . In addition, is the flag, which represents the passenger entering () or leaving () the metro station. The point of metro trajectory is defined as follows:
Definition 2.
(Trajectory): A trajectory of a metro passenger is made up of a card ID and a series of ordered points. Moreover, we can transform a point-based trajectory into a trip-based trajectory. In the context of the metro scenario, each trip has an original point and a destination point, a trip also can be called an OD (original destination). In this way, the trajectory can also be described as a sequence of OD pairs. The trajectory of the metro passenger is defined as follows:
Definition 3.
(Similarity of Point): How to measure the similarity of two different points is the foundation to measure the similarity of two different trajectories. If two passengers appear at the same metro station within the same time period, we assume that the points in different passenger trajectories are similar. However, for the trajectory spatiotemporal intersection (TSI), is a threshold with a relatively small value, typically around 10 min between the time intervals of two adjacent metro trains. For trajectory similarity search, the value of is assigned a relatively larger value, typically 2 h. In summary, and are similar if they satisfy the following conditions:
Definition 4.
(Trajectory Similarity Measure Function): Given two trajectories and , their similarity scores are shown in Equation (4). This measurement is derived from Jaccard [25] and LCSS [26].
The variable is a Boolean value that indicates whether the points of the trajectory are similar or not. The rules for the variable are shown below:
Definition 5.
(Metro Trajectory Set): Each passenger produces a trajectory and all passenger trajectories formulate a trajectory set. The trajectory set is denoted as the following equation:
Definition 6.
(Metro Trajectory Similarity Search): Given a target trajectory and a trajectory set , a similarity measure function, and a similarity threshold , the metro trajectory similarity search is to find trajectories from that satisfy the conditions of Equation (7).
The problem this paper attempts to address is defined as follows. Given a query trajectory, a similarity measure function, and a threshold, our goal is to find a group of trajectories from the metro trajectory set, each of which satisfies that similarity between it and the query trajectory above the predefined threshold. Considering the trajectory set contains 6.9 million passenger trajectories with 260 million points, we try to design and implement a dedicated index and search algorithm for this large volume of the trajectory set and can provide efficient TSS service.
5. Method Design
Figure 2 shows the solution for trajectory similarity search in the metro scenario, this solution has four stages, they are data collection, data ETL (extract, transform, and load), index building, and searching, respectively.
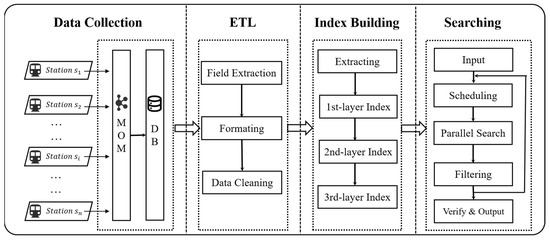
Figure 2.
Architecture of PMMTss.
5.1. Data Collection and ETL
The data collection terminals of automatic fare collection (AFC) are deployed in each metro station. All terminals are connected to the backend data center via a dedicated network. A smart card record is being read if a passenger has their card punching when enters or exits the metro station. Then, this record is submitted to a messaging middleware such as Kafka, and then the data center gets this record and saves it in the big data platform. As of January 2019, the Shenzhen Metro system has 166 stations and 4188 terminals. The AFC system collects 2.91 million records daily on average. The original smart card dataset has a few data quality problems. For example, some record fields are missing or garbled due to different versions of terminals. In addition, there are inconsistent time formats of records from different terminals. For this reason, the smart card dataset must be preprocessed. These data pre-processing steps include removing redundancy, field extraction, and formatting.
5.2. Index Building
In order to support a multi-way merging-based trajectory search, we first store all points of trajectory set in an index. Figure 3 shows the structure of the multi-layer index. The first layer is based on the spatial feature of the trajectory point, it partitions the trajectory points by metro station. The second layer index is based on the time dimension, it further partitions the trajectory points by time interval . The third layer index is based on a flag, which stands for the passenger entering or exiting a station.
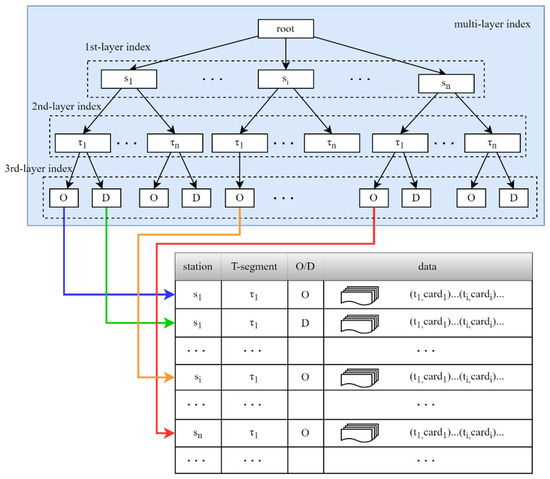
Figure 3.
The structure of the multi-layer index.
Here are some considerations on the appropriate value of the . In our tentative exploration of the dataset, we found that the time interval between two consecutive trains is between 2.5 and 15 min. Thus, we can fix the time interval to 15 min. However, considering the time cost it takes for a passenger to walk from the gate to the metro train, we set to 20 min as the time interval for the index in the Section 6.
5.3. Trajectory Similarity Search
This section will introduce the query interface for trajectory similarity search, the multi-way merging-based parallel search algorithm, and the design and implementation of filtering strategies.
5.3.1. Search Algorithm Interface
The interface for the trajectory similarity search is as follows:
where refers to a target trajectory, . is a Boolean variable that controls whether filtering is turned on or not during the search process. is a threshold of trajectory similarity between the target and the candidate trajectory, it takes a value between 0 and 1. means that the number of most similar trajectories are returned. Note that it means that all results are returned if is assigned the value of 0. is the output result set, each of which is a trajectory. Note that the length of the trajectory in the returned result set is less or equal to .
The following functions can be performed by PMMTss.
- . PMMTss is able to find all passengers who have a trajectory intersection with . This function is applicable to the COVID-19 epidemic investigation;
- . PMMTss can reveal people’s interaction information, which is important for relationship prediction in social networks;
- . PMMTss implements a KNN query for , which is a basic operation for mining similarity information of passengers by leveraging passengers’ communication behaviors.
5.3.2. Scheduling Algorithm
Given a target trajectory, firstly, PMMTss extracts candidate points from the multiple-layer index for each point in the target trajectory. The process of extracting candidate points is shown in Figure 4. Three points, including , and , are items in SPCL, and all of them have the same value of the and attribute. According to the definition of point similarity in Definition 3, we extract a set of trajectory points from the index that is similar to each target point. The extraction is divided into two stages, the filtering and refinement stages. In the filtering stage, a time range is calculated by the target point and the predefined interval, through which the interval offset in the index is located. Time range can fall in one or multiple time intervals, with the time range of falling in one time interval and the time range of and falling in two time intervals. In the refinement stage, the candidate points in the range are extracted from the located time interval.
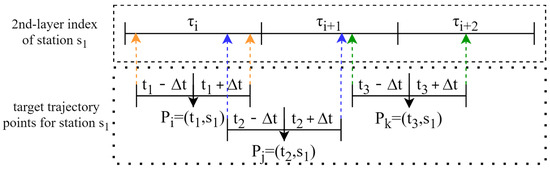
Figure 4.
Extracting candidate points from index.
The workflow of the scheduler is illustrated in Figure 5, which shows an iterative search process. The input trajectory is SPCL, it has n points. The number of search rounds is k, in particular, . A group of tasks are being executed in a parallel way. Each task is represented by three attributes: an original point, an arrow and a destination point. The purpose of each task is to merge different candidate trajectory segments according to smart card identities. In the first round, each task extracts two candidate point sets from the index and produces a set of candidate trajectory segments. In the intermediate rounds, candidate trajectory segments are merged and filtered, generating new candidate trajectory segments for the next round. In the last round, candidate trajectory segments with the same identity are combined, forming the final trajectory set.
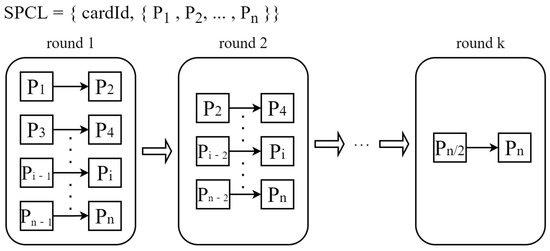
Figure 5.
The parallel multi-way merging-based trajectory similar search algorithm.
The details of the scheduler are described in Algorithm 1.
| Algorithm 1. Parallel Multi-Way Merging Scheduler. | |
| Input: CSet contains n sets of candidate trajectory points. Output: resList is a list of generated trajectories. | |
| 1 | procedure Multi-wayMerging (CSet) |
| 2 | |
| 3 | |
| 4 | do |
| 5 | |
| 6 | end for |
| 7 | do |
| 8 | |
| 9 | do |
| 10 | |
| 11 | ) |
| 12 | end for |
| 13 | synchronize the threads; |
| 14 | end while |
| 15 | |
| 16 | end procedure |
5.3.3. Filtering Strategy
In this section, we introduce how the scheduler conduct merging and filtering operation. The purpose of merging is to combine different segments with the same identity. The implementation of the merge thread is shown in Algorithm 2.
The filtering strategy is to prune unnecessary candidate trajectory segments by deriving a lower bound on the similarity score. In the implementation of the filtering strategy, we use a variable (), which stands for the maximum threshold of the number of trajectory points that a candidate trajectory cannot match by target points, to determine whether a trajectory satisfies filtering conditions. The formula for calculating is in line 3 of Algorithm 2.
| Algorithm 2. Merging and Filtering for Candidate Trajectory Segments. | |
| Input: task1, task2, taskQueue, isFilter, threshold. Output: taskQueue. | |
| 1 | procedure MergeThread (task1, task2, isFilter, threshold) |
| 2 | |
| 3 | |
| 4 | |
| 5 | |
| 6 | //cardId in TrSet1 and TrSet2 |
| 7 | |
| 8 | |
| 9 | do |
| 10 | |
| 11 | then |
| 12 | |
| 13 | else |
| 14 | |
| 15 | |
| 16 | end if |
| 17 | end for |
| 18 | do |
| 19 | |
| 20 | then |
| 21 | |
| 22 | else |
| 23 | |
| 24 | end if |
| 25 | end for |
| 26 | do |
| 27 | |
| 28 | then |
| 29 | |
| 30 | else |
| 31 | |
| 32 | end if |
| 33 | end for |
| 34 | then |
| 35 | |
| 36 | end if |
| 37 | end procedure |
PMMTss adopts two filtering strategies: the first filtering strategy is to extract candidate trajectory points from the index by the spatiotemporal information of the target points. The filtering algorithm is the second filtering strategy. The steps of the filtering algorithm are as follows: first, it calculates the number of points where a candidate trajectory does not overlap with the target trajectory. Second, it calculates the similarity score between the candidate segment and the target trajectory. We remove the candidate segment if the score is less than the lower bound. It means all derivatives of this candidate cannot satisfy the filtering threshold.
In this way, trajectory segments that are impossible to become the members in final results are deleted in the intermediate rounds, reducing the number of candidate trajectories and computational costs for the next rounds.
6. Experiment
6.1. Experimental Setup
The experimental setup includes two parts: the first is data pre-processing and index building, and the second is service deployment and performance evaluation. The first part is a Spark cluster with one coordinator and five workers. Each node is equipped with the same hardware and software configurations. Specifically, two CPUs with 32 cores (Intel (R) Xeon (R) Silver 4216 CPU), memory size 32 GB (DDR4), one disk with 4 TB storage space, and network bandwidth is 10 Gb. The version of Hadoop is 2.7.7 and the Spark version is 3.2, the OS is CentOS 7.6, and the JDK is 1.8. The search service is deployed and evaluated on a single node, which has the same configuration.
6.2. Dataset
The dataset was collected from the Shenzhen Metro System for the three months from November 2018 to January 2019. The dataset involves 6.97 million smart cards with a total of 265 million records. Details of the fields in the dataset are shown in Table 2. A group of ordered records produced by a smart card formulates a passenger trajectory, and all trajectories formulate a trajectory set. The length of these passenger trajectories is 34 on average, and 95% of the trajectory lengths were less than 100. The trajectory set includes 6.97 million passenger trajectories.
Table 2.
Detail of passenger record field.
We first randomly select 4000 trajectories as samples out of 6.97 million trajectories with a sampling rate of 0.05%. The lengths of these sample trajectories are from 4 to 64. Then, we use these sample trajectories as target trajectories to evaluate the performance of PMMTss.
6.3. Performance Evaluation and Result Analysis
In this subsection, we first make a comprehensive comparison of PMMTss and PPJoin+ with the same experimental conditions. Then, we discuss the weaknesses of the PPJoin+ algorithm and summarize the features and the advantages of the PMMTss. Finally, we evaluate the effectiveness of the multi-layer index and the performance of the filtering in PMMTss.
6.3.1. Performance Comparison between PMMTss and PPJion+
We first illuminate experimental results on the performance comparison between PMMTss and PPJion+. Then, we introduce the problems encountered in the implementation of the trajectory similarity search by PPJion+ and discuss the underlying reasons. Finally, we summarize the design philosophy for PMMTss and PPJion+, respectively.
Figure 6a,c show the average searching time of PPJion+ and PMMTss for different combinations of . The search time of PPJion+ is between 500 ms and 12,500 ms, whereas the search time of PMMTss is between 1 ms and 160 ms. Obviously, PMMTss is 43x–5370x faster than that of PPJion+. In detail, under the condition of , PMMTss is 43 times faster than PPJion+. Under the condition of , PMMTss is 5370 times faster than PPJion+.
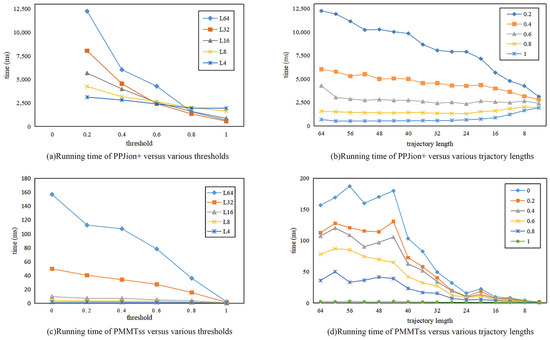
Figure 6.
Performance of PMMTss and PPJion+.
Focus on the performance of PPJoin+, Figure 6a shows that the search time for PPJion+ decreases as the threshold increases for longer trajectories (L16, L32, and L64) and that the decrease is greater for longer trajectories. However, in the case of shorter trajectories (L4 and L8), the decrease in the search time for PPJion+ goes from a sharp decrease to a slower decrease as the threshold increases. Note that for thresholds above 0.8, the search time of PPPJion+ for long trajectories is smaller than for short trajectories. The above performance reveals three characteristics of PPJoin+: (i) generally, the filtering strategy of PPJoin+ is effective as the search time decreases with an increasing threshold; (ii) PPJion+ performs best when the trajectory similarity threshold is greater than or equal to 0.8; and (iii) specifically, PPJion+ is better at searching long trajectories than short trajectories when the threshold is greater than 0.8.
Based on the above experimental results and the algorithmic logic of PPJion+, we can make a conclusion that the main reason for the above characteristics of PPJion+ is that although three filtering strategies work well, PPJion+ still needs to access each item in the trajectory set. It is very time-consuming to access all items in the trajectory set. In summary, it is difficult to reduce search time by optimizing these filtering strategies. This is also confirmed by the fact that the line in Figure 6a flattens out after a threshold greater than 0.8.
Focus on the performance of PMMTss. Figure 6c shows that the search timelines for different trajectory lengths have a very similar shape, indicating that PMMTss has a stable search performance for different trajectory lengths. Overall, the search time of PMMTss can be kept in milliseconds for trajectories with different lengths. Compared to PPJion+, PMMTss performs much better and the performance is more stable.
The main reason is that PMMTss has a highly efficient spatiotemporal index, which keeps points in different space and time intervals. Given a target point, it can easily locate and obtain the corresponding candidate points. It searches similar trajectories using points rather than using trajectories in PPJion+. PMMTss avoids vigorous trajectory similarity search, reducing unnecessary computation.
In addition, PMMTss first generates candidate trajectory segments and then performs the filtering strategy during the search process, which ensures that the search time can maintain a linear trend as the threshold increases. Moreover, PMMTss can deal with the trajectory intersection problem, i.e., trajectory similarity search with a threshold of 0. However, the three filtering strategies of PPJion+ cannot work if the threshold is set to 0. Therefore, PPJion+ cannot perform a similarity search when the threshold value is 0, i.e., it has no ability to address the problem of trajectory intersection.
6.3.2. Evaluation of Indexing and Filtering Effectiveness
In this subsection, we design a group of experiments to illustrate the effectiveness of the multi-layer spatiotemporal index. In detail, it can sharply decrease the number of candidate trajectories and speed up trajectory similarity search. Table 3 summarizes the data volume and the corresponding execution times for PPJoin+ and PMMTss. In detail, the first column means different combinations of trajectory length and threshold. The third column represents the input size, which is the number of trajectories. The fourth column means the number of involved trajectories: it takes the number of original trajectories as the involved trajectories for PPJoin+, and takes the number of trajectories extracted by index as involved trajectories for PMMTss. The fifth column stands for the number of trajectories in the result set. The sixth column shows the ratio of the output size and the input size. The seventh column means the corresponding execution time for a given combination of trajectory length and threshold. Note that the execution time for PMMTss consists of two parts: one is the time used to extract candidate points from the index, and the other is used to perform merging and filtering candidate segments.
Table 3.
Running time and workload reduction of PPJion+ and PMMTss for sample dataset.
As shown in Table 3, both PPJion+ and PMMTss achieve more than 99% filtering ratio of the trajectory set, i.e., finding a subset of trajectories that are highly similar to the target trajectory from the input set in a million trajectories. The most significant difference between PPJion+ and PMMTss is the number of trajectories involved in the algorithm. We can make a conclusion that PMMTss has a very effective spatiotemporal index, which keeps all points in it and directly locates candidate points, sharply reducing the number of trajectories involved.
To further explore time cost distribution at different stages for PMMTss, we conduct a group of experiments with different query conditions. For simplicity, we denote ET as the time cost used for extracting candidate points from the index, and denote ST as the time cost used for the search phase, which consists of merging and filtering candidate segments.
Figure 7 shows the experimental results: the ratio of ET and total time is small when the long trajectory with a low threshold, and the ratio of ET and total time is large when the short trajectory with a high threshold.
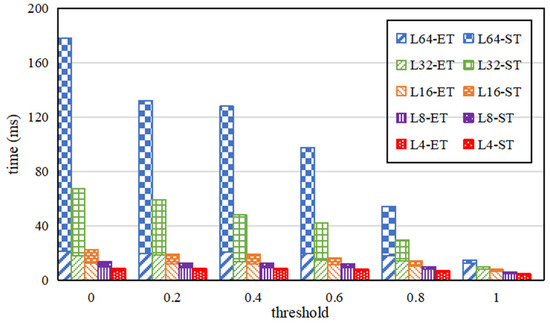
Figure 7.
Time-consuming ratio of data extraction and trajectory search in PMMTss.
The value of ET increases from 6.5 ms to 20.1 ms when the length of the target trajectory increases from 4 to 64. It means the multi-layer index-based extract method is highly efficient and stable.
7. Conclusions
In this paper, we propose a solution for trajectory similarity search for metro scenarios. The core idea consists of a multi-layer index and a parallel multi-way merging search algorithm. Our method is significantly different from the existing trajectory similarity search algorithms. It keeps points rather than trajectories in the spatiotemporal index, and the candidate trajectory segments are merged and filtered out in the multiple search round.
We evaluate this solution on a large dataset (Shenzhen Metro data for 3 consecutive months; 6.976 million trajectories with 260 million records). When lengths of input trajectories are 16, 32, and 64, respectively, the corresponding search times are 0.004 s, 0.016 s, and 0.036 s, respectively. Compared to the baseline PPJion+, the query times are reduced by 99.7%, 98.8%, and 97.6%, respectively. Moreover, our solution presents higher filtering efficiency, lower deployment cost, and a flexible search interface.
Although our solution has achieved good results, there are still some limitations. For example, we do not consider the route within the metro network when we measure the similarity between two different trajectories. It is a very important factor, which could affect the accuracy of trajectory similarity search. Thus, we plan to address this limitation in our future work, so that we can adopt an RNN-based model [27] or a data fusion method [7] to infer the route choices for passengers.
8. Patents
Wen Xiong, Wanbing Huang, and Liming Wang. A Parallel Multi-way Merging-based Trajectory Similarity Search for Metro Passengers [P]. Yunnan Province: CN115344795AB.2022-12-09. The invention patent has been granted.
Author Contributions
Conceptualization, W.H. and W.X.; methodology, W.H. and W.X.; software, W.H.; validation, W.H.; investigation, W.X.; writing—original draft preparation, W.H. and W.X.; writing—review and editing, W.H., W.X. and X.W.; visualization, W.H. and W.X. All authors have read and agreed to the published version of the manuscript.
Funding
This research was funded by the National Natural Science Foundation of China (NSFC) [Number: 61862066].
Institutional Review Board Statement
Not applicable.
Informed Consent Statement
Not applicable.
Data Availability Statement
The data presented in this study are available on request from the corresponding author.
Conflicts of Interest
The authors declare no conflict of interest.
References
- Tang, L.; Zhao, Y.; Tsui, K.L.; He, Y.; Pan, L. A Clustering Refinement Approach for Revealing Urban Spatial Structure from Smart Card Data. Appl. Sci. 2020, 10, 5606. [Google Scholar] [CrossRef]
- Park, S.; Yuan, Y.; Choe, Y. Application of Graph Theory to Mining the Similarity of Travel Trajectories. Tour. Manag. 2021, 87, 104391. [Google Scholar] [CrossRef]
- Lee, M.; Jeon, I.; Jun, C. A Deterministic Methodology Using Smart Card Data for Prediction of Ridership on Public Transport. Appl. Sci. 2022, 12, 3867. [Google Scholar] [CrossRef]
- Alarabi, L. Summit: A Scalable System for Massive Trajectory Data Management. In Proceedings of the 26th ACM SIGSPATIAL International Conference on Advances in Geographic Information Systems, Seattle, WA, USA, 6–9 November 2018; Association for Computing Machinery: New York, NY, USA, 2018; pp. 612–613. [Google Scholar]
- Xiao, C.; Wang, W.; Lin, X.; Yu, J.X.; Wang, G. Efficient Similarity Joins for Near-Duplicate Detection. ACM Trans. Database Syst. TODS 2011, 36, 15. [Google Scholar] [CrossRef]
- Jiang, Y.; Li, G.; Feng, J.; Li, W.-S. String Similarity Joins: An Experimental Evaluation. Proc. VLDB Endow. 2014, 7, 625–636. [Google Scholar] [CrossRef]
- Zhao, J.; Zhang, L.; Ye, K.; Ye, J.; Zhang, J.; Zhang, F.; Xu, C. GLTC: A Metro Passenger Identification Method Across AFC Data and Sparse WiFi Data. IEEE Trans. Intell. Transp. Syst. 2022, 23, 18337–18351. [Google Scholar] [CrossRef]
- Lu, X.; Li, J.; Wu, C.; Wu, J.; Daneshmand, M. Measuring Similarity between Any Pair of Passengers Using Smart Card Usage Data. IEEE Internet Things J. 2022, 9, 1458–1468. [Google Scholar] [CrossRef]
- Koren, Y. Factorization Meets the Neighborhood: A Multifaceted Collaborative Filtering Model. In Proceedings of the 14th ACM SIGKDD International Conference on Knowledge Discovery and Data Mining, Las Vegas, NV, USA, 24–27 August 2008; pp. 426–434. [Google Scholar]
- Wu, F.; Zheng, C.; Zhang, C.; Ma, J.; Sun, K. Multi-View Multi-Attention Graph Neural Network for Traffic Flow Forecasting. Appl. Sci. 2023, 13, 711. [Google Scholar] [CrossRef]
- Yang, P.; Wang, H.; Zhang, Y.; Qin, L.; Zhang, W.; Lin, X. T3S: Effective Representation Learning for Trajectory Similarity Computation. In Proceedings of the 2021 IEEE 37th International Conference on Data Engineering (ICDE), Chania, Greece, 19–23 April 2021; pp. 2183–2188. [Google Scholar]
- Zheng, B.; Weng, L.; Zhao, X.; Zeng, K.; Zhou, X.; Jensen, C.S. REPOSE: Distributed Top-k Trajectory Similarity Search with Local Reference Point Tries. In Proceedings of the 2021 IEEE 37th International Conference on Data Engineering (ICDE), Chania, Greece, 19–23 April 2021; pp. 708–719. [Google Scholar]
- Sandes, E.F.; Teodoro, G.L.; Melo, A.C. Bitmap Filter: Speeding up Exact Set Similarity Joins with Bitwise Operations. Inf. Syst. 2020, 88, 101449. [Google Scholar] [CrossRef]
- Tampakis, P.; Doulkeridis, C.; Pelekis, N.; Theodoridis, Y. Distributed Subtrajectory Join on Massive Datasets. ACM Trans. Spat. Algorithms Syst. TSAS 2020, 6, 2. [Google Scholar] [CrossRef]
- Li, J.; Liu, J.Q.; Mei, X.L.; Sun, W.T.; Huang, Q.; Zhang, Y.Y.; Qiao, L.W.; Zhang, C.Y. Design and Implementation of Trajectory Data Management and Analysis Technology Framework Based on Spatiotemporal Grid Model. In International Archives of Photogrammetry, Remote Sensing and Spatial Information Sciences; Copernicus GmbH: Göttingen, Germany, 2020; Volume 43, pp. 471–476. [Google Scholar]
- Rong, C.; Cheng, X.; Chen, Z.; Huo, N. Similarity Joins for High-Dimensional Data Using Spark. Concurr. Comput. Pract. Exp. 2019, 31, e5339. [Google Scholar] [CrossRef]
- Ding, J.; Fang, J.; Zhang, Z.; Zhao, P.; Xu, J.; Zhao, L. Real-Time Trajectory Similarity Processing Using Longest Common Subsequence. In Proceedings of the 2019 IEEE 21st International Conference on High Performance Computing and Communications; IEEE 17th International Conference on Smart City; IEEE 5th International Conference on Data Science and Systems (HPCC/SmartCity/DSS), Zhangjiajie, China, 10–12 August 2019; IEEE: Piscataway, NJ, USA, 2019; pp. 1398–1405. [Google Scholar]
- Shang, S.; Chen, L.; Wei, Z.; Jensen, C.S.; Zheng, K.; Kalnis, P. Parallel Trajectory Similarity Joins in Spatial Networks. VLDB J. 2018, 27, 395–420. [Google Scholar] [CrossRef]
- Xie, D.; Li, F.; Phillips, J.M. Distributed Trajectory Similarity Search. Proc. VLDB Endow. 2017, 10, 1478–1489. [Google Scholar] [CrossRef]
- Ta, N.; Li, G.; Xie, Y.; Li, C.; Hao, S.; Feng, J. Signature-Based Trajectory Similarity Join. IEEE Trans. Knowl. Data Eng. 2017, 29, 870–883. [Google Scholar] [CrossRef]
- Belhassena, A.; Wang, H. Distributed Skyline Trajectory Query Processing. In Proceedings of the ACM Turing 50th Celebration Conference, Shanghai, China, 12–14 May 2017; pp. 1–7. [Google Scholar]
- Leal, E.; Gruenwald, L.; Zhang, J.; You, S. Towards an Efficient Top-k Trajectory Similarity Query Processing Algorithm for Big Trajectory Data on Gpgpus. In Proceedings of the 2016 IEEE International Congress on Big Data (BigData Congress), Washington, DC, USA, 5–8 December 2016; IEEE: Piscataway, NJ, USA, 2016; pp. 206–213. [Google Scholar]
- Chen, L.; Shang, S.; Jensen, C.S.; Yao, B.; Kalnis, P. Parallel Semantic Trajectory Similarity Join. In Proceedings of the 2020 IEEE 36th International Conference on Data Engineering (ICDE), Dallas, TX, USA, 20–24 April 2020; IEEE: Piscataway, NJ, USA, 2020; pp. 997–1008. [Google Scholar]
- Wu, J.; Zhang, Y.; Wang, J.; Lin, C.; Fu, Y.; Xing, C. Scalable Metric Similarity Join Using Mapreduce. In Proceedings of the 2019 IEEE 35th International Conference on Data Engineering (ICDE), Macau, China, 8–11 April 2019; IEEE: Piscataway, NJ, USA, 2019; pp. 1662–1665. [Google Scholar]
- Theobald, M.; Siddharth, J.; Paepcke, A. Spotsigs: Robust and Efficient near Duplicate Detection in Large Web Collections. In Proceedings of the 31st Annual International ACM SIGIR Conference on Research and Development in Information Retrieval, Singapore, 20–24 July 2008; pp. 563–570. [Google Scholar]
- Hirschberg, D.S. Algorithms for the Longest Common Subsequence Problem. J. ACM JACM 1977, 24, 664–675. [Google Scholar] [CrossRef]
- He, Y.; Li, L.; Zhu, X.; Tsui, K.L. Multi-Graph Convolutional-Recurrent Neural Network (MGC-RNN) for Short-Term Forecasting of Transit Passenger Flow. IEEE Trans. Intell. Transp. Syst. 2022, 23, 18155–18174. [Google Scholar] [CrossRef]


Disclaimer/Publisher’s Note: The statements, opinions and data contained in all publications are solely those of the individual author(s) and contributor(s) and not of MDPI and/or the editor(s). MDPI and/or the editor(s) disclaim responsibility for any injury to people or property resulting from any ideas, methods, instructions or products referred to in the content. |
© 2023 by the authors. Licensee MDPI, Basel, Switzerland. This article is an open access article distributed under the terms and conditions of the Creative Commons Attribution (CC BY) license (https://creativecommons.org/licenses/by/4.0/).