1. Introduction
In Europe, the free circulation of goods is a pillar of the Union’s treaties and necessitates a robust transportation infrastructure. In this regard, transportation infrastructures help countries transcend the economic contexts, providing people access to workplaces, services, and schools and connecting to the community. On the other hand, economically, socially, and environmentally-wise, a modern society cannot exist without an effective transportation network. From those perspectives, transportation infrastructures, especially roadway bridges, are one of the most critical factors ensuring the social-economic sustainable development of the countries. Throughout their existence, they require routine maintenance, which consumes a lot of budget from different countries. Therefore, infrastructure management is a task fraught with immense responsibility, one of the community’s most valuable assets. These services have undergone significant transformational processes, including digitalization [
1,
2], decentralization, and integrated management [
3,
4]. Such approaches rely on the technical evolution of infrastructure systems and incorporate crucial social and socio-technical components [
5].
Regarding the lifecycle management of roadway bridges, including monitoring and maintenance, numerous nations lack insufficient funds to tackle the challenge of recovering deteriorating structures. Maintaining and managing solutions for roadway bridges under limited resources but satisfying the need for safety and utility poses an enormous question mark for bridge administrators. Consequently, developing strategies that maximize the public advantages of investing in these assets becomes crucial [
6]. This expenditure must be planned, managed correctly, and supported technically through appropriate management processes. On the other hand, user satisfaction, sustainable performance, pre-specified safety level, optimizing return on investment, long-term planning and dependable performance, and risk management are the main advantages of adequately implementing these approaches for managing the operation of roadway bridges [
7,
8]. To accomplish this, the authorities must establish an asset management strategy that identifies the objectives that need to be conducted through leveraging the roadway infrastructure network and the needed investments and priorities determined by life cycle expense factors. Diverse condition assessments of the above assets were performed to aid in the maintenance decision-making process [
9,
10]. This procedure should establish a set of maintenance interventions that are meticulously planned and carried out at the right time. It will enable the mitigation of risks associated with further deterioration, the reduction of expenses, and the maintenance of service quality.
Recently, there have been numerous global- and local-level roadway bridge management systems [
11,
12,
13]. Even though their frameworks have some similarities, they also have many differences, most notably in their structural assessment processes. Different maintenance decisions may result from these variances. An infrastructure system management is only efficient when it determines maintenance needs frequently. It is possible to create a circle by evaluating appropriate performance indicators and improving maintenance strategy planning. It increases the need to provide quality control (QC), establishing processes that guarantee the bridge services meet the demands and standards of the community. Furthermore, asset management and quality control for road infrastructures complement each other [
14,
15]. Although they are classified as public/private services, a public-private partnership may run them. In both scenarios, it is an increasing demand to devise methods for ensuring the performance of the entire framework and minimizing the risk of unforeseen expenses. The standardized approach integrates various kinds of maintenance supervision across networks and countries. In this context, the first stage outlines the techniques for quantifying performance indicators while offering detailed instructions for evaluating roadway bridges [
16,
17]. Moreover, a certain number of reference intervals is required for these assessment actions. The subsequent phase is the formulation of shared performance objectives. In conclusion, a framework to develop QC instructions for roadway bridges and instances for benchmark implementation can be established. This article emphasizes the significance of sophisticated degradation prediction models as a significant contributing factor.
There has been extensive research on evaluating the structural performance of infrastructures, including an understanding of performance indicators (PI) [
18,
19,
20]. This approach enables the development of QC (quality control) strategies that establish a correlation between assessed performance indicators (PI) and predefined performance objectives (PG) [
21]. PIs, especially the key performance indicators (KPI), enable defining goals to set up QC plans, guaranteeing the quality of the desired bridge service. By establishing and assessing bridge quality and performance criteria to ensure a certain desired level, bridge management techniques can be substantially improved, thereby enhancing the management of assets of aging structures. Commonly, management systems employ lifecycle analysis methods that consider numerous degradation processes [
22]. These systems, which evaluate the condition of facilities, typically depend on deterministic performance forecasting models. These models explain the foreseeable situation relies on the operational correlation between characteristics of the structure’s condition, such as its lifespan, and chemical, mechanical, and thermal loading processes [
23,
24]. For the actual applications, it is necessary to concern employed assessment frameworks, in which their quantification method is crucial.
In short, it is required to provide particular recommendations for evaluating roadway bridges, including quantification methods for performance indicators. Consideration should also be taken into account for the reference intervals for these monitoring and evaluation actions. Furthermore, it is necessary to establish common performance goals and objectives. Following that, a guideline for developing quality control frameworks for roadway infrastructures might be developed. On the other hand, the idea of sustainable transportation system management, which consists of evaluating economic, environmental, and social PIs over the asset’s entire service lifecycle, needs to be emphasized. This paper aims to deal with those objectives by proposing a quality control framework and thereby enhancing the asset management of the existing deteriorating assets.
2. Performance Indicators and Goals
In order to enhance the existing performance assessment approaches regarding bridge management systems, research-based PIs and PGs are suggested. The engineer collects and surveys those PIs to reveal which ones are already in use and which are worth further investing in. For example, the PIs regarding the scientific achievements of the bridge structures in terms of reliability index, operation and monitoring, and dynamic behavior should be aware and paid more attention. Regarding the bridge reliability assessment in this example, in-depth knowledge of the bridge properties should be taken into account, e.g., local traffic loading or stiffness changes. Therefore, it is required to perform further testing, monitoring and inspection tools and technologies. Consequently, the cost indicator for the data updating process arises to achieve a more profound knowledge level of the bridges. In this way, the realized knowledge level has been considered an indicator for the reliability assessment of the bridges in later steps.
2.1. Performance Indicators
To explore the PIs for bridge structures that can capture the mechanical properties and their degradation behavior, it is suggested to use the “fib Model Code for Concrete Structures 2010” [
18]. This code specification aims to serve as a basis for future codes for concrete structures, and present new developments with regard to concrete structures, structural materials and new ideas in order to achieve optimum behavior. It can handle some of the engineering and technical characteristics and how they break down, shown by the indicators. The main issues that should be considered are natural aging, the quality of the materials, the techniques used to build for a lengthy lifecycle, etc. Europe’s database of performance indicators is deployed flexibly to satisfy country-specific needs. The indicators typically focus on safety, serviceability, availability, costs, and environmental efficiency.
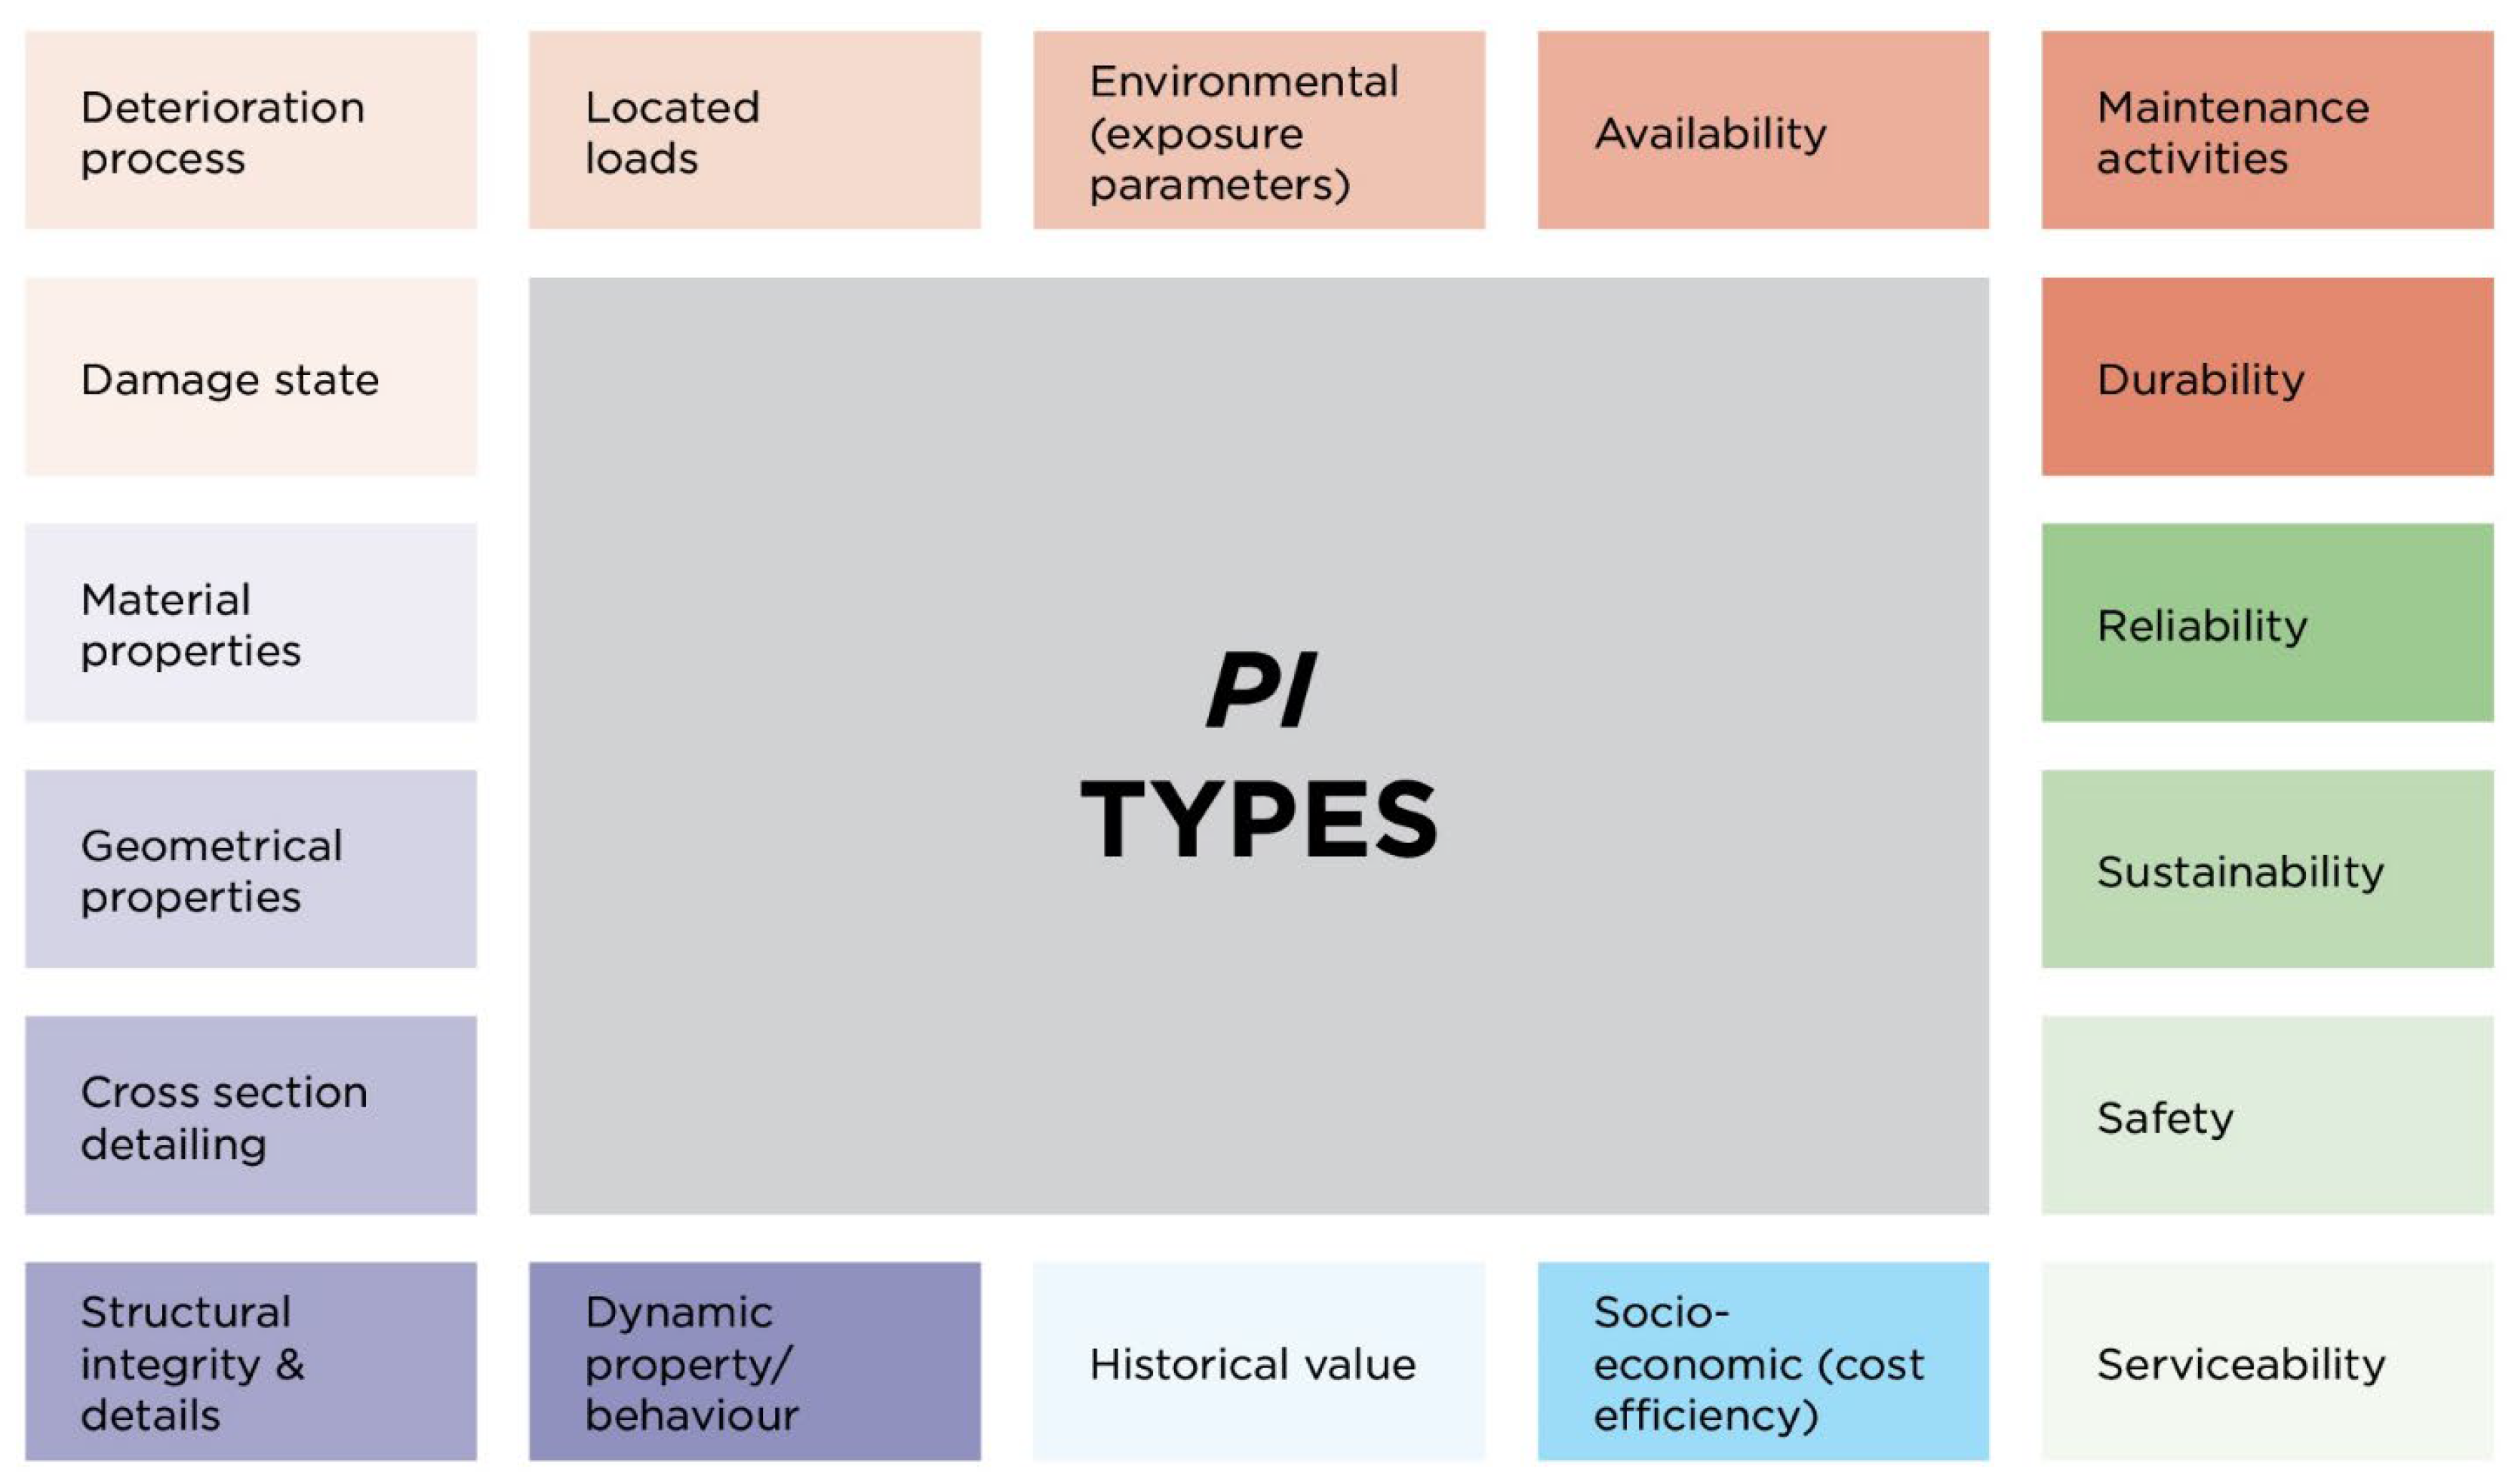
An example of possible clusters of research-based PIs is presented and described (see
Figure 1). To determine the KPIs, more work must be done around the Operational Database level. The addition of the research-based database to the operational database should facilitate the completion of the two primary tasks listed below: selecting the most crucial PI for reaching PG that must be met over the most effective Quality Control Plan within bridge executive management, following which assigning them the appropriate weights (importance level). Defining the most critical PGs is necessary to determine which PIs are the most important. The PIs can be categorized according to the Performance Objectives and Goals (at multiple tiers, including components, system and the network level, while considering different variables, such as technical, ecological, socioeconomic, etc.). It should be seen as the part concerning the PI that can be seen and measured, the accessibility of the target values, validation over classification objectives, and authority to make choices that have economic consequences. The database contains the most important indications for attaining the essential quality control objectives.
2.2. Performance Goals
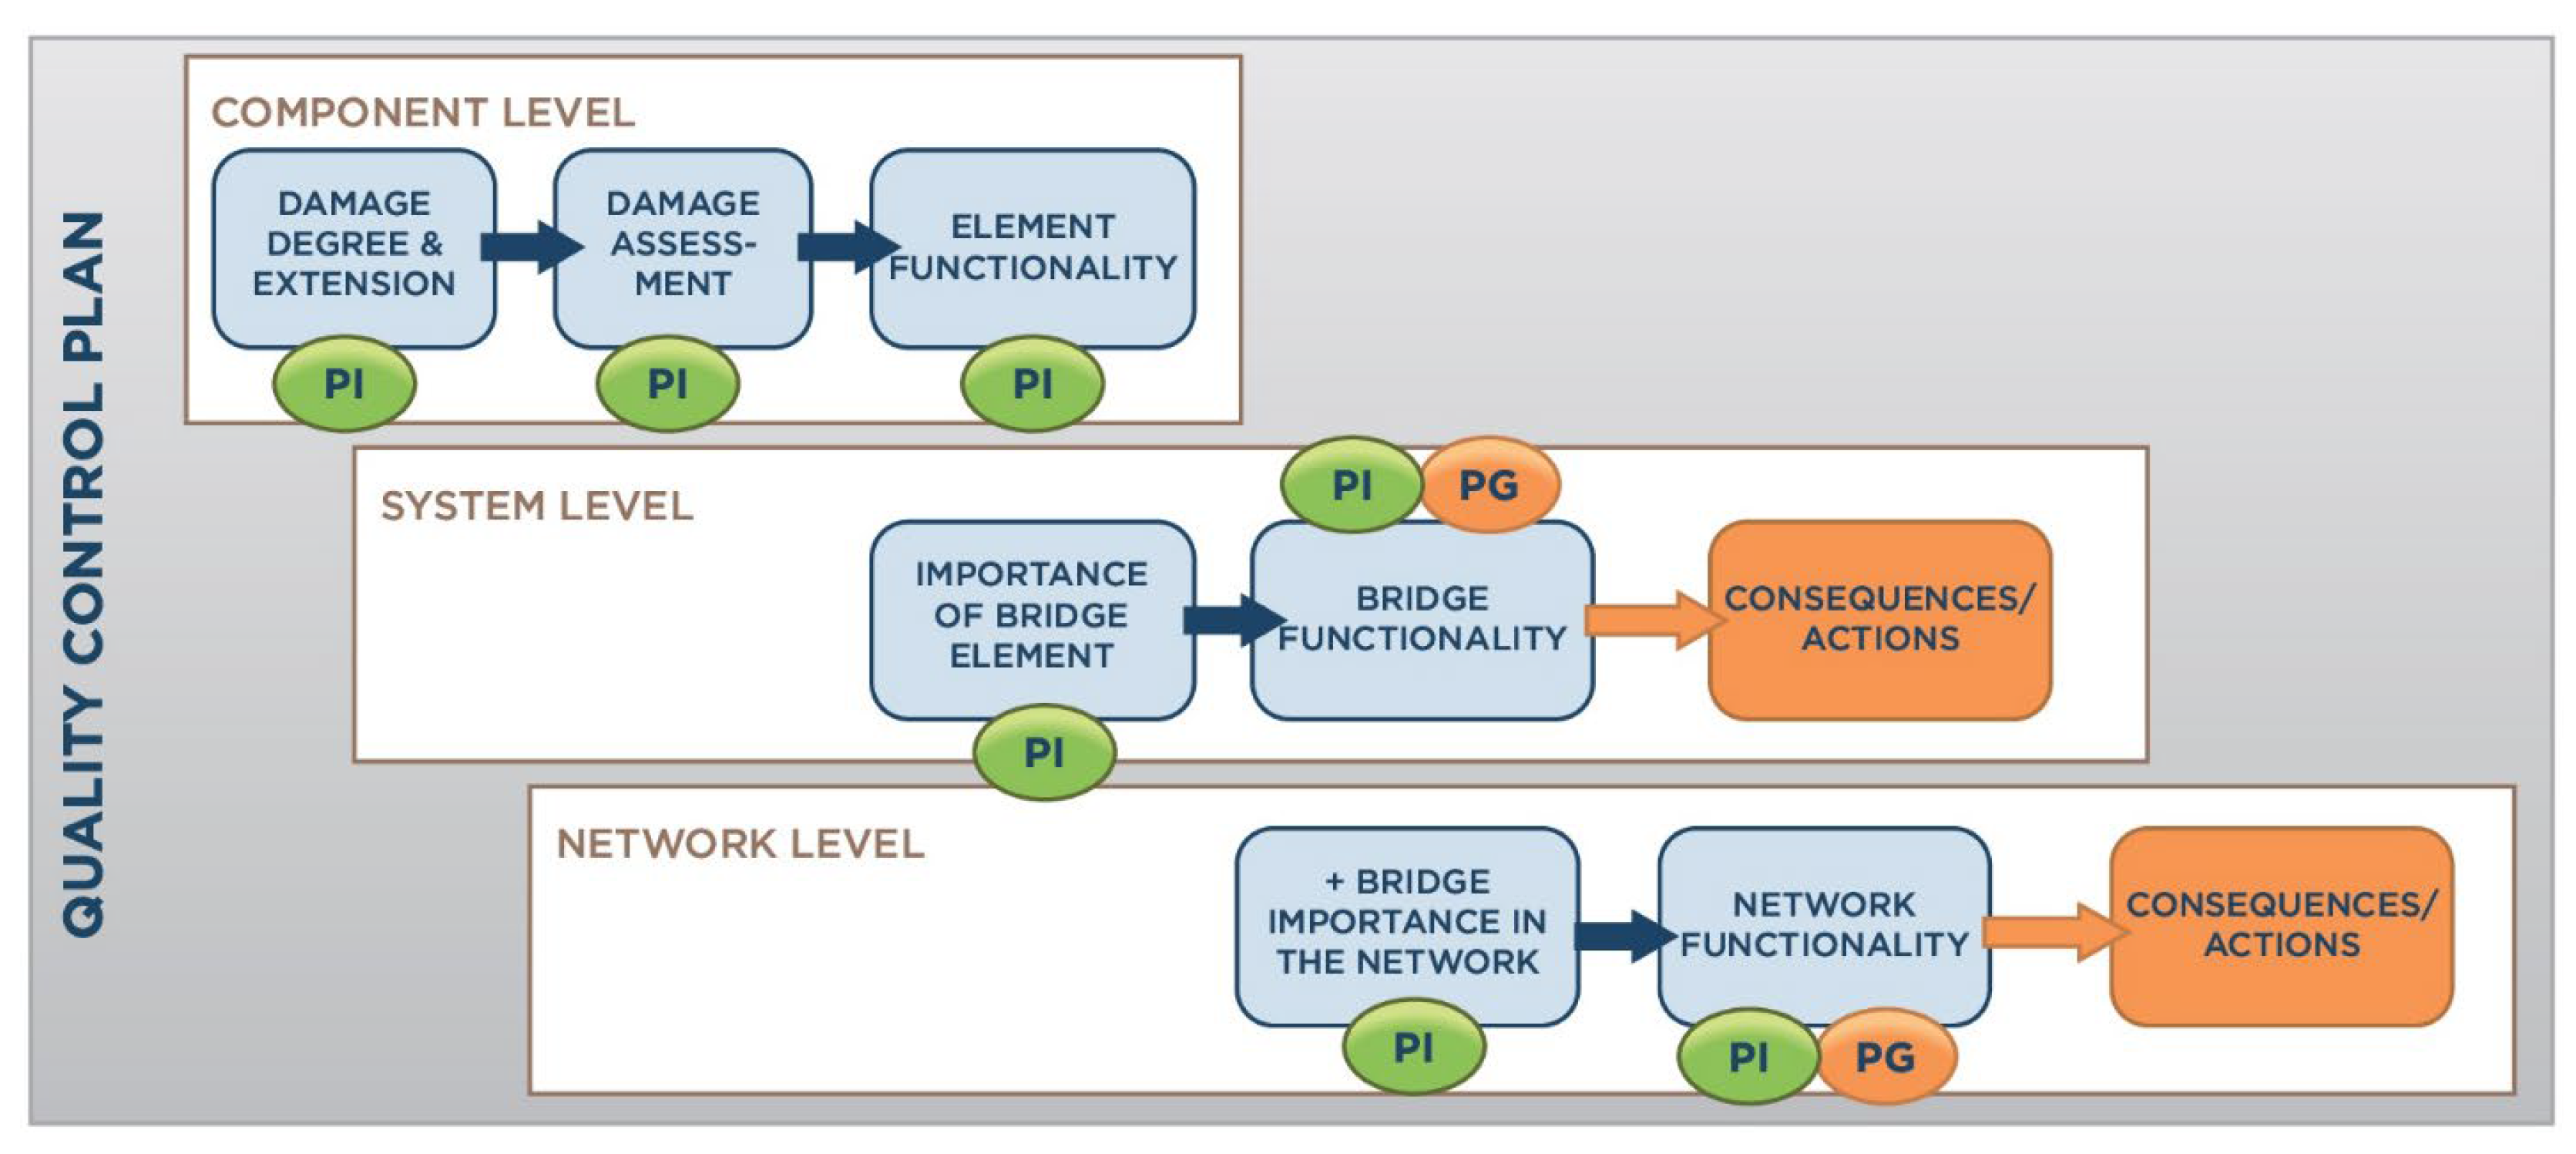
The relationship between performance goals and indicators at the level of components, systems, and networks is depicted in
Figure 2.
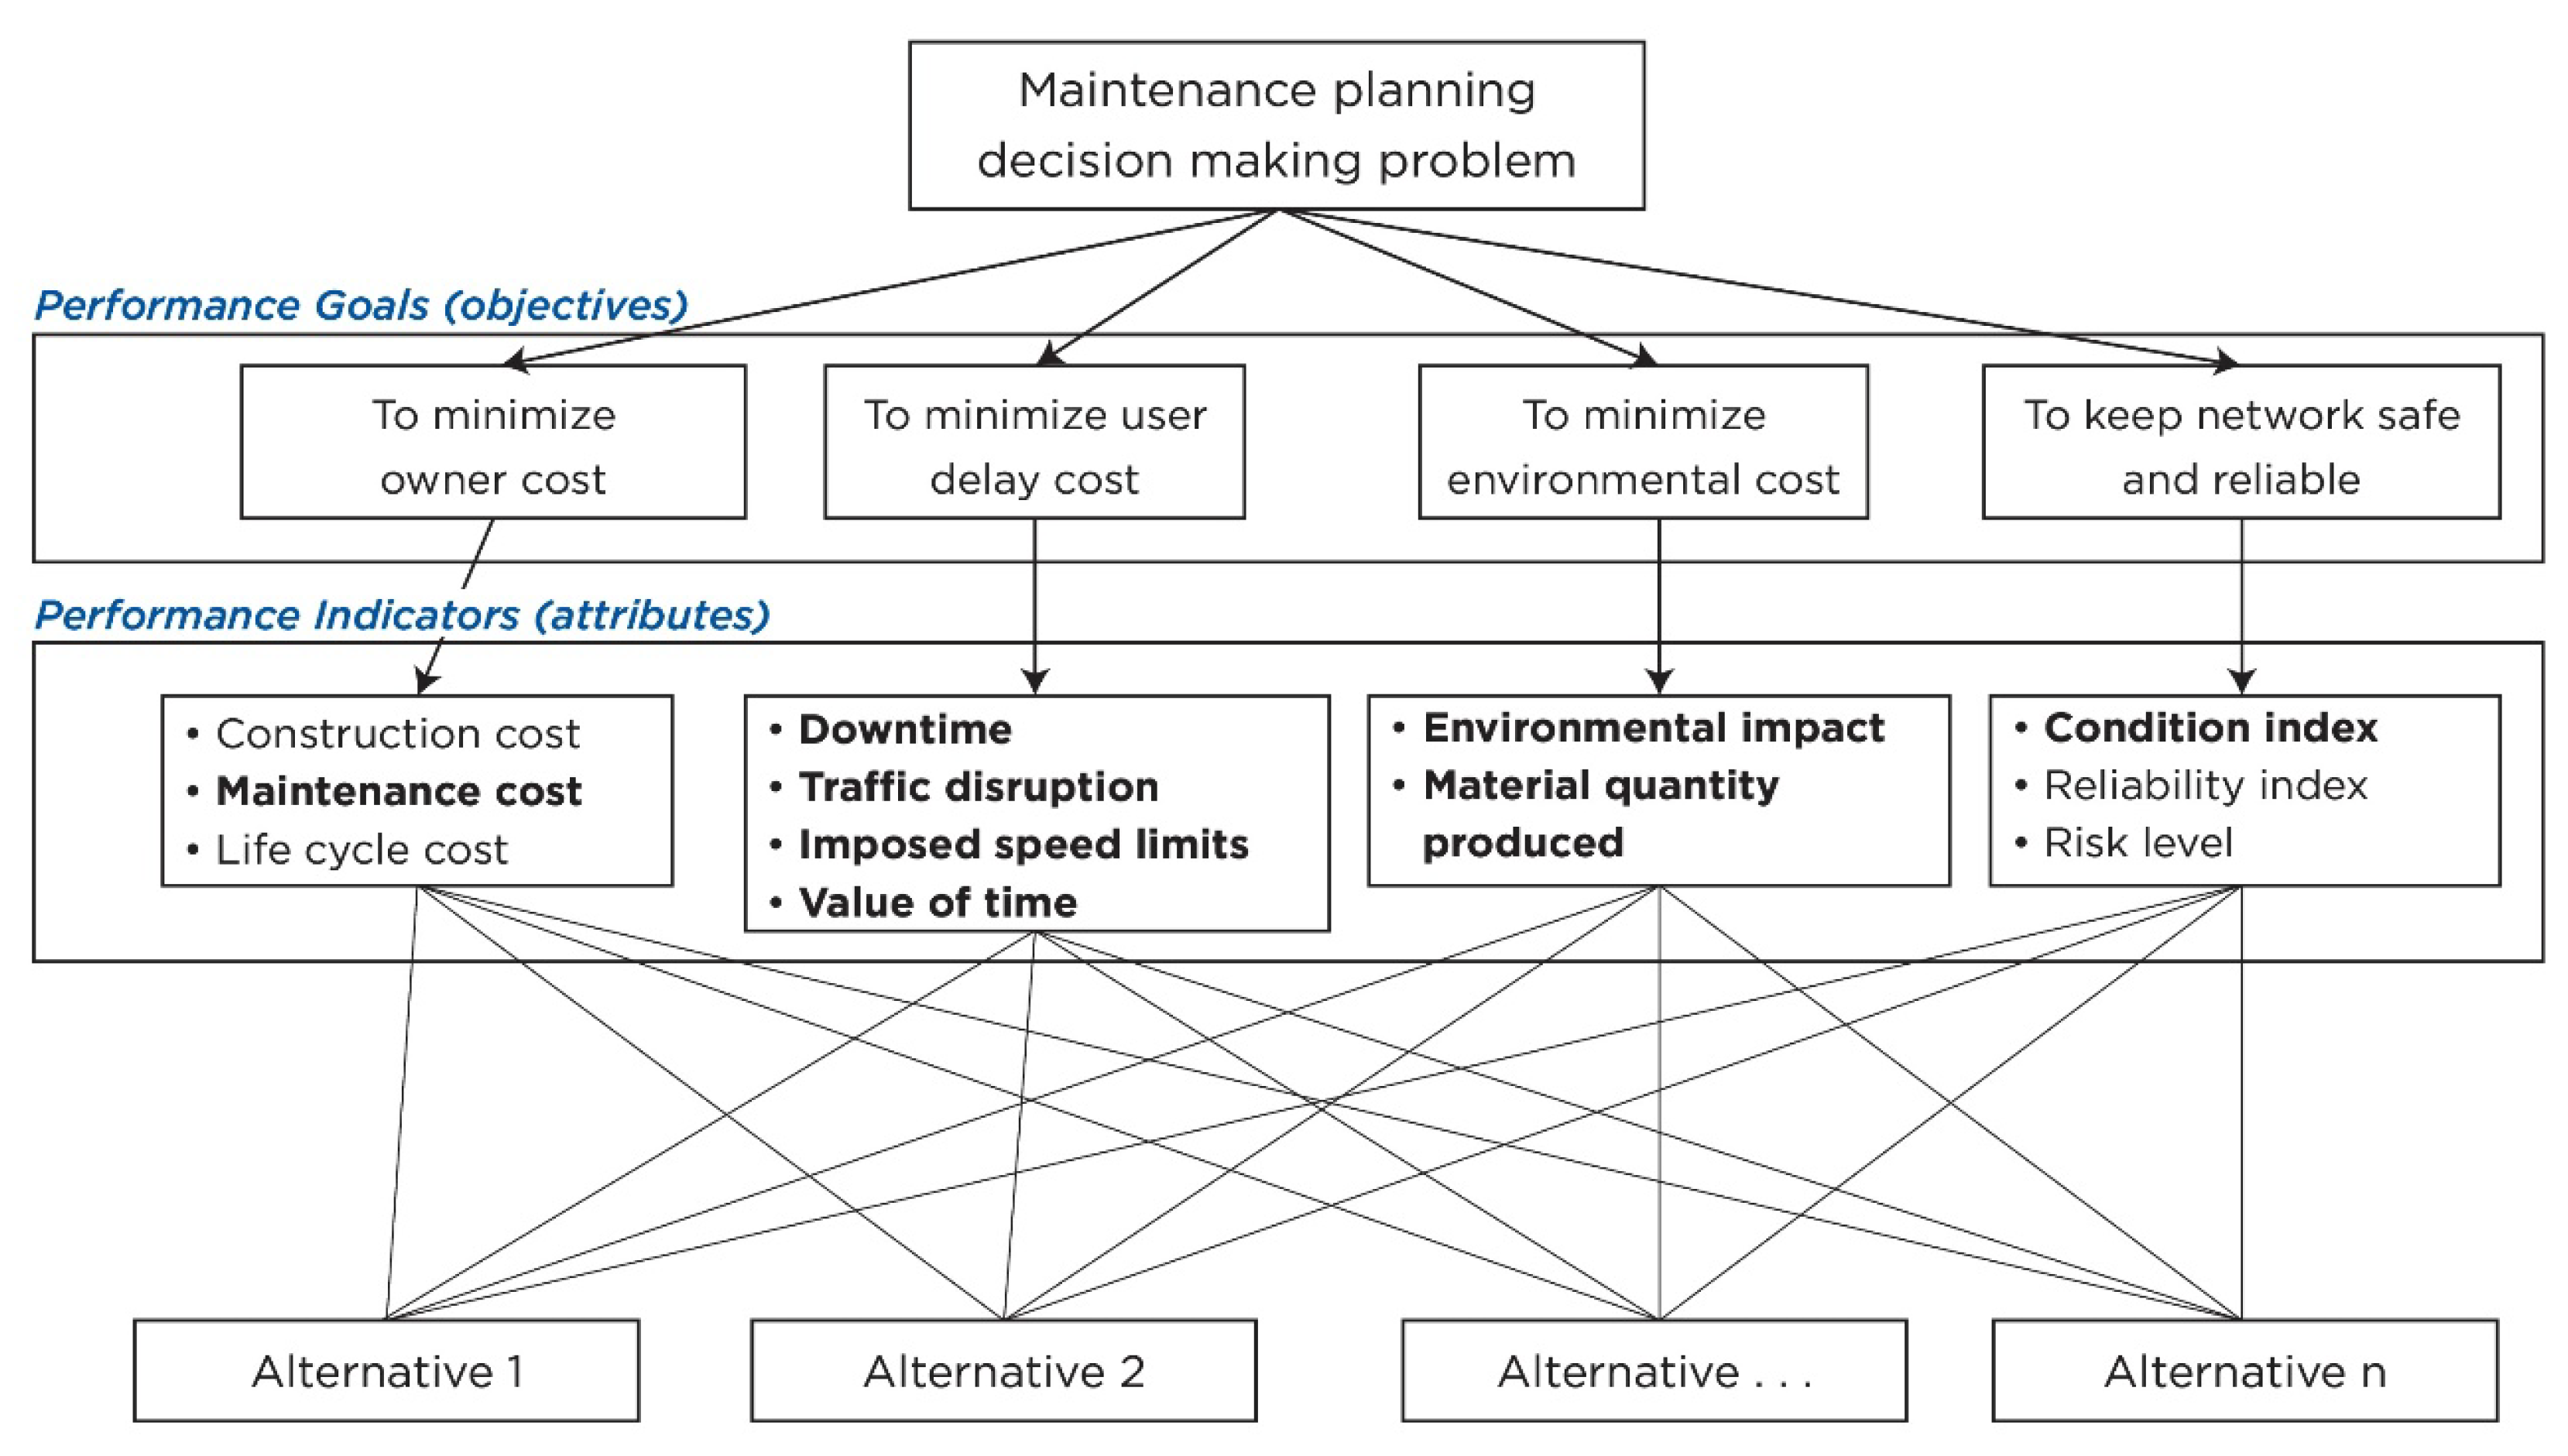
Various PGs have been set within the framework of a system with multiple objectives, and different bridge and network functionality factors are considered. This research finds five performance factors: Reliability, Availability, Economy, Environment, and Traffic Safety. Multi-criteria decision-making (MCDM) combines these factors with benefit/cost data, decision-maker, and stakeholder viewpoints to evaluate alternatives. However, Europe has a significant variance regarding quantifying performance indicators and defining objectives. Furthermore, when considering the Reliability-level at the aged state, different maintenance options should be considered, especially for the bridges below the threshold. The following three scenarios are typically considered: “do nothing”, “minor to major repair”, and “reconstruction”. Each option, if chosen, will have both direct and indirect impacts. The direct impact, such as direct costs related to maintenance activities, is often assigned as the owner’s cost and therefore represents the economic aspect of the bridge projects. On the other hands, indirect impacts, such as environmental impacts or traffic delay, are quantified in two stages: during regular operation or during maintenance interventions. The overview of suggest KPIs for each performance aspect is given in the
Figure 3:
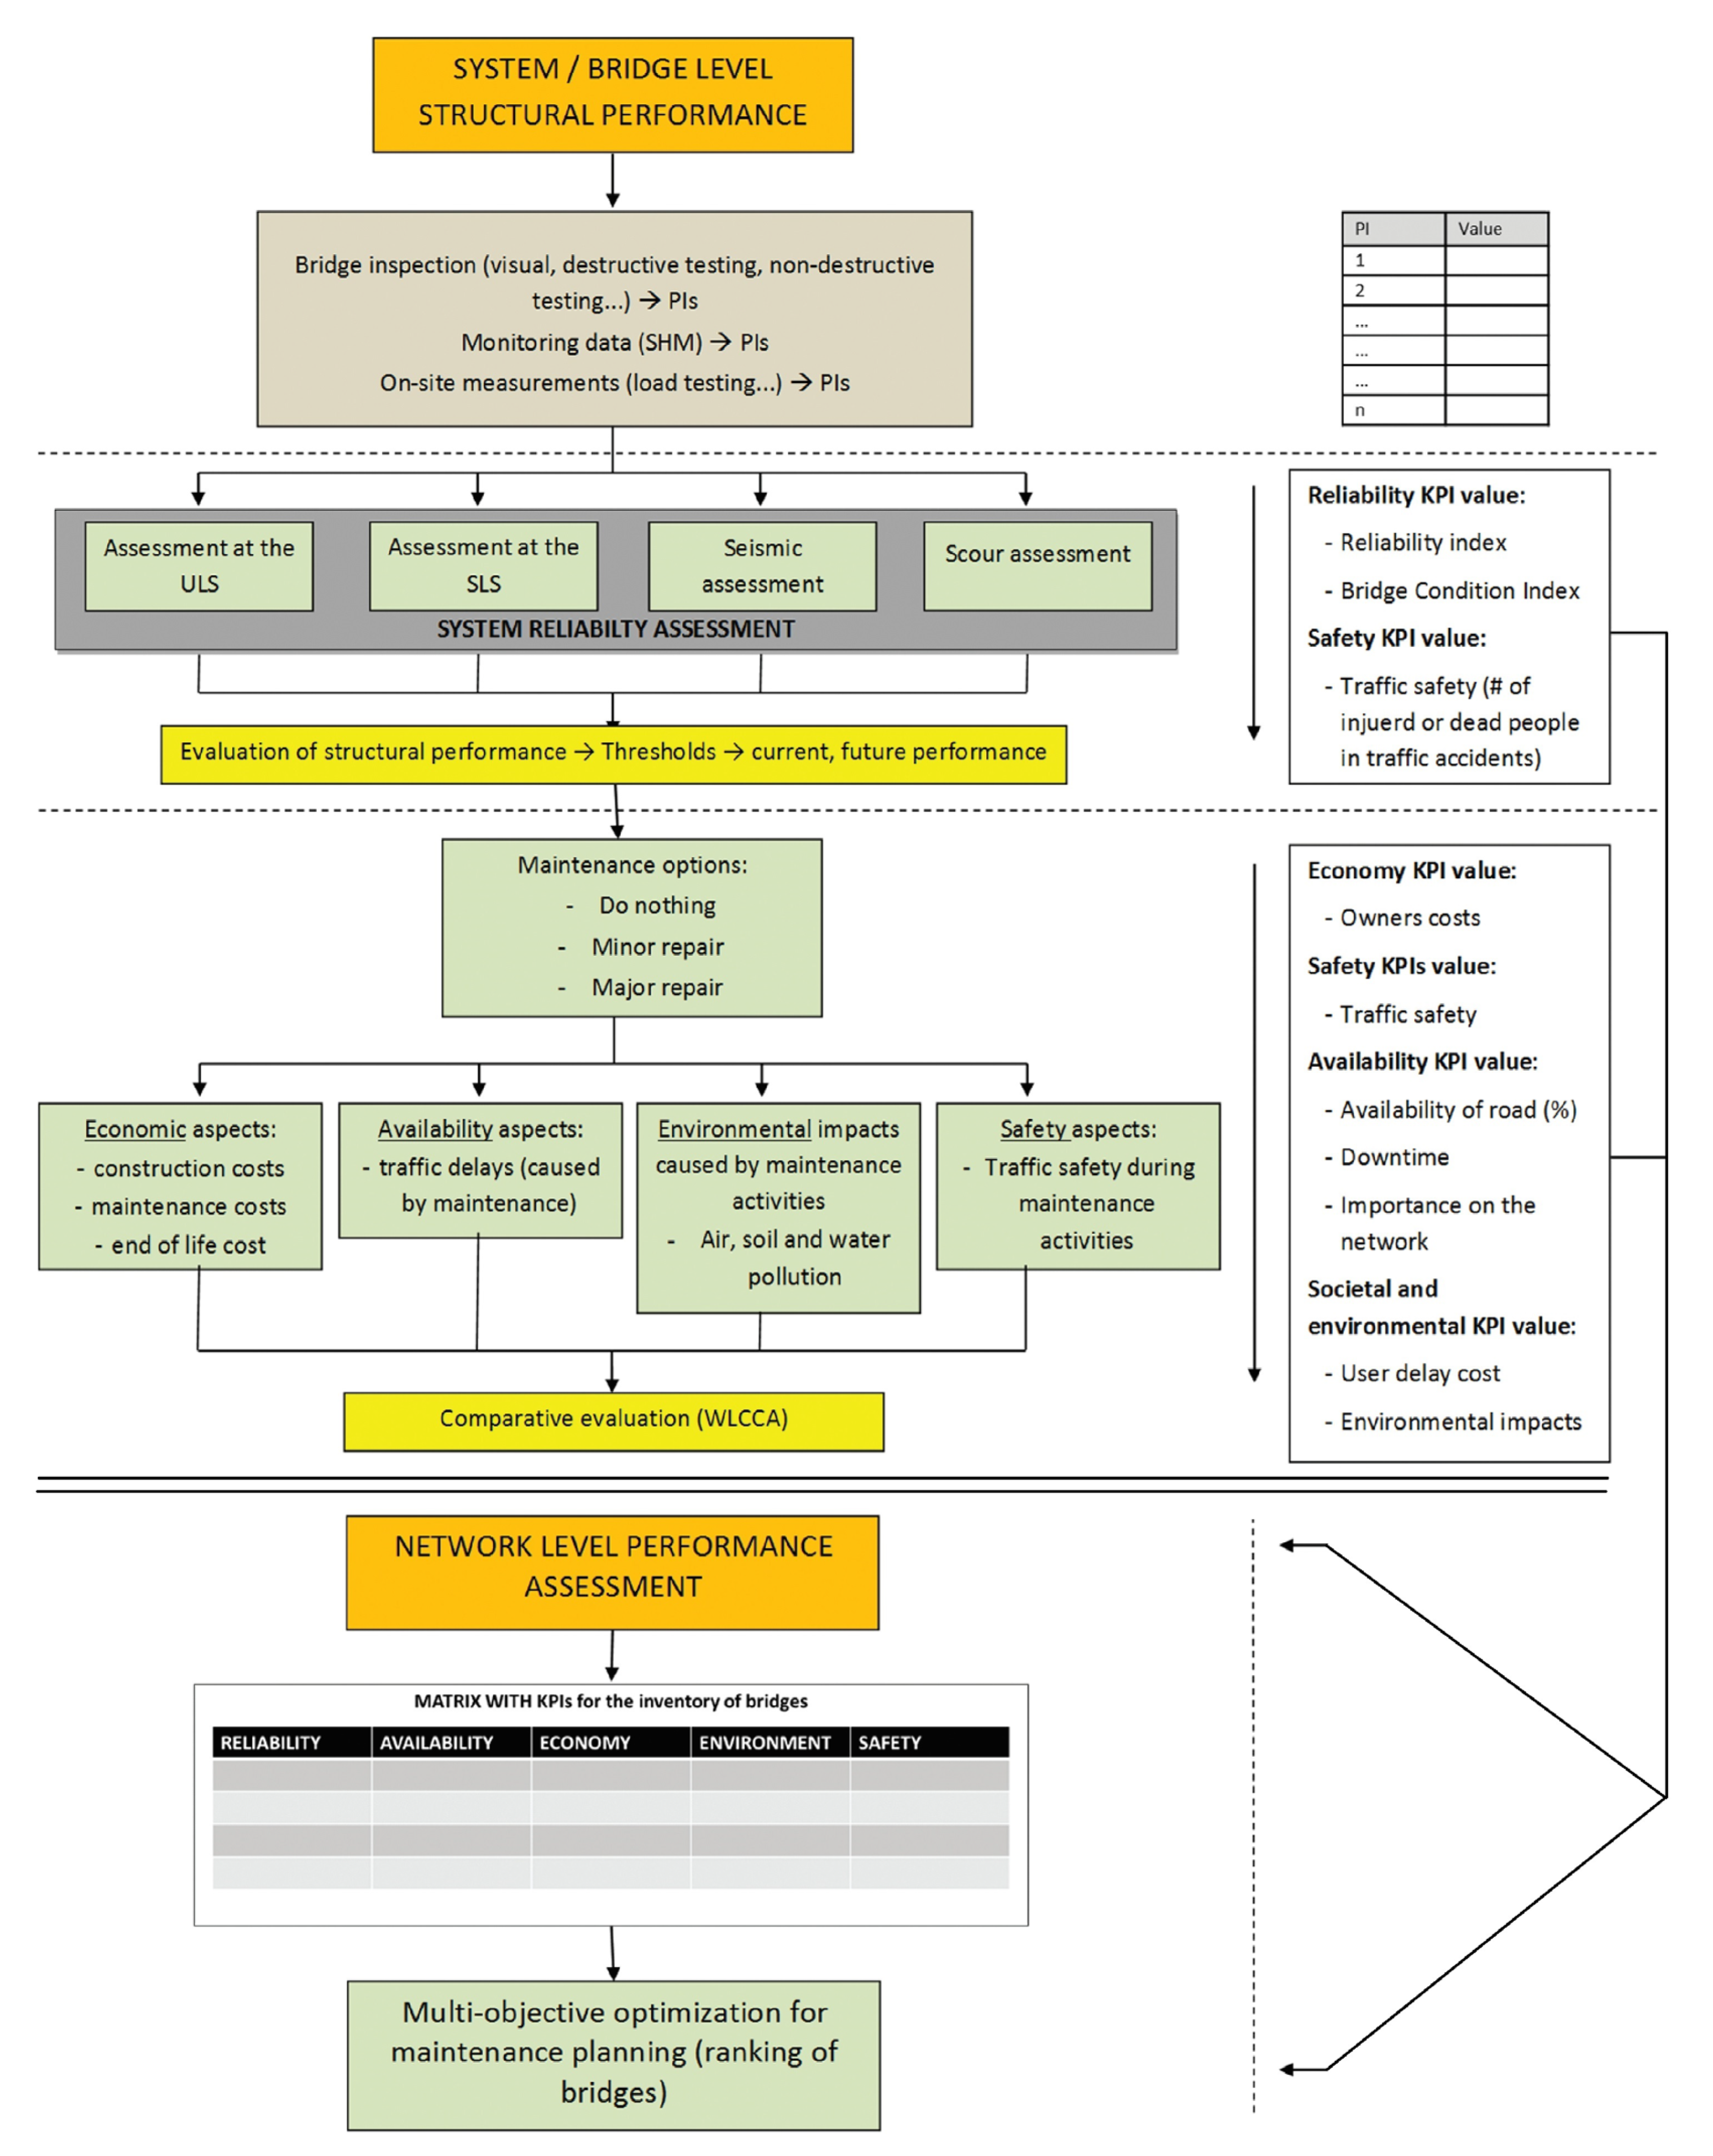
Figure 4 depicts a procedure for assessing performance objectives and transitioning to the network level. Since the focus on the effective execution of network-level performance increases, it extends the demand for information within the interactions between social goals and roadway networks. Leveraging asset management should improve infrastructure requirements for performance integration. When doing so, bridge and roadway administrators face several challenges, such as quantifying performance objectives and indicators, transforming from the level of the network to the level of the object and vice versa, and establishing comprehensive PIs.
Typically, network and even social goals are defined broadly. In addition, smaller-scale PIs and higher-level objectives frequently lack exclusivity. Furthermore, in many nations, the condition evaluation of specific structures and components is continuously the main focus of bridge management. This research includes capturing performance objectives, from strategic decisions at the highest level to system-specific requirements. It likewise attempted to clarify how different performance aspects, including traffic safety, availability, economy, and environmental and social impacts, can be quantified and incorporated into the multiple-purpose bridge performance objectives evaluation. The standardization of evaluation procedures, accumulation of performance indicators, measurement of KPIs, and the establishment of field-applicable maintenance tools for optimization should be paid more attention.
3. Quality Control Plan
3.1. Bridge Assessment
For extant bridges, the most apparent KPIs are safety and serviceability. It can be utilized together with additional durability, stability, price, and functionality indicators of durability, stability, price, and functionality. In this regard, the qualitative KPI proposal (which varied between one to five) is defined as follows:
S, R, S—a combination of safety, reliability, and security KPIs;
A, M—a combination of availability and maintainability KPIs;
€—Economy KPI;
E—Environment KPI;
H, P—a combined health and politics KPIs;
While safety is explicitly considered, availability also includes serviceability.
Figure 5 illustrates the overall outcome as a “Spider Net” diagram. The more significant area covered through the graph’s KPI values, the better the bridge’s performance. This layout is appropriate for both a single bridge and an entire network of bridges.
It still takes numerous considerations to iron out all the kinks in KPI evaluation determined by performance indicators (PIs), and there are sometimes when “Reliability” and “Availability” seem to be interchangeable. The term “Maintainability” relates to a component’s ease of maintenance, such as repairing damages, replacing damaged elements without breaking still-functioning parts, and preventing unplanned maintenance actions. In terms of aesthetics, it could be classified under “Economy.” When discussing the extent of protection regarding vandalism, “Security” is synonymous with “Maintenance.” The key performance indicators (KPIs) and their definitions are taken into account in this paper:
The term “Reliability” is commonly used to refer to the probability that a bridge will fit with desired functionality during its lifecycle.
The percentage of time a system is measured by its “Availability.” It is different with bridge’s dependence but instead with maintenance interventions that have been predetermined (such as longer commute times as a result of a new traffic pattern).
For the duration of the bridge’s useful lifecycle, “Safety” means ensuring no one will be harmed. Death or severe injury due to a structure’s defects is not covered (see “Reliability”).
Throughout a bridge’s proper lifecycle, “Economy” means keeping costs and upkeep to a minimum. User costs due to delays and alternative routes are not considered.
The term “Environment” is commonly used to refer to efforts made to lessen wear and tear on a bridge over time.
3.2. The Framework Ontology
Different maintenance scenarios (based on inspection/investigation and forecast) will have their Key Performance Indicators (KPIs) compared within a quality control framework to determine the most practical option. Obtainability, Market, and Ecological Factors Key performance indicators (KPIs) may only be used sensibly concerning time. Here, it refers to independent and synergistic processes that can cause damage to a bridge. Bridge performance prediction, preventative maintenance planning, and rehabilitation planning benefit from awareness of these factors because of the damage they cause. The processes that cause damage are either hard to spot without the proper inspection technique or impossible to see without the appropriate maintenance plan. More precise information on damage procedures, graded depending on the environment, intensity, extent, and position, considering the damage category, cause, and affected material, can improve inspection and maintenance practices.
This study assumes that a reliability index, connected to a desired probability matched to a bridge’s suitability for its intended purpose throughout its service life, specifies safety and serviceability in line with modern rules. The cost savings could be substantial if reliability testing reveals that old bridges can be used typically. However, a simplified reliability evaluation can be undertaken based on experience and publicly available data, which may be adequate for review, despite the time and complexity involved in assessing the dependability of existing bridges. The design documentation can be used to identify relevant failure modes and vulnerable zones should be considered. Damages to these vulnerable zones or sections can significantly affect the bridge’s safety and usability and are often related to more than one type of failure.
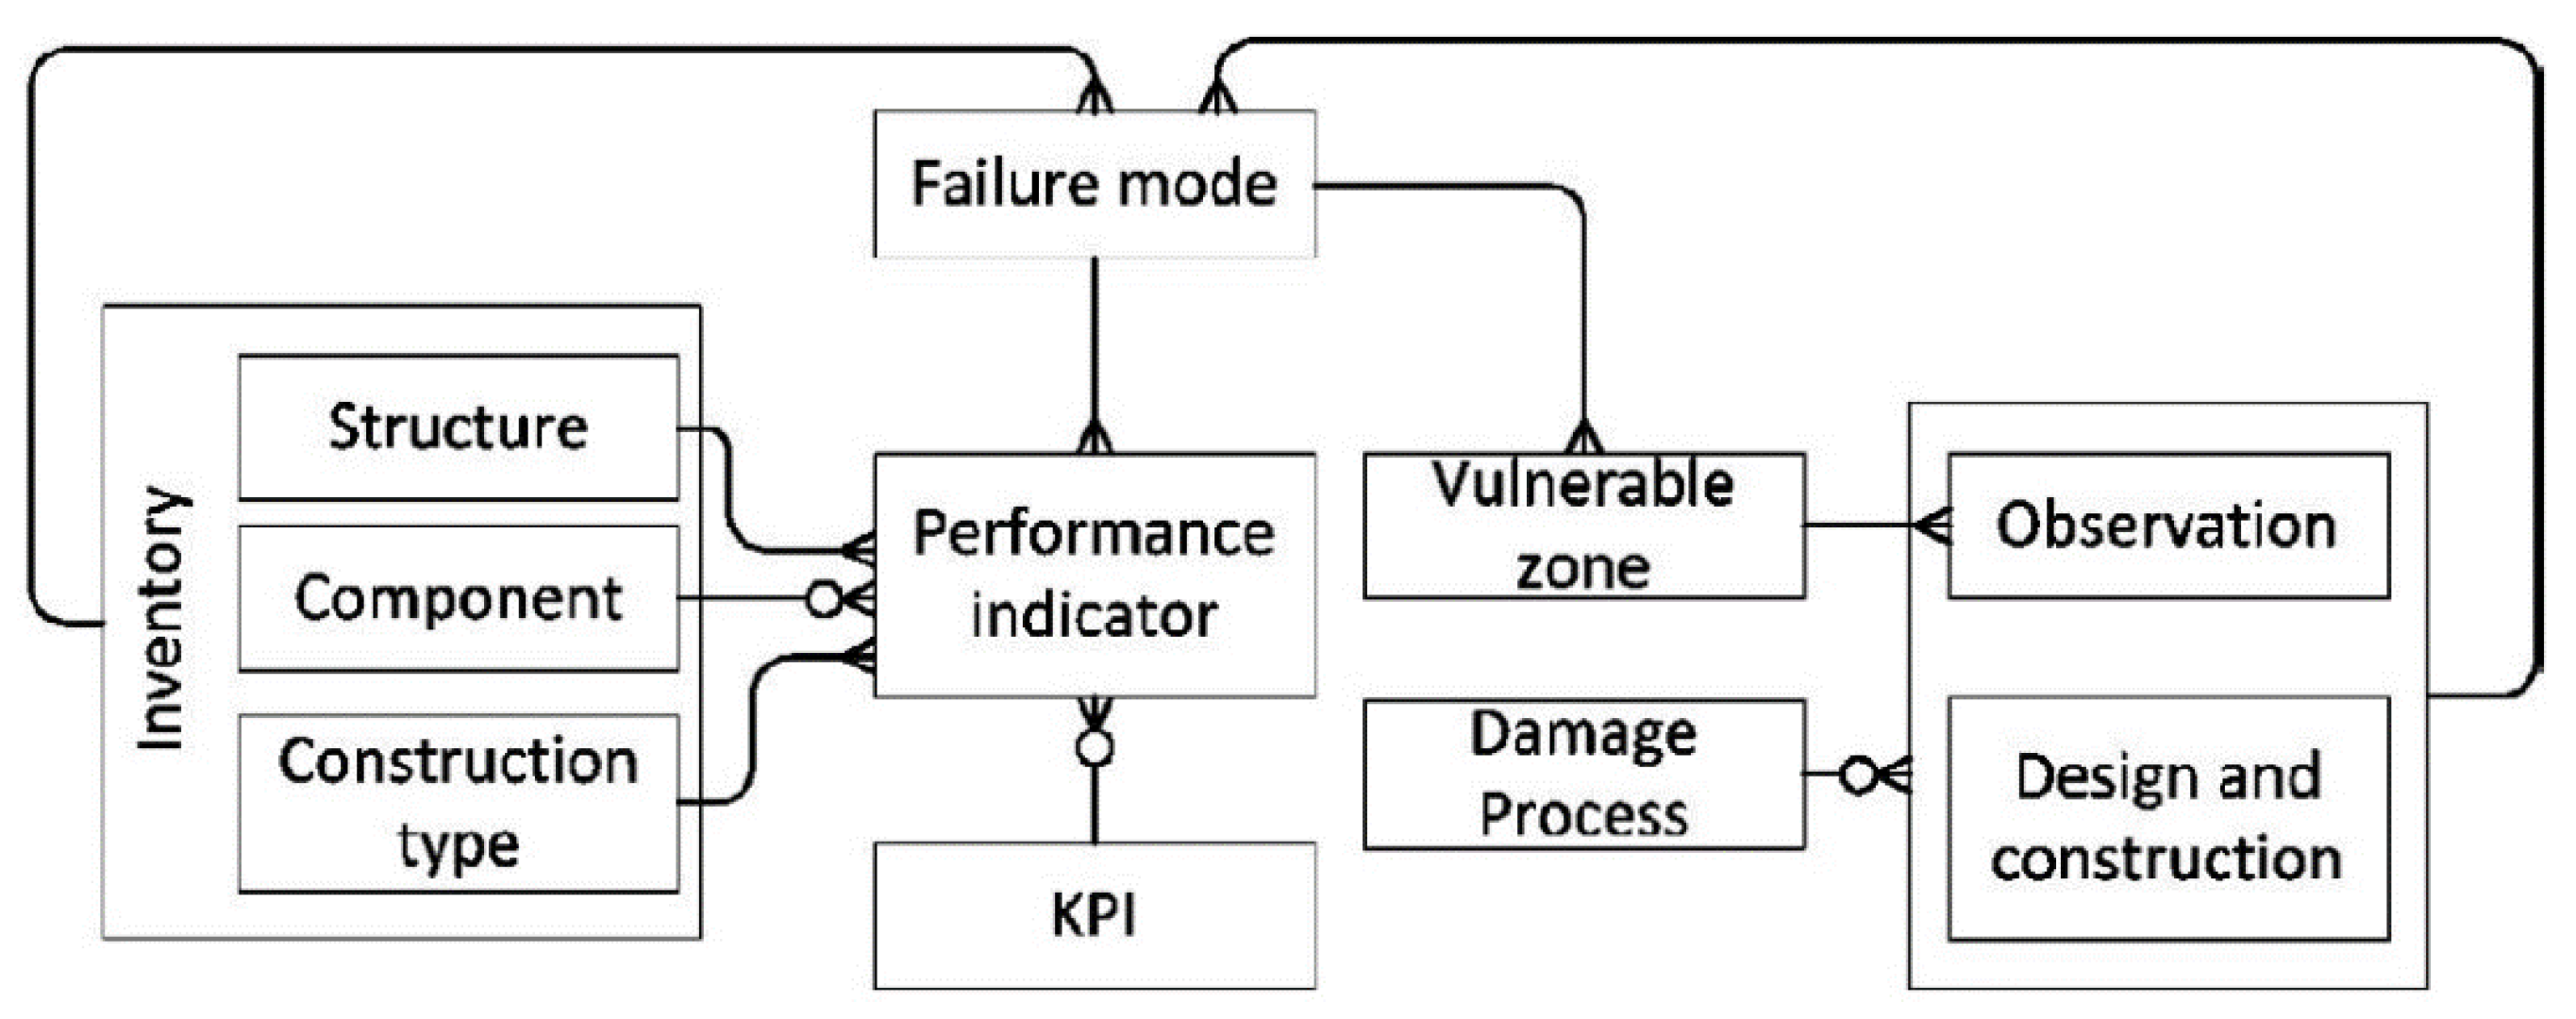
Figure 6 is a relationship diagram that displays the significant entities of the overall framework ontology. Here, the “crowfoot” denotes a one-to-many connection, while a “crowfoot with a circle” denotes a one-to-zero association.
All varieties of bridges and their constituent elements (“Components,” including girders, upper decks, and piers) are suitable for this technique. The “Inventory” is a group that can contain more than just “Construction type”; other possible members are “geometry” and “construction methodology.” Several additional entities, including the construction period, estimated loads, ground state, etc., are contained within the “Designs and Construction” entity. Deterioration, changes in geometry, etc., are all part of the “Observation” entity. That’s how it can make sense of the diagram: An element of any sort (such as a beam) exhibits an observation (such as a crack) that demonstrates a specified property (such as a crack’s width) in a susceptible region associated with a particular mechanism of the collapse of a structure (such as a girder bridge). This finding will affect a key performance indicator that has already been assigned a value based on extra information (for instance, the year of construction). Which level (such as a structure) is affected is determined at the entity level.
3.3. Vulnerable Zones
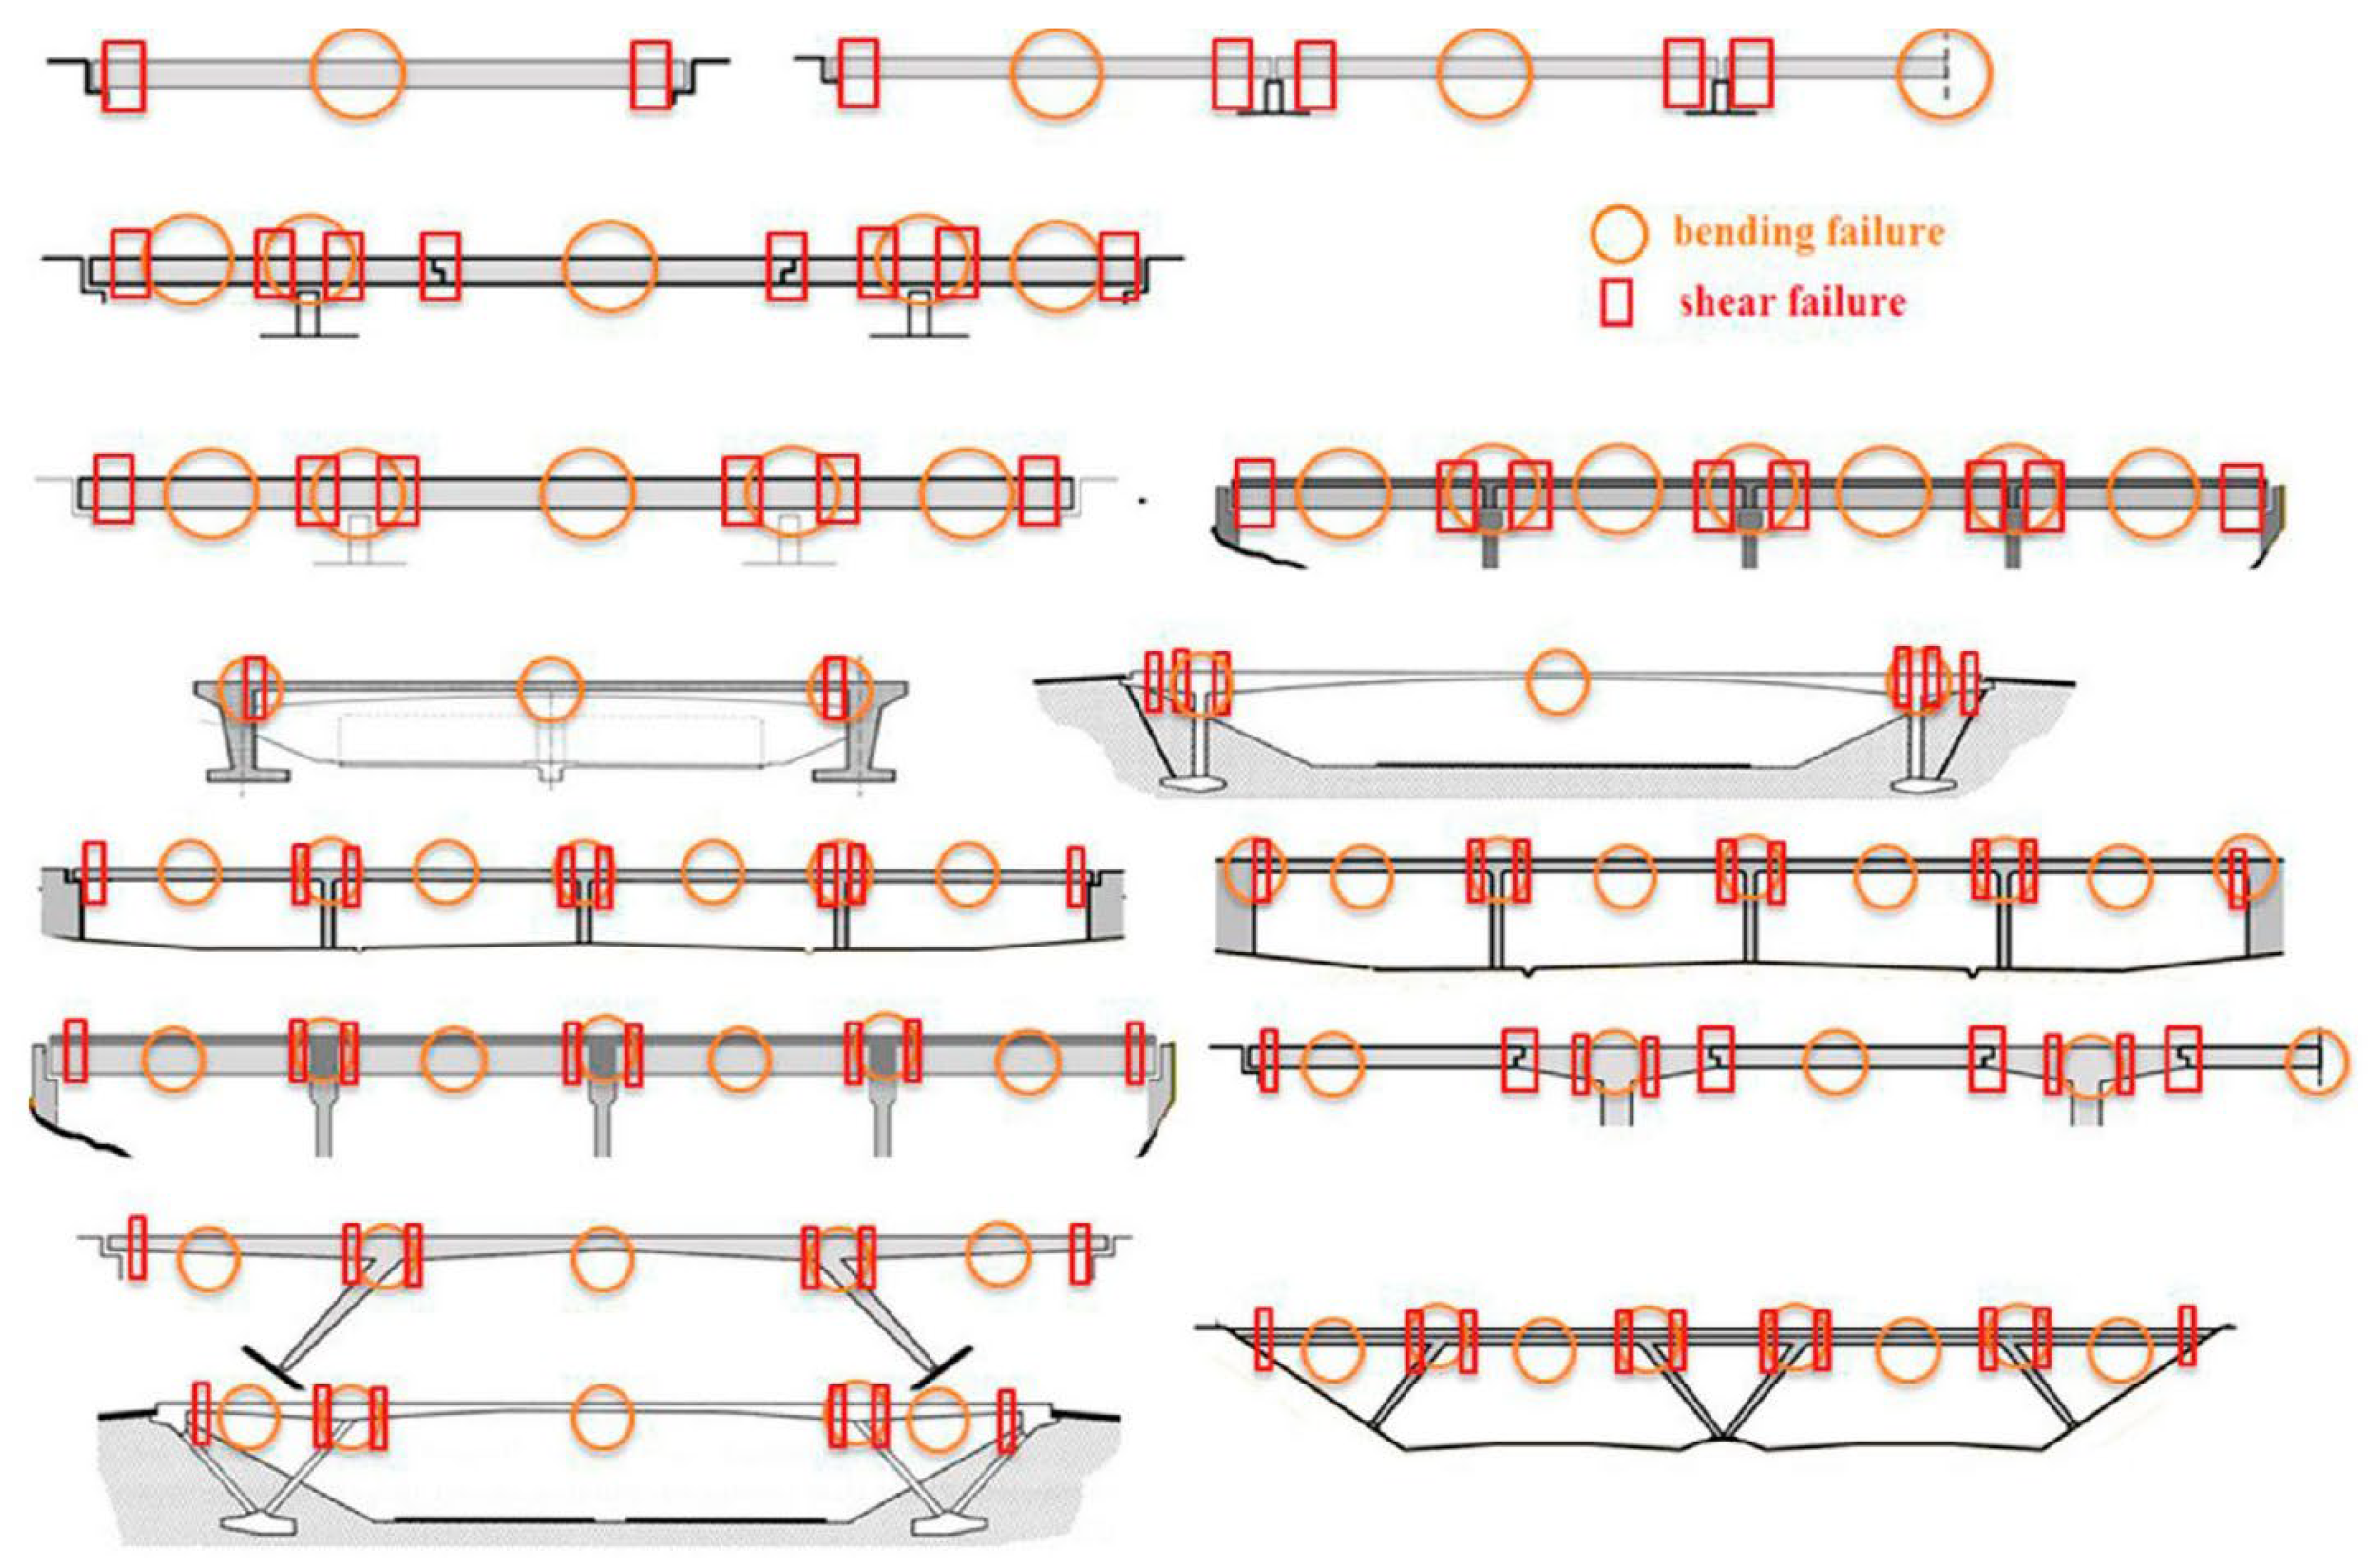
Predicting the evolution of damages can be determined through observations and knowledge about the building’s structure. A careful evaluation is necessary because of the conceptual fragility of specific design principles (for instance, hinge in girder/frame structures) regarding susceptible zones. On the other hand, several standard failure modes should be checked and labeled on typical sub-structure or superstructure elements (
Figure 7).
3.4. Derivation of KPIs from PI
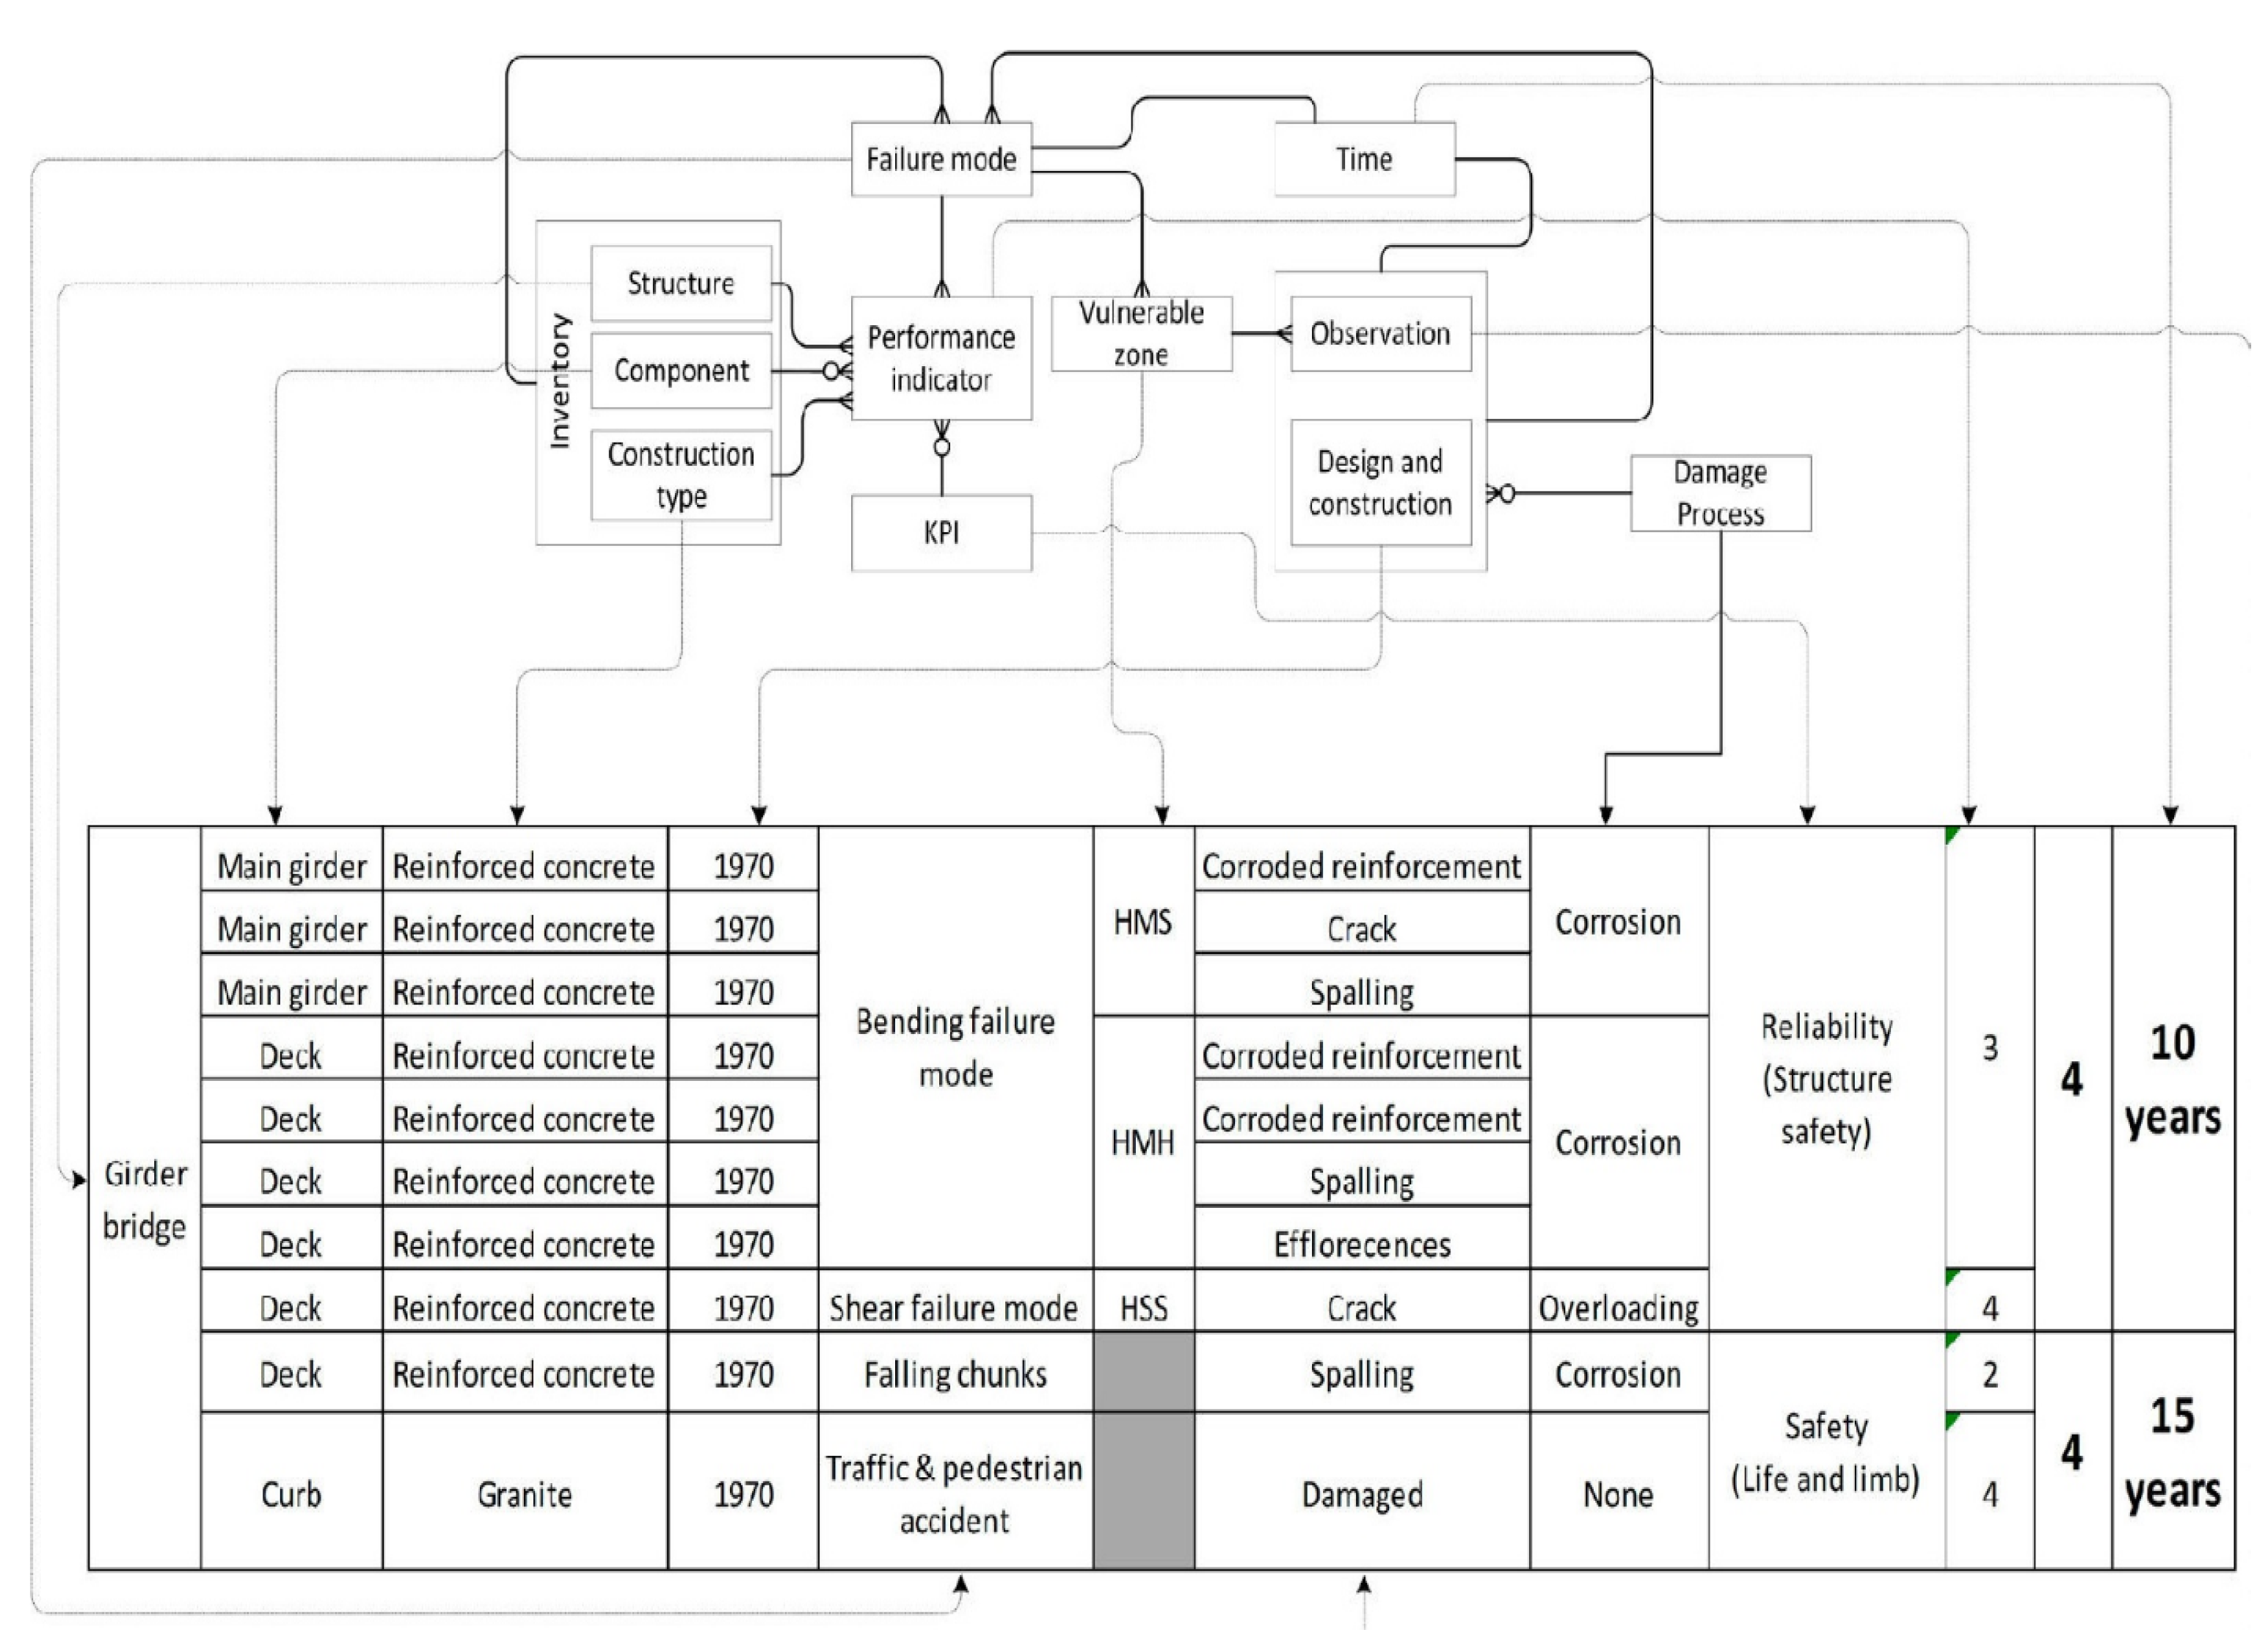
A performance evaluation using the ontology from the framework is shown as an example in
Figure 8. The tabular organization of crucial data and links highlights the connection between potential failure mechanisms and vulnerable zones. This data has been treated as “engineering judgment” by some bridge management systems and has nothing to do with bridge classification or critical observations. An Owner/Operator must assess the seriousness of the impact and estimate when the associated Key Performance Indicator value will approach an intervention level to take corrective action.
3.5. Development of KPIs over Time
All key performance indicators (KPIs) are ranked from best to worst using an integer range from one to five. Availability, Environment, and Economy are only a few KPIs that need to be stated in their original units on between one and five scales. The term “availability” describes the degree to which a system is available for use. In this case, every instant can only have a value of zero or one. For different types of vehicles, “availability” can be quantified by the amount of time it takes to get from point A to point B, which is not a simple task and may require validated traffic models. When models or data are unavailable, a subjective “Availability” ranking can be developed according to the significance of the roadway and possible alternatives. The same concept can be applied to the “Economy.”
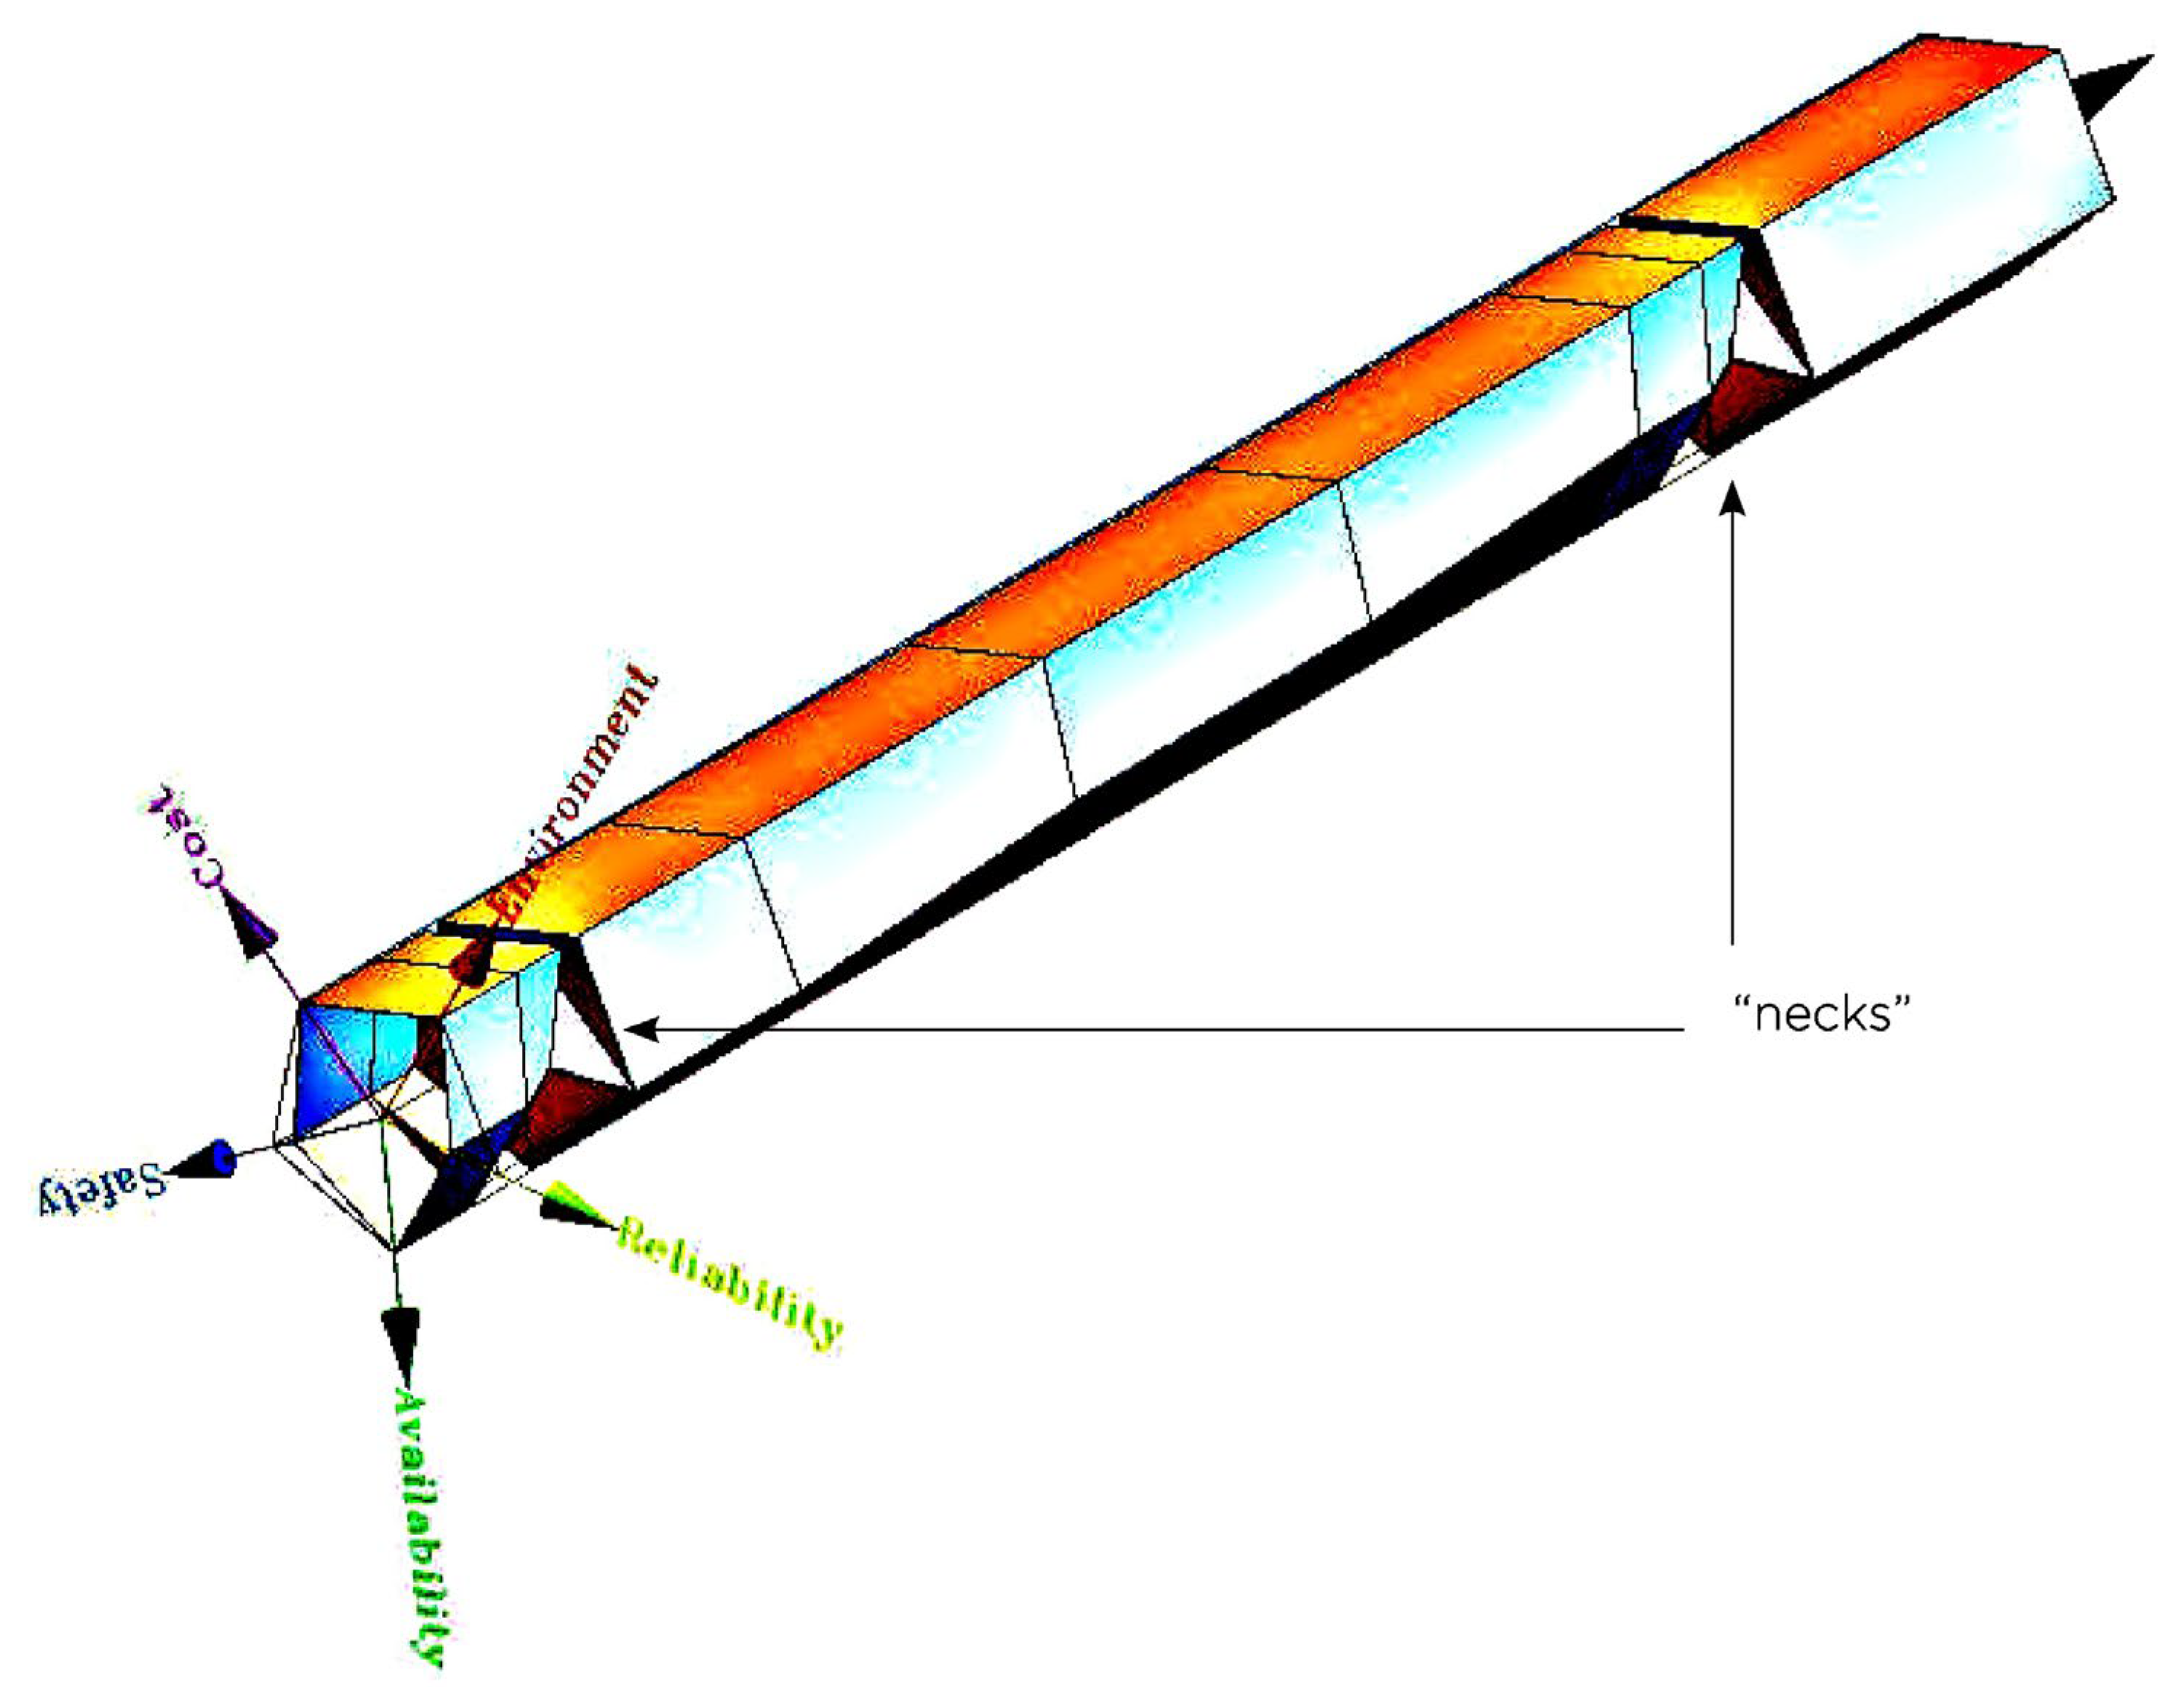
It is necessary to standardize the KPIs. As mentioned, the KPIs can be represented through a “spider diagram.” Suppose the evolution of KPIs over a period of time is significant. In that case, the timing-based axis can be directly inserted into the graph, with each KPI represented on its own axis. One “performance tube” can be created (see
Figure 9). Failure modes regarding serviceability and safety can be examined separately, and hence there might be many “Reliability” axes. The example can be used to examine maintenance options. Low performance is depicted by the “necks” in the diagram, whereas the “full” pentagon cross-sections show excellent performance. If the engineer chooses another interpretation, he might consider the space separating the “complete” pentagon from the “performance tube” as a performance gap that needs to be closed.
The NPV (Net Present Value) technique evaluates the potential future influence on monetary key performance indicators (KPIs) relative to the current impact. Regarding non-monetary KPIs, there is less agreement. While the Key Performance Indicators of roadway bridges have some economic impact, several studies highlight the challenge of valuing intangible qualities. Therefore, it was decided to apply the same cash flow treatment to the critical performance indicators of “Reliability,” “Availability,” and “Safety,” such as reducing them (through the use of NPV) in the same manner as maintaining intervention costs. These key performance indicators are more crucial now than they will be around one, two, perhaps ten years. Thus, short-term treatments may be more costly but more valuable in the long run. The NPV is split by the net present value that would be determined assuming each of the KPIs was equivalent to one over the entire inquiry period, normalizing the critical performance indicators to a comparable scale for every time occurrence. These numbers are the “average” KPIs for a year.
3.6. Quality Control Framework
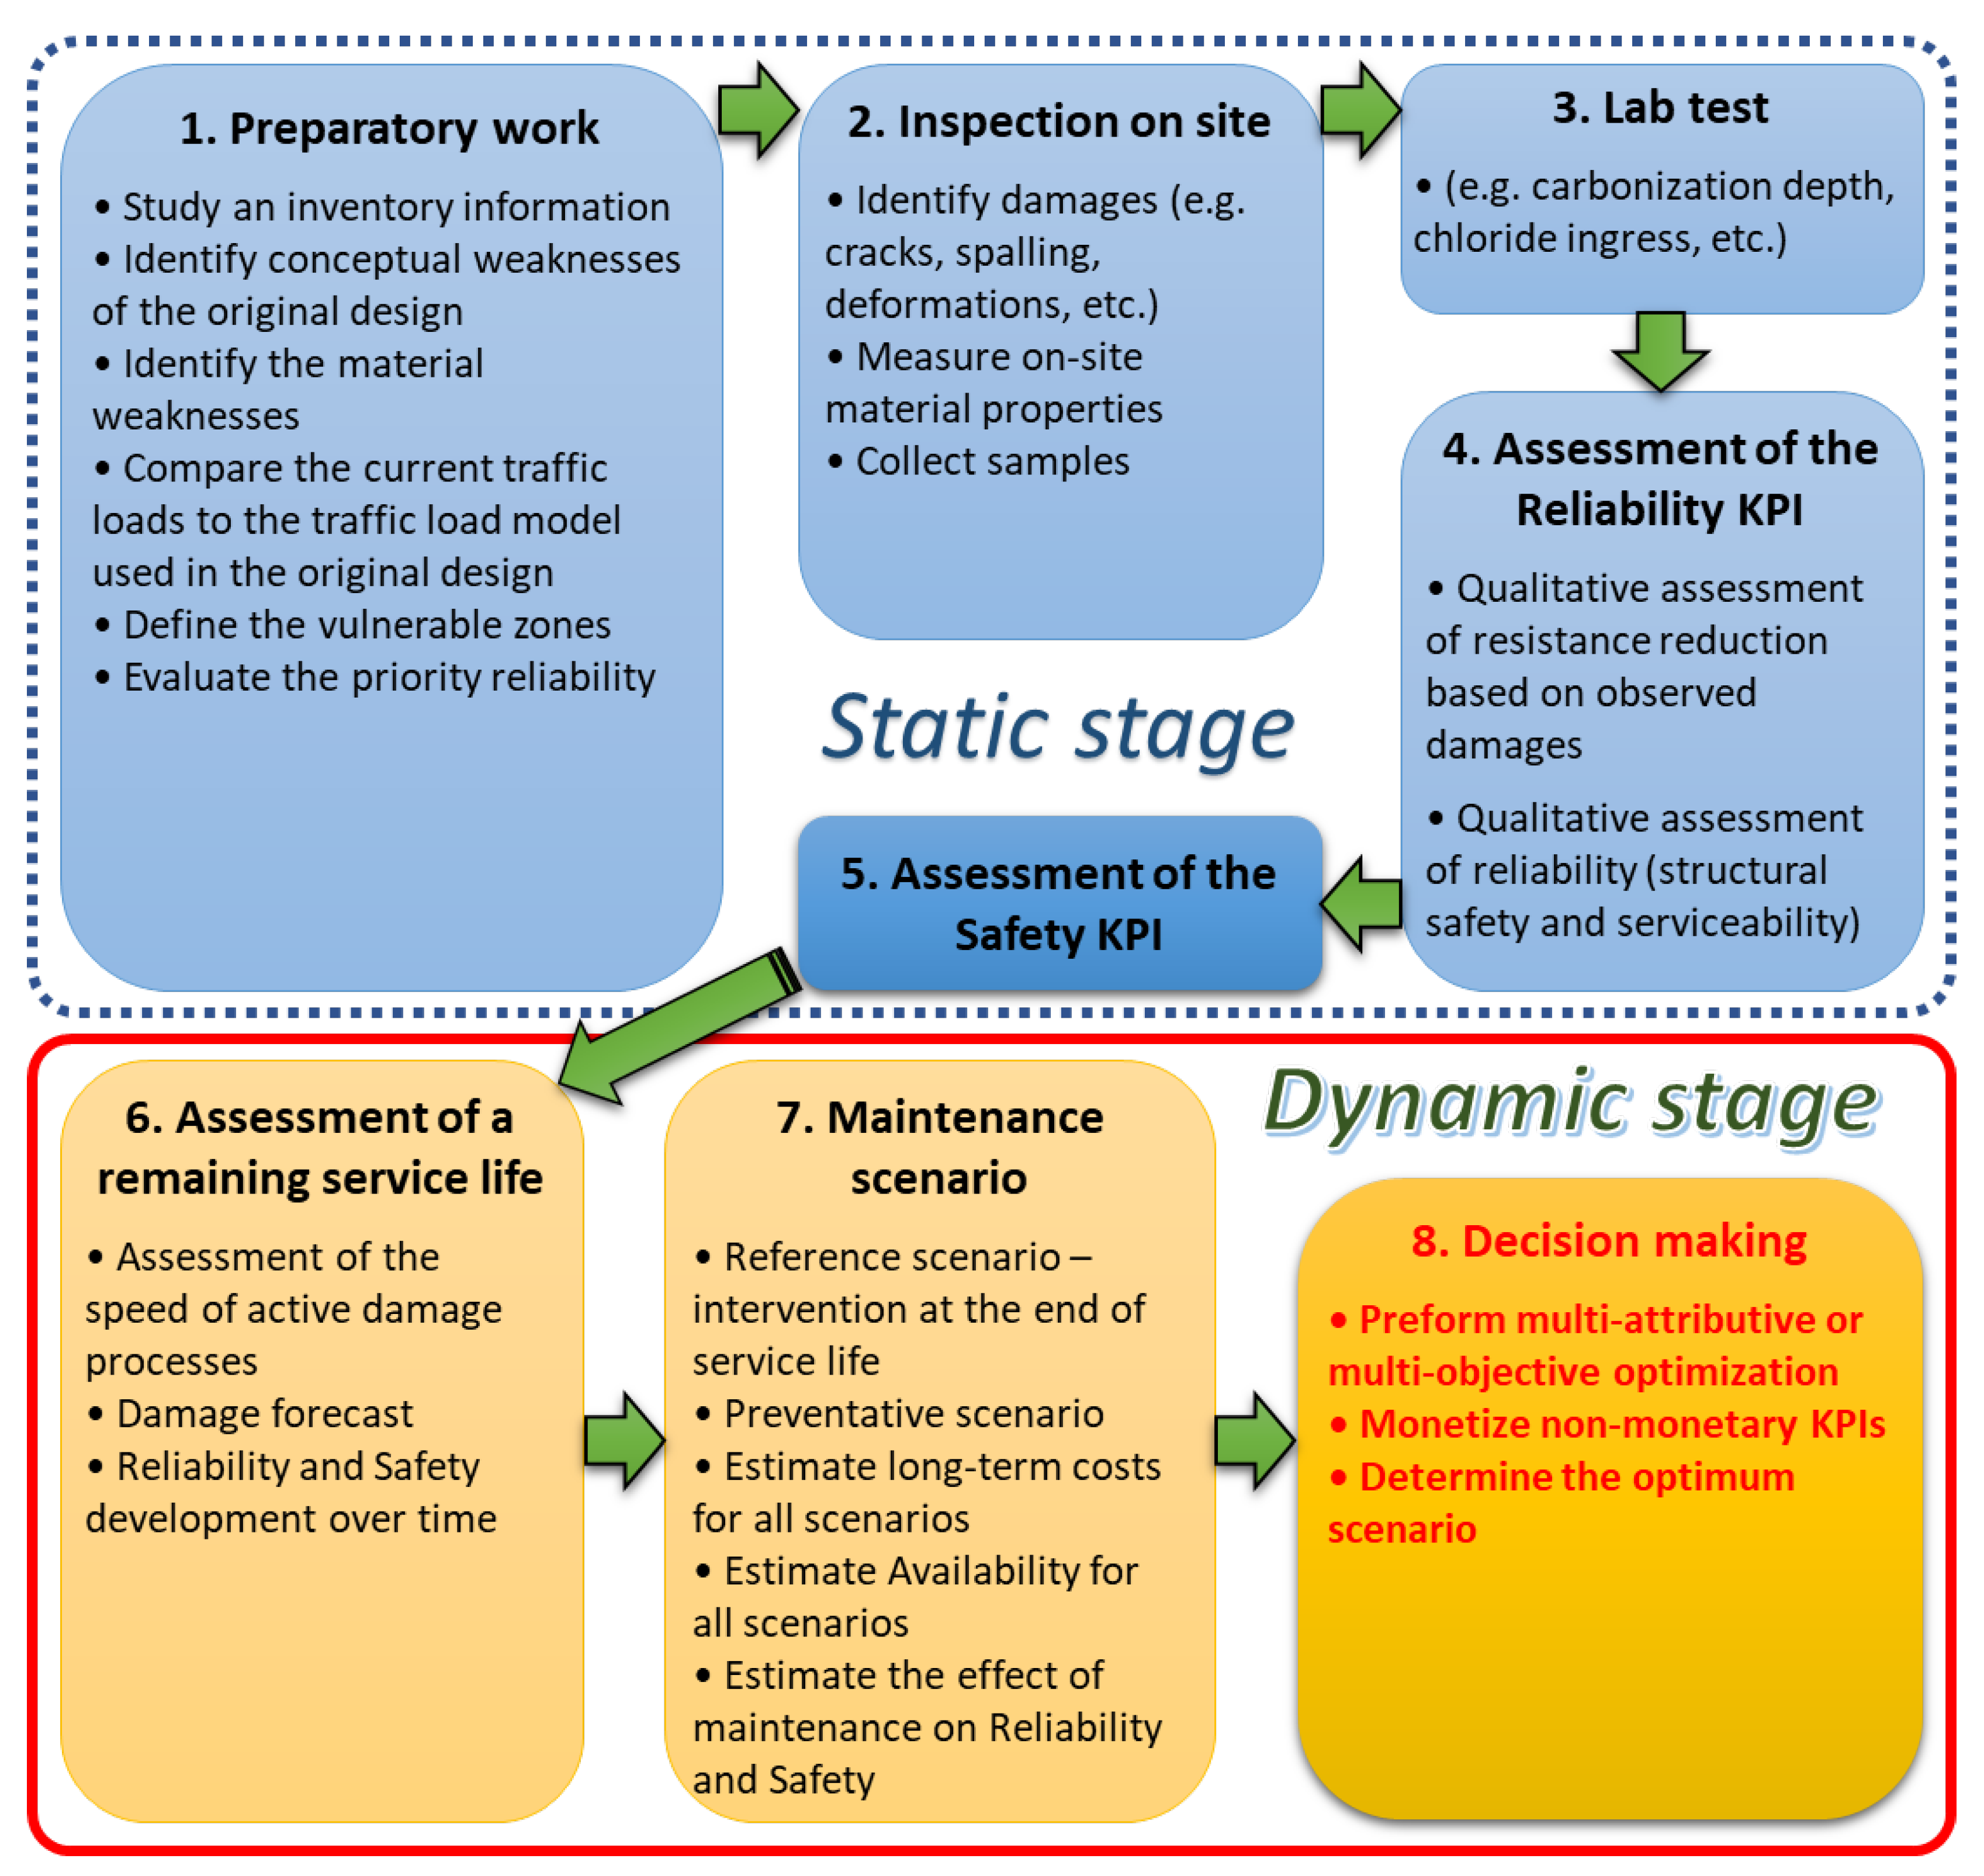
The quality control system is expected to have two phases: a static stage and a dynamic stage (see
Figure 10). Typical activities in the first stage include preparatory work, inspection responsibilities, and a quick assessment of key performance indicators. The second stage entails making decisions based on estimates of the time left in the service lifecycle, the evolution of key performance indicators, and the best possible maintenance plan.
4. Cases Study
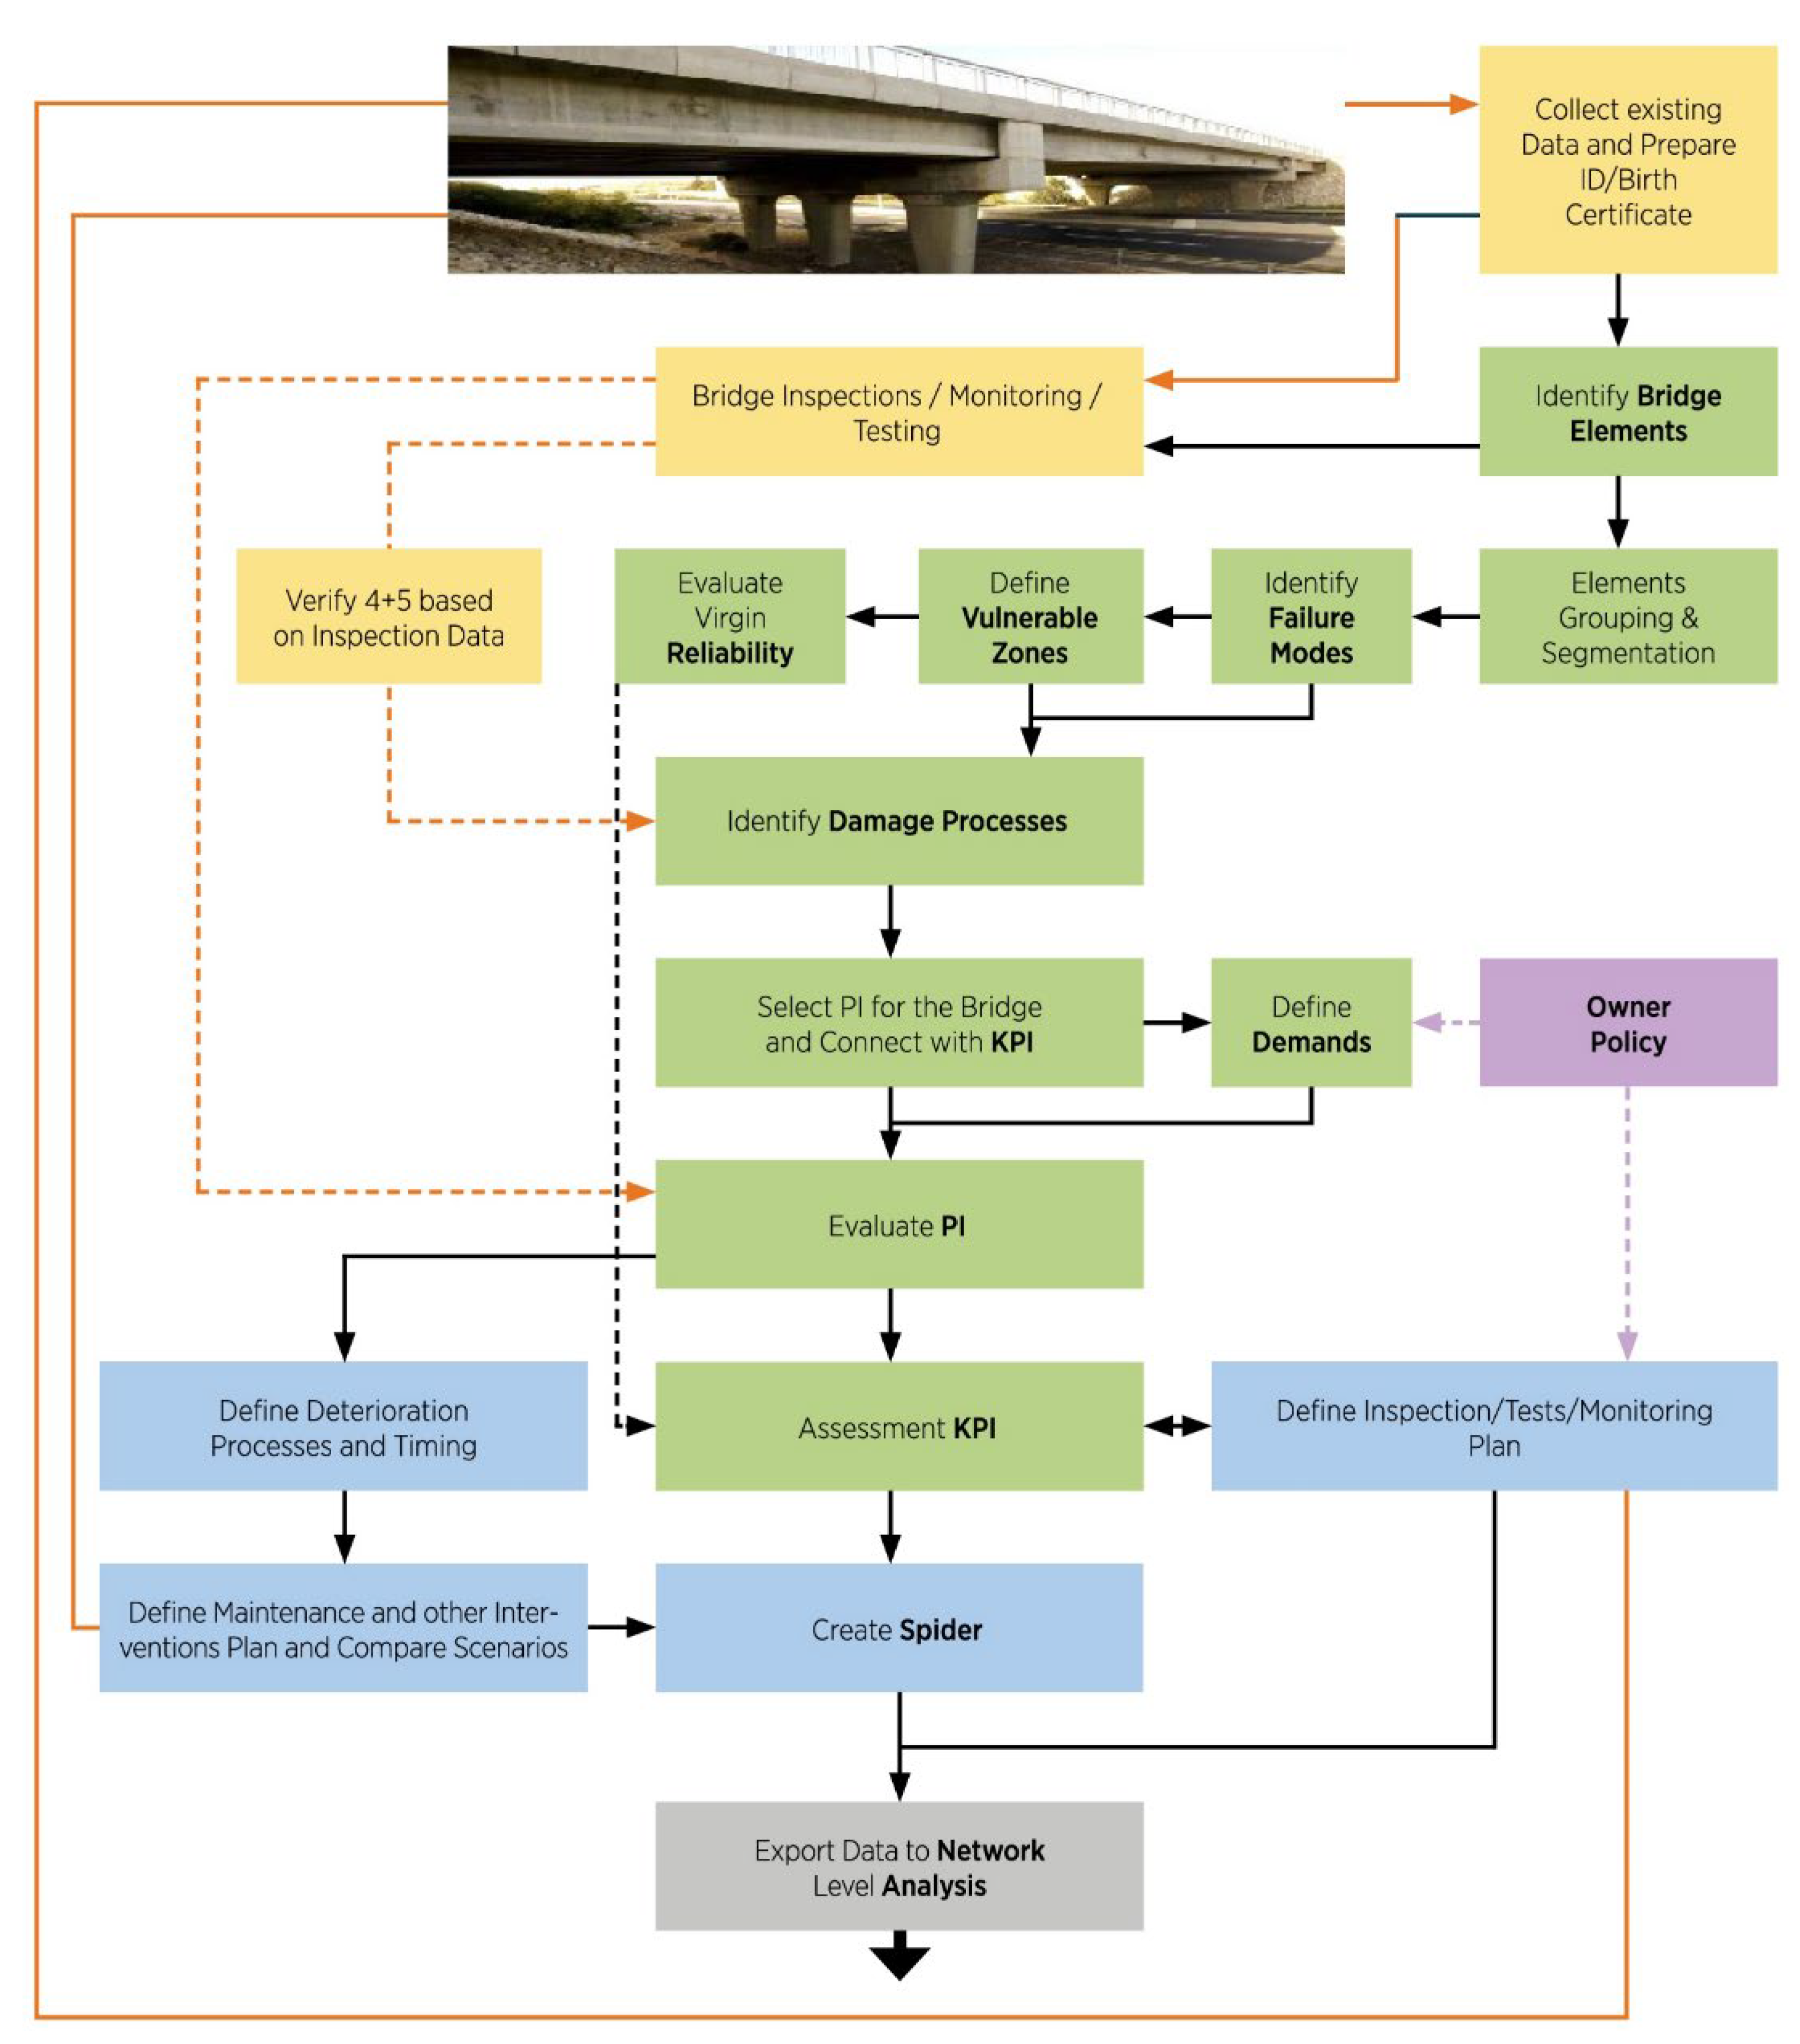
Detailed step-by-step guidance is outlined for successfully implementing the proposed QC framework in the specific bridges. In this research project, 17 case studies are conducted for the precise data collection and implementation method. The selection of two concrete bridges illustrates the scope and adaptability of the framework and application process, and it inspires confidence due to its usability. The procedure followed during the case study’s execution is shown in
Figure 11, in which different colors of tasks and their corresponding lines are due to the classification of different workgroups (WG). In this regard, WG1 (yellow) aims to explore the PIs of the bridge structure; WG2 (Blue) aims to provide an overview of existing PGs for the PIs in the WG1; then WG3 (green) will provide a methodology with the detailed step-by-step establishment of QC plans for different types of bridges; finally, WP4 (gray) then can implement the QC framework into case studies.
4.1. Czech Republic Girder Bridge Case Study
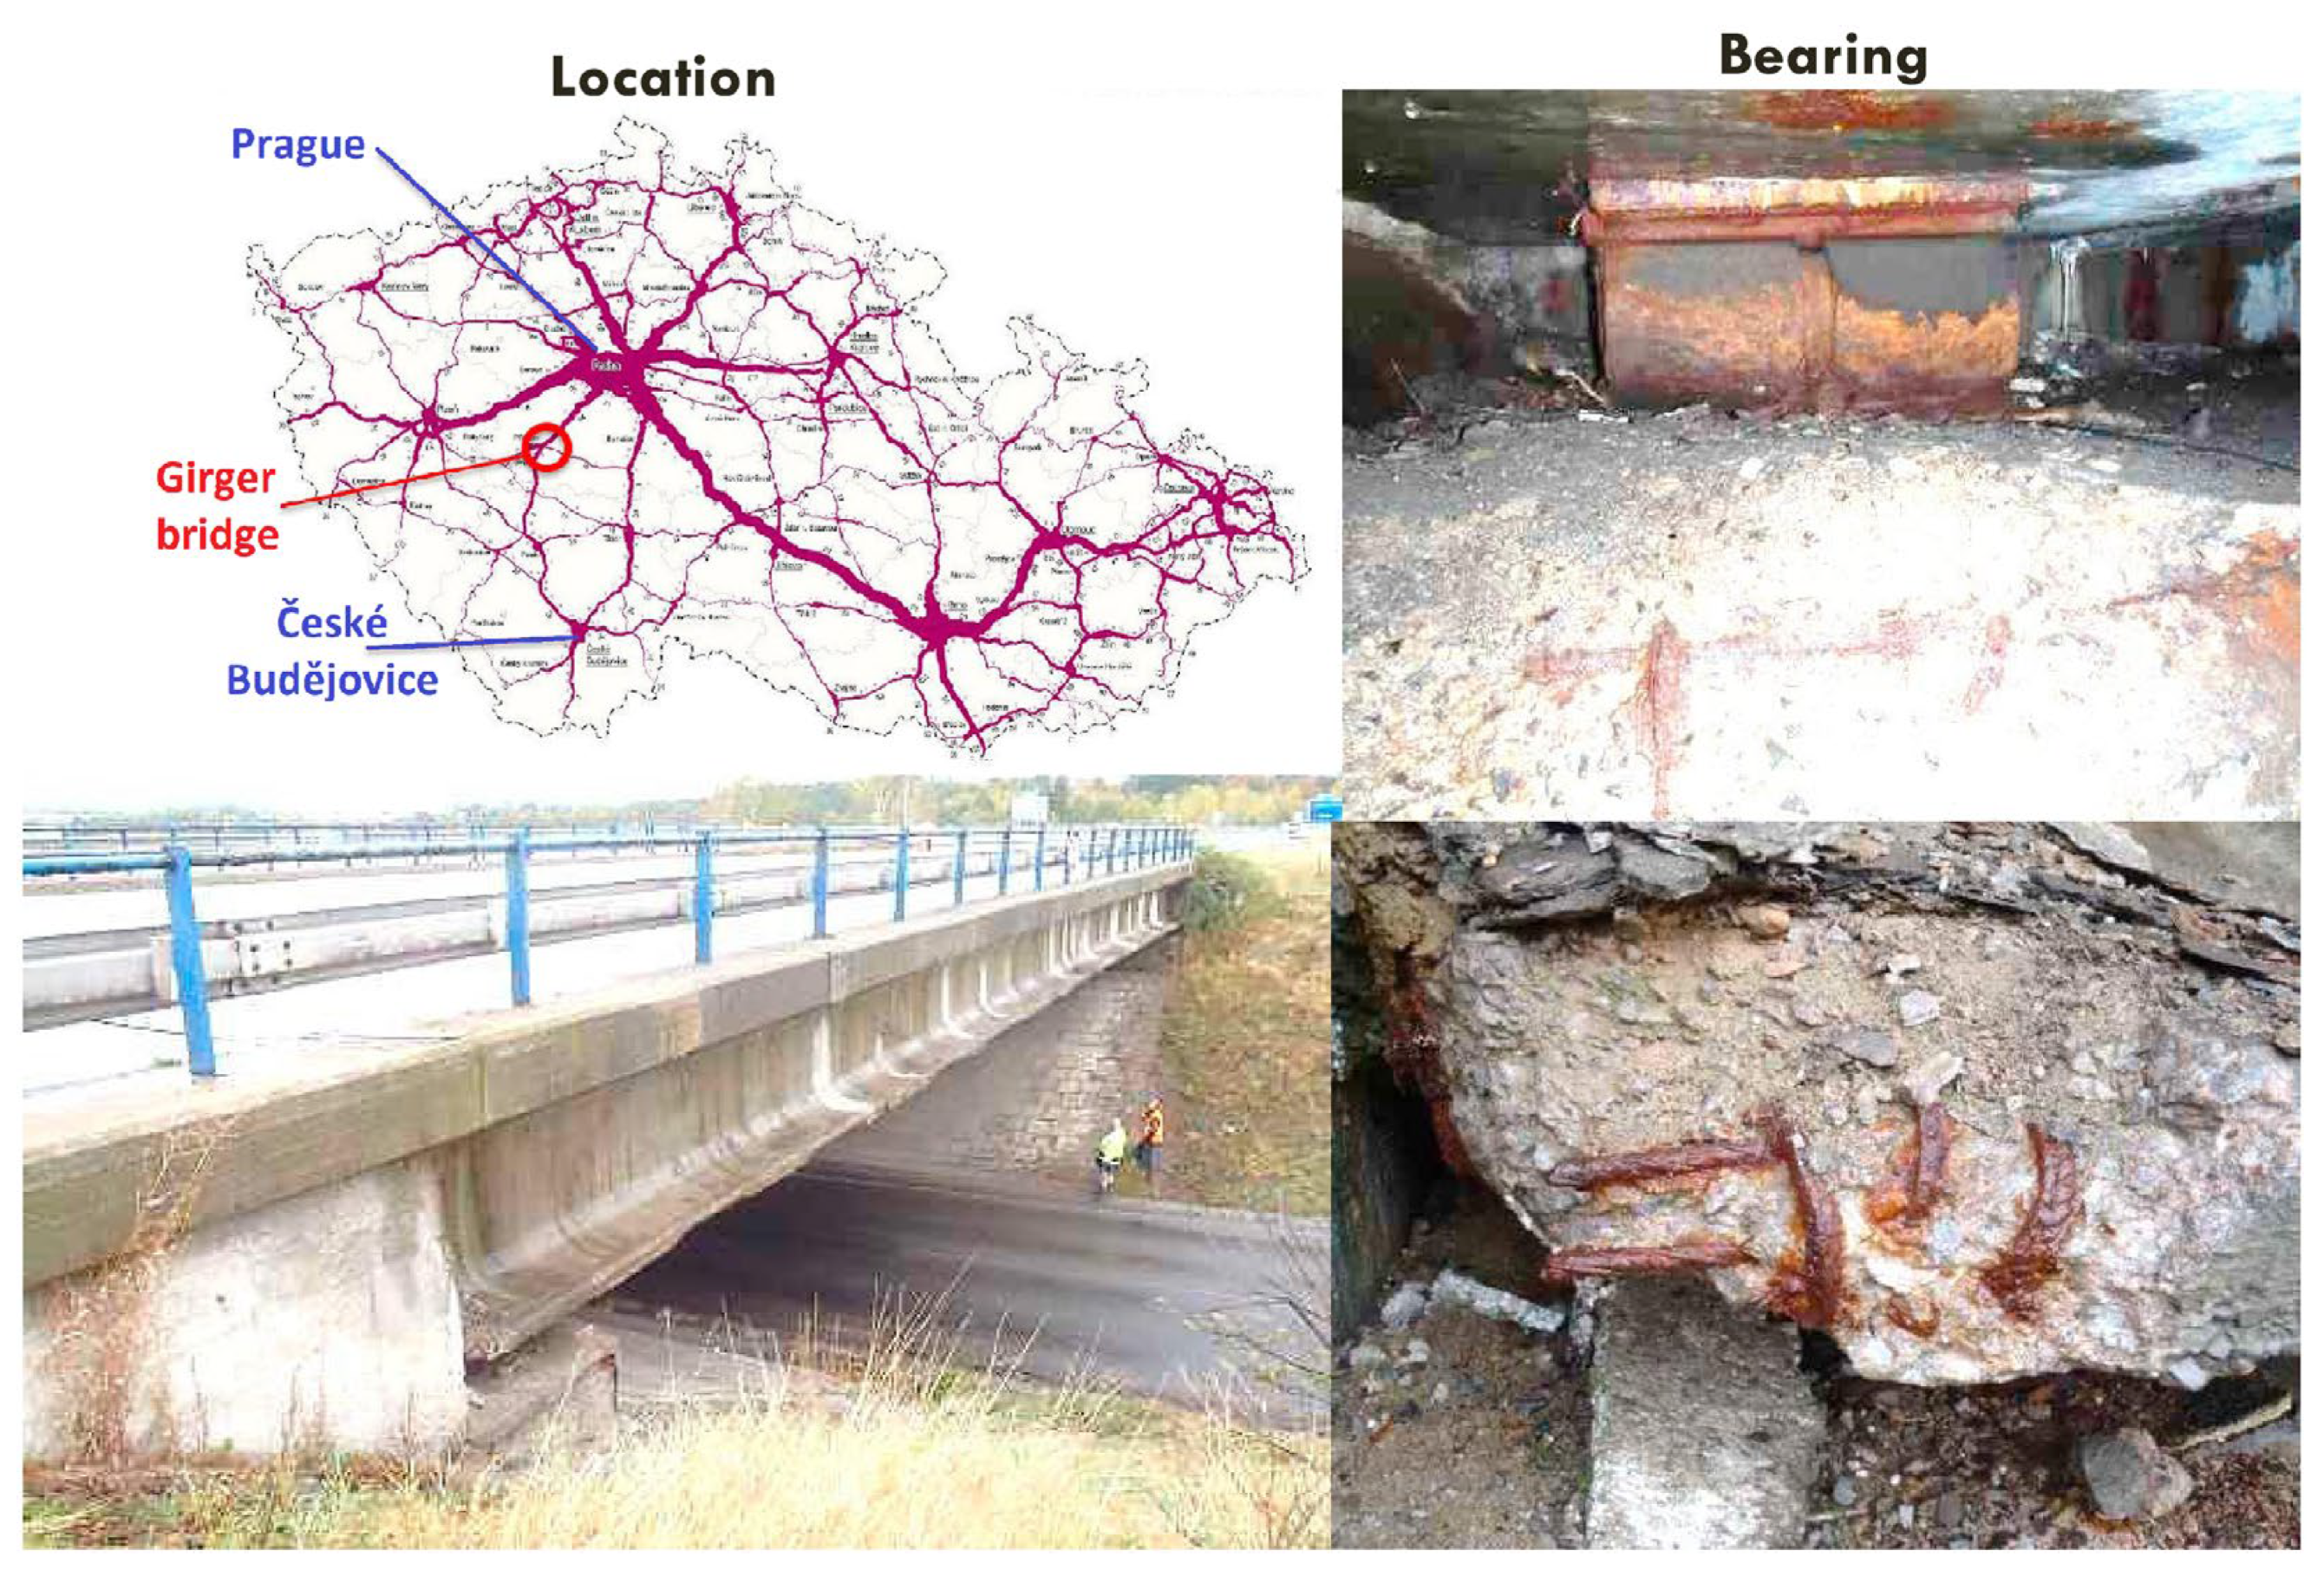
This Case Study looks at a Girder Bridge in Dob, Czech Republic, built in 1983, specifically its asphalt roadway and steel barrier rails (
Figure 12). The average daily traffic on the bridge is 20,306 cars and 3868 trucks in Dob, where the bridge connects rail D4 and local route III/10226. It is unavailable to approach the concrete foundations or abutments, and the two portions of the superstructure (one for each direction of traffic) comprise ten girders made of precast and prestressed I73 concrete. The drainage system is on the side. According to an available Finite Element analysis, the following are the estimated load capacities: Normal capacity for an unlimited number of vehicles: 24 tons; capacity for a single vehicle on the bridge: 53 tons; exceptional capacity for special heavy transport: 292 tons. What matters is the lateral beam’s bending capacity. The Czech method uses a scale from I (excellent) to VII (emergency), with ratings ranging from bad and satisfactory for the superstructure and substructure, respectively. The availability level is 2, meaning it is “available with limitations” (1 is available until 5 for unavailable).
Inspecting the bridge shows that the concrete is deteriorating and the reinforcement is eroding in both abutments, the main girders, the expansion joints, the waterproofing, bearings and concrete parapets. Possible failure areas have been found, such as (a) the failure from the outermost girder resulting from substantial degradation and rust of the support, which affects the prestressing cables and prestressing bolts and causes the girder to fail. Be aware that it is probably going to happen because leaks within the anchoring location can cause rust of the prestressing support nearby to the anchorage; (b) The failure from the bearings caused by heavy corrosion, nevertheless it will require a long time, and the results won’t be wrong; (c) If the abutment loses stability within its outer bearing, local pressure on the deteriorating concrete will cause a local girder to break; if the girder slips, the failure will cause a significant deformation, not a global fall. Different materials used to test girders show the alkali-silica reaction as well as the range of compression strength of concrete. The carbonation depth on the main girders is 8.6 mm; on the support, it is 26.7 mm, and on the parapet is 36.7 mm. The superstructure can withstand 75 freeze-thaw cycles, while the concrete on the asset can only withstand 25 cycles.
Key performance indicators are developed using information on leading methods utilized by the Czech Republic (see
Table 1). For the pre-stressed concrete and reinforced concrete, a combination of material tests are performed for the KPI evaluation, including compressive concrete strength, alkali-silica reaction, carbonation and freezing resistance tests. On the other hand, for the other type of structures, the estimated failure time is assumed according to the experience from the research team with the concrete structures in Czech Republic, and then estimating the defect progress. It can be considered as the safe assumption under severe condition.
Despite being conservative under extreme exposure conditions, the anticipated failure period has been established upon the Czech Republic’s previous work using concrete structures as well as the evolution of the flaws. The dead load’s project estimated reliability index (ß) was 4.1%; the corresponding value at the live load was 3.0%, considering the appropriate materials, loading, and model uncertainties. Careful deliberation led to selecting this lower value to reflect the overall bridge condition concerning the identified concerns.
4.1.1. Scenario 1 (Reference Scenario)
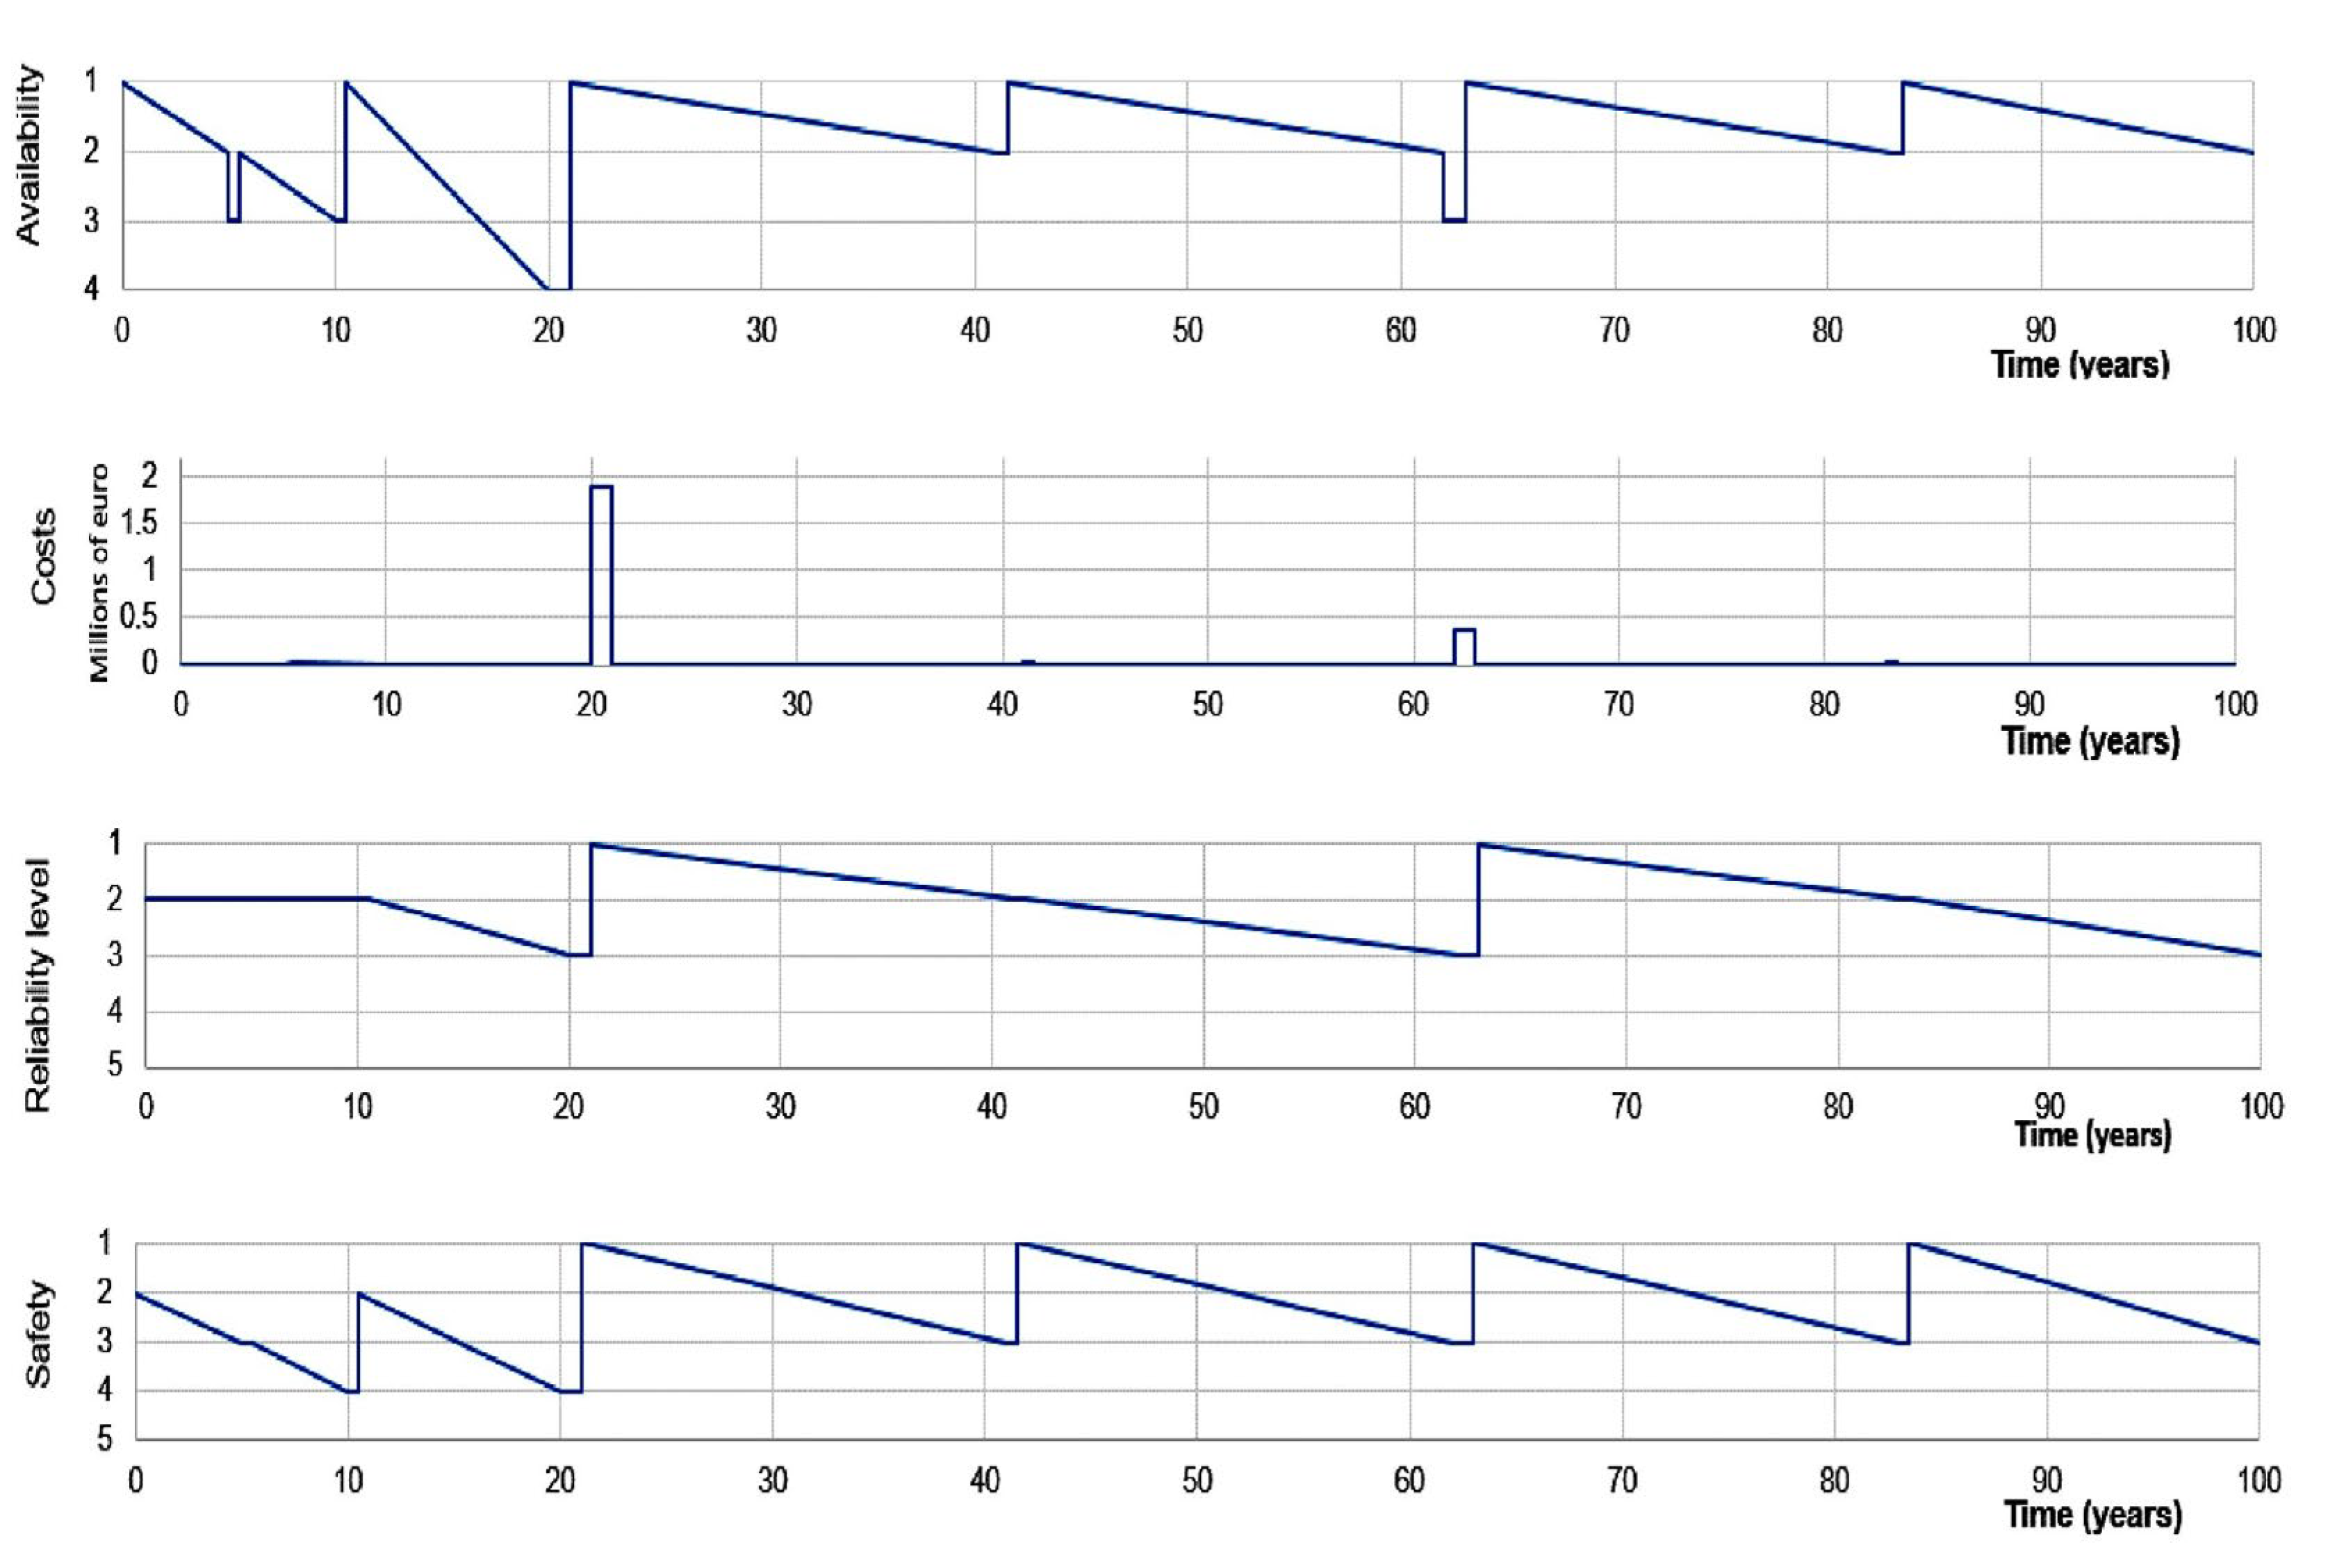
The failure to make substantial repairs regarding the bridge’s structure and accessories beyond routine pavement maintenance has led to the deterioration that will eventually lead to the bridge’s collapse. Following the previous section, the following assumptions are made regarding existing structure defects, development, and estimated failure times (see
Figure 13):
Failure of the pavement within five years due to the development of fractures near the EJ position, sweating and deformation (as stated, the pavement layer requires restoration). The pavement will then be repaired. However, only the pavement is included, not the waterproofing. The estimated cost is 40,000 euros per bridge, temporarily reducing accessibility. Concrete parapets will collapse in ten years, rendering the crash barrier insecure and no longer safe. It is assumed that the temporary concrete crash barrier will be installed now. As the bridge becomes narrower, safety and accessibility are diminished. The cost per bridge is estimated at 50,000 euros.
Reduction of stability at the abutment below a bearing and, more probable, damage to the pre-stretching cables within twenty years (bridge collapse and replacement with a new structure).
If there are insufficient resources, the roadway will be closed. Nevertheless, the nearby bridge will accommodate just a single traffic lane in each direction; consequently, traffic will be delayed, and traffic jams might be forecasted.
The repair will cost €1.9 million.
Replacement of the roadway every twenty years and bridge maintenance every forty years is a preventative approach for the new bridge.
Half of the bridge will undergo maintenance, resulting in a temporary reduction in accessibility. The cost to repair the pavement is 110,000 euros, while the cost to repair the entire complex (pavement, the crash barrier, railing, and parapets) is 300,000 euros.
4.1.2. Scenario 2 (Preventative Maintenance Scenario)
The bridge repair must be planned and completed within five years. The entire bridge structure and its accessories are repaired, and it is how the bridge lifecycle is evaluated (see
Figure 14):
Cracking, sweating, and pavement distortion occurs within five years (must be corrected). All of the bridge’s components are serviced at the same time.
The new concrete deck will be placed on top of prestressed girders. The cost is predicted to be around €1.5 million.
The roadway bridge will likely shut down if traffic levels drop below a certain point. Traffic will be impeded, and backups are expected because the neighboring bridge only has room for one lane in each direction.
The bridge’s preventative maintenance schedule (every twenty years for pavement replacement and every forty years for bridge repairs) will be implemented in the coming years. Expenses of 40,000 euros or 750,000 euros (cost increase because of expected repair works on the renovated concrete).
Half of the bridge will undergo maintenance, resulting in a temporary reduction in accessibility.
4.1.3. Comparison
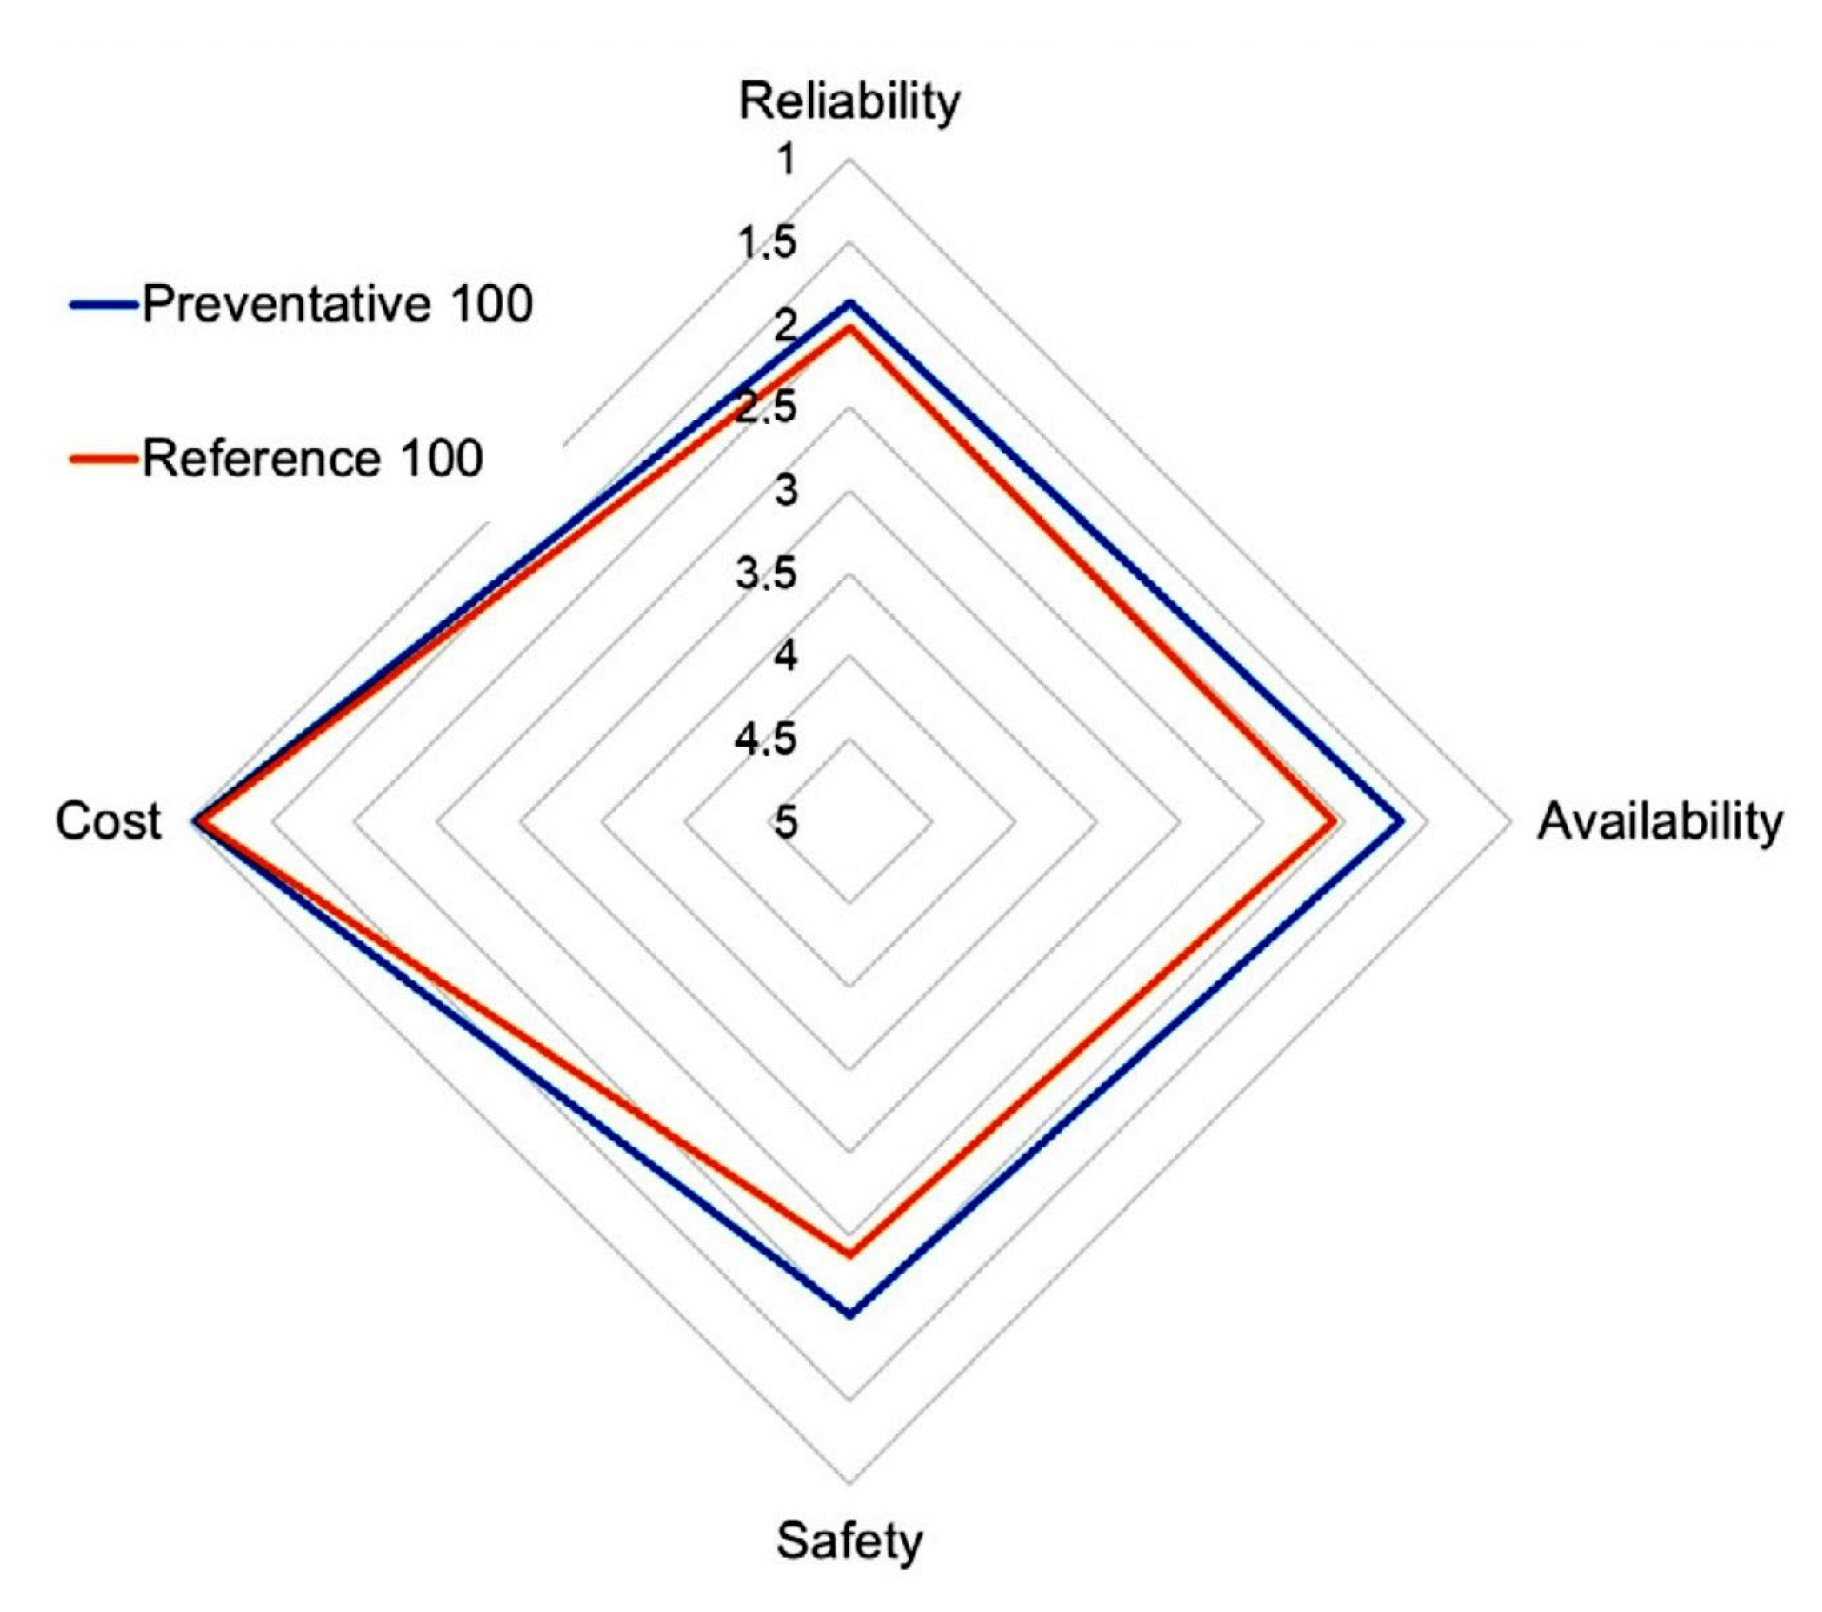
Utilizing a “Spider Diagram,” a comparison of the two approaches under consideration is conducted. This bridge is more suited to a preventative strategy, as it yields better outcomes regarding safety, dependability, and availability across the board. Costs are normalized using the same two percent interest rate, meaning only the outgoings are comparable.
Figure 15 demonstrates that the Spider diagram can be extended to three dimensions over “100 years”.
By the averaging function in the spider diagram tool (which is developed as a standalone tool during this project), it is possible to compare the volume of the normalized graph without considering the unit. The comparison gives the first scenario in the reference list a score of 180 and the preventive scenario a score of 146 (see
Figure 16). Therefore, this precautionary scenario is more appropriate and similar to the maximum “1” rating in the long run.
4.2. Portugal Arch Bridge Case Study
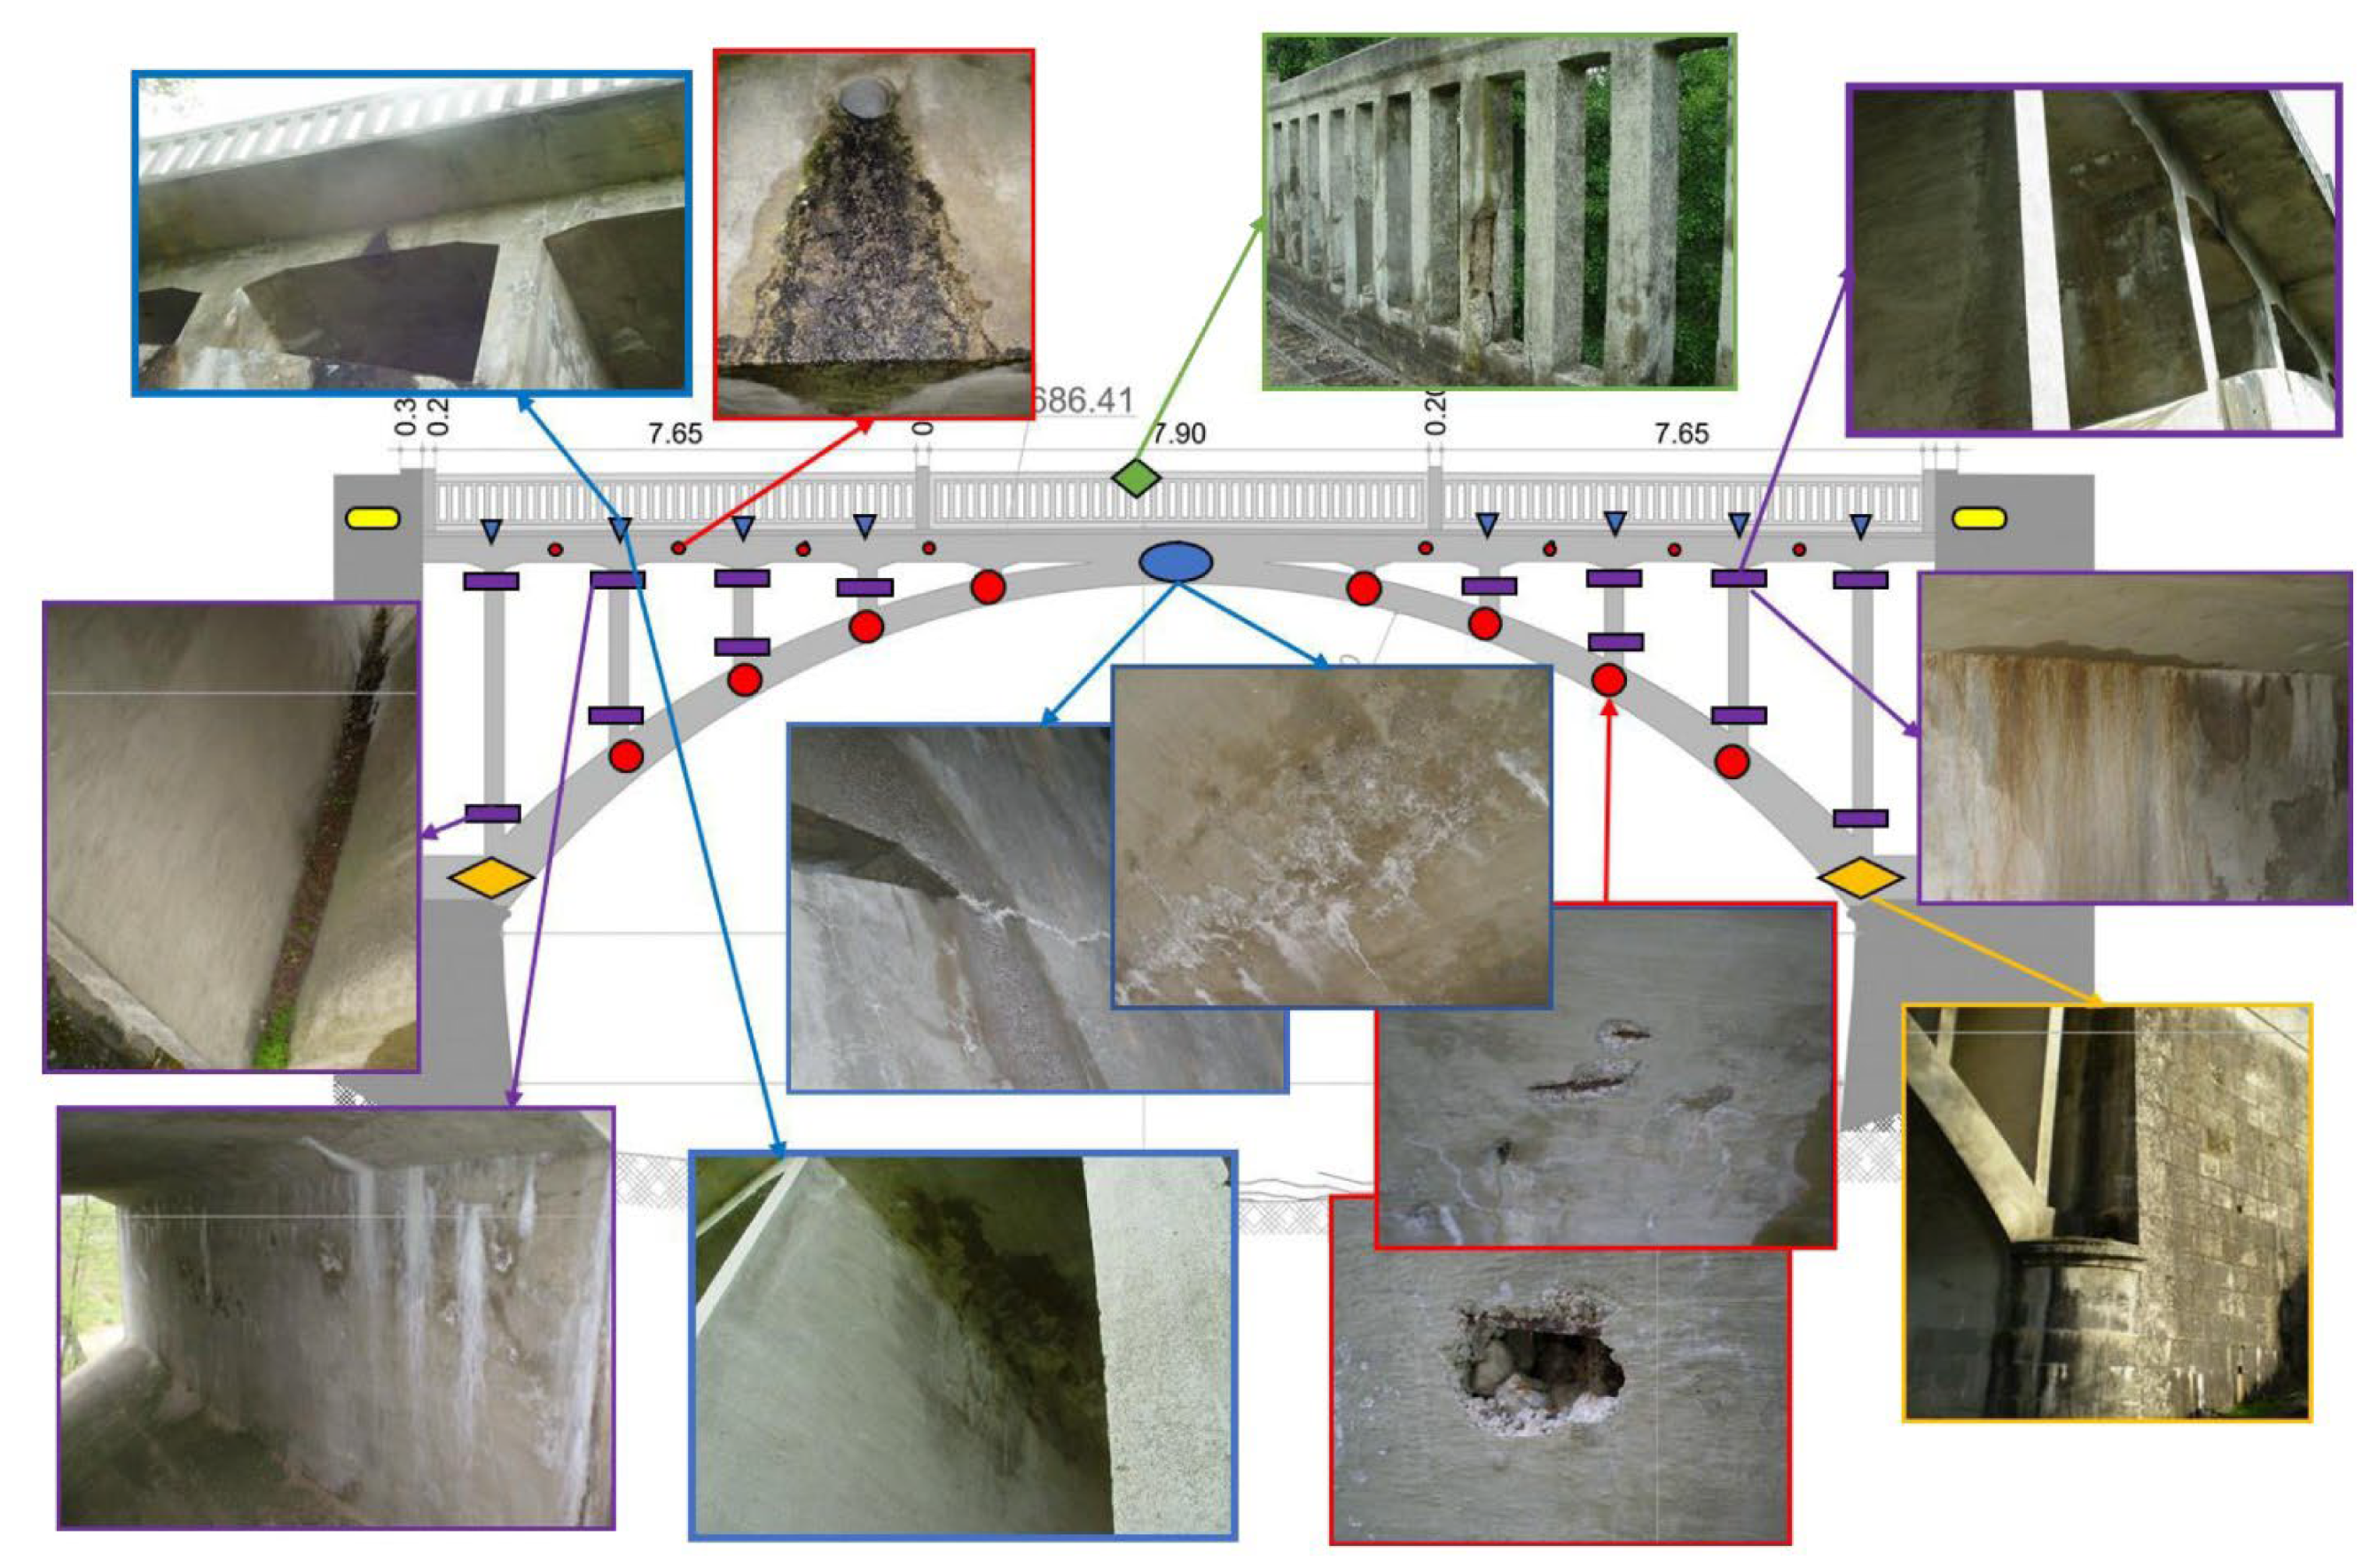
The second case study looks at a single-span bridge in Portugal’s Guarda community, specifically, its open spandrel deck arch, which measures 24.00 m long and 4.65 m in height (
Figure 17). This bridge spans the Cro River and carries regional route 324(ER). Each travel lane is 2.53 m wide, and the other is 2.51 m wide, while the safety strips are 0.45 m wide and 0.51 m wide, and the walkways are 1 m wide on both sides of the road. Initially constructed in 1940, the bridge underwent restoration in 2010. In 2016, 1766 vehicles traversed it daily, with 5% of them being hefty. Inspecting these spots allows us to pinpoint the vulnerable zones. Finite element analysis indicates that the entire structure is supported since the bending moments within the supports are less than those at the midspan. As a result, the midspan section’s reliability was used to determine the bridge’s overall dependability.
4.2.1. Scenario 1: “Do Nothing and Rebuild.” (Reference Scenario)
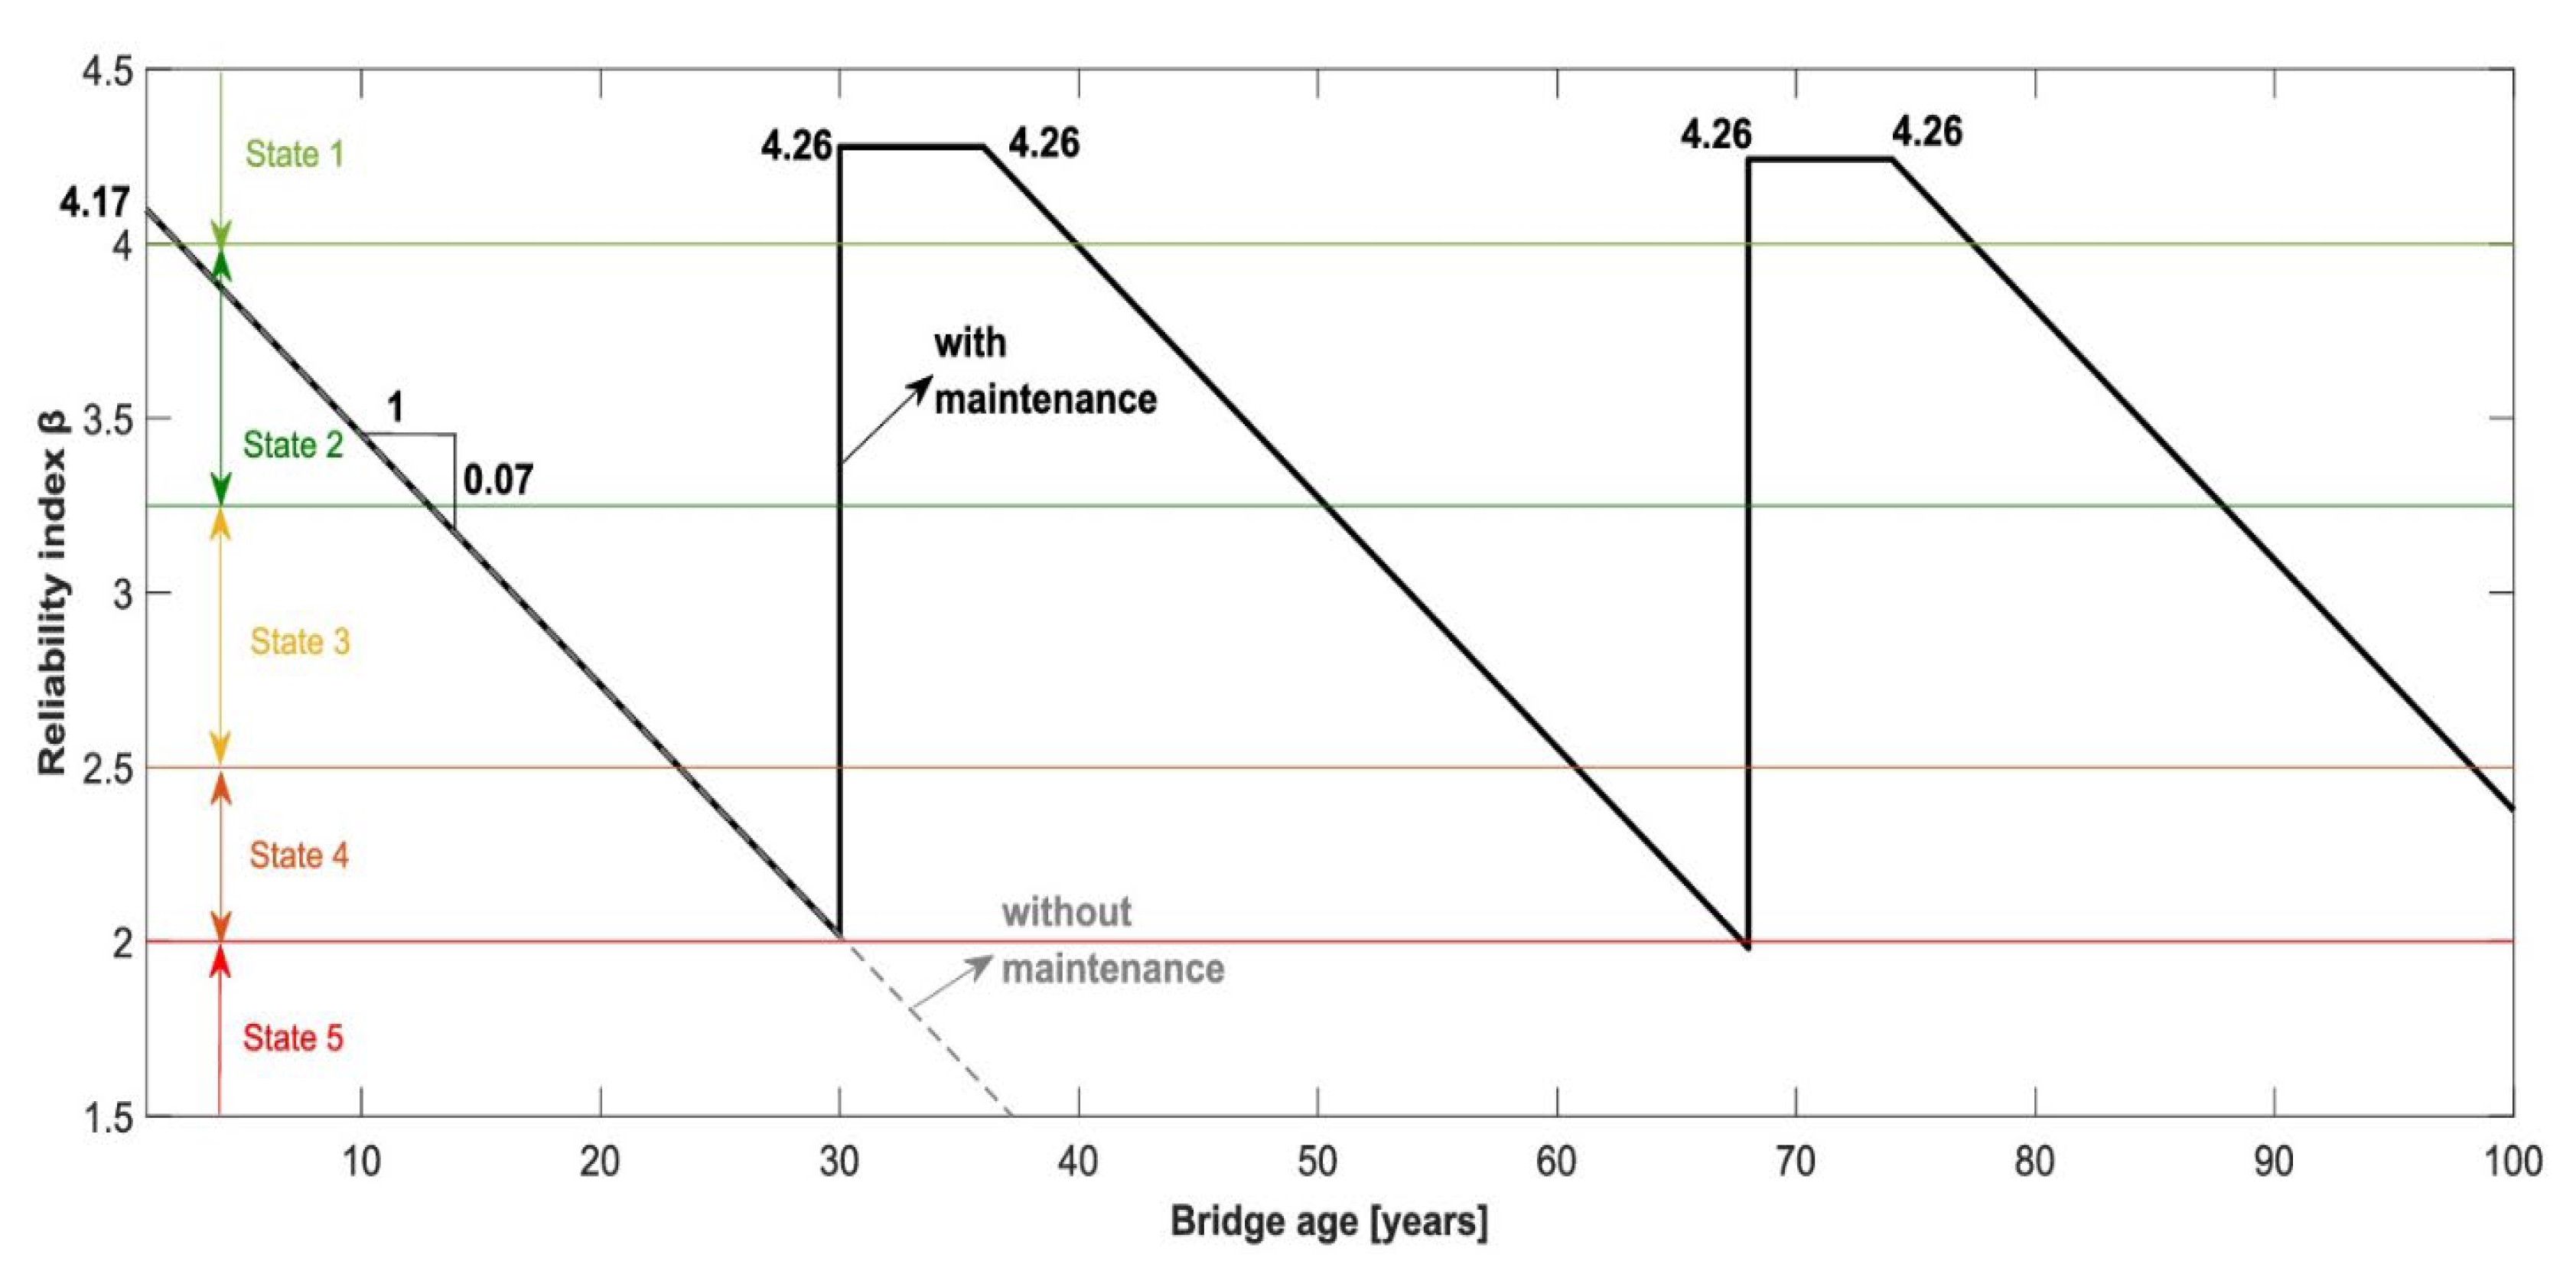
In the first case, the reliability indicator over time, , was estimated using a bi-linear degradation model:
Where, is the time of initiation of a deterioration; is the deterioration rate of a reliability; and is the age of the bridge. This layout is being implemented on the existing structure; thus, it is presumed that the degradation processes started previously. As such, we anticipate no delay in the onset of degradation. In this approach, represents the reliability index at that point of the most recent inspection or the initial index that was reduced because of the qualitative assessment.
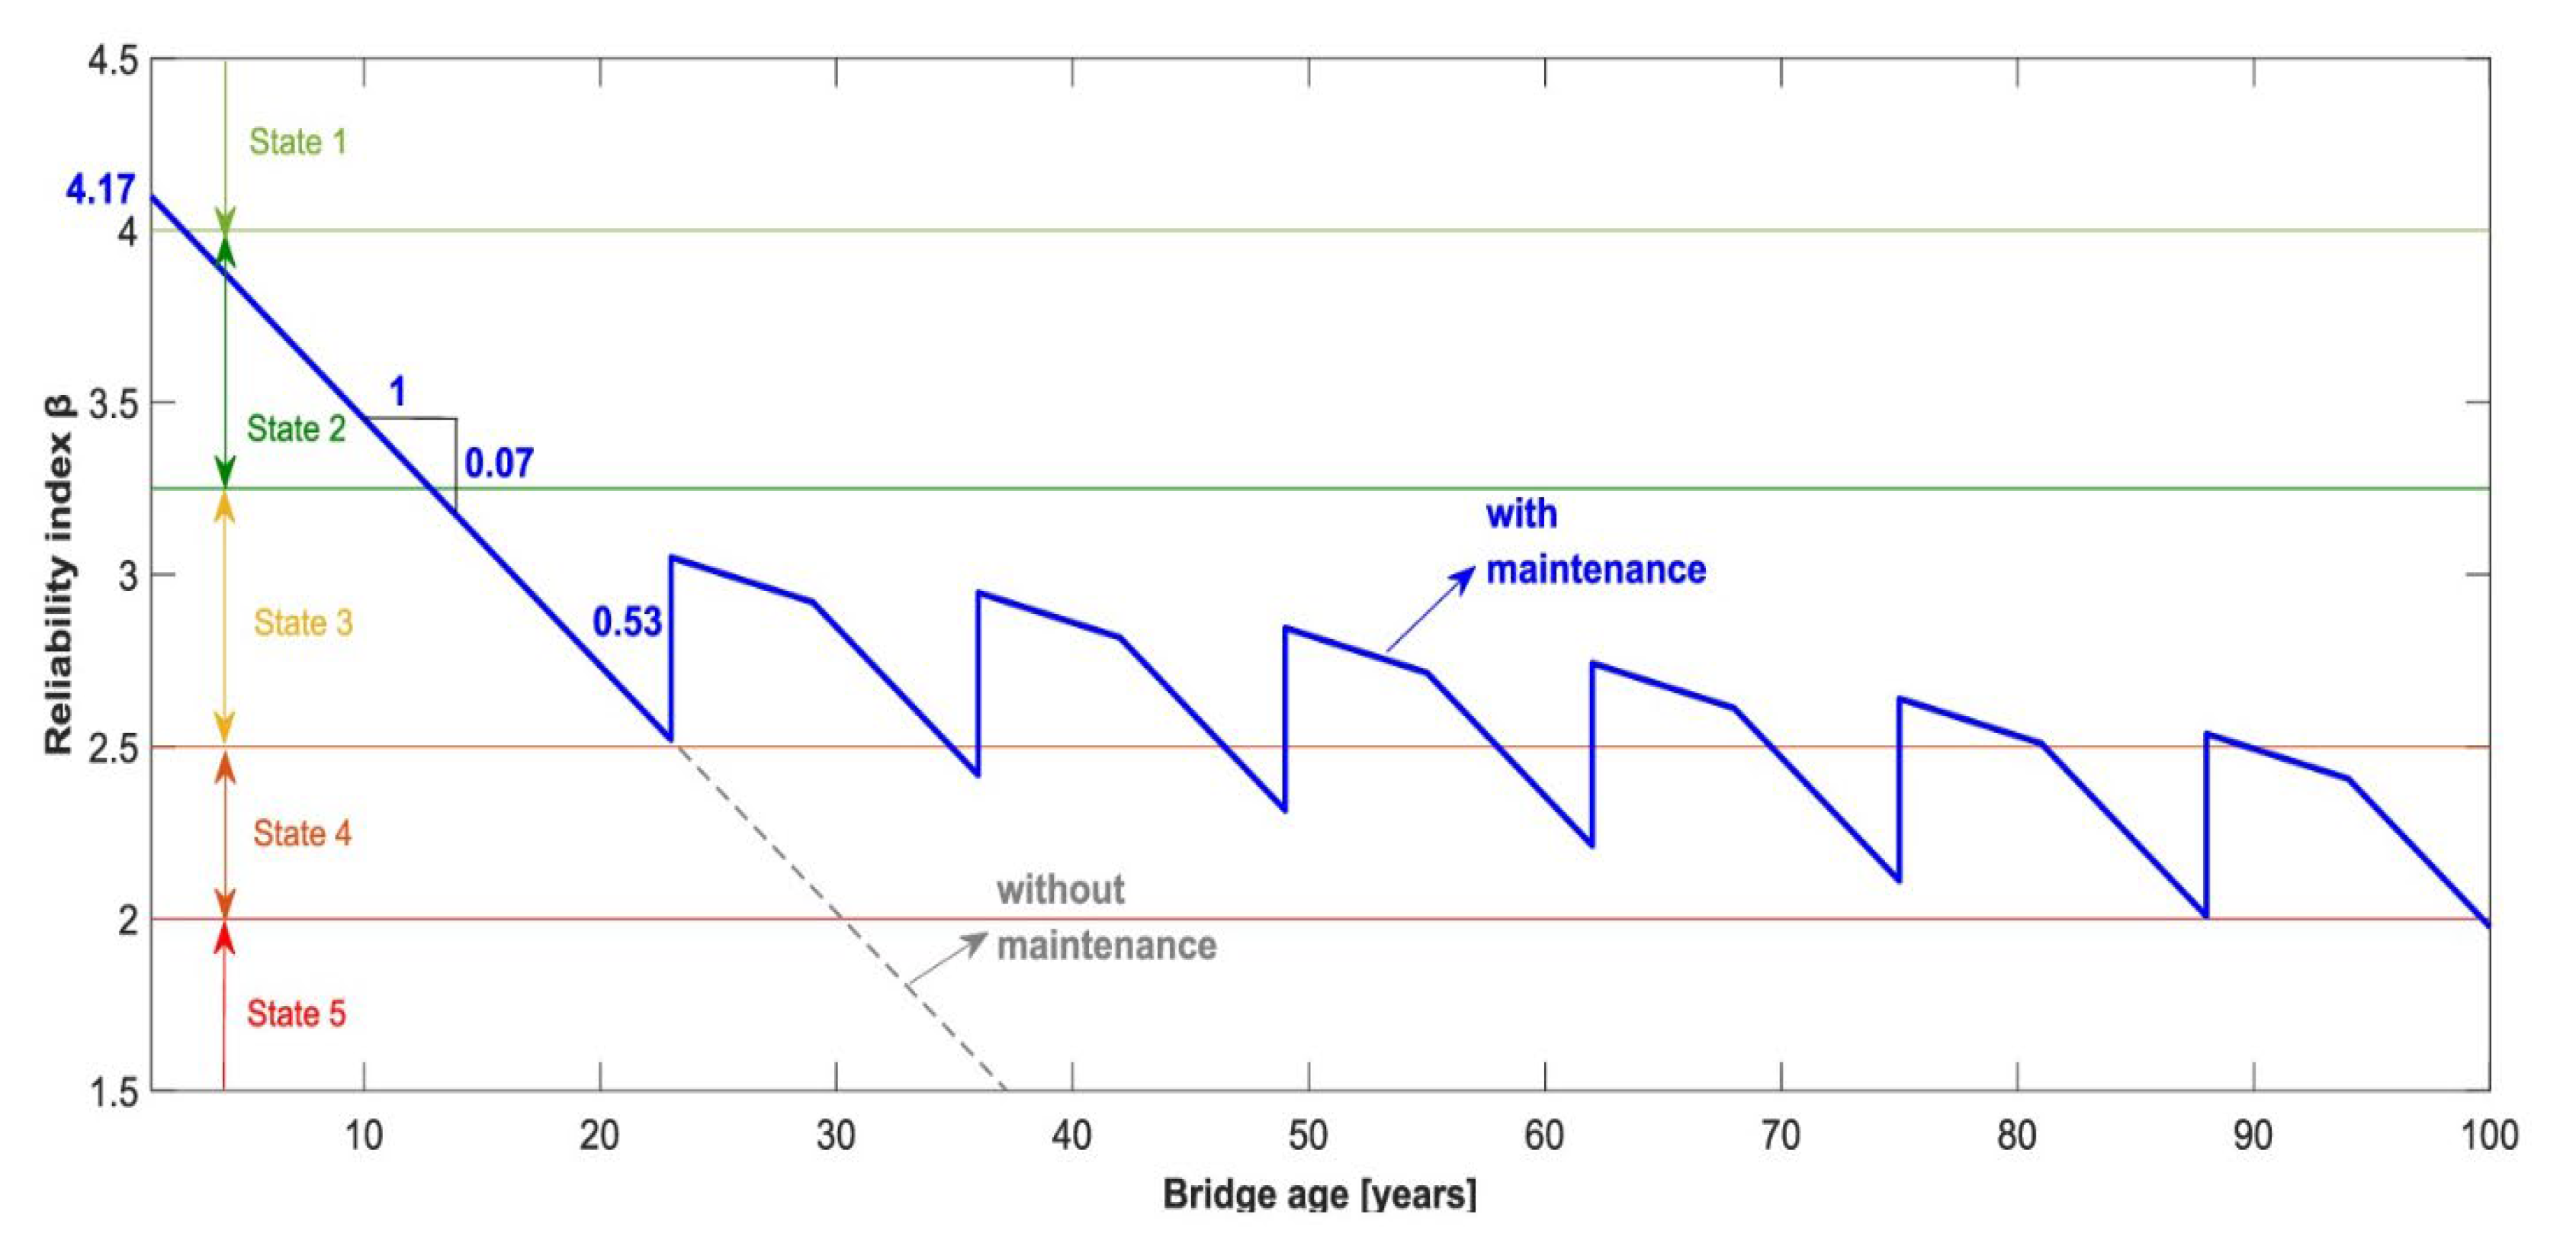
In this case, maintenance wasn’t even thought about unless the reliability index exceeded 2, which is the maximum for state 5. It was anticipated that the highest reliability improvement ) would occur soon after entirely replacing the structure. The decrepit system has been swapped out; therefore reliability index has returned its “virgin” number of . They could postpone the degrading process by seven years by setting the back to its original value. All bridges had to be replaced when their reliability index exceeded state 5 with no maintenance (0.07/year degradation rate).
The relationship across qualitative and quantitative performance indicator scales is the key to qualitatively transforming reliability. For this scenario, only qualitative evaluations of availability, cost, and safety were conducted (
Figure 18). During the transition from reliability level 4 to level 5, the availability value is at its peak during the bridge replacement. Since maintenance was not considered in this scenario, only bridge replacement costs were included. It was determined that a loss in user safety occurs faster than a decreased structural reliability. An original dependability index was estimated using a first-order second-moment method; it was revised downward after a recent visual check and a 5% drop in resistance. The result on KPIs development for this scenario is showed in
Figure 19.
4.2.2. Scenario 2 (Corrective Maintenance Scenario)
The second degradation scenario considers the impacts of remedial maintenance operations, which were modeled as an immediate boost in dependability and a slowing of the degradation rate. Although the bridge remained in generally good shape, needed remedial repair was performed on it. For 13 years, it was presumed that the same corrective activities would be conducted periodically (
Figure 20), resulting in a more reliability improvement (γ = 0.53).
Availability, affordability, and security were all given qualitative assessments (
Figure 21). During the corrective activity, availability was reduced; thus, we anticipated a gradual decline in availability over the duration, even as we anticipated a minor boost in performance almost immediately. The cost of the repair was expected to be manageable. The drop in user safety was predicted to be gradual, with a temporary uptick just after the change was implemented.
4.2.3. Scenario 3 (Preventative Maintenance Scenario)
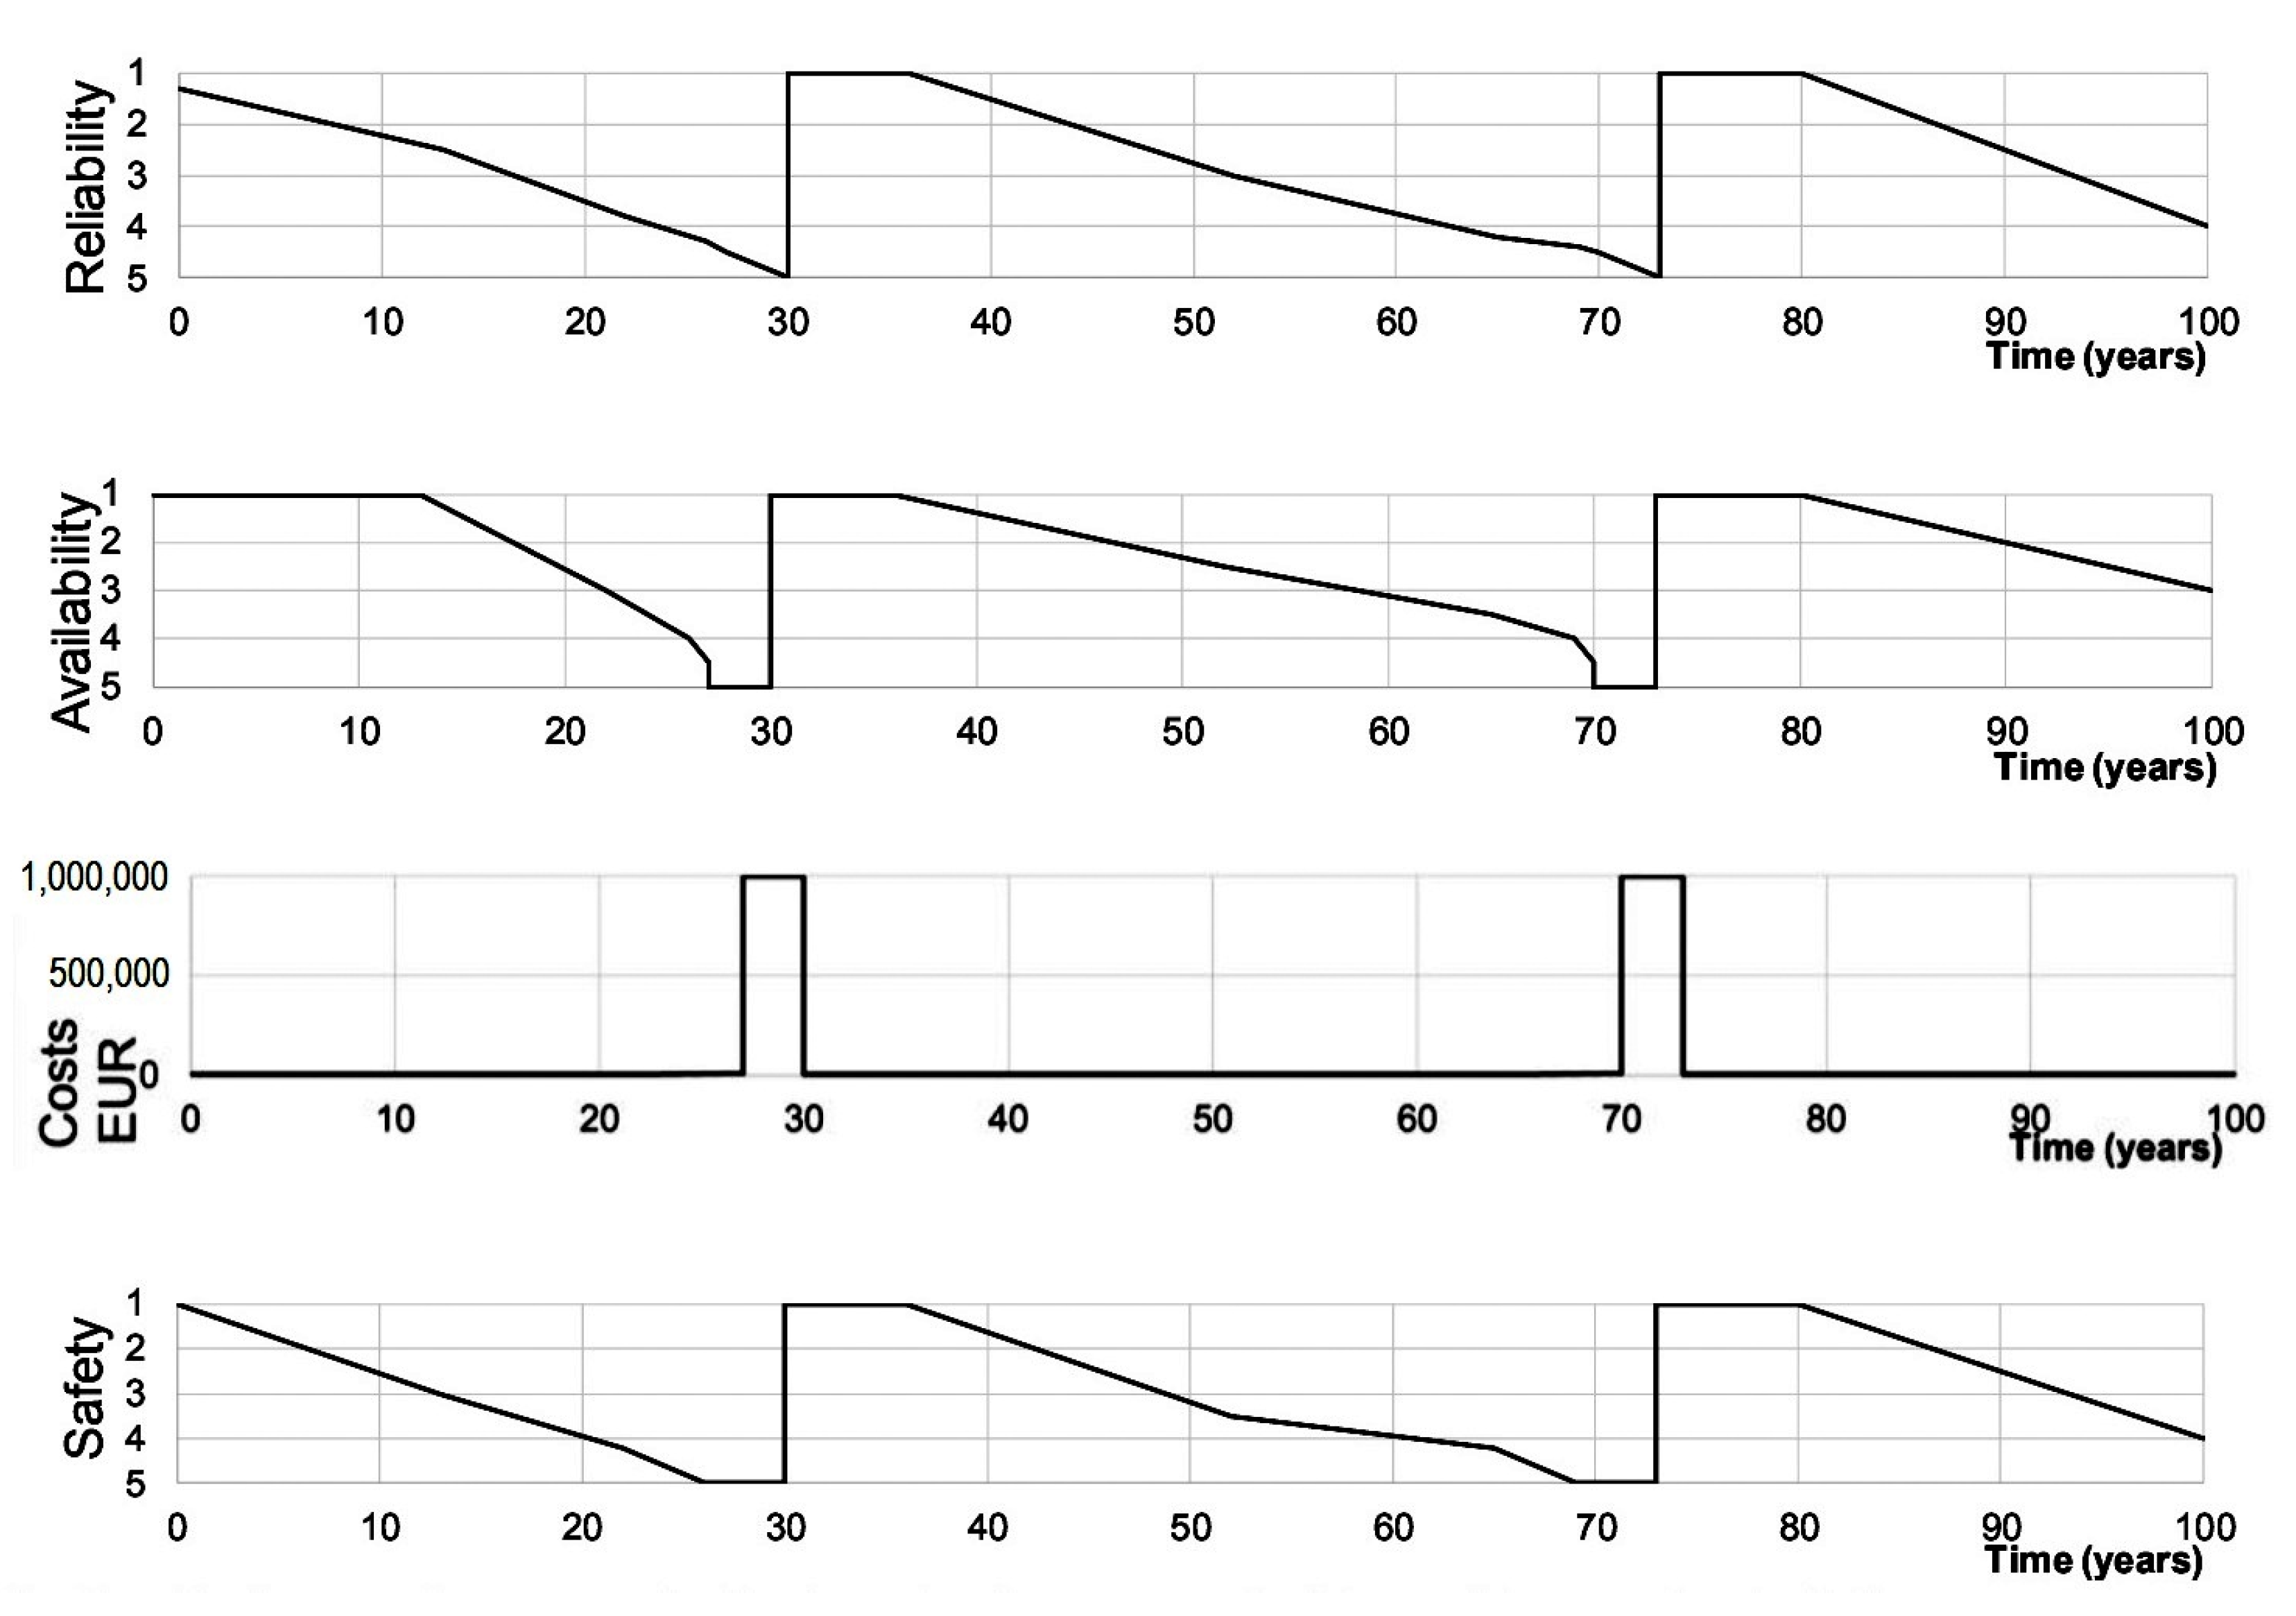
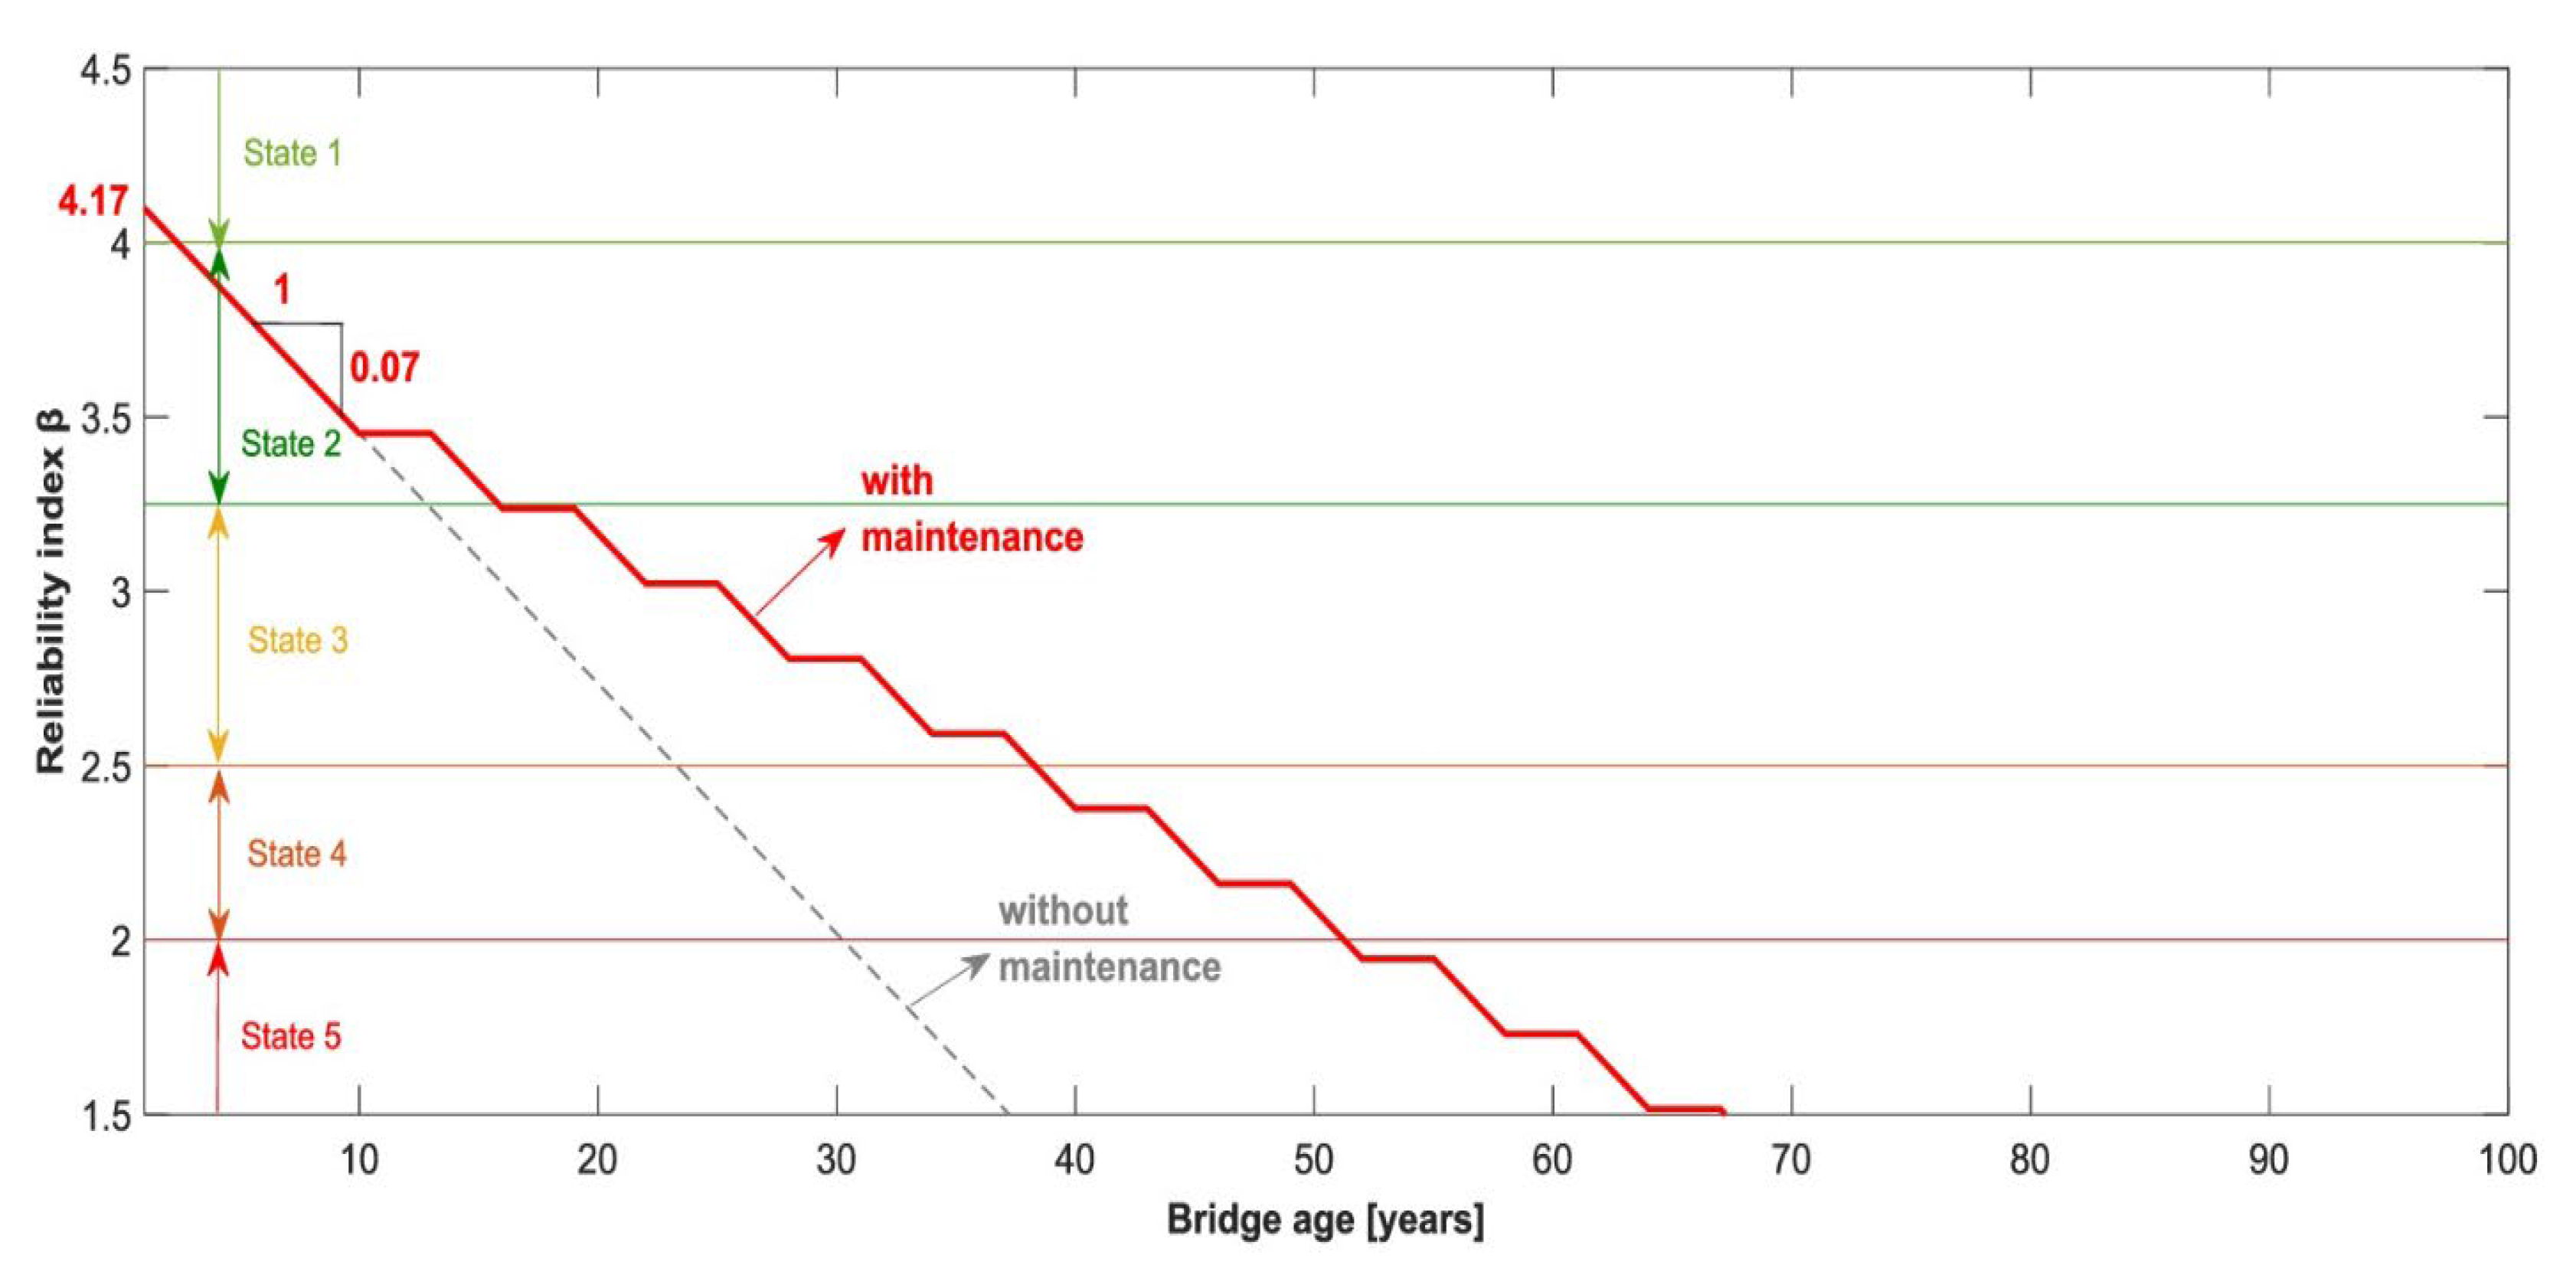
Scenario 3 considers preventative bridge maintenance, intending to avoid costly major rehabilitation and replacement by doing relatively minor repairs and operations that keep the bridge in good condition. The effects of preventive maintenance have been calculated as the occurrence of a deterioration procedure at interval
tPD following the carrying out of the preventative measure, with no improvement in reliability score. Its upkeep is periodic, with typical activities carried out at set periods. The dependability decline was predicted to be slowed by three years (
Figure 22) if preventative interventions were adopted over six years.
Availability was predicted to decline gradually, with a temporary uptick soon after the precaution was implemented. Minimal costs were taken into account when making these decisions. The decline in user safety has outpaced the decline in reliability.
Figure 23 is depicting the situation in general:
4.2.4. Comparison
Based on the calculated dependability indices,
Figure 24 illustrates a four-legged spider graph showing net current values regarding KPIs for each scenario. From the spider diagram, the corrective maintenance case seems the best option.
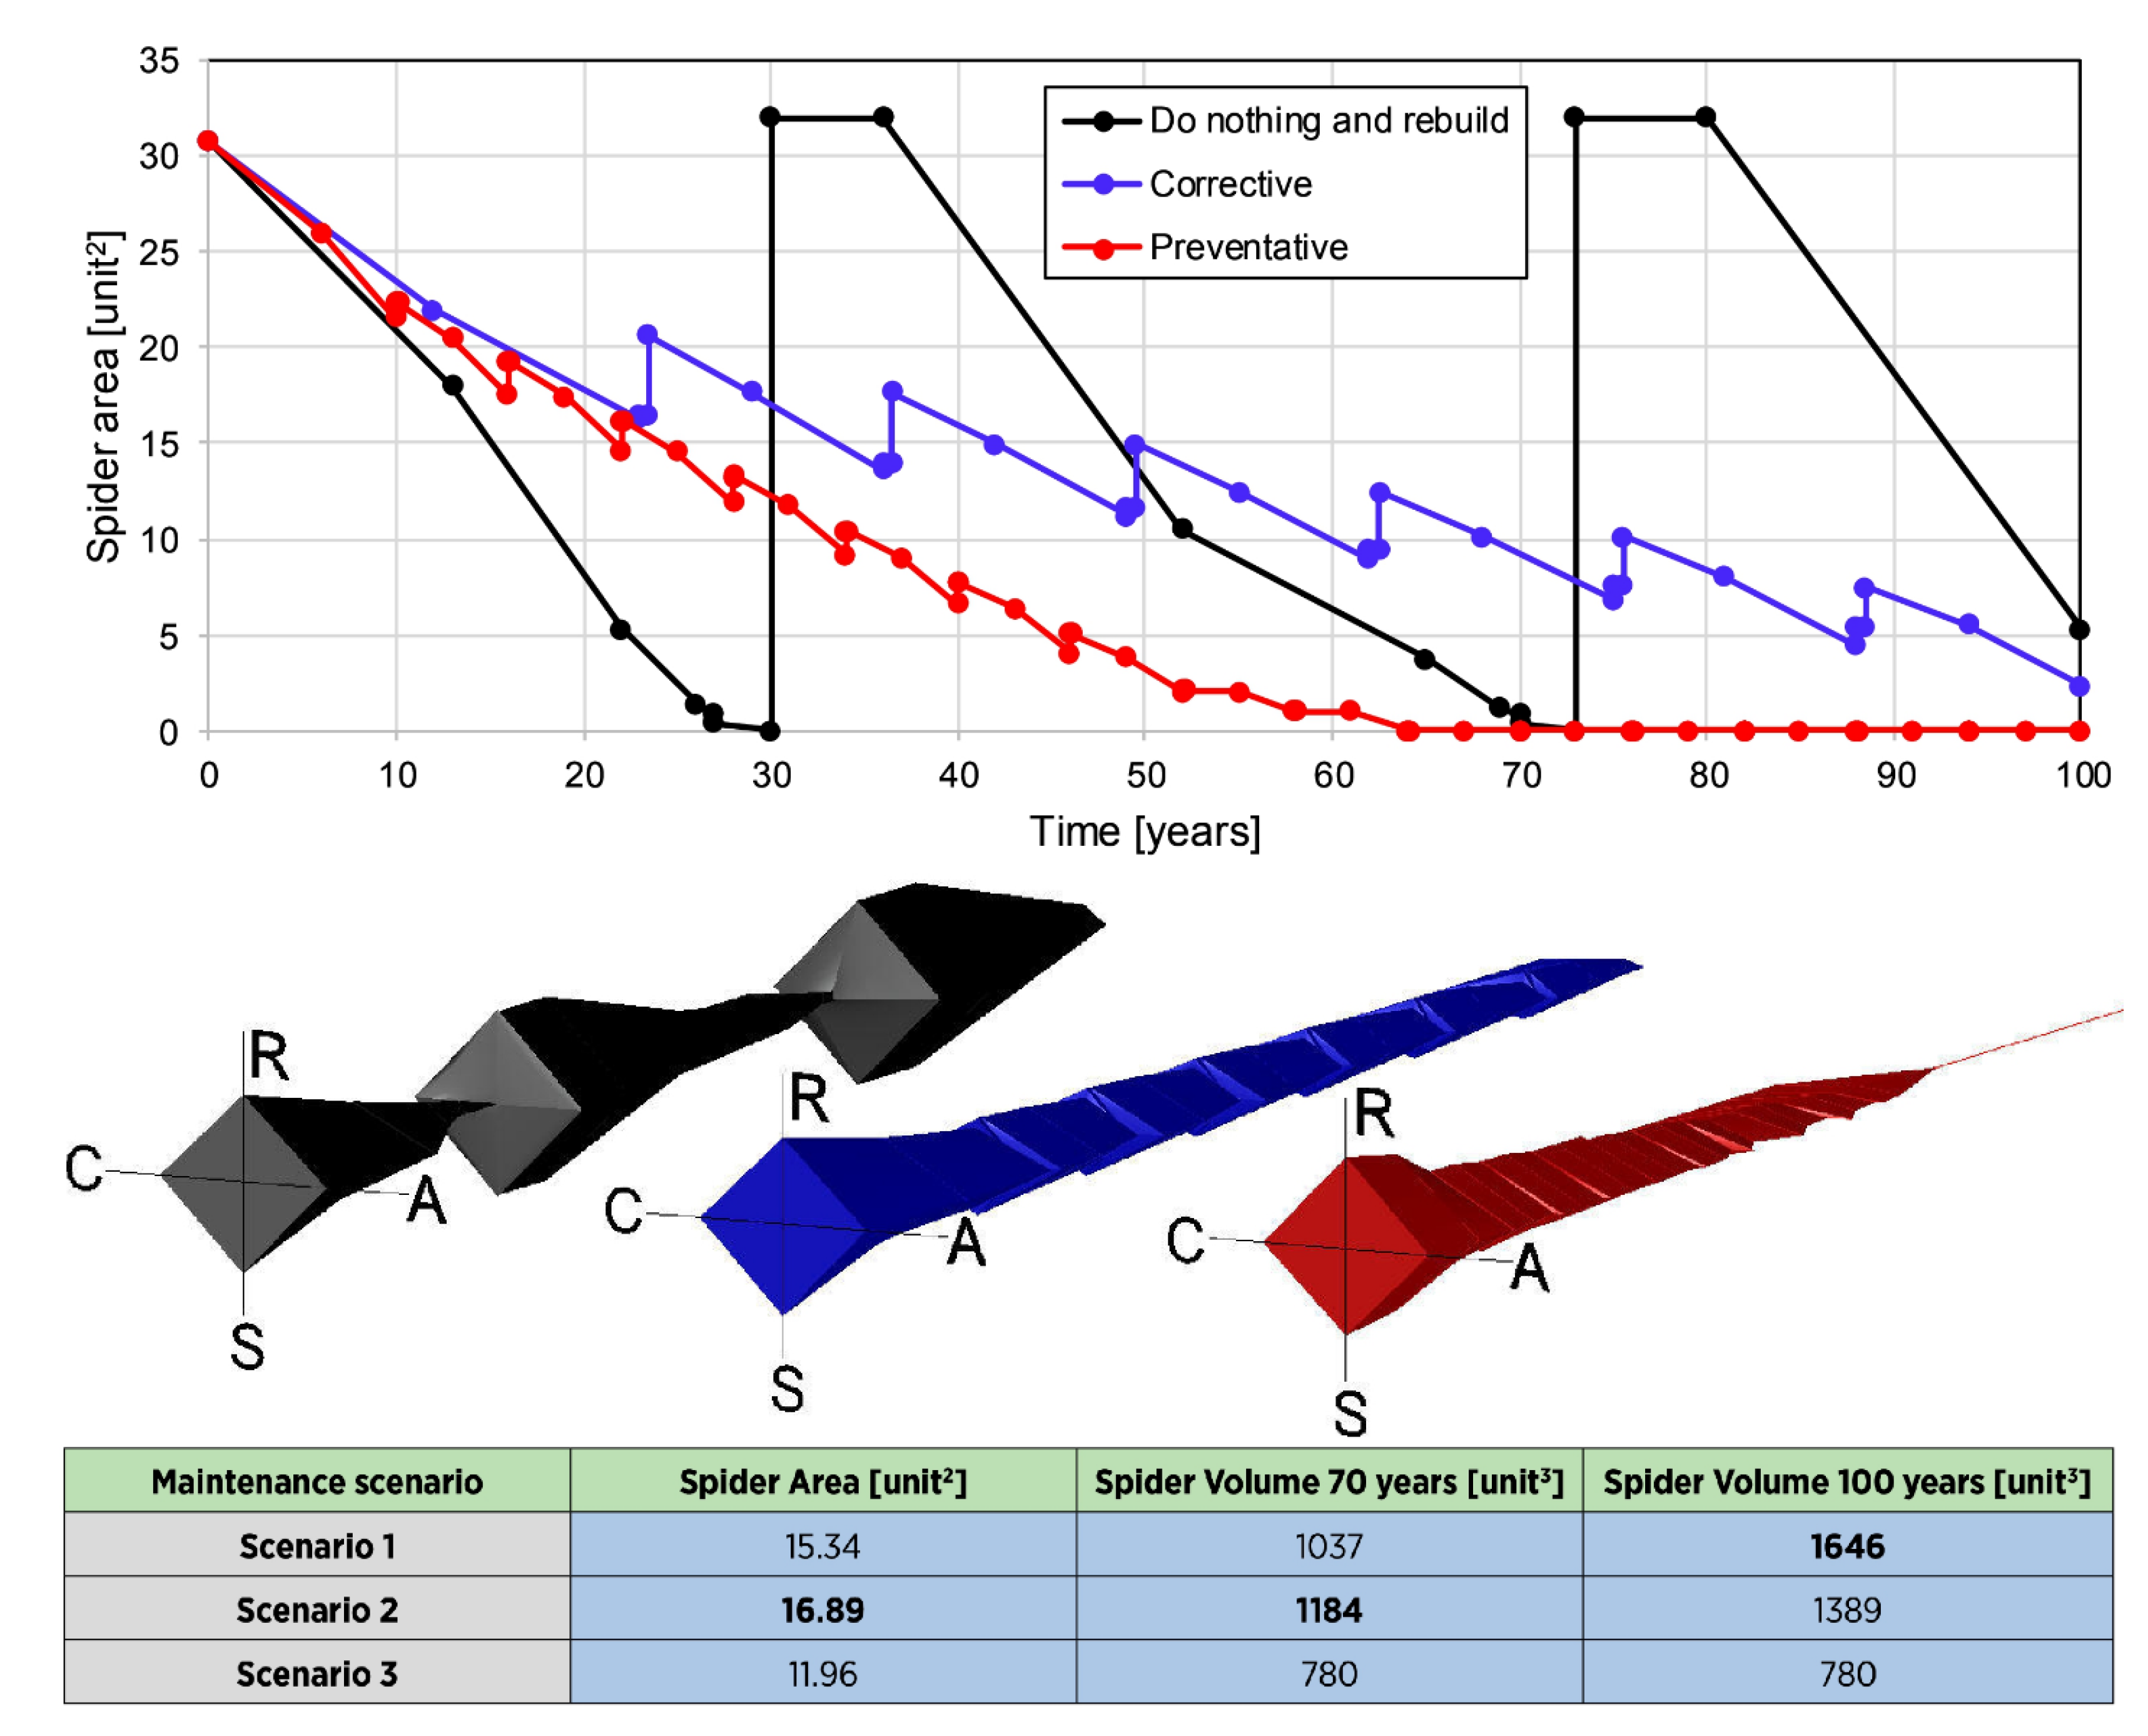
Also compared are the area and volume of the spider diagram (
Figure 25) at each time point. Volumes in the spider diagrams have been determined based on a bridge’s expected service life of 70–100 years. Before the next bridge renovation in the “do nothing” circumstance (at seventy years), the corrective approach had the highest volume, whereas the preventative approach had the lowest. The enormous volume has been aligned with the “do nothing and rebuild” scenario for “100 years”. After normalization, the costs of the various activities become comparable, making the significant difference between the multiple cases irrelevant. The increase in the “do nothing & rebuild in 100 years” is probably attributable to this standardization.
5. Conclusions
This research presents a KPI-based quality control plan for roadway bridges. The detailed procedure for the challenging issues, including the creation of performance indicators, vulnerable zone assessment, derivation KPIs from PI, and developments of KPIs over time with different scenarios, are proposed. Finally, a 2-step quality control framework is introduced and verified through 2 international case studies, which so a good performance in developing the long-term preventative maintenance strategy for the roadway bridge. The following conclusions can be derived:
Thorough and timely maintenance can be planned using data collected during the first inspection of objects. Consequently, an evaluation of maintenance costs per object can be conducted, laying the foundation for an efficient and cost-effective roadway maintenance strategy. For the roadway infrastructures to be successful and efficient, data and expertise must be transferred from the conceptualization documents and construction phases to the operation and management phases.
Advanced study, expertise in science, and the use of statistical and mathematical approaches can help solve the problem of being unable to predict what will happen to the roadways in terms of how long they will last and how they will break down. It should focus on gathering and analyzing data about how the bridges hold up over time and turn that information into service performance levels. The results should be compared to condition estimates based on what can be observed.
Indicators of sustainability are required for civil engineering projects. Evaluating processes and products’ economic, environmental, and social impact is a pressing societal need.
During the project implementation, PIs/PGs and KPIs for several bridges in European countries are created based on appropriate surveying and curating procedure. It is possible to reuse or further develop those KPIs to adapt to other bridges. Furthermore, the applied quality control framework in the introduced case studies helps the engineers to plan the extent and the inspections/investigations interval sufficiently to collect data for estimating the KPIs. The KPIs, therefore, have been evaluated in different maintenance scenarios according to the inspection/investigation data (even prediction included), which supports the engineer for a more actual decision-making procedure.
This research is developed and extensively documented in the COST TU1406 Research Project. It is necessary to pay further efforts to establish a full international standard and guideline for the quality control of the bridges, as well as the adjustments to the fields of PIs, PGs, and the QC framework.
