Article

The Spatial and Temporal Distribution of Mangrove Forest Cover from 1973 to 2020 in Chwaka Bay and Menai Bay, Zanzibar

by
Mohamed Khalfan Mohamed
*,
Elhadi Adam
and
Colbert M. Jackson
School of Geography, Archaeology and Environmental Studies, University of Witwatersrand, Johannesburg 2050, South Africa
*
Author to whom correspondence should be addressed.
Appl. Sci. 2023, 13(13), 7962; https://doi.org/10.3390/app13137962
Submission received: 2 May 2023 / Revised: 28 June 2023 / Accepted: 5 July 2023 / Published: 7 July 2023
(This article belongs to the Section Earth Sciences)

Abstract

:
Mangroves in Zanzibar have a high value for biodiversity and scenic beauty. However, mangroves are susceptible to anthropogenic and natural environmental disturbances. Although global mangrove monitoring systems exist, it is the practitioners focused on small mangrove areas who are knowledgeable about the area in which they work. This study examined the change in mangrove cover in Chwaka Bay and Menai Bay, between 1973 and 2020, using Landsat satellite data. The transformed divergence (TD) index and Jeffries–Matusita (J-M) distance were used to calculate separability of land cover classes before classification. The overall accuracies ranged between 82.5 and 92.7% for Chwaka Bay and 85.5 and 94.5% for Menai Bay. The kappa coefficients (ĸ) were in the range of 0.72–0.90, while the producer’s and user’s accuracies were between 72 and 100%. Chwaka Bay’s annual decrease in mangrove cover between 1973 and 2020 was 48.5 ha, compared to Menai’s 6.8 ha. The loss of mangroves in Zanzibar is linked to illegal timber/pole cutting, firewood collection, charcoal burning, unsustainable aquaculture, and agricultural and urban development. Others are changes in environmental conditions that are suitable for mangroves and climate change. This study is crucial in providing a basis for the ecological restoration and management of Zanzibar’s mangrove ecosystem.

1. Introduction

Mangrove forests are among the most valuable ecosystems on Earth [1]. In 2002, mangroves were estimated to cover, c., 20,100,000 ha of the world’s coastline [1], but they have suffered large-scale deforestation and degradation. According to Giri et al. and Hamilton and Casey, mangroves covered c. 13,776,000 ha by 2010 [2] and 8,349,500 ha in 2016 [3], respectively. Mangroves, which occur at the land–ocean interface in the tropics and subtropics, have significant ecological, economic, and social benefits [4,5]. Mangroves and related marine resources support tourism, fishing, and agriculture in Zanzibar [6,7,8]. Mangroves are crucial in protecting coastlines from storm surges and are also able to regulate local climate [6,7,8]. Mangrove habitats offer coastal and marine organisms a place to feed, breed, and flourish [9,10]. Mangroves act as bio-filters by trapping sediment and inorganic substances [6,11,12,13]. Mangrove forests store more carbon per unit area than any other forest on Earth, i.e., mangroves store, c., 3–5 times as much organic carbon as tropical upland forests [11]. Mangroves supply essential ingredients to the chemical, pharmaceutical, and cosmetic industries [12]. However, mangroves are vulnerable to human activities [11,13,14] and environmental changes [15,16].
Mangrove establishment, restoration, and conservation have all received increased attention in Zanzibar [17]. However, national- and regional-scale strategies and solutions for mangrove management and rehabilitation have been significantly hampered by the lack of up-to-date, reliable, and consistent cost-effective and high-resolution spatial data on mangrove forests [18,19]. A multi-spatiotemporal analysis of changes in mangrove forests in Zanzibar is vital in advising on their management and conservation and their sustainable use thereof [14]. The assessment of Zanzibar’s mangrove cover using ground-based methods is difficult because of the expertise required and the expenses involved [20]. In many cases, areas covered by these surveys are small and not spatially contiguous [21]. Therefore, ground-based approaches are unreliable to estimate mangrove cover/degradation. The satellite remote sensing technique has been used to track mangrove changes [22,23,24] and is essential for managing natural resources and preserving the environment [25,26]. Landsat imagery has been extensively utilized to track historical changes in mangrove distribution and extent at the local [24,25,26,27], regional [28], national [29], and global [2] scales. This is made possible by the free and open-source Landsat imagery archive, dating as far back as 1972, with consistent revisit periods and global coverage [30]. Mangroves in Zanzibar have been studied since the 1990s. However, these studies were themed around calculating the total mangrove volume [31], the mapping of mangrove flora and fauna [32], the inventorying of wood biomass [33], the impact of the deforestation of mangroves on the nutrition, ecology, and genetic diversity of Uca annulipes [34], a review of the status of mangrove ecosystems [35], the exploitation and regeneration of mangroves [36], and a management strategy for mangrove habitats [37].
Global mangrove forest losses exceed those of tropical rain forests and coral reefs; therefore, global mangrove distribution maps, e.g., the World Atlas of Mangroves-1 (WAM-1), the World Atlas of Mangroves-2 (WAM-2), the Global Distribution of Mangroves (GDM), and the Global Mangrove Watch (GMW), were initiated to monitor mangroves [38,39]. The global mangrove maps may be most useful for mapping the national and regional coverage of mangroves [39]. Therefore, they may be of limited use for those managing relatively small/protected areas containing mangrove forests. Effective protection of mangroves would be attained if losses are recognized as soon as feasible after the loss event and were made available to users in a form they can easily access and use.
Therefore, this study aimed to use a supervised classification approach and remote sensing data to analyze the patterns and dynamics of Zanzibar’s mangrove forests in two major mangrove-protected bays, i.e., Chwaka and Menai in Unguja, over 47 years, from 1973 to 2020. With 10 different species of mangroves and a broad variety of plants and animals, Chwaka Bay is home to the biggest single area of mangrove forests in Zanzibar [9]. The Menai Bay Conservation Area (MBCA), established in August 1997, is the largest marine-protected area, at 470 km2 [9]. The ecosystems in the two bays have supported and modeled the local economy, culture, and social well-being of the local people [9]. Mangrove-growing stock in Unguja has diminished with time, compared to that of Pemba’s [9].

2. Materials and Methods

2.1. Study Sites

This research was carried out in two protected areas, i.e., Chwaka Bay and Menai Bay in Unguja Island in Zanzibar, Tanzania. Out of 125,000 ha of mangrove found in Tanzania, 18,000 ha are located in the Zanzibar Islands, and the two study areas composed of about 4400 ha [40]. Unguja, which is, c., 1660 km2, is one of the two main islands in Tanzania’s semi-autonomous archipelago of Zanzibar (Figure 1) [41]. The island is situated south of the equator (5°70′ to 6°50′ S and 39°18′ to 60′ E). The climate is subject to the effects of the northeast and southeast monsoon winds [42]. In the months of December to March, when northeast monsoon winds are blowing, the climate is relatively hot and dry [42]. The southeast monsoon winds, which blow between April and November, bring heavy rains, which range between 1000 and 2500 mm. The monsoon winds also bring a cool and dry season between June and October. The average rainfall per annum is 1628 mm. Zanzibar’s relative humidity ranges from 55% to 99% with an average of 78% throughout the year [42,43]. The mean monthly temperature is, c., 26 °C. The majority of Zanzibar’s soils are sandy and coralline, with low moisture retention, severe alkalinity, and a hard subsoil, resulting in poor drainage [7,32]. Fish, salt, limestone, and natural gas are in abundance in the coastal regions. Chwaka Bay is on the east coast of Unguja, c., 34 km east of Zanzibar town. Chwaka Bay has the largest area covered by mangroves in Zanzibar, i.e., c., 2294 ha [42]. Ten species of mangroves are found in Chwaka Bay, i.e., Rhizophora racemose, Bruguiera gymnorrhiza, Ceriops tagal, Sonneratia alba, Avicennia marina, Xylocarpus granatum, Xylocarpus moluccensis, Heritiera littoralis, Lumnitzera racemosa, and Pemphis acidula, [43]. The Menai Bay Conservation Area (MBCA), which is situated in the southwest of Unguja, has 6 islets [43]. Menai’s mangroves occupy, c., 988 ha, but their ecological composition is varied due to intense deforestation. There are numerous stumps and no fully grown trees [42,43]. The majority of the trees are young Rhizophora mucronata trees that are, c., 4–5 m tall. There are a few young Bruguiera gymnorrhiza and Ceriops tagal trees at the edge of the forest.

2.2. Data Acquisition and Pre-Processing

This study used satellite data (Table 1) to monitor the mangrove changes between 1973 and 2020. Landsat images acquired in 1973, 1990, 1995, 2000, 2009, and 2020 were downloaded from the US Geological Survey Global Visualization Viewer (USGS Glovis) site. Persistent clouds cover the study areas all year round. The Landsat MSS (Multispectral Scanner) collected data from Landsats 1–5. Landsat TM (Thematic Mapper) and ETM+ (Enhanced Thematic Mapper Plus) have 7 spectral bands with a spatial resolution of 30 m for bands 1–5 and 7, while band 6, a thermal infrared, is acquired at a 120 m and 60 m resolution, respectively. The Landsat 8 data have 9 spectral bands with a spatial resolution of 30 m for bands 1–7 and 9. Both Landsat 7 and 8 acquire the panchromatic band, i.e., band 8 at a pixel size of 15 m. Google Earth images and topographical maps and aerial data obtained from the Department of Forestry and the Department of Land Surveying Zanzibar were used as reference datasets to determine the accuracy of the classified results.
The Landsat module tool in the TerrSet IDRISI software version 18.1 was used to radiometrically correct the Landsat images. The raw DN (digital number) values were converted to surface reflectance. Using the dark-object subtraction algorithm, atmospheric correction was carried out to remove atmospheric haze. All images were projected onto the UTM zone 30 North projection system. The Landsat images were resampled to a 15 m spatial resolution using the nearest neighborhood resampling technique [28,44].

2.3. Acquisition of Ground Control Points

Ground control points were acquired using a portable Global Positioning System (eTrex® 20 GPS Receiver; Garmin, Olathe, KS, USA), Landsat OLI imagery, topographical maps, and aerial photographs covering the two study sites. Ground truth points were gathered in June 2021. Greater details and color contrasts were obtained by the false color (rgb—754) Landsat OLI composite. Within the study sites, appropriate transect lines were placed to sample the different class types, i.e., mangroves, other forests, bare ground, agriculture, and water—where the classes were more homogenous. Thirty-two coordinates with an accuracy of 3 to 5 m were gathered for each of the five classes in each of the two study areas. The coordinates were then overlaid on the resampled Landsat images. The points were converted into polygons using the TerrSet software 2020 v. 19.0 by following the edges of the respective pixels. The polygons were then used as reference data to generate regions of interest (ROIs) which represented the land cover classes.

2.4. Spectral Separability

An analysis of the multispectral response patterns of the land cover types was used to determine their spectral separability. Spectral separability computes the statistical distance between signatures; therefore, it determines the overall classification accuracy [45]. The transformed divergence (TD) index and Jeffries-Matusita (J-M) distance separability measures were used in this study. Divergence (D) is calculated from the mean and variance–covariance matrices of data representing feature classes [46]:
D i j = 1 2 t r ( Ʃ i Ʃ j ) ( Ʃ j 1 Ʃ i 1 ) + 1 2 t r ( Ʃ i 1 + Ʃ j 1 ) ( μ i μ j ) ( μ i μ j ) T
The TD is used to lessen the effect of well-separated classes, which may increase the average divergence value and make the divergence measure misleading [46]:
T D i j = c 1 e D i j 8
where tr[·] is the trace of a matrix, which is the sum total of the diagonal elements of the matrix, and Σi and Σj are the variance–covariance matrices of classes i and j; μi and μj are the corresponding mean vectors; and c is a constant value defining the range of TD values.
The J-M distance between distributions of two classes ωi and ωj has been defined as follows [47]:
J M i j = 2 1 e B i j
where Bij is the Bhattacharyya distance computed as [48]:
B i j = 1 8 μ i μ j T Ʃ i + Ʃ j 2 1 μ i μ j + 1 2 l n 1 2 | Ʃ i + Ʃ j | | Ʃ i | | Ʃ j |
where μi and μj are the mean reflectance of species i and j; Σi and Σj correspond to their covariance matrices; and |Σi| and |Σj| are the determinants of Σi and Σj, respectively. ln is the natural logarithm function, while T is the transposition function.
As a general rule, classes are separable if the result is greater than 1.9, fairly separable if it is between 1.7 and 1.9, and not separable if it is below 1.7 [49].

2.5. Pairwise Feature Comparison

The pairwise comparison technique was used to compute similarity scores between each pair of Landsat bands [50]. If the similarity score is greater than a predefined threshold, then the two bands are co-referent. Table 2 shows a correlation matrix calculated from the Landsat 8 bands.

2.6. Image Classification

The maximum likelihood classification algorithm was also used to classify the Landsat images. This algorithm is widely used in remote sensing because of its strong theoretical foundation and can accommodate varying data, land use and land cover (LULC), and satellite systems [51]. Therefore, this study used TerrSet’s hybrid classification technique, which combines segment-based and pixel-based categorization [52]. SEGMENTATION, SEGCLASS, and SEGTRAIN are the three modules that make up the technique [52]. Image segmentation was applied using the SEGMENTATION module to group pixels according to their spectral similarity, i.e., using a watershed delineation approach, the input images were segmented based on the variance similarity of pixel values. The SEGTRAIN module was then used to convert the image segments into training sites and signature classes. Finally, the SEGCLASS module was used to categorize segments based on a classified image created using pixels.

2.7. Accuracy Assessment

Accuracy assessment quantitatively evaluates how well the pixels were sampled into the appropriate land cover groups. The performance of the classifier was evaluated using ground truthing. Confusion matrices with the user’s, producer’s, and overall accuracies as well as kappa statistics were generated. The producer’s accuracy (PA) is the likelihood that a specific land cover of a location on the ground will be labeled as such. How frequently the class shown on the map will actually be present on the ground depends on the user’s accuracy (UA). The kappa coefficient (ĸ) was used to assess if one error matrix differs significantly from another [53].

2.8. Change Detection Analysis

The CROSSTAB module in the TerrSet Geospatial Monitoring and Modeling Systems was used to track the mangrove forest changes from 1973 to 2020. The product of the CROSSTAB is a cross-classification image or a table, or both [54]. In this study, the CROSSTAB module was instructed to generate both a statistical table and a change detection image. The tabular matrix generated after cross-tabulation shows the number of pixels corresponding to each combination of categories in the two classified maps. Additionally, CROSSTAB provides the tabular matrix in terms of the proportion of the total number of pixels and summary statistics [54]. The image output produces an image which represented a category combination from each of the two photos under comparison. The image output produces an image in which each pixel shows the combination of categories in the two.

3. Results

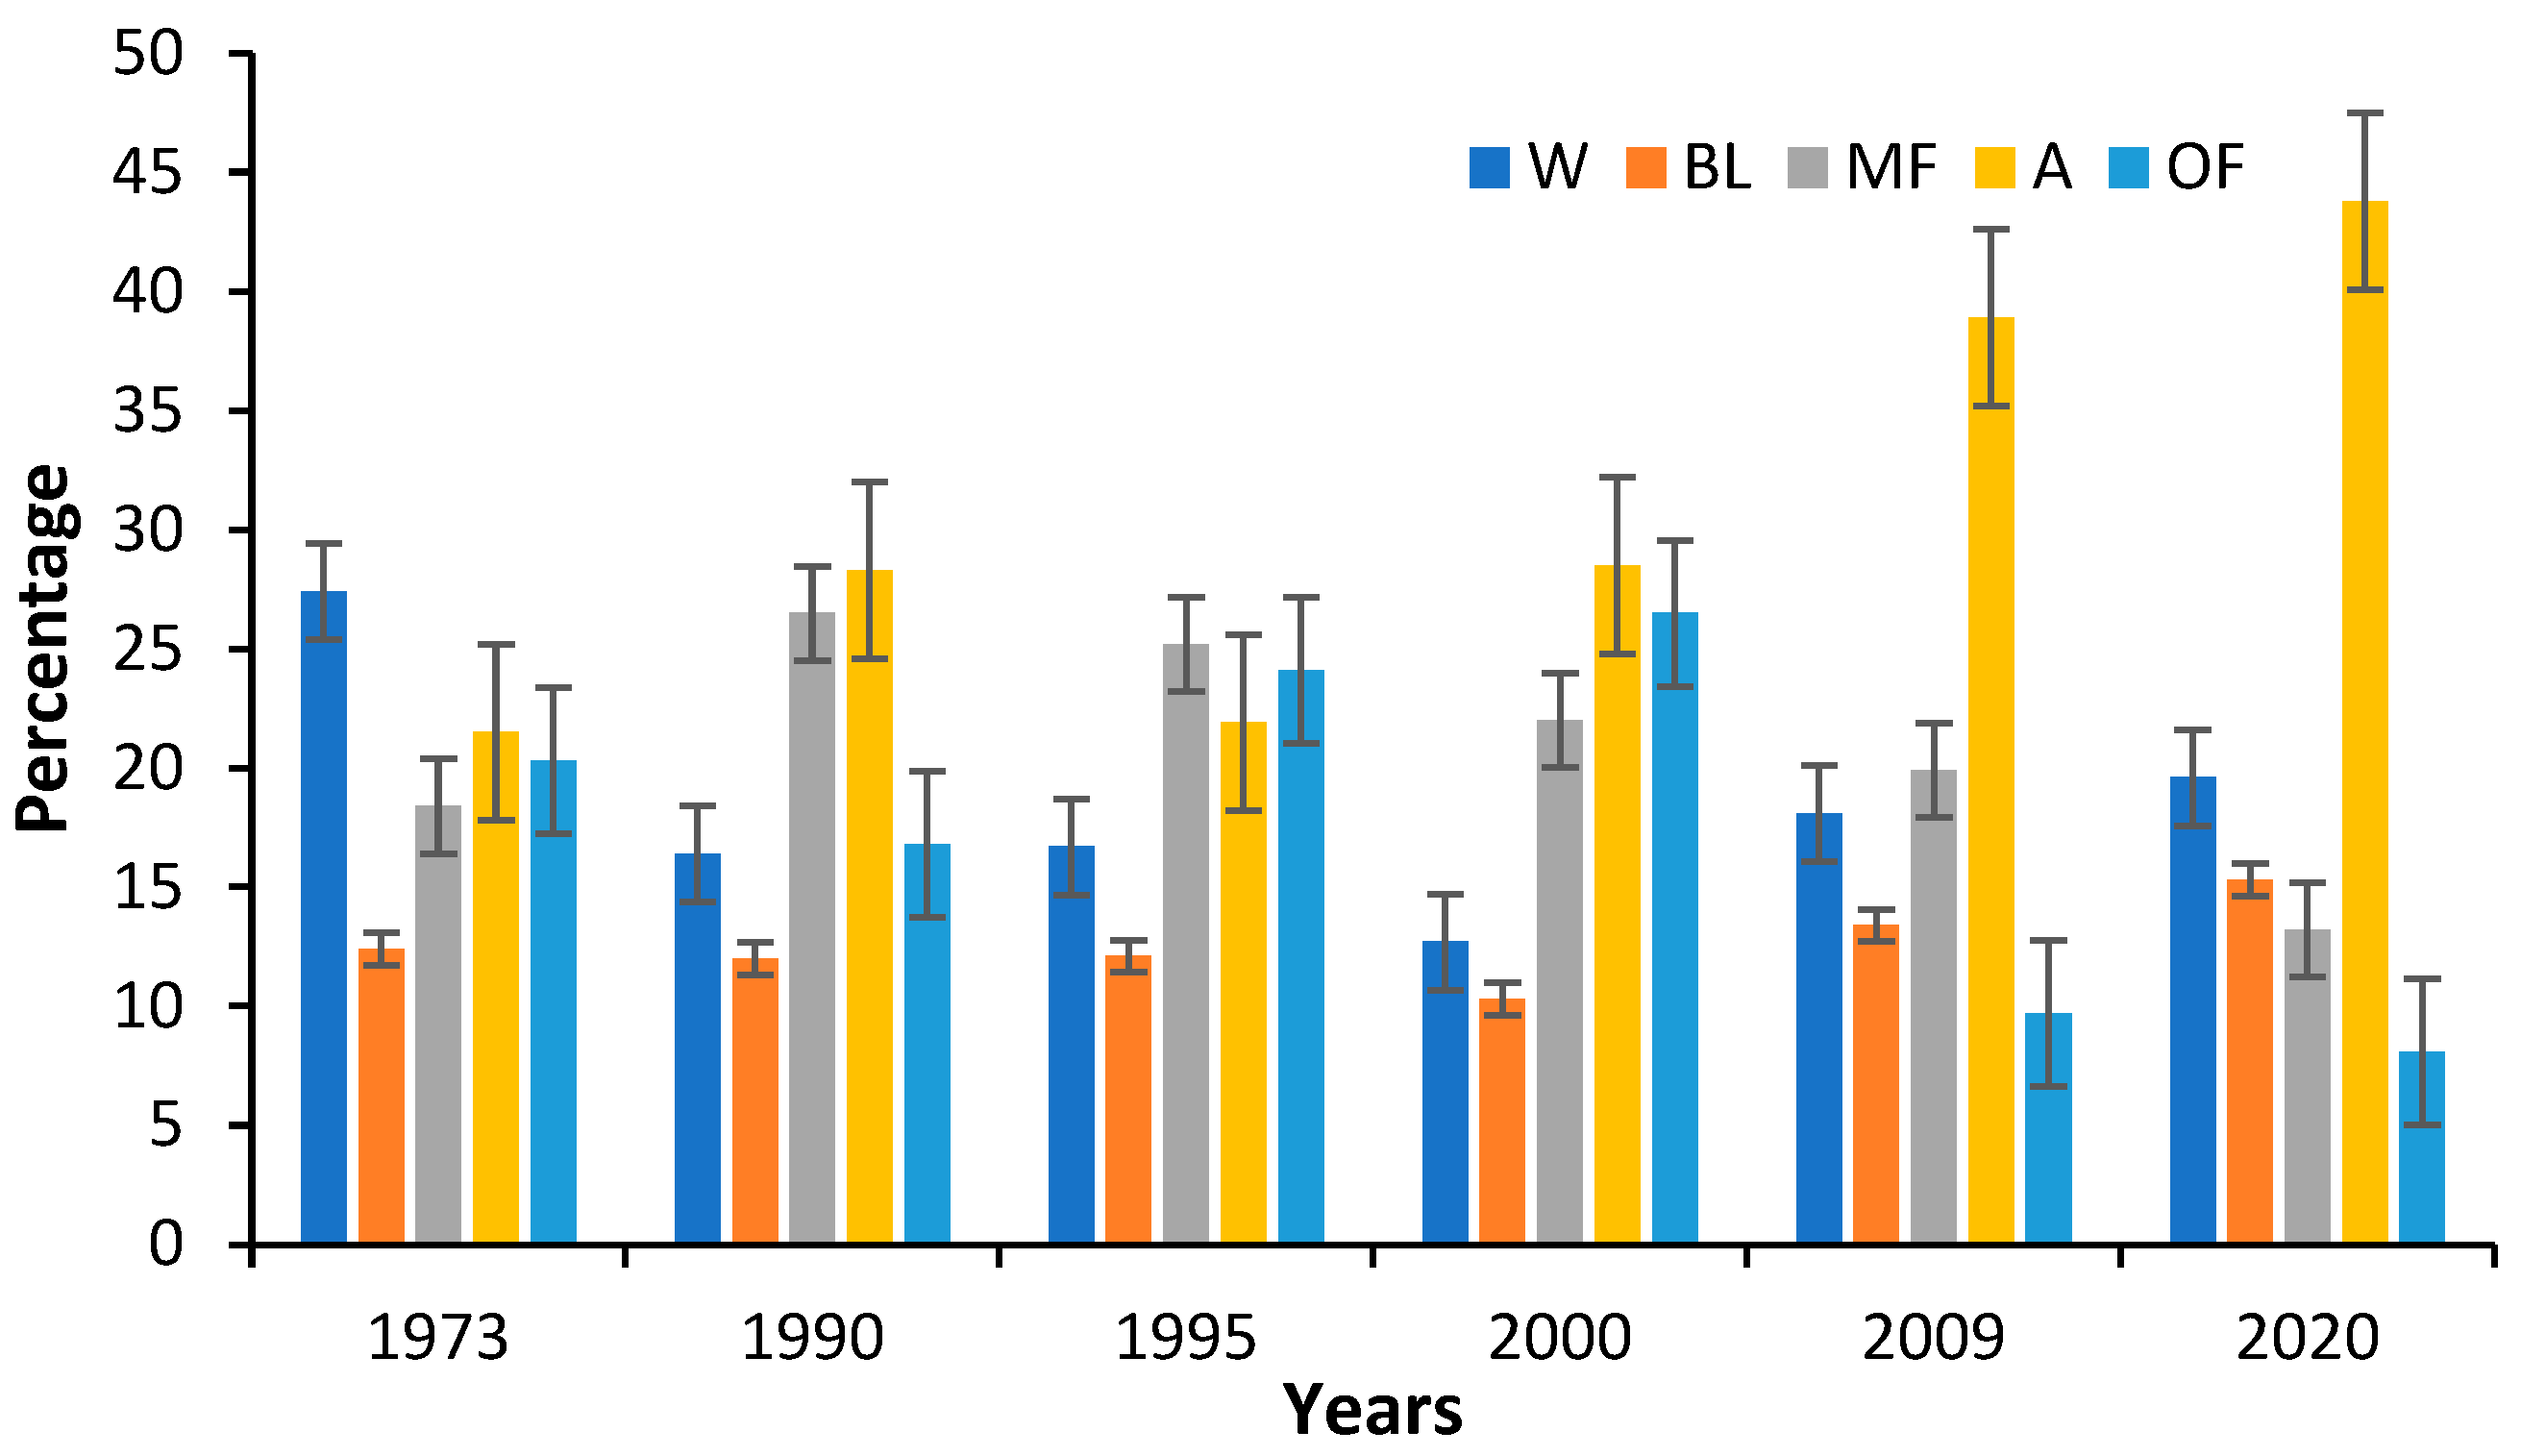
3.1. Spectral Separability between Land Cover Classes

The mean spectral reflectance curves extracted from the pixels of the respective LCLU classes in the two study areas are plotted with their standard deviations (SDs) (Figure 2). Overall, within 1 SD, the seven Landsat bands recorded considerable spectral overlaps of the five LULC classes. More spectral overlaps were exhibited by the visible bands (bands 1 to 4, i.e., coastal aerosol, blue, green, and red). The lowest reflectance values were recorded by the visible bands, followed by band 7 (Short-wave 2), 6 (Short-wave 1), and 5 (Near Infrared), respectively. Near Infrared (band 5) showed the largest difference in reflectance values between water and non-water bodies. Only Near Infrared and Short-wave 1 (bands 5 and 6, respectively) were helpful in separating water and the other classes, beyond 1 SD of uncertainty.
Table 2 shows the spectral separability of the five LULC classes, i.e., water, other forests, mangrove forests, bare land, and agriculture, calculated from bands 1–7 of the Landsat OLI imagery using transformed divergence (TD) and the Jeffries–Matusita (J-M) distance. According to the results, for the Landsat OLI, ETM+ (2009), ETM+ (2000), and TM (1995) images, the TD index showed that all classes attained values higher than 1.9; therefore, they were all separable. The same applied to the J-M distance except for agriculture/other forests, which reported a separability value < 1.9. The Landsat TM (1990) image shows that, according to the TD index, other forests/mangrove forests and other forests/agriculture and J-M’s other forests/mangrove forests, other forests/agriculture, and mangrove forests/agriculture did not attain the 1.9 separability threshold. The Landsat MSS image showed that for both the TD index and J-M distance, other forests/mangrove forests, other forests/bare land, other forests/agriculture, mangrove forests/bare land, mangrove forests/agriculture, and bare land/agriculture were not separable.

3.2. Pairwise Band Comparison

The bands of the Landsat scenes covering the two study areas were found to be significantly correlated. For the Landsat OLI, the pairwise comparison showed that the bands with the highest correlation coefficients were bands 1 and 2 (0.99), 1 and 4, 2 and 4, and 3 and 4, all of which are visible bands (Table 3). Correlation values > 0.7 are considered significant—pairs of Landsat bands with such values are known to be correlated. Therefore, they provide redundant information, i.e., the recorded reflectance in one channel could be used to predict the value in the other. Therefore, with the exception of bands 5 and 1, and 5 and 2 which reported the least correlation coefficient values of 0.68 and 0.66, respectively, the Landsat bands of the image are significantly correlated.

3.3. Image Classification

The classification maps for the years 1973, 1990, 1995, 2000, 2009, and 2020 show the LULC changes in Chwaka Bay in the last 47 years (Figure 3). Figure 4 depicts the percentage area covered under each class, i.e., water, bare land, mangroves, agriculture, and other forests in Chwaka Bay in 1973, 1990, 1995, 2000, 2009, and 2020. Significant LULC changes can be observed from one period to another, e.g., bare land, mangrove forests, agricultural land, and other forests in 1973 occupied, c., 8%, 24%, 19%, and 22%, respectively, but by 2020, they occupied, c., 9%, 12%, 35%, and 17%, respectively. Therefore, by the year 2020, only a portion of the mangrove forests remained, which is about half the area covered by mangroves in 1973. Between 1973 and 2020, the area covered by water increased by, c., 3%.
Figure 5 shows the distribution of LULCs in Menai Bay between 1973 and 2020. It can be observed from the 1973 land cover map that mangroves and other forests were distributed over the study area, but in 2010 and 2020, mangroves and other forests were cleared. The 2020 map shows that only a narrow strip of mangroves remained in a southwest–northeast direction. Only a handful of other forests remained in the northern part of the study area.
The dynamics of the LULCs in Menai Bay, for the years 1973, 1990, 1995, 2000, 2009, and 2020, are shown in Figure 6. In 1973, mangrove forests occupied 18.4% of the study area, but by 2020, only 13.2% remained. Agricultural land and bare land increased from 21.5% to 43.8% and 12.4% to 15.3%, respectively, while water and other forests declined from 27.4% to 19.6% and 20.3% to 8.1%, respectively. Mangrove forests showed a decrease of 5.2%.

3.4. Accuracy Assessment

The overall accuracies for Chwaka Bay in 1973, 1990, 1995, 2000, 2009, and 2020 were 82.5%, 85.4%, 86.6%, 89.3%, 91.7%, and 92.7, respectively. The kappa coefficients (ĸ) were 0.72, 0.76, 0.79, 0.81, 0.86, and 0.89, respectively. In Menai Bay, the overall accuracies were 85.5%, 85.5%, 85.4%, 93.1%, 91.0%, and 94.5, respectively. The ĸ values were 0.77, 0.77, 0.78, 0.87, 0.88, and 0.90, respectively. The producer’s and user’s accuracies were in the range of 72–100% (Table 4).

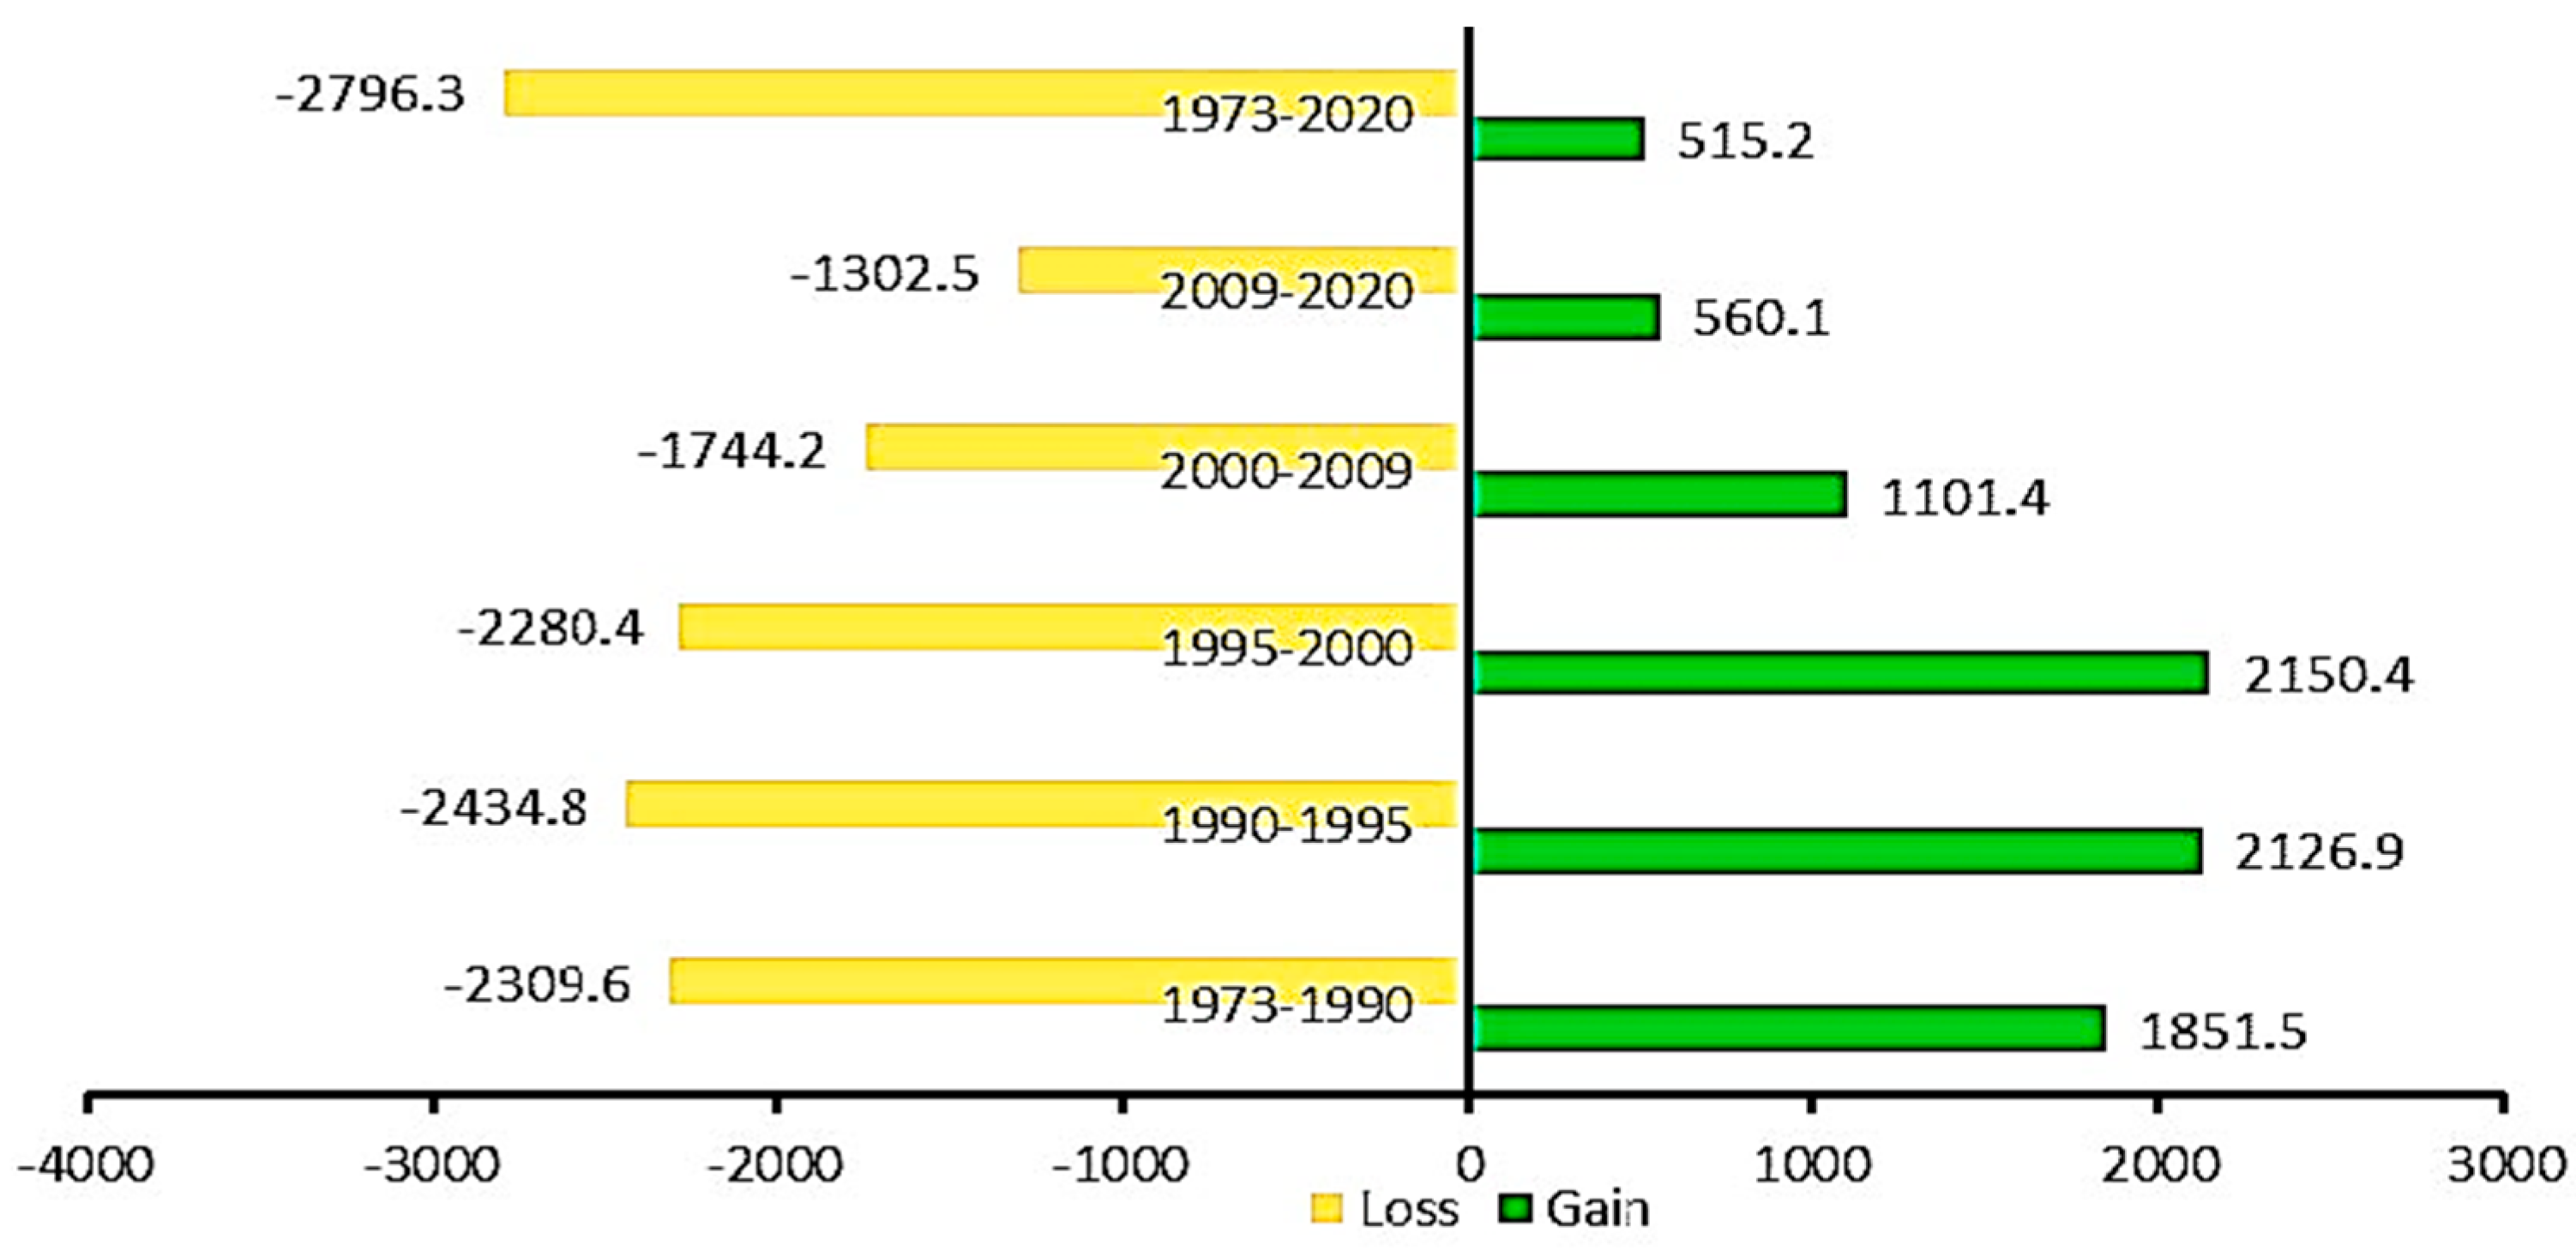
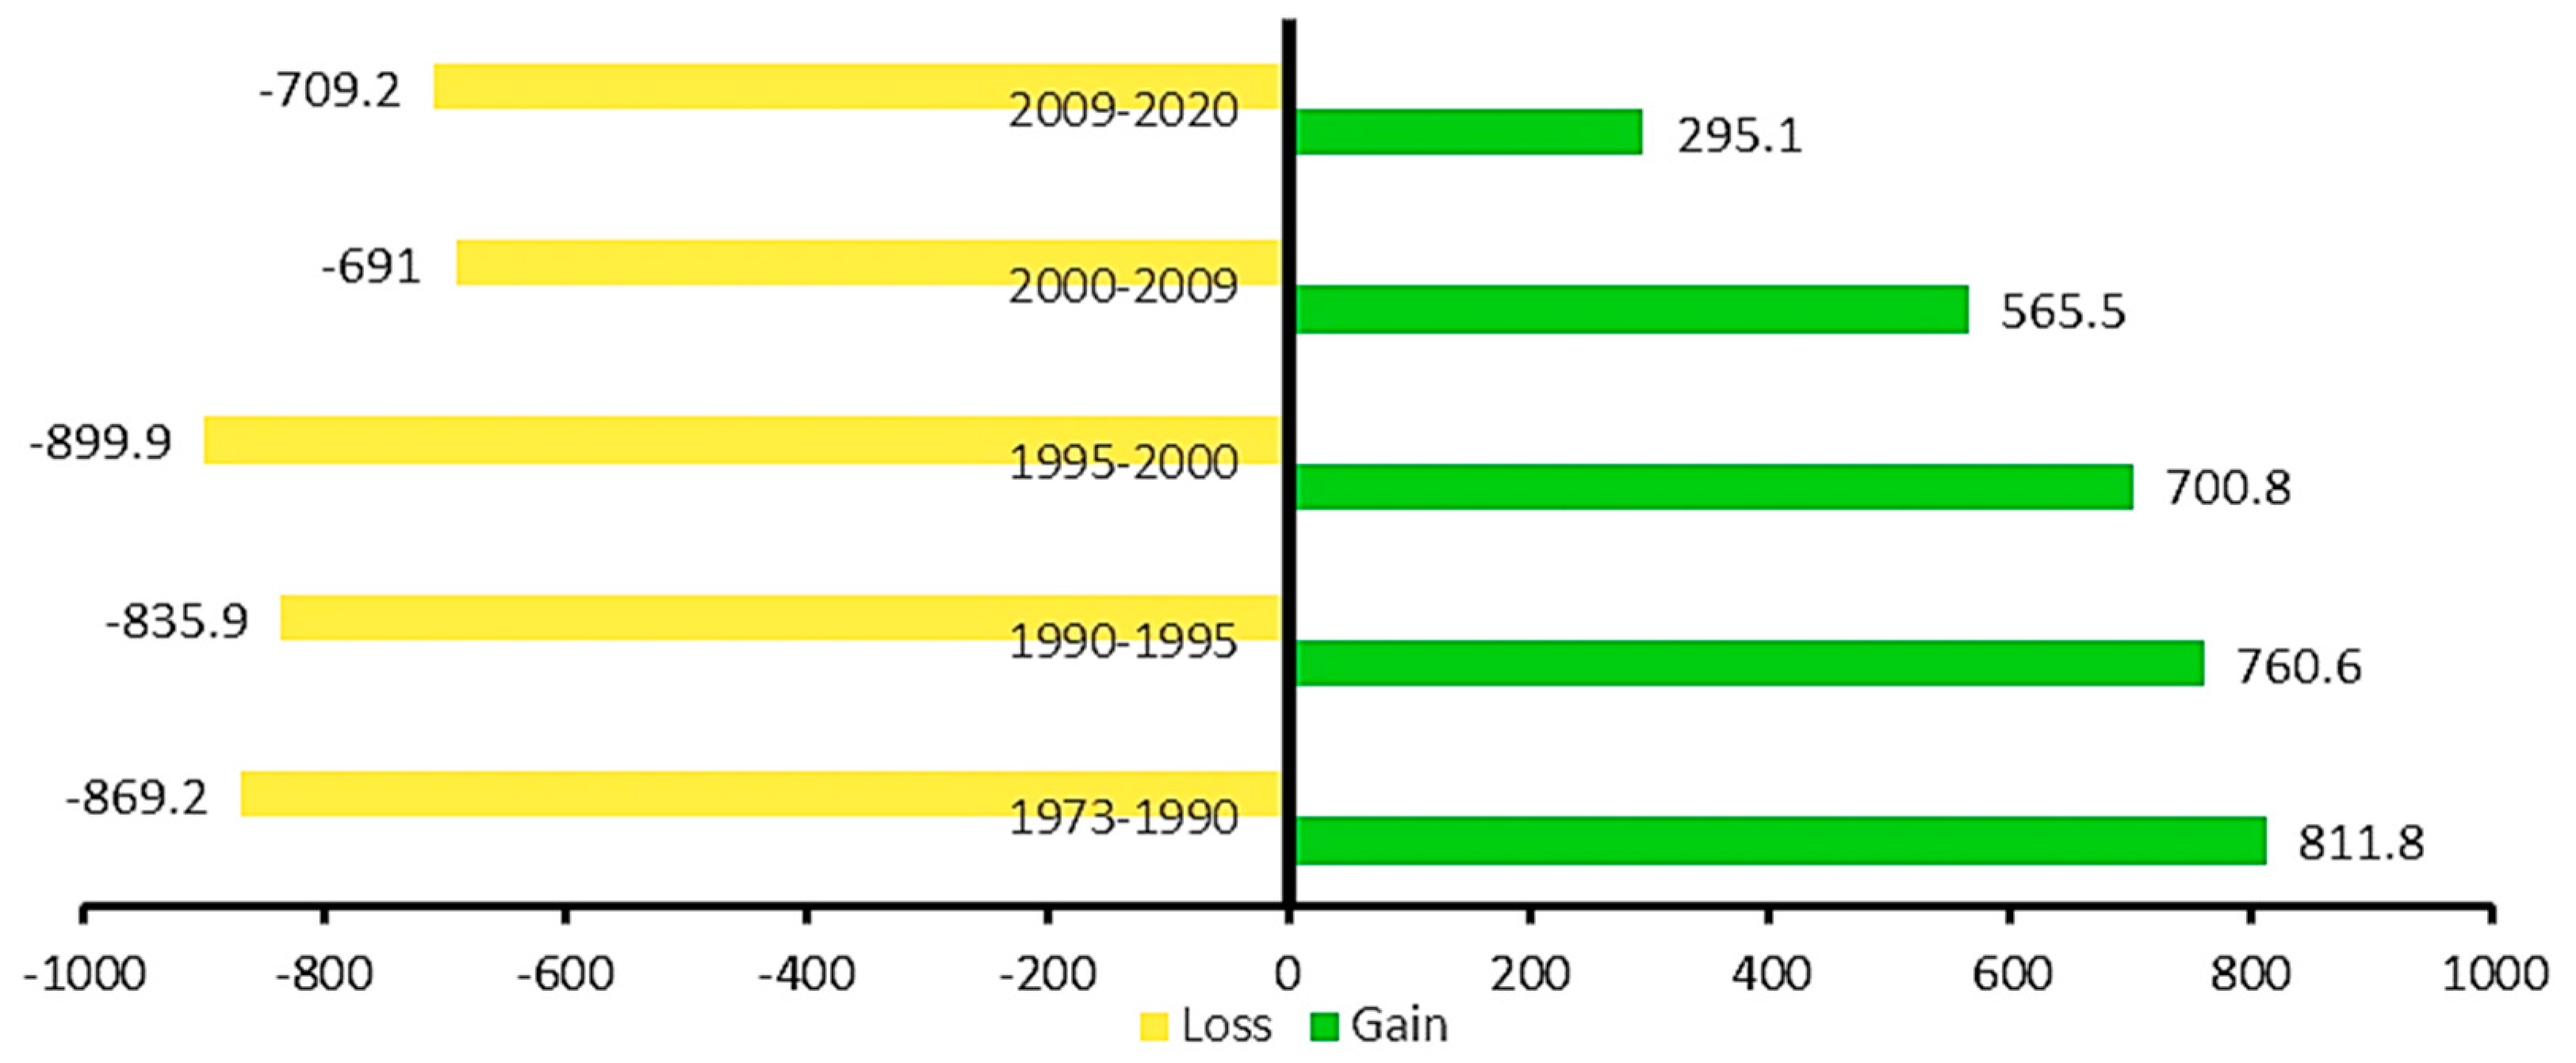
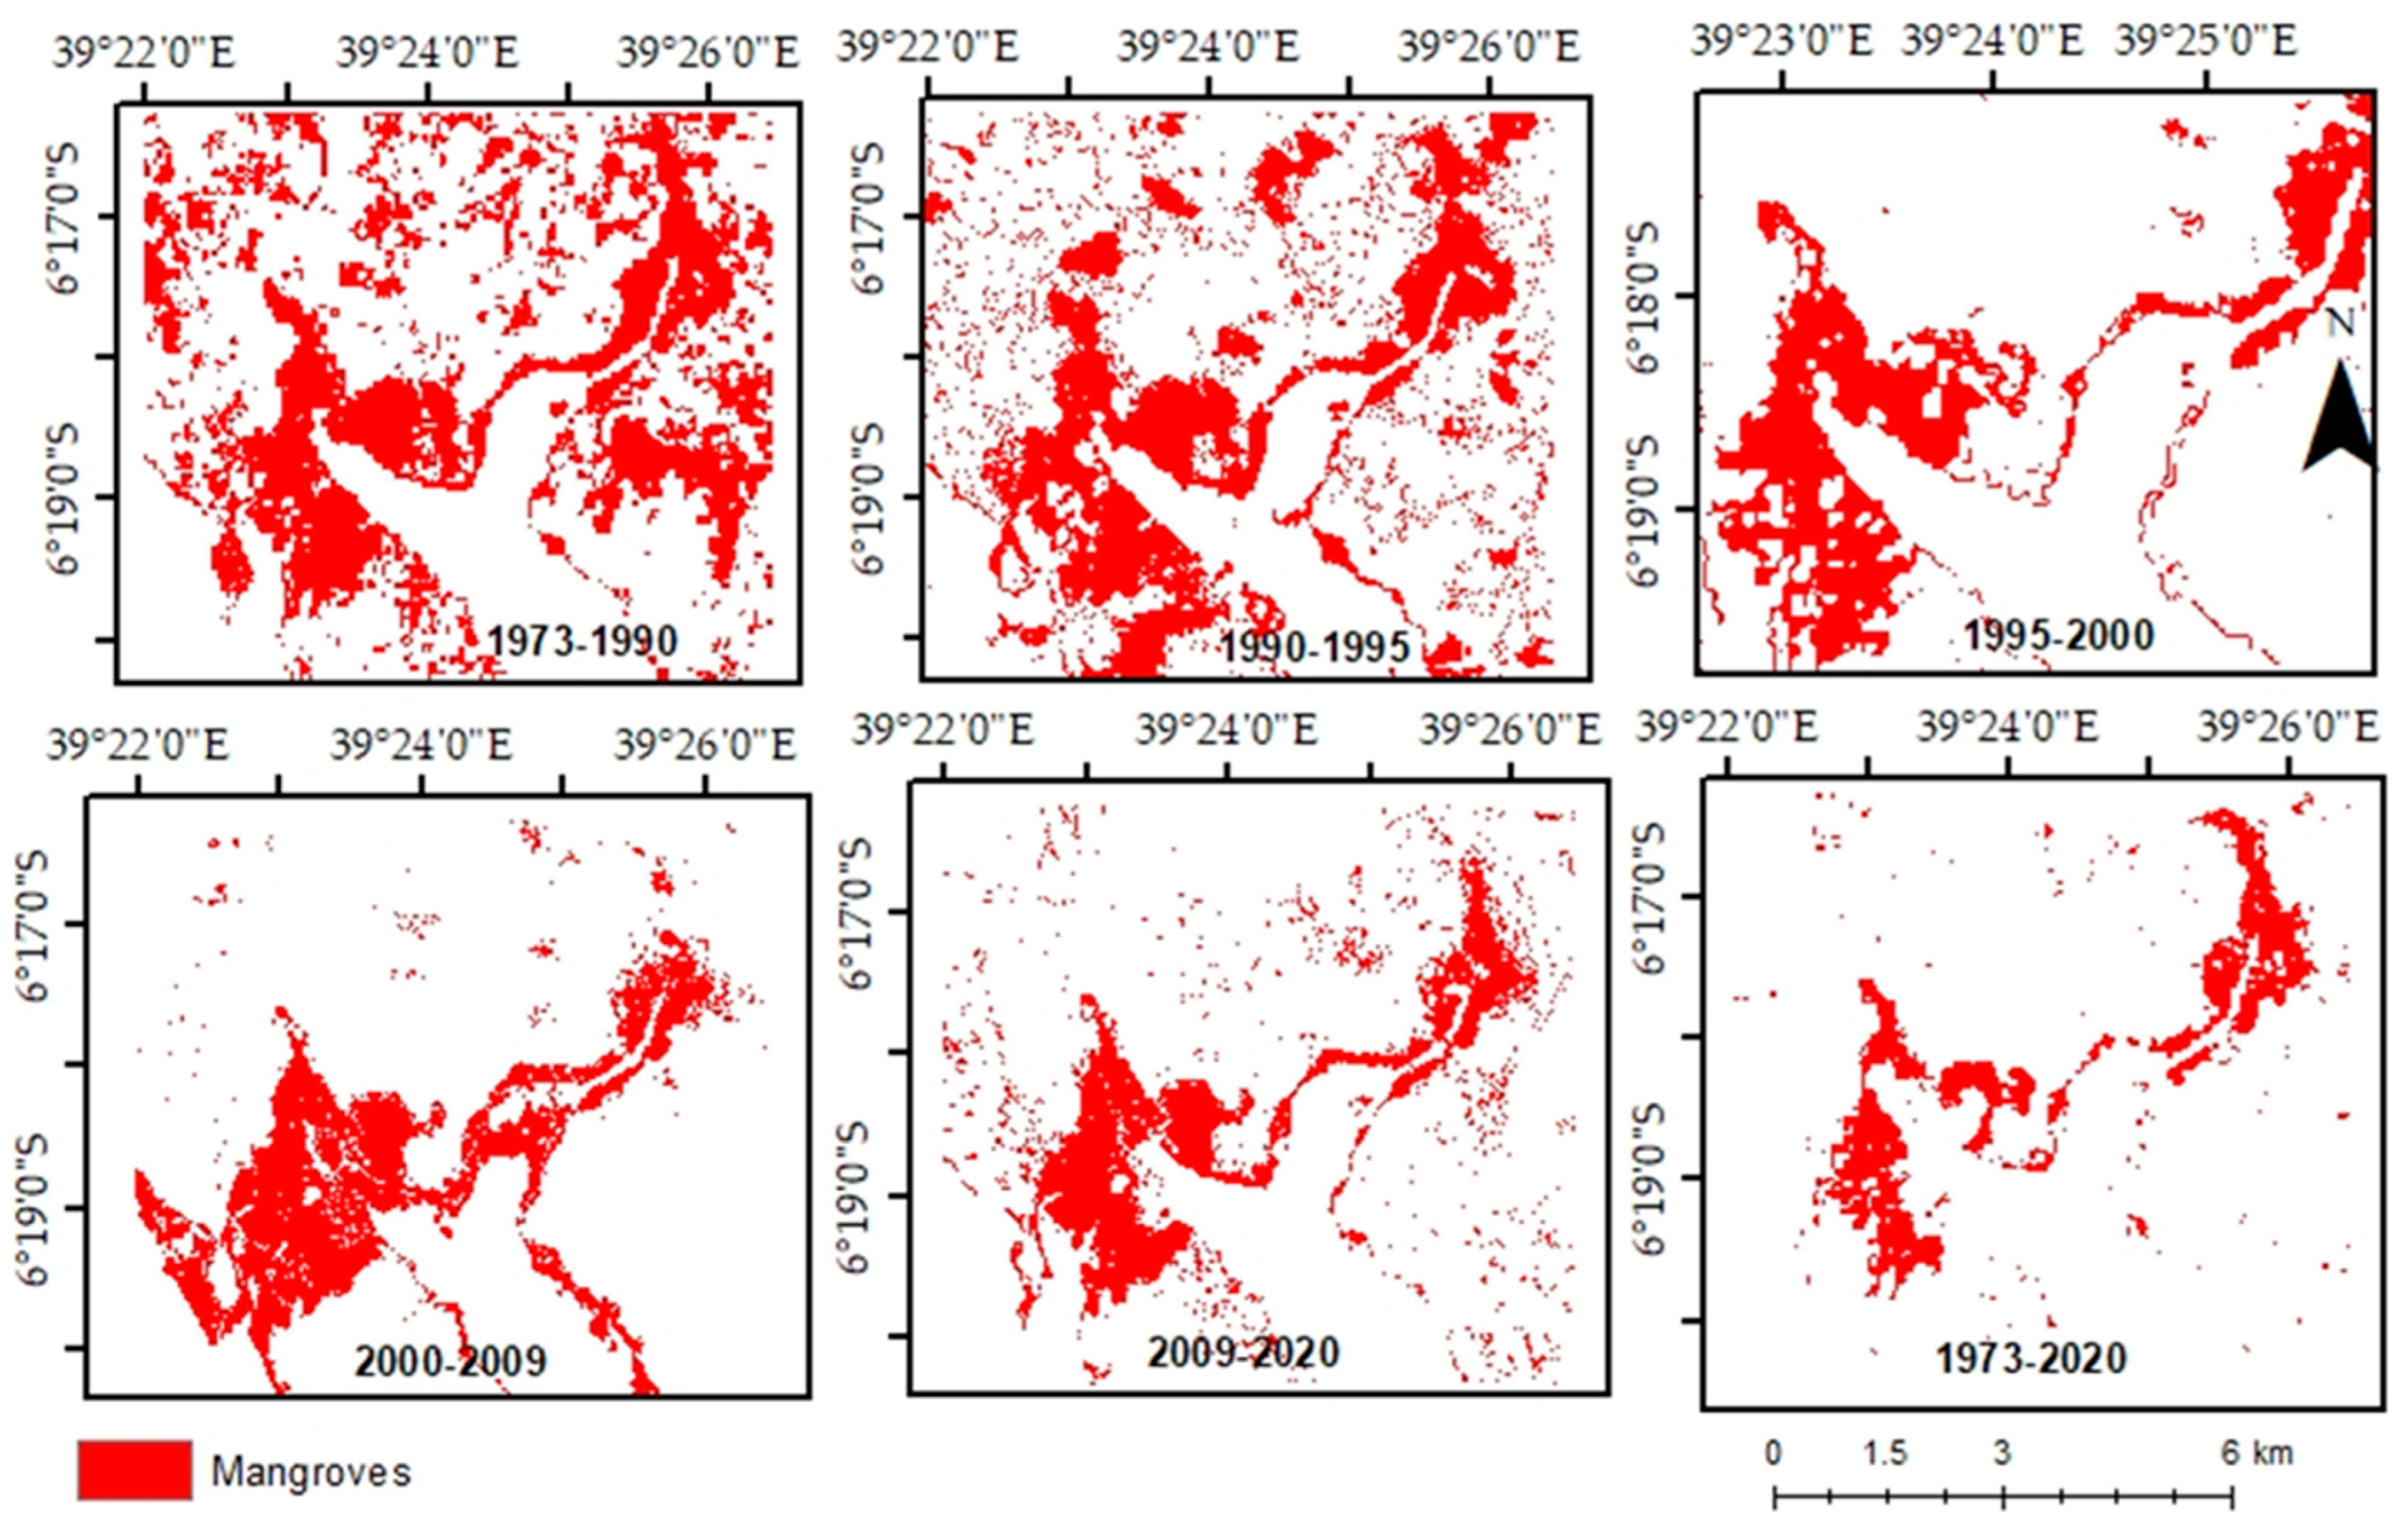
3.5. Change Detection Analysis

3.5.1. Spatio-Temporal Mangrove Distribution in Chwaka Bay

The 1973–2020 period shows that mangrove cover reduced from 3988.0 ha to 1706.6 ha, i.e., a 57.2% decrease. This is equivalent to a deforestation rate of 1.2% per annum. The 1973–1990 period shows that mangrove forests reduced from 3988.0 ha to 3529.9 ha, i.e., an 11.4% decrease. This is equivalent to a deforestation rate of 26.9 ha per annum. The mangrove forest cover lost 783.5 ha to sea water, probably due to rising sea levels, 473.3 ha were converted into bare land, 291.3 ha into agricultural land use, and 303.4 ha into other forests. During this period, mangroves gained 6.7 ha initially occupied by sea water, 508.6 ha from bare land, 420.5 ha from agriculture, and 1373.8 ha from other forests. From 1990 to 1995, mangrove forests decreased from 3529.9 ha to 3222.0 ha, i.e., an 8.7% decrease, a decrease of, c., 62 ha per annum. About 2.7 ha of the mangrove forest cover was covered by sea water, 327.8 ha were converted into agricultural land, 1369.8 ha were converted into other forests, and 426.7 ha were degraded to bare land. Mangroves gained 774.2 ha from the area formerly occupied by the sea, 529.0 ha from bare land, 602.7 ha from agricultural land, and 528.9 ha from other forests. Between 1995 and 2000, mangrove forests decreased from 3222.0 ha to 3092.0 ha, i.e., c., a 4% decrease, translating to a loss of about 26 ha per annum. The mangroves lost 768.4 ha to water, 149.5 ha to bare land, 556.2 ha to agriculture, and 676.3 ha to other forests. During this period, mangrove forests gained 9.5 ha from water, 585.7 ha from bare land, 465.1 ha from agricultural land, and 1220.2 ha from other forests. From 2000 to 2009, the mangroves decreased from 3092.0 ha to 2449.2 ha, i.e., a 28.2% decrease, translating to a rate of change of 71.4 ha per annum. About 3.0 ha of the mangrove forest cover was covered by sea water, 134.4 ha were converted into agricultural land use, 343.3 ha were converted into other forests, and 620.6 ha were degraded to bare land. The mangroves gained an area of about 766.4 ha from the sea, 147.4 ha from bare land, 490.4 ha from agricultural land, and 340 ha from other forests. In the 2009 to 2020 period, there was a decrease of mangrove forests by about 32.5%, at a deforestation rate of 67.5 ha per annum. The mangrove area was turned into other land use, i.e., 23.6 ha were covered by sea water, 115.2 ha were transformed into bare land, 193.6 ha were transformed into agricultural land use, and 227.8 ha were converted into other forests. The mangrove forest cover gained about 82.0 ha from the sea, 165.8 ha from bare land, 343.6 ha from agricultural land, and 711.1 ha from other forests.
Figure 7 shows the mangrove forest gain and loss (in ha) from 1973 to 2020. The amount of mangrove change differed from one period to another. The green color shows the area (in ha) that the mangrove forest cover gained from the other LULC classes, while the yellow color indicates the area of the mangrove forest lost to the other LCLU classes, i.e., water, bare land, agriculture, and other forests. Overall, mangroves lost, c., 2797 ha to water, bare land, agriculture, and other forests and gained, c., 515 ha. The overall destruction of the mangroves was, c., 2281 ha. Change in the area covered by mangrove forests was lowest between 1995 and 2000 and highest between 2009 and 2020. Therefore, the general trend shows that the area of mangrove forests lost to the other LULC classes increased with time.
Figure 8 shows the spatiotemporal mangrove distribution in Chwaka Bay, Unguja, Zanzibar, Tanzania from 1973 to 2020.

3.5.2. Spatio-Temporal Mangrove Distribution in Menai Bay

The 1973 to 2020 period shows that the mangrove cover reduced from 1694.6 ha to 819.2 ha, i.e., a 51.7% decrease. This is equivalent to a deforestation rate of 1.1% per annum. During the 1973–1990 period, there was a 3.4% decrease of the mangrove forest cover, i.e., from 1694.6.0 ha to 1637.2 ha, equivalent to a degradation rate of 3.4 ha per annum. In the 17-year period, 34.2 ha of mangroves were covered by sea water, 164.3 ha were degraded to bare land, 404.3 ha were converted into agricultural land use, and 266.4 ha into other forests. In the same period, the mangrove forest cover gained an area equivalent to 95.7 ha originally covered by sea water, 194.8 ha from bare land, 247.1 ha from agricultural land use, and 274.2 ha from other forests. Between 1990 and 1995, the mangrove forest cover reduced from 1637.2 ha to 1561.9 ha, i.e., a 4.4% loss. The mangrove forest cover gained 15.4 ha of land earlier occupied by sea water, 135.2 ha by bare land, 332.4 ha by agricultural activities, and 277.6 ha by other forests. About 37.7 ha of mangroves were covered by sea water, 184.3 ha were converted into bare land, 321.2 ha into agricultural land, and 292.7 ha into other forests. The 1995–2000 period saw mangroves decrease from 1561.9 ha to 1358.9 ha, i.e., a reduction equivalent to 12.0%. About 3.9 ha of mangrove were covered in water, 179.7 ha turned into bare land, 169.9 ha into agricultural land use, and 550.3 ha into other forests. In this period, mangrove gained 261.2 ha from an area initially covered by water, 107.8 ha from bare land, 192.8 ha from agricultural land, and 139.0 ha from other forests. In the 2000–2009 period, mangrove forest cover fell by 125.6 ha (7.4%), i.e., from the initial 1358.9 ha to 1233.4 ha. The fall is equivalent to a mangrove degradation rate of 14.0 ha per annum. About 341.3 ha of mangroves were occupied by sea water, 146.8 ha transformed into bare land, 94.6 ha into agricultural land, and 108.3 ha into other forests. The mangrove forest cover gained 6.8 ha originally occupied by sea water, 113.8 ha by bare land, 141.0 ha by agricultural activities, and 303.9 ha by other forests. From 2009 to 2020, the area covered by mangroves declined by 414.2 ha (24.4%), i.e., from 1233.4 ha to 819.2). The mangrove degradation rate was 37.7 ha per year. In this period, mangrove forest cover increased by 12.0 ha, an area initially covered in water, 92.3 ha from bare land, 128.7 ha from agricultural land, and 62.1 ha from other forests. About 76.2 ha of mangrove forest cover was covered by sea water, 240.3 ha turned into bare land, 349.3 ha lost to agricultural land use, and 43.4 ha to other forests.
Mangrove forest gain and loss (in ha) from 1973 to 2020 is shown in Figure 9. Generally, mangroves gained, c., 295 ha from the other LULC classes, but lost 709 ha to water, bare land, agriculture, and other forests. In the period from 1973 up to 1990, about 57.4 ha of mangrove forest cover was destroyed, while between 1990 and 1995, about 75.4 ha were cleared. The next three periods recorded massive destruction of mangroves. The highest change in the area covered by mangroves was between 2009 and 2020. The overall destruction of mangrove forests was, c., 875 ha.
Figure 10 shows the spatio-temporal mangrove distribution in Menai Bay, Unguja, Zanzibar, Tanzania between 1973 and 2020.

4. Discussion

This study aimed to detect and analyze the patterns and dynamics of mangroves in Zanzibar over a 47-year period, i.e., from 1973 to 2020, using a Landsat Earth observation dataset. Since the eighteenth century, mangroves and their products have been extensively exploited [55]. Mangrove wood was a valuable resource that the Sultan of Zanzibar harvested, utilized for construction, and transported to the Middle East, Europe, and America [55,56]. During that time, mangroves were exploited without any binding management plans in place; therefore, they were severely degraded [55,56]. This study found that the areal mangrove forest cover has been decreasing over the past 47 years, although the rates of change varied spatially and temporally, in both the Chwaka Bay and Menai Bay. In eastern Chwaka Bay, i.e., the Charawe, Chwaka, and Ukongoroni Villages, mangrove degradation is more severe compared to western Chwaka. The protected Jozani Forest in the southwest of Chwaka Bay may have promoted the conservation of mangrove forests in the area. Since Jozani was designated as a forest reserve in 1952, most of the island’s wildlife is found here, as similar habitats elsewhere have been destroyed to make room for human habitation. Chwaka Bay and Jozani Forest were placed under a single management system in 1995 under the name Jozani-Chwaka Bay Conservation Project (JCBCP). In Menai Bay, the areas experiencing the most degradation of mangroves are those closest to villages such as Unguja Ukuu, Pete, and Uzi. Therefore, Menai’s mangrove degradation is more prevalent in the western part than in the eastern part. Zanzibar’s rate of mangrove degradation is alarming, despite the availability of the current policy and regulatory frameworks to check their degradation. The most affected mangrove species are C. tagal, R. mucronata, and B. gymnorrhiza [57,58,59].
Like many other parts of the world, the loss of mangroves in Zanzibar is linked to human activities such as timber/pole cutting, firewood collection, charcoal burning, and crop cultivation [39]. This is due to rapid population growth coupled with poverty and a lack of alternative livelihoods [20]. The majority of the population in rural Zanzibar are poor, and they rely on firewood for cooking [57,60]. According to Mohammed [61] and Saunders [62], residents in rural Zanzibar majorly depend on mangroves for their livelihood, resulting in massive mangrove destruction. Coastal communities have been relying on mangroves and their products due to a lack of diversification of livelihood opportunities [62]. According to the National Bureau of Statistics and the Zanzibar Bureau of Statistics, Unguja’s population was, c., 250,000 in 1975, doubled to, c., 500,000 in 1996, and reached, c., 800,000 in 2009 [60]. The 2022 census shows that Zanzibar has 1,889,773 residents [63]. With an average population density of 712 people per km2 and an annual growth rate of 3.1%, the island has one of the densest rural populations in the world. A total of 13.0% of homes cannot afford to eat three meals a day, and around half of the households struggle to meet their basic needs [64]. Therefore, forests in Zanzibar, including mangrove forests, have been cleared for their products and also to create more space for agricultural land, especially in the coastal areas, to meet the rising demand for food and the burgeoning urban centers [58]. The demand for mangrove wood products in Zanzibar was 66,702 m3 in 1996 and was predicted to rise to about 940,630 m3 by 2006 [35]. With the current population growth rate, the demand for mangrove was expected to be at, c., 3,240,934 m3 in 2022. Some mangrove areas have been overexploited to an extent that without human intervention, natural regeneration would not occur and, therefore, they would not regain their ecological functions [59]. Despite increasing management interventions by the Revolution Government of Zanzibar (RGoZ) to conserve mangroves, biodiversity losses continue unabated [40]. Compared to national figures from the FAO and related research from the East African countries, Zanzibar has reported comparatively low deforestation [65]. However, this study found that since 2000, mangrove deforestation in Zanzibar has increased dramatically. Global data suggest an average annual mangrove loss rate of 0.21% [66], which is lower than the average mangrove decline in Zanzibar of 1.2%. Farms upstream overuse and/or improperly manage pesticides, animal waste, fertilizers, and other toxic agrochemicals, which eventually enter the water supply [9]. The problem is made worse by irrigation systems that reduce the amount of freshwater flowing to the wetlands. Mangroves are tolerant of saltwater, but they need the right balance of freshwater to survive, otherwise they dry/die [9]. After many years of uncontrolled/unsustainable coastal development and infrastructure, wetlands, as well as mangrove forests have been cleared to make way for roads, industry, city expansion, harbors, and resorts [9,58]. Overfishing, another threat to mangroves, can eradicate links in the marine food chain. In addition, fish farming can add extra nutrient waste to the marine ecosystems. Both overfishing and fish farming in Zanzibar have led to a shift in the delicate balance of marine ecosystems through, e.g., algae blooms that have affected mangroves [9]. The rise in sea level remains the biggest climate-related threat to mangroves in Zanzibar [9,57,60]. Some mangrove species cannot tolerate the influx of saltwater or escape the surging tides [9]. Although mangroves can keep pace with the sea-level rise, changes in climate and intense weather can cause them to shift or disappear, leading to lasting changes to the coastlines they protect [9], such as erosion along creeks. Drier conditions have slowed/stopped the natural buildup of organic peat soils [9]. Lessened water flow has caused the peat soils to collapse, undercutting the mangroves [9]. Sometimes storms damage trees, temporarily raising seawater levels and carrying sediment inland where it smothers the above-ground roots that provide mangroves with oxygen [9]. In places where mangroves have been degraded/cleared and reforestation activities have not taken place, other forest types have grown, but if the local weather conditions are not favorable, such places remain dry and bare. Afforestation activities initiated by the RGoZ and other stakeholders have led to the occurrence of mangrove forest cover where there was none.
In order to save mangroves in Zanzibar, the following should be implemented:
  • The government should consult the relevant stakeholders for sustainable coastal development and infrastructure.
  • Optimal practices for responsible seafood should be developed and implemented.
  • Work should be carried out at all levels to prevent the worst impacts of climate change.
  • Sustainable agricultural practices should be applied.
  • Free-flowing rivers should be advocated for.
  • The population growth rate should be controlled.
  • A policy specifically targeting conservation/management of mangrove forests in Zanzibar (the current policy does not separate mangrove forests from the other forest types) should be formulated.
  • A concerted effort in reafforestation and afforestation activities should be implemented.
  • The forest management capacity should be improved.
  • Zanzibar’s economy should be diversified.
Taking these actions will not only secure a future for mangrove forests alone, but it will also bolster the entire coastal ecosystem.
A method used in restoring mangroves in Zanzibar is through natural regeneration, where mangroves occupy the shoreline and natural succession takes over [36]. The R. mucronate and B. gymnorrhiza are successful regeneration species in most areas of Zanzibar [67]. The regeneration of R. mucronata on the Island of Pemba is 9549 seedlings/ha, compared to the 1592 seedlings/ha on Unguja Island [33,35]. The poor regeneration of R. mucronata on Unguja may be caused by the cutting and removal of the mangrove root system [67,68]. The mangrove forest cover in places such as Kisakasaka, Pete, Muungoni, and Muwanda in Unguja as well as Gawani, Mkoani, Kisiwa Panzaa, Makoongwe, and Micheweni in Pemba has significantly increased—this could be attributed to increased community participation in the conservation and management of mangroves [69]. Since the mid-1990s, the Department of Forestry in association with the local communities joined hands to rehabilitate the mangroves of Zanzibar [27].
Landsat imagery is highly useful for tracking the spatial changes in mangroves, although it is limited in terms of spatial resolution and was unavailable before the 1970s. What the extent of mangroves was before the use of satellites is unknown; however, satellite images revealed broad variations in mangrove extent over a short period of time, i.e., 47 years. This study found that mangrove forests in Zanzibar could be distinguished from other LCLUs using Landsat Earth observation data. This could be attributable to Landsat’s higher spectral resolution, compared to other satellites such as SPOT XS.
A crucial step in the processing of remote sensing data is the assessment or validation of accuracy. Previously, studies on satellite images’ categorization did not place a high importance on accuracy evaluation [70]. Yet, accuracy assessment has become a crucial step due to the increased potential for inaccuracy that digital imaging presents. An important step in evaluating the results of the classification process is the accuracy assessment [70]. In order to properly use the data, the user of land-cover results must be aware of how accurate the result is [70]. The minimum degree of interpretation accuracy in the identification of land use and land cover classes (LULC) using remote sensing data should be at least 85% [49,50,70]. Furthermore, this study’s overall accuracies (OA) in both study areas were above 85%, except the 1973 image for Chwaka Bay which recorded an overall accuracy of 82.5%. Overall accuracies in both study bays seem to improve from 1976 to 2020. For instance, the overall accuracies improved from 82.5% to 92.7% in Chwaka Bay and from 85.5% to 94.5% in Menai Bay from 1976 to 2020, respectively. Furthermore, the kappa coefficients improved in Chwaka Bay from 0.72 to 0.89 and from 0.77 to 0.90 in Menai Bay from 1976 to 2020, respectively. According to [70], there are variations between image resolutions in the relative disparities in overall accuracy and kappa coefficients. More precision will be achieved with higher quality images than with lower resolution ones [70].
The commission error is higher in the case of forest-related classes (mangroves, other forests, and agricultural land), which resulted in the classification of a greater number of points that do not fall into a specific category because of the confusion during classification [71]. Equally, the number of points that are incorrectly excluded from a category despite really being a part of that category is also reflected by the omission mistake. In comparison with water, the commission error was less because the nature of water bodies is quite different from other land covers. The average overall kappa coefficient for this study was 0.805 for Chwaka Bay and 0.828 for Menai Bay, which is considered to be significant. Therefore, the ability to accurately discriminate between mangroves, agricultural land, and other vegetation was one of the main hurdles we faced while classifying the Landsat images.
This study encountered several obstacles, including the need to collect ground truth data in muddy and watery mangrove forests, and due to frequent cloud cover in Zanzibar, this study was not able to acquire equal study periods between the years, which are appropriate for comparison purposes. The problem is further exacerbated by cloud and cloud shadow detection algorithms that are not reliable [72]; therefore, more research is needed in this area. Still, other data sources, such as synthetic aperture radar (SAR) which can capture images of the Earth’s surface regardless of smoke, darkness, or cloud cover, can be explored to detect mangrove loss [45]. Moreover, data integration and more sophisticated data fusion techniques will contribute to the measurement and mapping of forest attributes [45]. Finally, error matrices only estimate the classification accuracy using the samples collected from the field; therefore, only biased conclusions can be drawn from such data [45]. Therefore, the measurement of model performance should be tried using other metrics, e.g., balanced accuracy, bias score, Matthew’s Correlation Coefficient, among others [45].

5. Conclusions

Mangroves in the Menai and Chwaka Bays are extremely important. The mangrove forests of Zanzibar serve as “safe” havens for the diversity of plants and animals. In order to map and comprehend the spatial and temporal evolution of mangrove forests, remote sensing has proven to be an invaluable tool. The overall change in the mangrove forests in both bays is about half of what they were in 1973. The annual rate of change in the mangrove forest cover varied over time and space. The primary factors thought to have contributed to the destruction of mangroves in Chwaka Bay and Menai Bay include rampant illegal anthropogenic activities, unsustainable crop cultivation, urban development and infrastructure, weak forest management policies, as well as environmental and climatic changes. The methodology used in this study could avail new insights for guiding mangrove ecosystem conservation and management in Zanzibar.
In the future, research will be carried out to compare the results obtained here with other types of remote sensing data, especially higher resolution datasets and other metrics of accuracy assessment, to monitor mangroves in the study area. The proposed methodology in this research will be applied to forested areas in other regions to advance a more comprehensive monitoring and mapping of the mangrove forest changes across Zanzibar.

Author Contributions

Conceptualization, M.K.M.; methodology, M.K.M.; software, M.K.M.; validation, M.K.M. and E.A.; formal analysis, M.K.M.; investigation, M.K.M.; resources, M.K.M.; data curation, M.K.M.; writing—original draft preparation, M.K.M.; writing—review and editing, M.K.M., E.A. and C.M.J.; visualization, M.K.M.; supervision, E.A. and C.M.J. All authors have read and agreed to the published version of the manuscript.

Funding

This research received no external funding.

Informed Consent Statement

Not applicable.

Data Availability Statement

Not applicable.

Conflicts of Interest

The authors declare no conflict of interest.

References

  1. Spalding, M. World Atlas of Coral Reefs; Choice Reviews Online; University of California Press: Berkeley, CA, USA, 2002; Volume 39, pp. 54–59. [Google Scholar] [CrossRef]
  2. Giri, C.; Ochieng, E.; Tieszen, L.; Zhu, Z.; Singh, A.; Loveland, T.; Masek, J. Status and distribution of mangrove forest of the world using earth observation satellite data. Glob. Ecol. Biogeogr. 2010, 20, 154–159. [Google Scholar] [CrossRef]
  3. Hamilton, S.E.; Casey, D.S. Creation of a high spatiotemporal resolution global database of continuous mangrove forest cover for the 21st Century (CGMFC-21). Glob. Ecol. Biogeogr. 2016, 25, 43–45. [Google Scholar] [CrossRef]
  4. Kirui, B.; Kairo, J.G.; Bosire, J.; Viergever, K.; Rudra, S.; Huxham, M.; Briers, R. Mapping of mangrove forest land cover change along the Kenya coastline using Landsat imagery. Ocean Coast Manag. 2013, 83, 19–23. [Google Scholar] [CrossRef]
  5. Saenger, P. Mangrove Ecology, Silviculture and Conservation. J. Range Manag. 2004, 57, 422. [Google Scholar] [CrossRef]
  6. Nagelkerken, I.; Velde, G.; Gorissen, M.; Meijer, G.; Hof, V.; Hartog, C. Importance of mangroves, seagrass beds and the shallow coral reef as a nursery for important coral reef fishes, using a visual census technique. Estuar. Coast. Shelf Sci. 2000, 51, 31–44. [Google Scholar] [CrossRef]
  7. Kukkonen, M.; Käyhkö, N. Spatio-temporal analysis of forest changes in contrasting land use regimes of Zanzibar, Tanzania. Appl. Geogr. 2014, 55, 193–202. [Google Scholar] [CrossRef]
  8. Mkumbukwa, A. The History of Use and Conservation of Marine Resources in Zanzibar: Nineteenth Century to the Present. Ph.D. Thesis, The University of Bayreuth, Bayreuth, Germany, 2014; pp. 45–97. [Google Scholar]
  9. RGoZ. A Guide to Marine Conservation Areas in Zanzibar; Ministry of Agriculture, Livestock and Environment, Department of Fisheries and Marine Resources: Zanzibar, Tanzania, 2009; pp. 1–27. Available online: https://scuba-do-zanzibar.com (accessed on 14 June 2022).
  10. Dromard, C.; Vaslet, A.; Gautier, F.; Bouchon-Navaro, Y.; Harmelin-Vivien, M.; Bouchon, C. Resource use by three juvenile scarids (Cryptotomus roseus, Scarus iseri, Sparisoma radians) in Caribbean seagrass beds. Aquat. Bot. 2017, 136, 67–69. [Google Scholar] [CrossRef] [Green Version]
  11. Donato, D.; Kauffman, J.; Murdiyarso, D.; Kurnianto, S.; Stidham, M.; Kanninen, M. Mangroves among the most carbon-rich forests in the tropics. Nat. Geosci. 2011, 4, 293–297. [Google Scholar] [CrossRef]
  12. El-Gamal, A. Biological importance of marine algae. Saudi Pharm. J. 2010, 18, 61–68. [Google Scholar] [CrossRef] [Green Version]
  13. Parks, P.; Bonifaz, M. Non-sustainable use of renewable resources: Mangrove deforestation and mariculture in Ecuador. Mar. Resour. Econ. 1994, 9, 31–32. [Google Scholar] [CrossRef]
  14. Duke, N.; Meynecke, J.; Dittmann, A.; Ellison, A.; Anger, K.; Berger, U.; Cannicci, S.; Diele, K.; Ewel, K.; Field, C.; et al. A world without mangroves? Science 2007, 317, 41–42. [Google Scholar] [CrossRef] [Green Version]
  15. Alongi, D. Present state and future of the world’s mangrove forests. Environ. Conserv. 2002, 29, 331–349. [Google Scholar] [CrossRef] [Green Version]
  16. Ellison, J. Vulnerability assessment of mangroves to climate change and sea-level rise impacts. Wetl. Ecol. Manag. 2015, 23, 115–137. [Google Scholar] [CrossRef] [Green Version]
  17. Saunders, F.; Mohammed, S.; Jiddawi, N.; Nordin, K.; Lundèn, B.; Sjöling, S. The changing social relations of a community-based mangrove forest project in Zanzibar. Ocean Coast Manag. 2010, 53, 54–55. [Google Scholar] [CrossRef]
  18. Defries, R.; Rudel, T.; Uriarte, M.; Hansen, M. Deforestation driven by urban population growth and agricultural trade in the twenty-first century. Nat. Geosci. 2010, 3, 40–46. [Google Scholar] [CrossRef]
  19. Leskinen, J.; Pohjonen, V.; Ali, M. Woody Biomass Inventory of the Zanzibar Islands. Commission for Natural Resources, Zanzibar. FTP Rep. 1997, 40, 103–109. [Google Scholar]
  20. Macintosh, D.; Ashton, E. A Review of Mangrove Biodiversity Conservation and Management; Centre for Tropical Ecosystems Research (cenTER Aarhus), University of Aarhus: Aarhus, Denmark, 2002; pp. 39–51. [Google Scholar]
  21. Gao, J. A comparative study on spatial and spectral resolutions of satellite data in mapping mangrove forests. Int. J. Remote Sens. 1999, 20, 2823–2833. [Google Scholar] [CrossRef]
  22. Carle, M.; Wang, L.; Sasser, C. Mapping freshwater marsh species distributions using WorldView-2 high-resolution multispectral satellite imagery. Int. J. Remote Sens. 2014, 35, 76–83. [Google Scholar] [CrossRef]
  23. Gullström, M.; Lyimo, T.; Eklöf, J.; Björk, M.; Sware, I. Socio-ecological and management aspects seagrass meadows in Chwaka Bay. In People, Nature and Research; Wiley: Hoboken, NJ, USA, 2006; pp. 9–28. [Google Scholar]
  24. Eslami-Andargoli, L.; Dale, P.; Sipe, N.; Chaseling, J. Local and landscape effects on spatial patterns of mangrove forest during wetter and drier periods: Moreton Bay, Southeast Queensland, Australia. Estuar. Coast. Shelf Sci. 2010, 89, 14–27. [Google Scholar] [CrossRef] [Green Version]
  25. Garcia, R.; Hedley, J.; Tin, H.; Fearns, P. A method to analyze the potential of optical remote sensing for benthic habitat mapping. Remote Sens. 2015, 7, 4–21. [Google Scholar] [CrossRef] [Green Version]
  26. Hoang, T.; O’Leary, M.; Fotedar, R. Remote-Sensed Mapping of Sargassum spp. Distribution around Rottnest Island, Western Australia, Using High-Spatial Resolution WorldView-2 Satellite Data. J. Coast. Res. 2016, 32, 34–45. [Google Scholar] [CrossRef]
  27. Kovacs, J.; Wang, J.; Blanco-Correa, M. Mapping disturbances in a mangrove forest using multi-date landsat TM imagery. Environ. Manag. 2001, 27, 71–76. [Google Scholar] [CrossRef]
  28. Jia, M.; Wang, Z.; Zhang, Y.; Ren, C.; Song, K. Landsat-based estimation of mangrove forest loss and restoration in Guangxi Province, China, influenced by human and natural factors. Sel. Top. Appl. Earth Obs. Remote Sens. 2015, 8, 78–81. [Google Scholar] [CrossRef]
  29. Leimgruber, P.; Kelly, D.; Steininger, M.; Brunner, J.; Müller, T.; Songer, M. Forest cover change patterns in Myanmar (Burma) 1990–2000. Environ. Conserv. 2005, 32, 98–102. [Google Scholar] [CrossRef] [Green Version]
  30. Heumann, B. Satellite remote sensing of mangrove forests: Recent advances and future opportunities. Prog. Phys. Geogr. 2011, 35, 20–25. [Google Scholar] [CrossRef]
  31. RGoZ. Zanzibar National Forest Resources Management Plan 2008–2020; Department of Commercial Crops, Fruits and Forestry (DCCFF): Zanzibar, Tanzania, 2008; pp. 11–41.
  32. Machiwa, J.; Hallberg, R. Flora and crabs in a mangrove forest partly distorted by human activities, Zanzibar. Ambio 1995, 24, 492–496. [Google Scholar]
  33. RGoZ. Woody Biomass Inventory of Zanzibar Islands: Zanzibar Forestry Development Project; Technical Paper No. 40; Ministry of Agriculture, Livestock and Natural Recourses: Dodoma, Tanzania, 1997; pp. 5–29.
  34. Lubida, A.; Veysipanah, M.; Pilesjo, P.; Mansourian, A. Land-use planning for sustainable urban development in africa: A spatial and multi-objective optimization approach. Geod. Cartogr. 2019, 45, 23–25. [Google Scholar] [CrossRef] [Green Version]
  35. Mchenga, I.; Ali, A.I. A Review of Status of Mangrove Forest in Zanzibar Island, Tanzania. Int. J. Res. Rev. 2015, 2, 518–526. [Google Scholar]
  36. Hamad, H.; Mchenga, I.; Hamisi, M. Status of Exploitation and Regeneration of Mangrove Forests in Pemba Island, Tanzania. Glob. J. Bio-Sci. Biotechnol. 2014, 3, 17–19. [Google Scholar]
  37. Rosa, I.M.D.; Rentsch, D.; Hopcraft, J.G.C. Evaluating Forest Protection Strategies: A Comparison of Land-Use Systems to Preventing Forest Loss in Tanzania. Sustainability 2018, 10, 4476. [Google Scholar] [CrossRef]
  38. Ximenes, A.C.; Cavanaugh, K.C.; Arvor, D.; Murdiyarso, D.; Thomas, N.; Arcoverde, G.F.B.; Bispo, P.D.C.; Van der Stocken, T. A comparison of global mangrove maps: Assessing spatial and bioclimatic discrepancies at poleward range limits. Sci. Total Environ. 2023, 20, 160380. [Google Scholar] [CrossRef]
  39. Bunting, P.; Hilarides, L.; Rosenqvist, A.; Lucas, R.M.; Kuto, E.; Gueye, Y.; Ndiaye, L. Global Mangrove Watch: Monthly Alerts of Mangrove Loss for Africa. Remote Sens. 2023, 15, 2050. [Google Scholar] [CrossRef]
  40. Mangora, M.; Lugendo, B.; Shalli, M. Mangroves of Tanzania; WIOMSA: Zanzibar, Tanzania, 2016; pp. 15–27. Available online: https://www.researchgate.net/publication/310462689_Mangroves_of_Tanzania (accessed on 29 May 2022).
  41. Sustainable Landscapes in Zanzibar; Klein, R.; Käyhkö, J.; The General Character of Unguja Landscape; Käyhkö, N.; Orjala, M.; Mustelin, J. (Eds.) Turku University Department of Geography Publications A: Turku, Finland, 2008; pp. 33–38. [Google Scholar]
  42. Lugomela, C. The Mangrove Ecosystem of Chwaka Bay. People Nat. Res. 2012, 24, 69–81. [Google Scholar]
  43. Shunula, J. Towards Sustainable Utilization of Mangrove Resources in Zanzibar: A Brief Review; Institute of Marine Science, University of Dar es Salaam: Dar es Salaam, Tanzania, 2001; Available online: https://wwwuser.gwdg.de/~izne/mombasa/abstracts/shunula.html (accessed on 16 September 2022).
  44. Abdul Aziz, A.; Phinn, S.; Dargusch, P.; Omar, H.; Arjasakusuma, S. Assessing the potential applications of Landsat image archive in the ecological monitoring and management of a production mangrove forest in Malaysia. Wetl. Ecol. Manag. 2015, 23, 1049–1066. [Google Scholar] [CrossRef]
  45. Jackson, C.; Adam, E. Machine learning classification of endangered tree species in a tropical submontane forest using worldview-2 multispectral satellite imagery and imbalanced dataset. Remote Sens. 2021, 13, 4970. [Google Scholar] [CrossRef]
  46. Kavzoglu, T.; Mather, P. Using feature selection techniques to produce smaller neural networks with better generalization capabilities. In Proceedings of the IGARSS 2000. IEEE 2000 International Geoscience and Remote Sensing Symposium. Taking the Pulse of the Planet: The Role of Remote Sensing in Managing the Environment. Proceedings (Cat. No.00CH37120), Honolulu, HI, USA, 24–28 July 2000; Volume 7, pp. 23–31. [Google Scholar] [CrossRef] [Green Version]
  47. Jia, X.; Richards, J. Segmented principal components transformation for efficient hyperspectral remote-sensing image display and classification. Trans. Geosci. Remote Sen. 1999, 37, 25–27. [Google Scholar] [CrossRef] [Green Version]
  48. Kailath, T. The Divergence and Bhattacharyya Distance Measures in Signal Selection. Trans. Commun. Technol. 1967, 15, 52–60. [Google Scholar] [CrossRef]
  49. Jensen, J. Introductory Digital Image Processing: A Remote Sensing Perspective, 4th ed.; Keith, C.C., Ed.; Prentice Hall Series in Geographic Information Science: Saddle River, NJ, USA, 2005; pp. 136–142. [Google Scholar]
  50. Li, W.; Wang, S.; Kang, W. Feature learning based deep supervised hashing with pairwise labels. Int. Jt. Conf. Artif. Intell. 2016, 16, 24–32. [Google Scholar]
  51. Foody, G. Status of land cover classification accuracy assessment. Remote Sens. Environ. 2002, 80, 185–201. [Google Scholar] [CrossRef]
  52. Jalayer, S.; Sharifi, A.; Abbasi-Moghadam, D.; Tariq, A.; Qin, S. Modeling and predicting land use land cover spatiotemporal changes: A case study in Chalus Watershed, Iran. IEEE J. Sel. Top. Appl. Earth Obs. Remote Sens. 2022, 15, 5496–5513. [Google Scholar] [CrossRef]
  53. Cohen, J. A coefficient of agreement for nominal scales. Educational and Psychological Measurement. Educ. Psychol. Meas. 1960, 20, 43–46. [Google Scholar] [CrossRef]
  54. Pontius, R.; Cheuk, M. A generalized cross-tabulation matrix to compare soft-classified maps at multiple resolutions. Int. J. Geogr. Inf. Sci. 2006, 20, 102–106. [Google Scholar] [CrossRef]
  55. Mohamed, M.K.; Adam, E.; Jackson, C.M. Policy Review and Regulatory Challenges and Strategies for the Sustainable Mangrove Management in Zanzibar. Sustainability 2023, 15, 1557. [Google Scholar] [CrossRef]
  56. Msangameno, D.; Jiddawi, N.; Yahya, S. An update on the status of Mangrove forests in the Western coast of Unguja Island, Tanzania: A rural vs peri-urban comparison. Trop. Ecol. 2017, 58, 23–27. [Google Scholar]
  57. Käyhkö, N.; Fagerholm, N.; Asseid, B.; Mzee, A. Dynamic land use and land cover changes and their effect on forest resources in a coastal village of Matemwe, Zanzibar, Tanzania. Land Use Policy 2021, 28, 26–37. [Google Scholar] [CrossRef]
  58. Othman, W. Social-Ecological Resilience of Pete and Maruhubi Mangrove Ecosystems in Zanzibar, Tanzania. Master’s Thesis, Department of International and Environmental and Development Studies, Norwegian University of Life Sciences, Ås, Norway, 2005; pp. 32–58. Available online: https://nmbu.brage.unit.no/nmbu-xmlui/bitstream/handle/11250/2463277/Jonsson2017.pdf?sequence=1&isAllowed=y (accessed on 19 July 2022).
  59. RGoZ. Towards Integrated Management and Sustainable Development of Zanzibar’s Coast. Initial Findings for an Action Strategy in the Chwaka Bay-Paje Area. 1996; pp. 64–71. Available online: https://aquadocs.org/handle/1834/111 (accessed on 12 August 2022).
  60. RGoZ. 2019/20 Household Budget Survey; Main Report; Office of the Chief Government Statistician. Ministry of Finance and Planning, Zanzibar: Dodoma, Tanzania, 2020; pp. 86–89. Available online: https://www.ocgs.go.tz/php/ReportOCGS/HBS%20Main%20Report_final%2031.12.2020%20printing%20(2).pdf (accessed on 1 January 2022).
  61. Mohammed, S. Saving the Commons: Community involvement in the Management of Mangrove and Fisheries Resources of Chwaka Bay, Zanzibar. West. Indian Ocean. J. Mar. Sci. 2004, 3, 34–37. [Google Scholar] [CrossRef]
  62. Saunders, F. The Politics of People: Not Just Mangroves and Monkeys: A Study of the Theory and Practice of Community-Based Management of Natural Resources in Zanzibar. Ph.D. Thesis, Södertörn University, Huddinge, Sweden, 2011; pp. 6–43, ISSN 1652-7399. Available online: https://www.researchgate.net/publication/277096335_The_Politics_of_People_-_Not_Just_Mangroves_and_Monkeys_A_study_of_the_theory_and_practice_of_community-based_management_of_natural_resources_in_Zanzibar (accessed on 11 August 2022).
  63. URT. Population and Housing Census. Population Distribution by Administrative Areas; Zanzibar Print Press: Zanzibar, Tanzania, 2022; Volume 2, pp. 23–36. Available online: https://www.nbs.go.tz/index.php/en/census-surveys/population-and-housing-census?start=10 (accessed on 17 December 2022).
  64. WB. Towards More Inclusive Zanzibar Economy, Zanzibar Poverty Assessment 2022; International Bank for Reconstruction and Development/The World Bank: Washington, DC, USA, 2022; pp. 5–82. Available online: https://documents1.worldbank.org/curated/en/099755011022231706/pdf/P1753400df8a050240810307f8599187b46.pdf (accessed on 9 January 2023).
  65. FAO. Global Forest Resources Assessment 2010; Annual Report; FAO Forestry Paper; Forestry Economics and Policy Division, FAO: Rome, Italy, 2010; pp. 64–68. ISBN 9251066546. Available online: https://www.fao.org/publications/card/en/c/e4fa9d60-5207-5a96-976c-cd2e6f3519a5/ (accessed on 30 August 2022).
  66. IUCN. Nature Conservancy. Global Assessments of Mangrove Losses and Degradation. Information Brief. 2021; pp 1–4. Available online: https://oceanwealth.org/wp-content/uploads/2019/02/MANGROVELOSS-BRIEF-4pp-25.10.high_.pdf (accessed on 6 August 2022).
  67. Benjaminsen, G. The bricolage of REDD+ in Zanzibar: From global environmental policy framework to community forest management. J. East. Afr. Stud. 2017, 11, 71–76. [Google Scholar] [CrossRef]
  68. Quinn, C.; Stringer, L.; Berman, R.; Le, H.; Msuya, F.; Pezzuti, J.; Orchard, S. Unpacking changes in mangrove social-ecological systems: Lessons from Brazil, Zanzibar, and Vietnam. Resources 2017, 6, 39–44. [Google Scholar] [CrossRef] [Green Version]
  69. Shunula, J. Public awareness, key to mangrove management and conservation: The case of Zanzibar. Trees 2002, 16, 61–63. [Google Scholar] [CrossRef]
  70. Anderson, J. A Land Use and Land Cover Classification System for Use with Remote Sensor Data; US Government Printing Office: Washington, DC, USA, 1976; Volume 964, pp. 27–121.
  71. Thomlinson, J.; Bolstad, P.; Cohen, W. Coordinating methodologies for scaling land cover classifications from site-specific to global: Steps toward validating global map products. Remote Sens. Environ. 1999, 70, 16–28. [Google Scholar] [CrossRef]
  72. Masiliūnas, D. Evaluating the Potential of Sentinel-2 and Landsat Image Time Series for Detecting Selective Logging in the Amazon, Thesis Report GIRS-2017-27. Master’s Thesis, Wageningen University and Research, Wageningen, The Netherlands, 2017. Available online: https://edepot.wur.nl/426144 (accessed on 18 August 2022).
Figure 1. Location of Chwaka Bay and Menai Bay in Unguja, Zanzibar.
Applsci 13 07962 g001
Figure 2. Mean spectral response—extracted from the Landsat OLI imagery—of land-cover and land-use classes in the Chwaka and Menai study areas.
Applsci 13 07962 g002
Figure 3. Classified land use and land cover maps for the years 1973, 1990, 1995, 2000, 2009, and 2020—Chwaka bay, Unguja, Zanzibar.
Applsci 13 07962 g003
Figure 4. Percentage coverage of land use and land cover in Chwaka bay in 1973, 1990, 1995, 2000, 2009, and 2020; W—water, OF—other forests, MF—mangrove forest, BL—bare land, and A—agriculture. Error bars are 95% confidence intervals.
Applsci 13 07962 g004
Figure 5. Classified land use and land cover maps for the years 1973, 1990, 1995, 2000, 2009, and 2020—Menai Bay, Unguja, Zanzibar.
Applsci 13 07962 g005
Figure 6. Percentage coverage of land use and land cover in Menai Bay in 1973, 1990, 1995, 2000, 2009, and 2020); W—water, OF—other forests, MF—mangrove forest, BL—bare land, and A—agriculture. Error bars are 95% confidence intervals.
Applsci 13 07962 g006
Figure 7. Mangrove forest loss/gain (ha) from 1973 to 2020, Chwaka Bay in Unguja, Zanzibar.
Applsci 13 07962 g007
Figure 8. The dynamics of mangrove forests along the coast of Chwaka Bay in Unguja, Zanzibar from 1973 to 2020.
Applsci 13 07962 g008
Figure 9. Mangrove forest loss and gain (ha) from 1973 to 2020, Menai Bay in Unguja, Zanzibar.
Applsci 13 07962 g009
Figure 10. The dynamics of mangrove forests along the coast of Menai Bay in Unguja, Zanzibar from 1973 to 2020.
Applsci 13 07962 g010
Table 1. Remote sensing data used to analyze the patterns and dynamics of mangroves in Chwaka Bay and Menai Bay, Zanzibar.
LandsatGoogle EarthTopographical MapsAerial Data
YearBandsLandsat TypeSensorResolution (m)YearResolution (m)YearScaleYearResolution (m)
19731–4Landsat 1MSS60------198210,00019755
19901–5, 7Landsat 5TM30------19901:950019915
19951–5, 7Landsat 5TM30------19961:750019963
20001–5, 7Landsat 7ETM+30------20011:750020013
20091–5, 7Landsat 7ETM+3020100.320101:750020103
20201–7Landsat 8OLI3020200.320201:250020170.5
Table 2. Spectral separability as calculated by TD index (Equation (2)) and J-M distance (Equation (3)); W—water, OF—other forests, MF—mangrove forest, BL—bare land, and A—agriculture.
MSS (1973)TM (1990)TM (1995)ETM+ (2000)ETM+ (2009)OLI (2020)
LULC PairsTD IndexJ-M DistanceTD IndexJ-M DistanceTD IndexJ-M DistanceTD IndexJ-M DistanceTD IndexJ-M DistanceTD IndexJ-M Distance
W/OF1.901.911.971.981.991.982.002.002.002.002.002.00
W/MF1.931.931.971.972.002.002.002.002.002.002.002.00
W/BL1.911.981.982.002.002.002.002.002.002.002.002.00
W/A1.911.901.991.982.002.002.002.002.002.002.002.00
OF/MF1.361.341.891.871.961.901.961.911.951.901.991.92
OF/BL1.751.741.911.981.991.992.002.002.002.002.002.00
OF/A1.501.451.891.901.901.891.921.831.921.831.941.85
MF/BL1.881.851.891.871.992.002.002.001.992.002.002.00
MF/A1.881.861.901.891.991.992.002.002.002.002.002.00
BL/A1.841.821.831.801.971.921.981.971.981.971.981.98
Table 3. Pairwise correlations between Landsat bands for the scene covering Chwaka Bay and Menai Bay in Unguja, Zanzibar.
Band 1Band 2Band 3Band 4Band 5Band 6Band 7
Band 1-----0.990.980.990.680.790.90
Band 2 -----0.980.990.660.780.89
Band 3 -----0.990.780.870.92
Band 4 -----0.710.820.93
Band 5 -----0.960.87
Band 6 -----0.96
Band 7 -----
Table 4. The overall accuracies and kappa coefficients for Chwaka Bay and Menai Bay in Unguja, Zanzibar.
Chwaka BayMenai Bay
Ground DataClassification ResultsOverall AccuracyKappa Coefficients Ground DataClassification ResultsOverall AccuracyKappa Coefficients
197316014282.5%0.72197316013885.5%0.77
199016013685.4%0.76199016014185.5%0.77
199516013686.6%0.79199516013485.4%0.78
200016014689.3%0.81200016014993.1%0.87
200916013991.7%0.86200916014191.0%0.88
202016015392.7%0.89202016015694.5%0.90
Disclaimer/Publisher’s Note: The statements, opinions and data contained in all publications are solely those of the individual author(s) and contributor(s) and not of MDPI and/or the editor(s). MDPI and/or the editor(s) disclaim responsibility for any injury to people or property resulting from any ideas, methods, instructions or products referred to in the content.

