Article

Development and Application of a Microsurfacing Mix Design Method to Assess the Influence of the Emulsion Type

by
Caroline F. N. Moura
1,
Joel R. M. Oliveira
1,
Hugo M. R. D. Silva
1,*,
Carlos A. O. F. Palha
2 and
Cesare Sangiorgi
3
1
Department of Civil Engineering, Institute for Sustainability and Innovation in Structural Engineering, University of Minho, 4800-058 Guimaraes, Portugal
2
Department of Civil Engineering, University of Minho, 4800-058 Guimaraes, Portugal
3
Department of Civil, Chemical, Environmental, and Materials Engineering, University of Bologna, 33-40126 Bologna, Italy
*
Author to whom correspondence should be addressed.
Appl. Sci. 2023, 13(13), 7925; https://doi.org/10.3390/app13137925
Submission received: 14 June 2023 / Revised: 30 June 2023 / Accepted: 2 July 2023 / Published: 6 July 2023

Abstract

:
Microsurfacing asphalt mixtures are a preventive maintenance technology comprising the application of a slurry (produced with a modified asphalt emulsion), aggregate, filler, and water on top of an existing pavement at ambient temperature. Although it is a widely used technology, further studies on the mix design procedures are necessary to ensure an adequate composition. Thus, this study contributes to developing an improved mix design procedure for microsurfacing asphalt mixtures. Different mixtures were prepared, and the influence of the type and amount of asphalt emulsion and the amount of added water and filler (cement) on the characteristics of the mixture were evaluated. Two preliminary tests, referred to as the “pizza test” and the “ball test”, were proposed to determine the initial proportions of added water and cement in the mixture, respectively. Then, consistency, cohesion, and shaking abrasion tests were performed to determine the optimum content of each component and evaluate their influence on the mixture characteristics. The results showed that these tests are essential to optimize the mix composition, even though it was found that the mix design of microsurfacings is a complex task because the mixture is a system with chemical interactions strongly influenced by its composition.

1. Introduction

Cold mix asphalt (CMA) combines unheated aggregates, mineral fillers, and bitumen emulsion to produce flexible pavement materials. This technology allows the manufacture of mixtures at ambient temperatures without heating vast amounts of aggregates and bitumen, decreasing CO2 emissions and saving energy and thereby playing a fundamental role in developing sustainable and ecological pavements [1,2,3]. Therefore, they are gaining popularity, including in recycling work [4], due to their low environmental impact and high sustainability compared with hot paving technologies.
Microsurfacing asphalt mixtures can be described as a cold mix technology for preventive paving maintenance, which involves the application of a combination of polymer-modified asphalt emulsion, well-graded fine aggregate, mineral filler (usual cement), water, and chemical additives (if any) at ambient temperature [5,6,7,8]. Extensive studies conducted by the Texas Transportation Institute (TTI) have confirmed the effectiveness of microsurfacing as a valuable method for preventative maintenance and pavement preservation, leading to a substantial increase in the service life of existing pavements. However, it is essential to note that while microsurfacing extends pavement life successfully by three to four years, its ability to reduce long-term cracking is somewhat limited. Nevertheless, microsurfacing guarantees the provision of a functional and long-lasting pavement surface. The same transportation institute highlighted the crucial role of careful project selection in successfully implementing microsurfacing. Although microsurfacing has proven effective in addressing issues such as rutting, bleeding, loss of surface friction, oxidation, and raveling, its effectiveness may be constrained when it is applied to pavement with structural deficiencies [9,10].
They are a usual solution for pavement maintenance, acting as a protective surface course that can address issues related to skid resistance, raveling, or oxidation on structurally sound pavements, improving the road surface characteristics [5,11,12]. Microsurfacing is also employed to correct the shape or profile rutted wheel paths and obtain a faster traffic opening [13], with a 40% reduction in the number of original rutting and substantial increases in the friction characteristics of the pavement being reported in previous works [14]. In addition, since this technology requires fewer material resources, is cold-produced, and laid at a low thickness, it has a low cost, short construction period, and rapid traffic opening [15,16].
Lonbar and Nazirizad [17] stated that microsurfacing is generally classified as a preventative instead of a corrective maintenance treatment due to the significant ability of microsurfacing to seal and restore pavement surfaces. According to Broughton, Lee [14], the first step to effectively using microsurfacing when treating existing flexible pavements is to ensure the pavement is structurally sound and appropriately prepared to accept the treatment. However, Gransberg [18] alleged that microsurfacing is a technique for preventive, routine, and corrective conservation; this flexibility was justified because it is a thin coating that can be placed in a thickness of two to three times the size of the mixture’s largest aggregates.
According to Dash and Panda [3], cold mix technologies present several advantages, including energy-saving, the inexistence of harmful gas emissions, and facilitated application in varying climatic conditions. However, it lags far behind in research and applications. The authors stated that, unlike the hot mix design, a universally accepted cold mix design procedure is still not established. The laboratory procedures followed by different researchers/agencies vary widely regarding compaction methods, curing conditions, and other mixing procedures for evaluating relevant engineering properties.
The same situation occurs with microsurfacing. In contrast to the conventional methods used for hot mix asphalt, the mix design of microsurfacing mixtures is complicated because it is a chemical system with several variables, including the type and content of asphalt emulsion, types and gradation of aggregates, water, and filler content, which affect the final properties of the mixtures [5,19,20]. Emulsion characteristics play a pivotal role in ensuring the workability and durability of microsurfacing, contributing to its final behavior. The emulsion’s properties mainly depend on the design of the components selected for its production, like emulsifier type and dosage, acid content, binder grade and content, and polymer modifier type, and dosage [21]. In addition, the consistency and adhesion between aggregates and bitumen depend on the mineralogical composition of the aggregates. Consequently, each specific composition of aggregates and asphalt emulsion has unique chemical properties that affect the bond between the aggregate and bitumen emulsion [6,12].
Another essential parameter affecting the microsurfacing mix design is the filler type and amount, which contribute significantly to the breaking and curing process due to the large surface area [21]. The mixtures typically contain 0–3% mineral filler, usually Portland cement. This component significantly influences the microsurfacing’s performance, as the filler–mastic interaction critically affects the mixture cohesion [5,22]. Regarding water, its addition improves the workability of the mixture, and its primary purpose is to wet, dissolve and adhere to other components, and moderate the chemical reaction [5,12]. The optimum amount of water must be determined because a lack of water leads to the weak coating of aggregates and hardening of the mixture, and excessive water content can lead to the separation of aggregates or lengthen the mixture’s curing time [6].
As each component of the microsurfacing mixture interacts with the other components to form a chemically complex compound, the amount and type of asphalt emulsion, cement, and water have a significant influence on the test results used to design the microsurfacing mixture [19,21,23]. Therefore, Gransberg [18] stated that the primary mix design objectives of microsurfacing are ensuring good compatibility among the mixture ingredients and satisfying the strength and durability parameters.
Thus, several mix design guidelines have been developed for an optimum job mix formula. The International Slurry Surfacing Association (ISSA), the Texas Transportation Institute (TTI), the American Society for Testing and Materials (ASTM), and the California Department of Transportation (Caltrans) developed microsurfacing mix design procedures, and the ISSA’s guidelines are the most accepted and used worldwide. Similar standards have also been developed in the European Union and South Africa to support the design of slurry and microsurfacing materials [5,19,20,23,24].
However, various researchers have reported difficulties when using the existing mix design procedures, namely the repeatability and reproducibility of test results and poor correlation between field and laboratory results [5]. Some authors, like Robati and Carter [19] and Kumar and Ryntathiang [25], have evaluated the ISSA method for microsurfacing mix design. They have concluded that modification to the current mix design procedure might be necessary to enhance reproducibility and provide successful mix designs on the basis of performance-related tests in the design method. Thus, the microsurfacing mix design methodologies described by the ASTM and ISSA should be used only as a guide [25].
Therefore, this work aimed to significantly contribute to developing an improved mix design method for microsurfacing mixtures that also included test methods from the European standards [26,27,28]. The method was also applied to study the influence of the type and amount of asphalt emulsion, filler (cement), and added water content on the composition and characteristics of a specific microsurfacing mixture. This paper is the result of an interlaboratory study of the working group TG2 (Cold bitumen emulsion mixtures) of RILEM’s Technical Committee 280-CBE: multiphase characterization of cold bitumen emulsion materials.

2. Materials and Methods

2.1. Materials

Microsurfacings are mixtures comprising an asphalt emulsion, aggregates, filler, and water. According to Bhargava et al. [5], as microsurfacing performance is significantly influenced by the materials’ quality, understanding the behavior and parameters that affect the properties of each component is fundamental to ensuring the mixture’s durability.
The materials used in this project were a 0/6 mm basalt aggregate, Portland cement as filler, two types of modified asphalt emulsion from different origins (emulsion C65BP4, named Emulsion 1, and emulsion C60BP4, named Emulsion 2), and water to increase the workability of the mixture.

2.2. Structure of the Microsurfacing Mix Design Method Proposed in This Work

The present work proposes a new procedure for a microsurfacing mix design based on tests developed according to a set of European Standards for slurry surfacing. Figure 1 presents the flowchart of the mix design procedure proposed in this work.
In the first step, two preliminary tests, developed by the RILEM TC 280-CBE, were carried out to determine the cement and added water content. Subsequently, the consistency test (EN 12274-3) was performed to confirm the amount of added water in the mixture. Finally, the cohesion test (EN 12274-4) was performed to identify the ideal relationship between the amount of added water, cement, and emulsion. In the end, the shaking abrasion test (EN 12274-7) was performed to determine the water sensitivity of the mixtures.
The present work produced two mixtures, one with Emulsion 1 and one with Emulsion 2, for each test. Thus, the microsurfacing mixtures were always produced using the same type of aggregate and cement, varying the amounts of the asphalt emulsion, added water, and cement. For mixture preparation, the dry aggregate amount was considered a reference for the amount of asphalt emulsion (typically between 10% and 15%), added water (typically around 10%), and cement (typically between 2% and 3%), i.e., the percentage of these materials in each mixture was always defined considering the mass of aggregate as 100%.

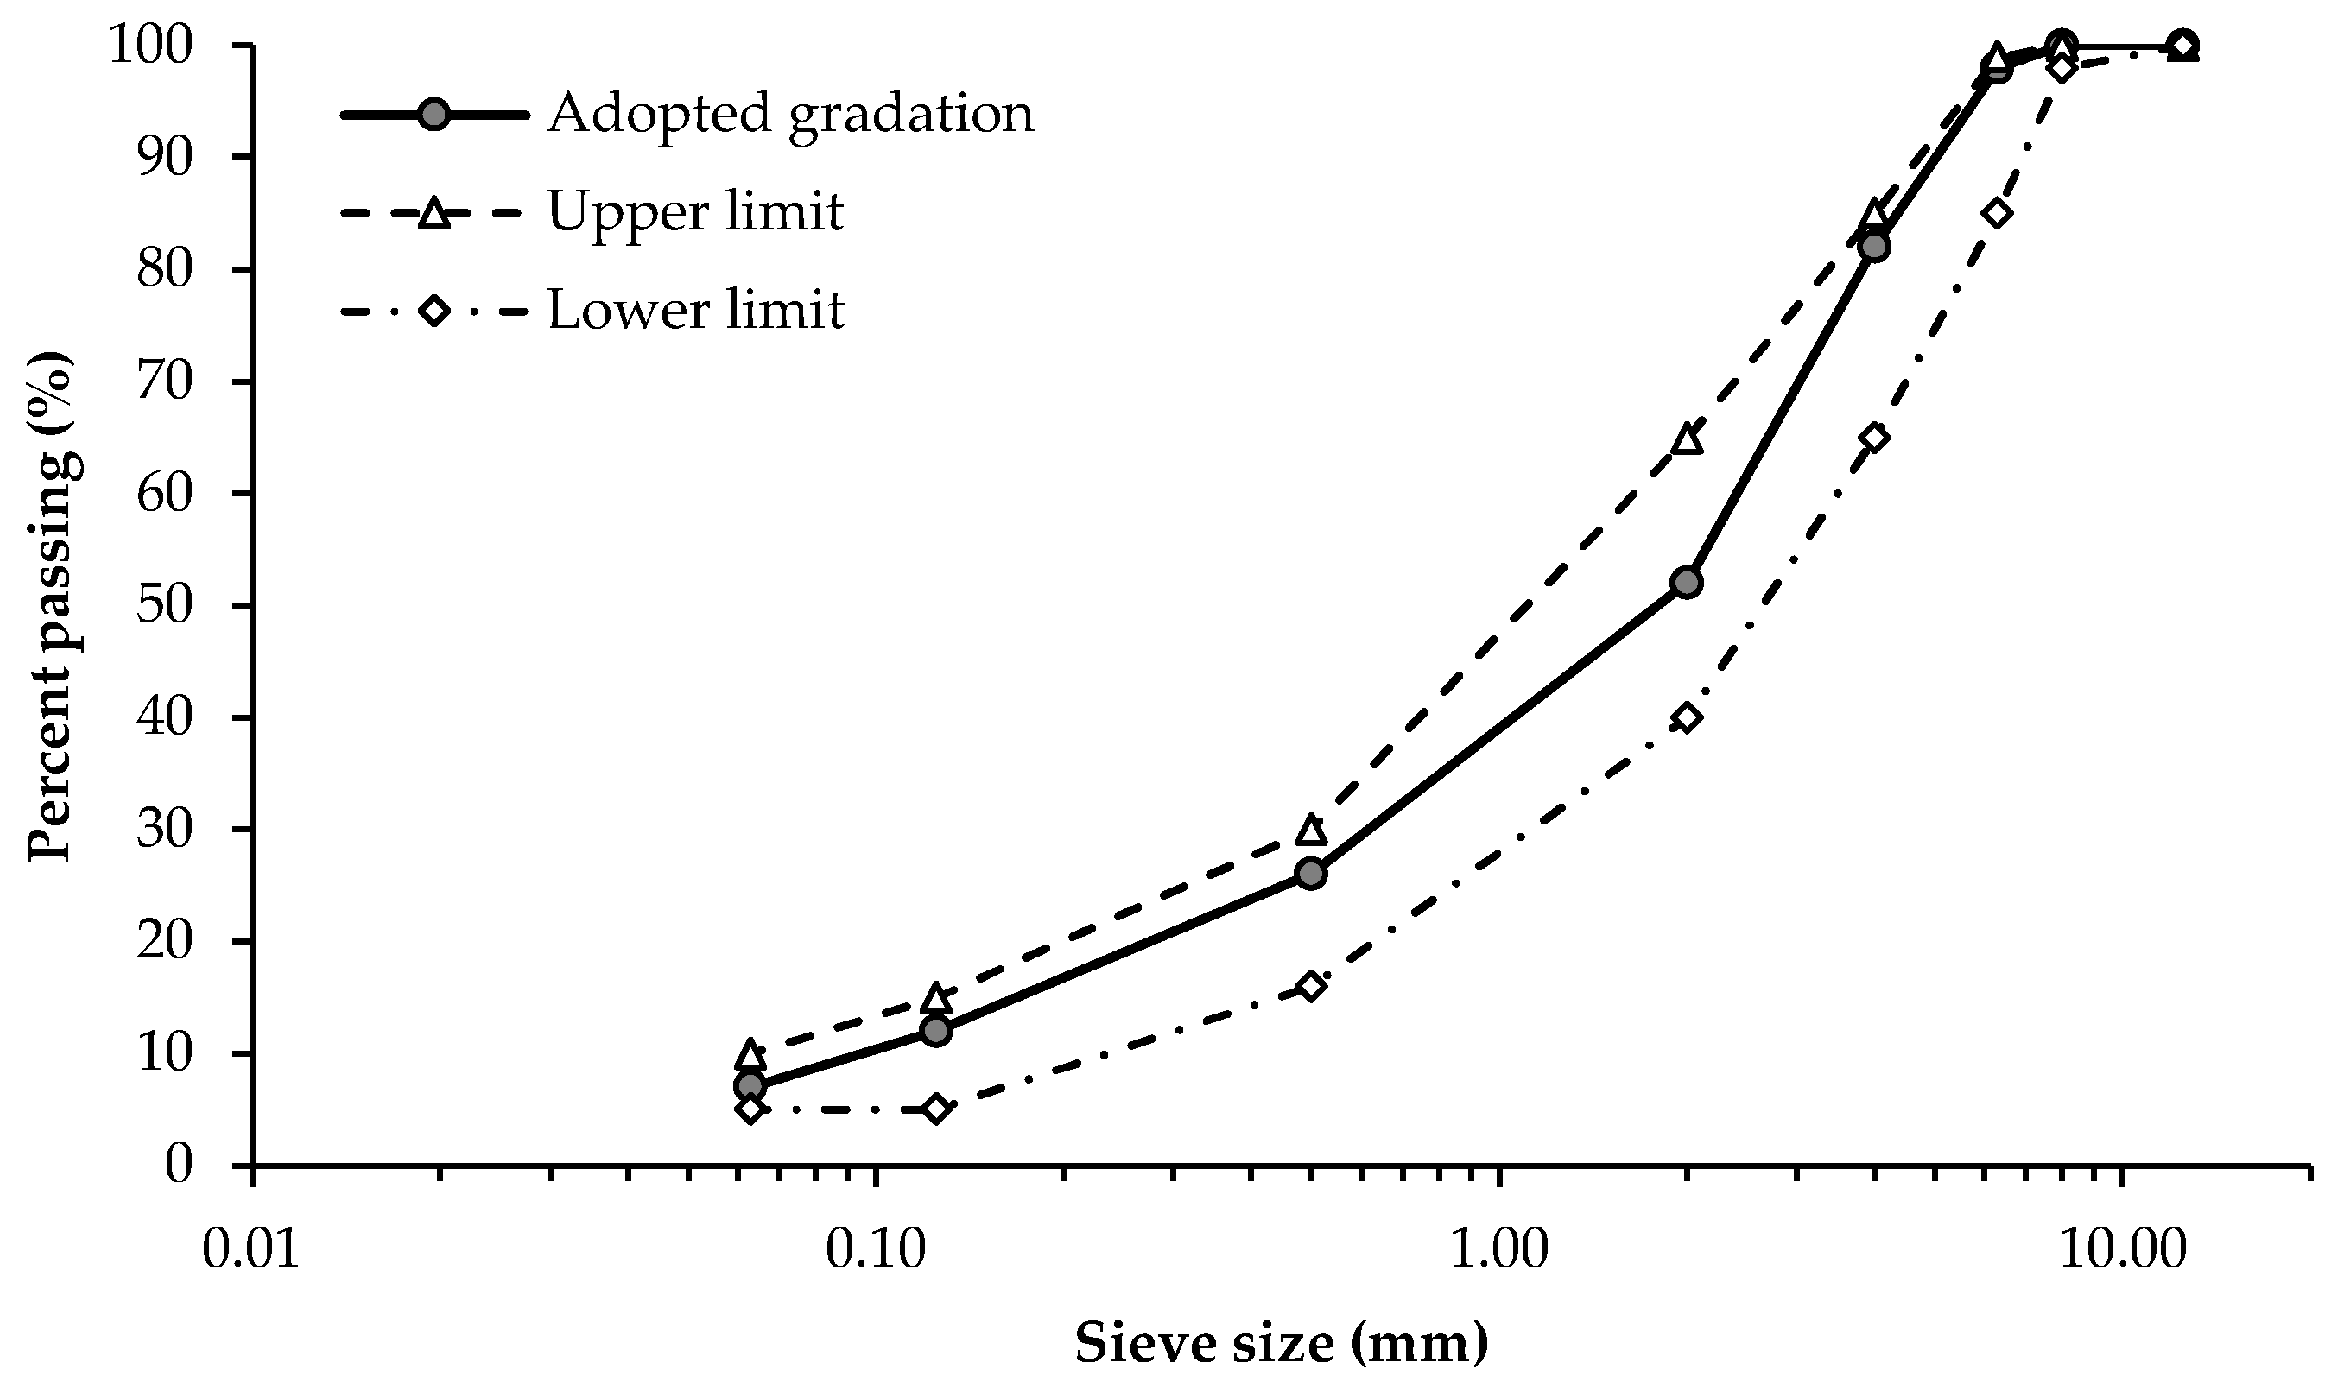
2.3. Characterization of Aggregates Used in Microsurfacing Mixtures

The aggregates used in pavement surface courses must comply with the European Standard EN 13043 requirements, which specify the properties and test methods suitable for their characterization. Tests were carried out for particle size distribution, wear resistance, density, water absorption, and aggregate-binder affinity to better understand the aggregates’ properties and their behavior in the manufacturing of the mixture.
The particle size distribution of the selected aggregates was determined following the EN 933-1 standard to verify whether they fulfilled the Portuguese Specifications of Infraestruturas de Portugal [29]. The test was carried out with samples of 0/6 mm aggregate collected using the quartering method. Initially, the samples were dried in an oven at 110 °C for 24 h. After drying, the samples were weighed and placed in the sieve column with a larger opening of 10 mm and a smaller opening of 0.063 mm.
The aggregate particles’ resistance to wear was tested by abrasion in a wet environment, as specified by the European Standard EN 1097-1, and was expressed by the micro-Deval (MDE) coefficient. The MDE coefficient was determined as a function of the portion of the original 500 g sample reduced to a size of less than 1.6 mm after a wear period of 120 min. The test measured the aggregate’s wear produced by an abrasive load inside a rotating drum with water.
The affinity of the specific basaltic aggregate used in this work to both asphalt emulsions in this study was tested following EN 12697-11. The amount of emulsion added was adjusted to use the same residual binder amount mentioned in the standard, and after mixing the emulsion with the 8/11 aggregate fraction, the mixture was spread and maintained on a watch glass for 24 h curing. Using the same procedure for both emulsions made it possible to know the potential bonding efficiency between the basaltic aggregate and each emulsion used in the microsurfacing mixture. Furthermore, the density and water absorption of the aggregates were determined according to the EN 1097-6 standard.

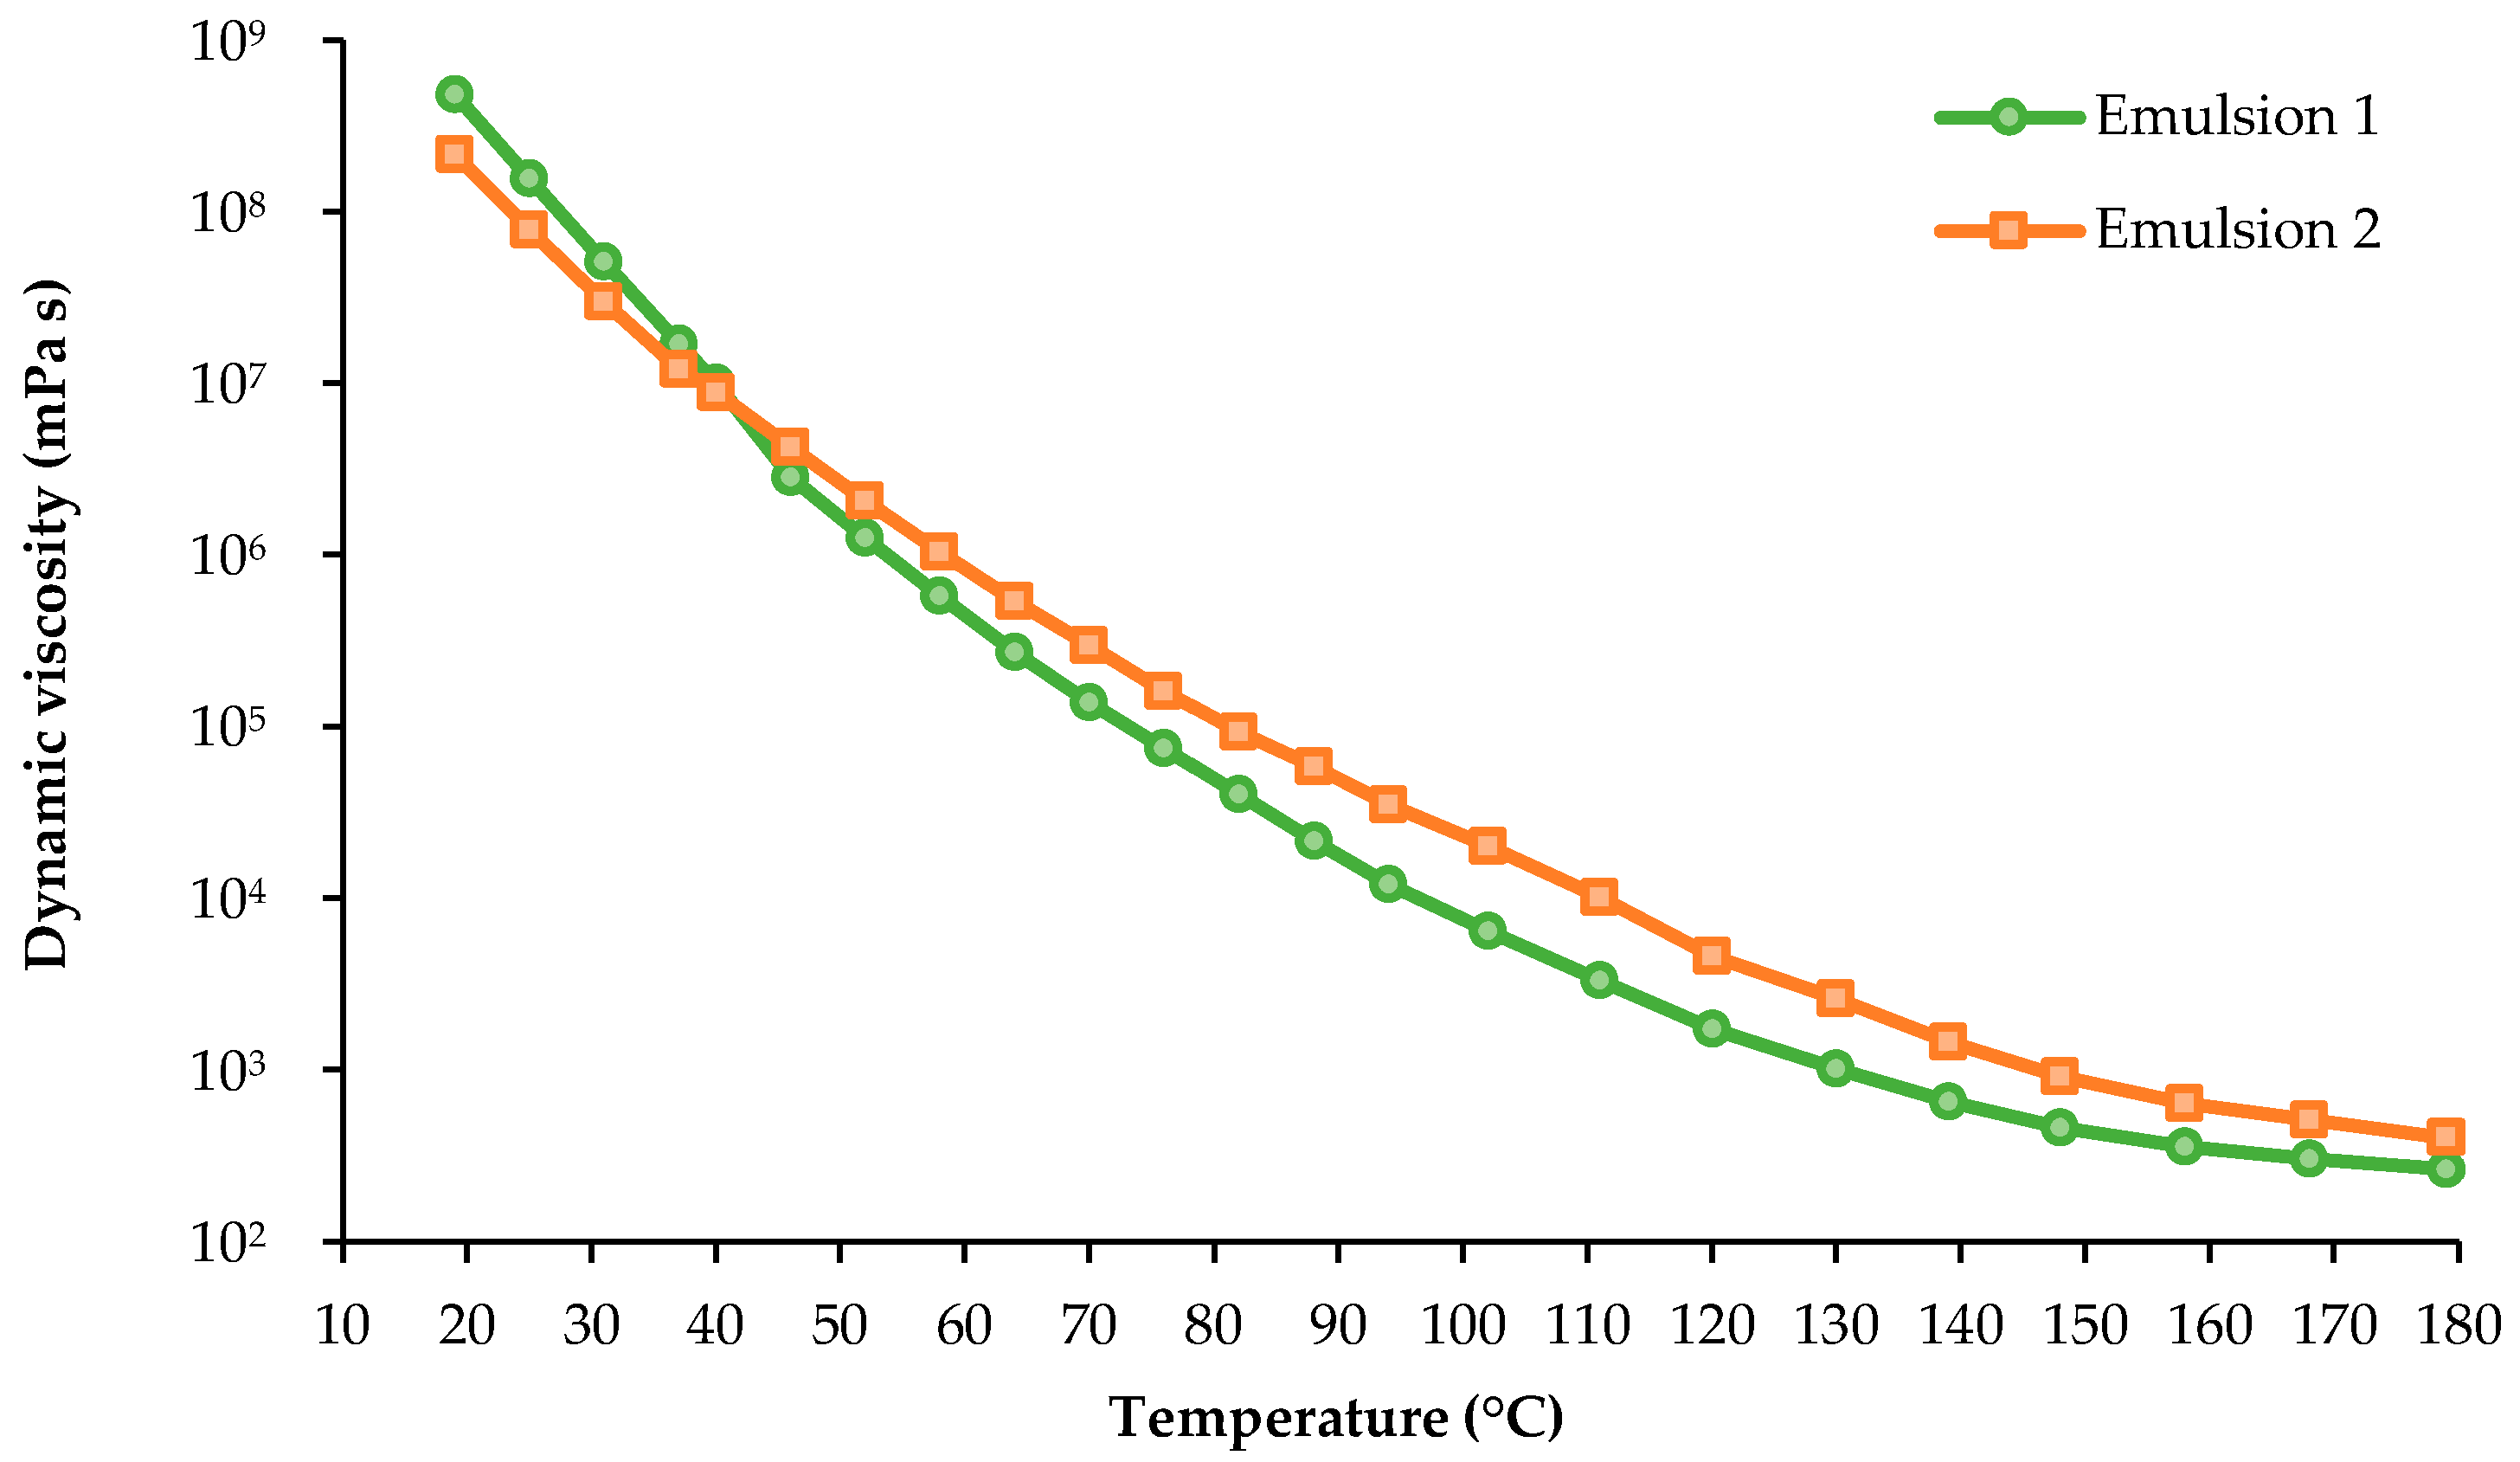
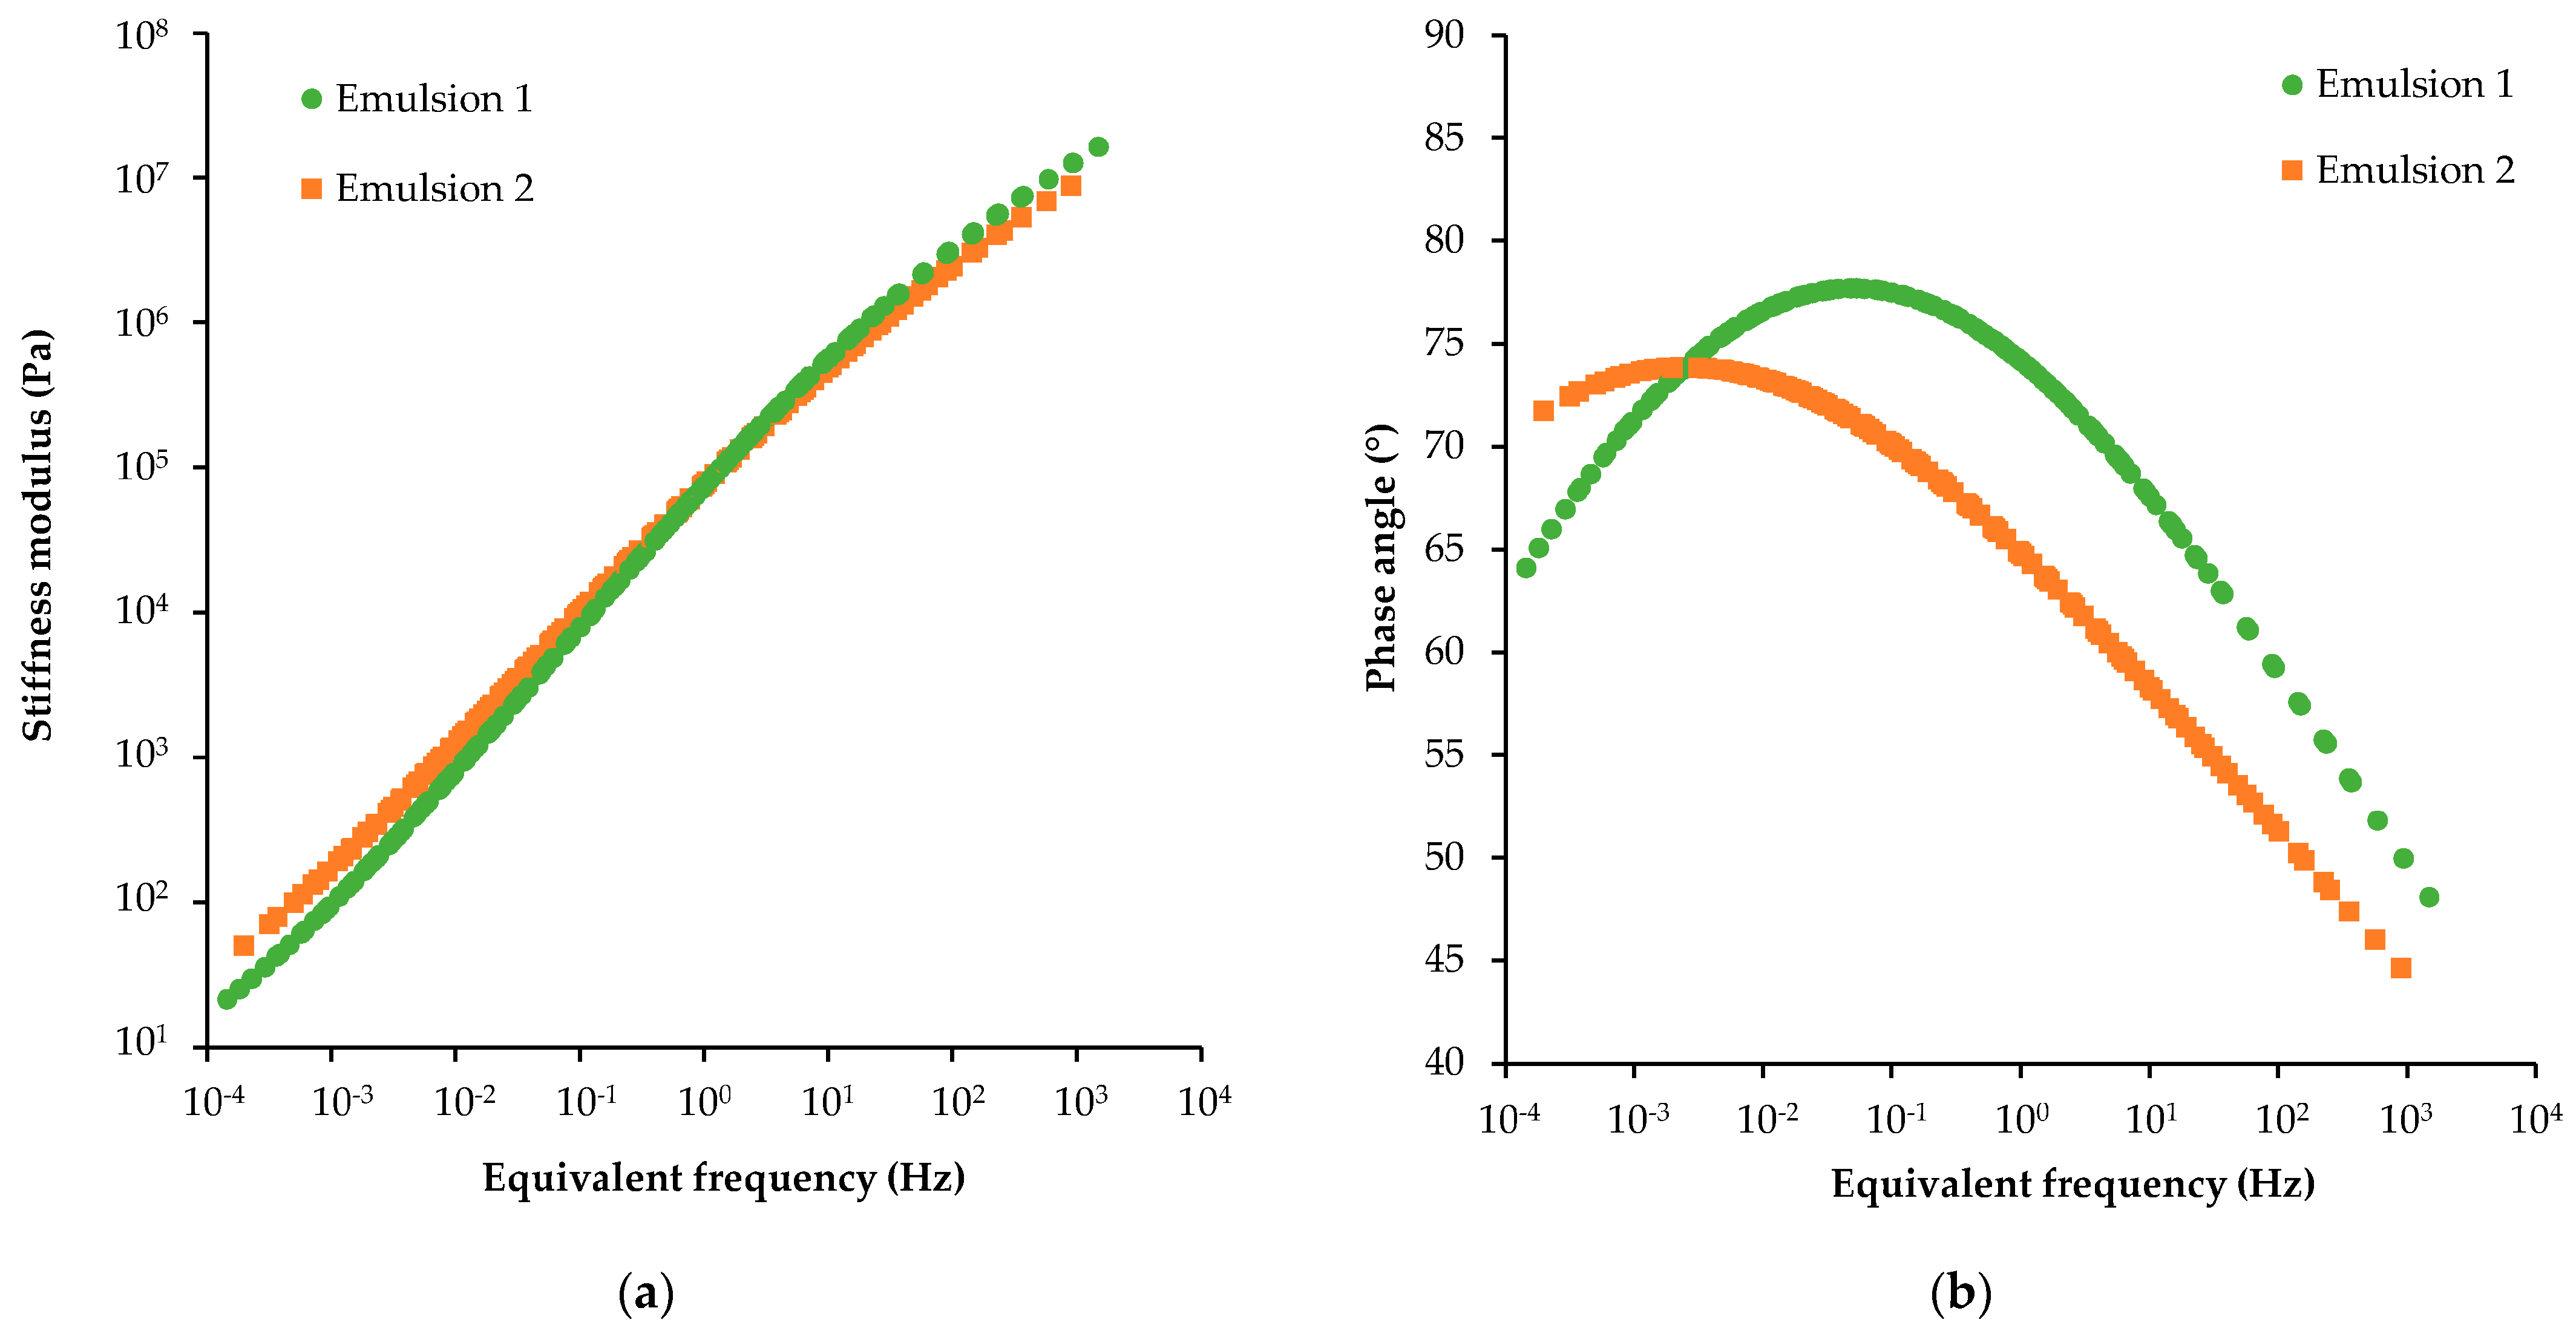
2.4. Characterization of Asphalt Emulsions Used in Microsurfacing Mixtures

This project used two types of polymer-modified asphalt emulsions (C60BP4 and C65BP4) produced in Italy with a class 4 breaking value, the first with 60% ± 2% and the latter with 65% ± 2% residual binder. The Portuguese Specifications [29] consider these emulsions adequate for microsurfacings.
The breaking value of the emulsion was determined following the EN 13075-1 standard. A reference filler was added to a specified amount of cationic asphalt emulsion at a uniform rate with constant agitation in a specific apparatus. When the emulsion broke down completely, the amount of filler added was determined by weighing, and the break index value corresponds to the filler mass (in grams) multiplied by 100 and divided by the amount of emulsion (in grams).
The emulsion adhesion test was based on the European Standard EN 13614. Initially, 200 g of aggregate was weighed, washed, and left in an oven at 110 °C for 2 h. Subsequently, the aggregates were added to the emulsion, which contained 10 g of residual binder, and mixed with a spatula. The mixture was then spread on a tray lined with parchment paper and put in an oven at 60 °C for 24 h. Then, the mixture was transferred to a 300 mL water glass beaker at 60 °C and returned to the oven at 60 °C for 24 h. Finally, the surface of the emulsion-coated aggregate was evaluated.
The procedure specified in the EN 13074-1 standard was used to recover the binder of each emulsion. According to this standard, recovery involves evaporating all the water in the emulsion, leaving only the binder. The procedure consisted of spreading a known mass of emulsion on a tray lined with parchment paper and exposing the tray with the emulsion at room temperature under standard laboratory conditions for 24 h. After this, the tray was placed in an oven at 50 °C for another 24 h. At the end of this period, the tray was removed from the oven and allowed to cool until it reached room temperature, and then all residual binder was collected from the tray.
After the binder recovery, to evaluate which properties could influence the microsurfacing mixtures, wide-ranging binder characterization tests were carried out, such as penetration at 25 °C (EN 1426), softening point temperature determined by the ring and ball method (TR&B) (EN 1427), dynamic viscosity (EN 13302), cohesion energy by force ductility at 5 °C (EN 13589), elastic recovery at 25 °C (EN 13398), and determination of the complex shear modulus on the dynamic shear rheometer (EN 14770). The rheology tests were performed in the linear viscoelastic regime using an 8 mm plate with a 2 mm gap at temperatures below 30 °C and a 25 mm plate with a 1 mm gap at higher temperatures.

2.5. Preparation of Microsurfacing Mixtures

According to Destrée et al. [16], when comparing different test methods of the EN 12274 standards, the mixing procedure description is not always the same, and it is not sufficiently detailed. Regarding the standards used in this work, only standard EN 12274-7 describes the preparation sequence of the mixture. Thus, this study proposed a mixing procedure that determined the addition sequence of each material to be used in all tests where the standard does not determine the procedure for the mixture preparation.
The mixture preparation started with the sieving of the aggregates in a 2 mm sieve to separate the coarse material (over 2 mm) from the fine material passing through the sieve (Figure 2a). These materials were added to the mixture at different times. The experimental procedure showed that adding separate fractions of aggregates and the total amount of water in two phases of the mixture preparation made it more consistent without excess water. Regarding the asphalt emulsion, its storage container was inverted for at least one day before its use and shaken until its contents were well mixed to ensure adequate homogeneity.
The mixtures were always prepared using the same procedure. First, 52% of the aggregates (the fine fraction) were placed in a bowl, and half the amount of water defined was added (Figure 2b), mixing until all the aggregates were homogeneously wet. Then, the defined amount of cement was added and mixed homogeneously (Figure 2c).
Subsequently, the other 48% of the aggregates (coarse part) were added (Figure 3a), together with the remaining water that would complete the predefined water content, mixing continuously until the mixture was homogeneous. Finally, the amount of emulsion defined for each mixture was added (Figure 3b), and the resulting microsurfacing material was obtained, as shown in Figure 3c. The added percentage of fine and coarse aggregates was defined according to the particle size distribution of the aggregates specified for microsurfacing mixtures.

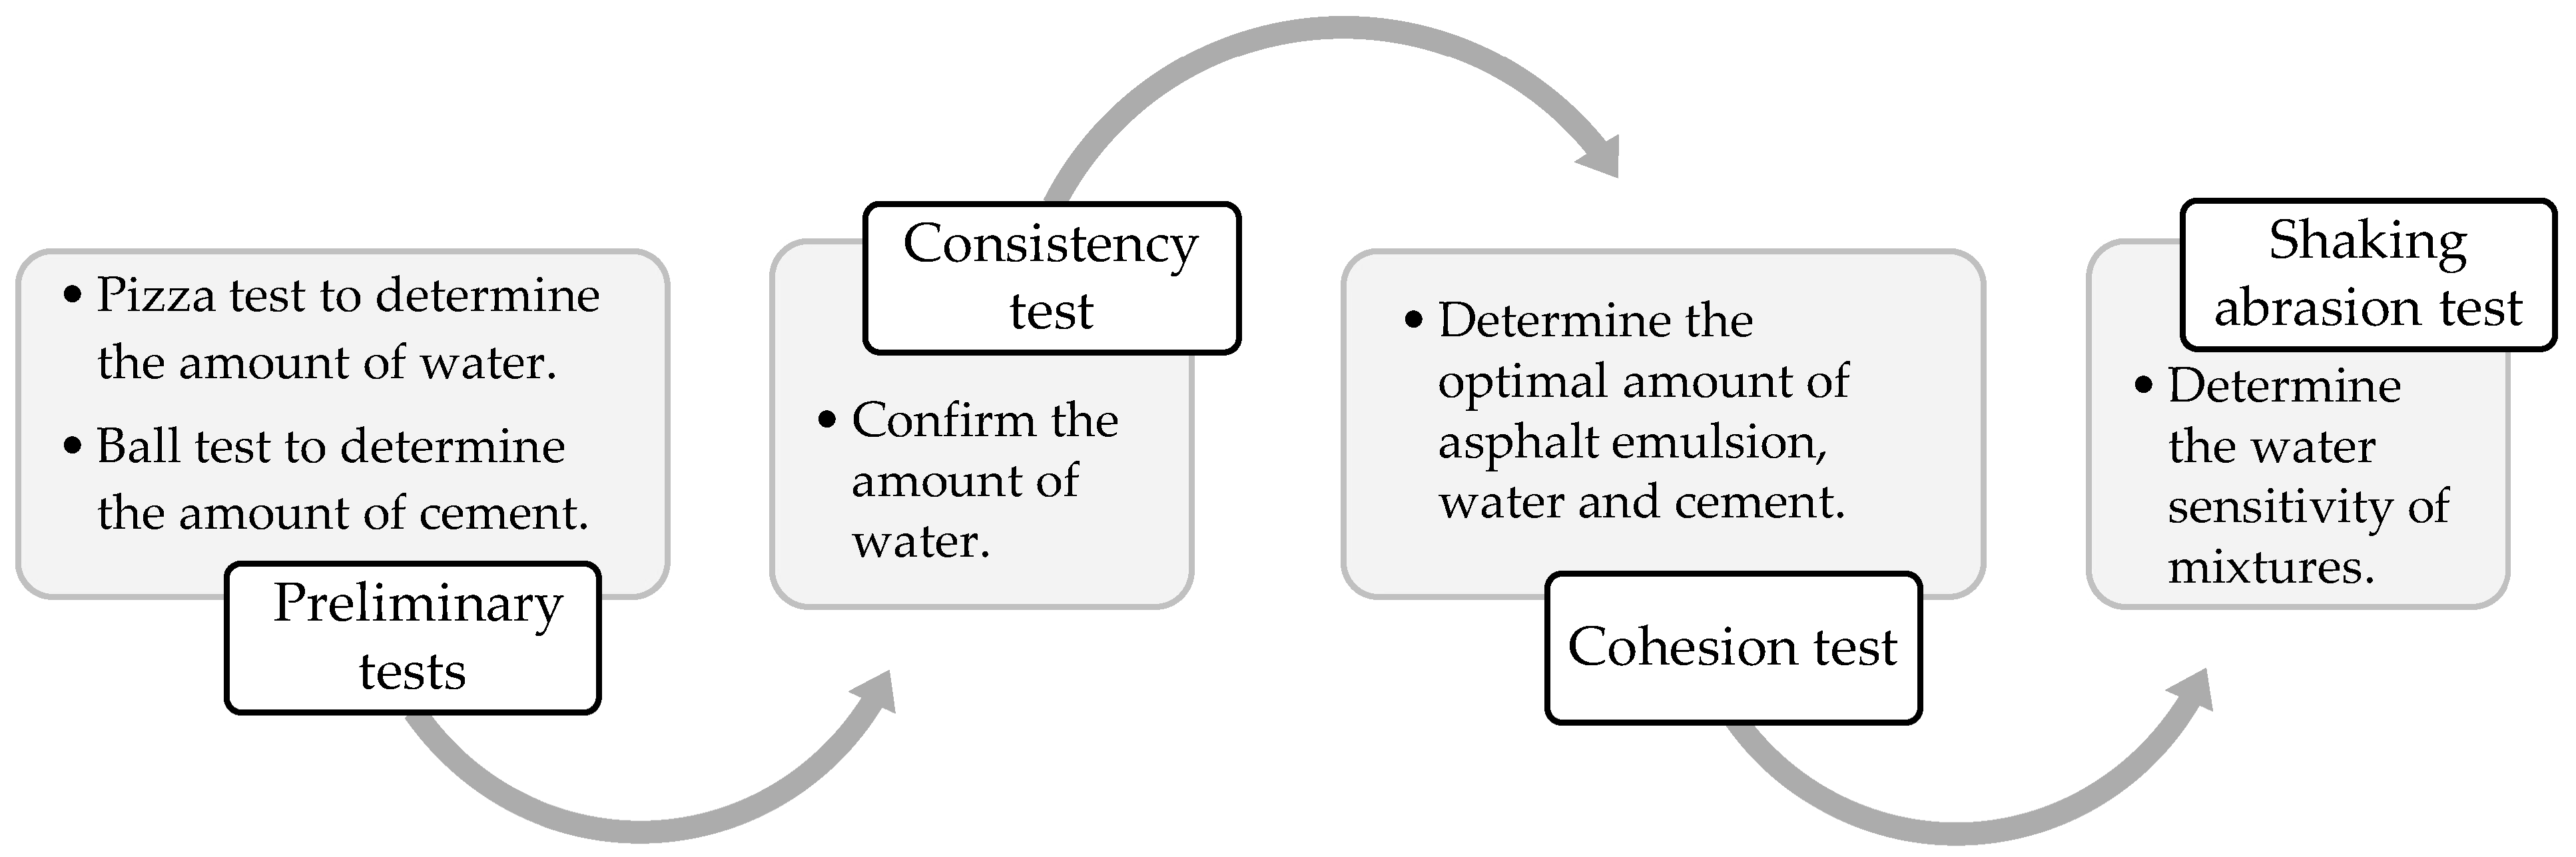
2.6. Microsurfacing Mix Design Method

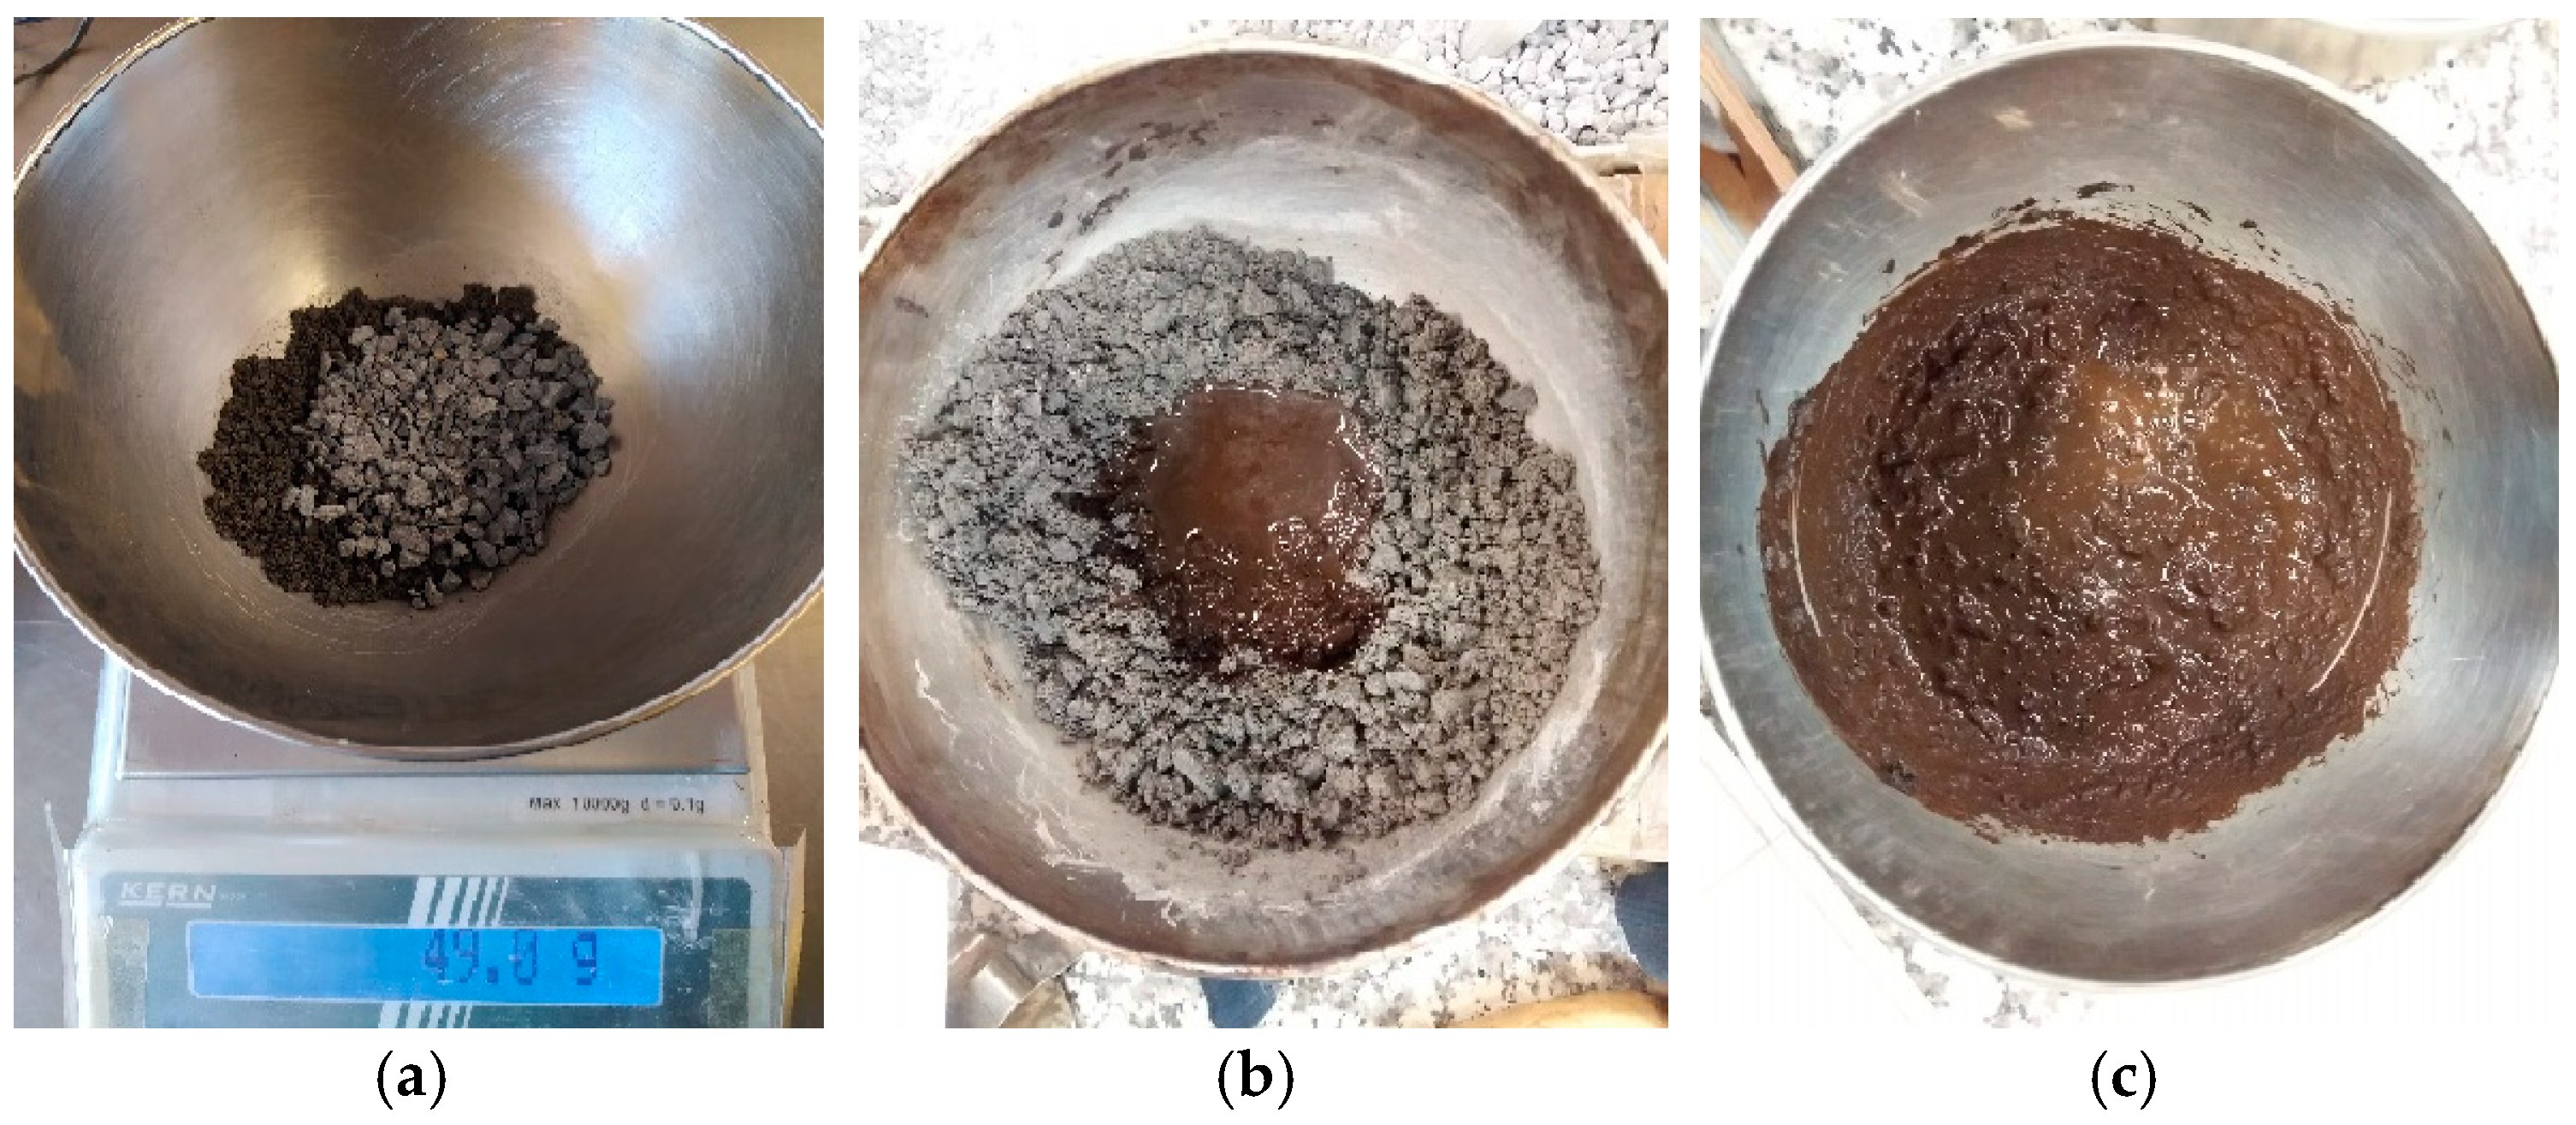
2.6.1. Preliminary Mix Design Tests

In the study’s first step, two preliminary tests, developed by the RILEM TC 280-CBE, were carried out to estimate the initial amount of added water and cement content necessary to produce the microsurfacing mixtures. The amount of added water was determined using the “pizza” test, which consists of molding a sample of the mixture into a pizza shape. After 30 min, the pizza’s surface should be black, and when broken in half, its interior should be brownish. After 60 min, the entire pizza should be black. The added water must be reduced if the desired color is not achieved within that time.
The “ball” test was carried out to determine the initial amount of cement by compressing the mixture into a ball and constantly squeezing between the hands to remove all excess water. After 60 min, the ball must be dropped to the ground from a height of 1.50 m and should not break. If the ball breaks, the amount of cement must be increased.

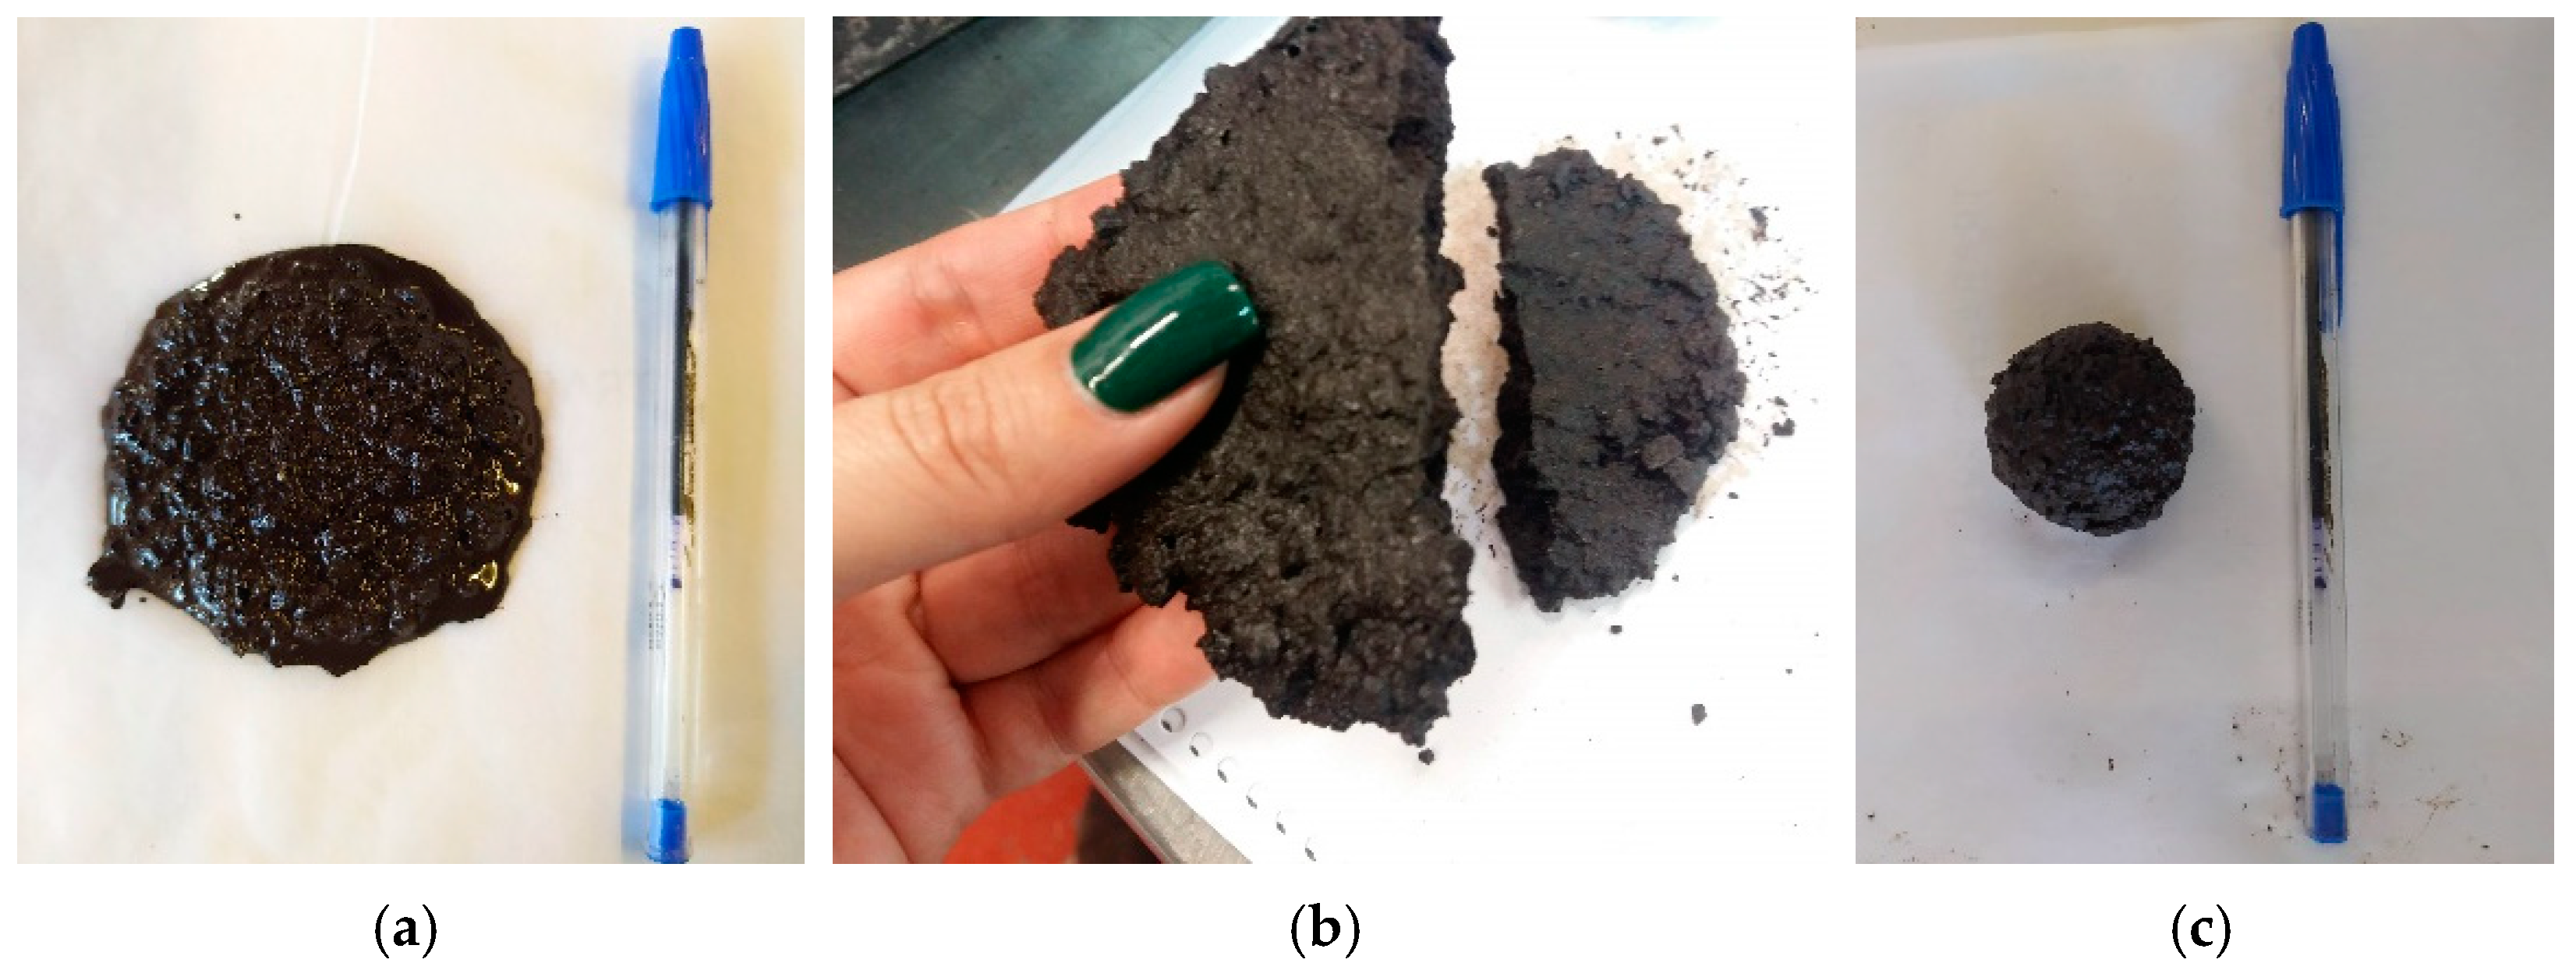
2.6.2. Consistency Test

The consistency test aims to optimize the amount of added water content after the preliminary tests, assessing the workability and segregation potential of the microsurfacing material. This test aimed to determine whether the added water amount determined by the pizza test reflected the ideal water content for each mixture.
The test followed the European Standard EN 12274-3 and was conducted at room temperature using a frustum of a cone with a height of 75 mm, a diameter of 40 mm at the top and a diameter of 90 mm at the bottom; a spatula; and a metal plate graduated in eight concentric circles, each increasing the radius by 10 mm. The test consisted of preparing 400 g of the mixture and pouring it into the cone in the center of the metal plate. Immediately, the cone was removed, and the sample could flow freely. The outflow of the mixture was then measured from the inner circle at four points 90° apart, and the average of the four flow values was taken as the consistency test result. In this test, a microsurfacing mixture with 25 mm to 35 mm flow values has adequate workability [30].

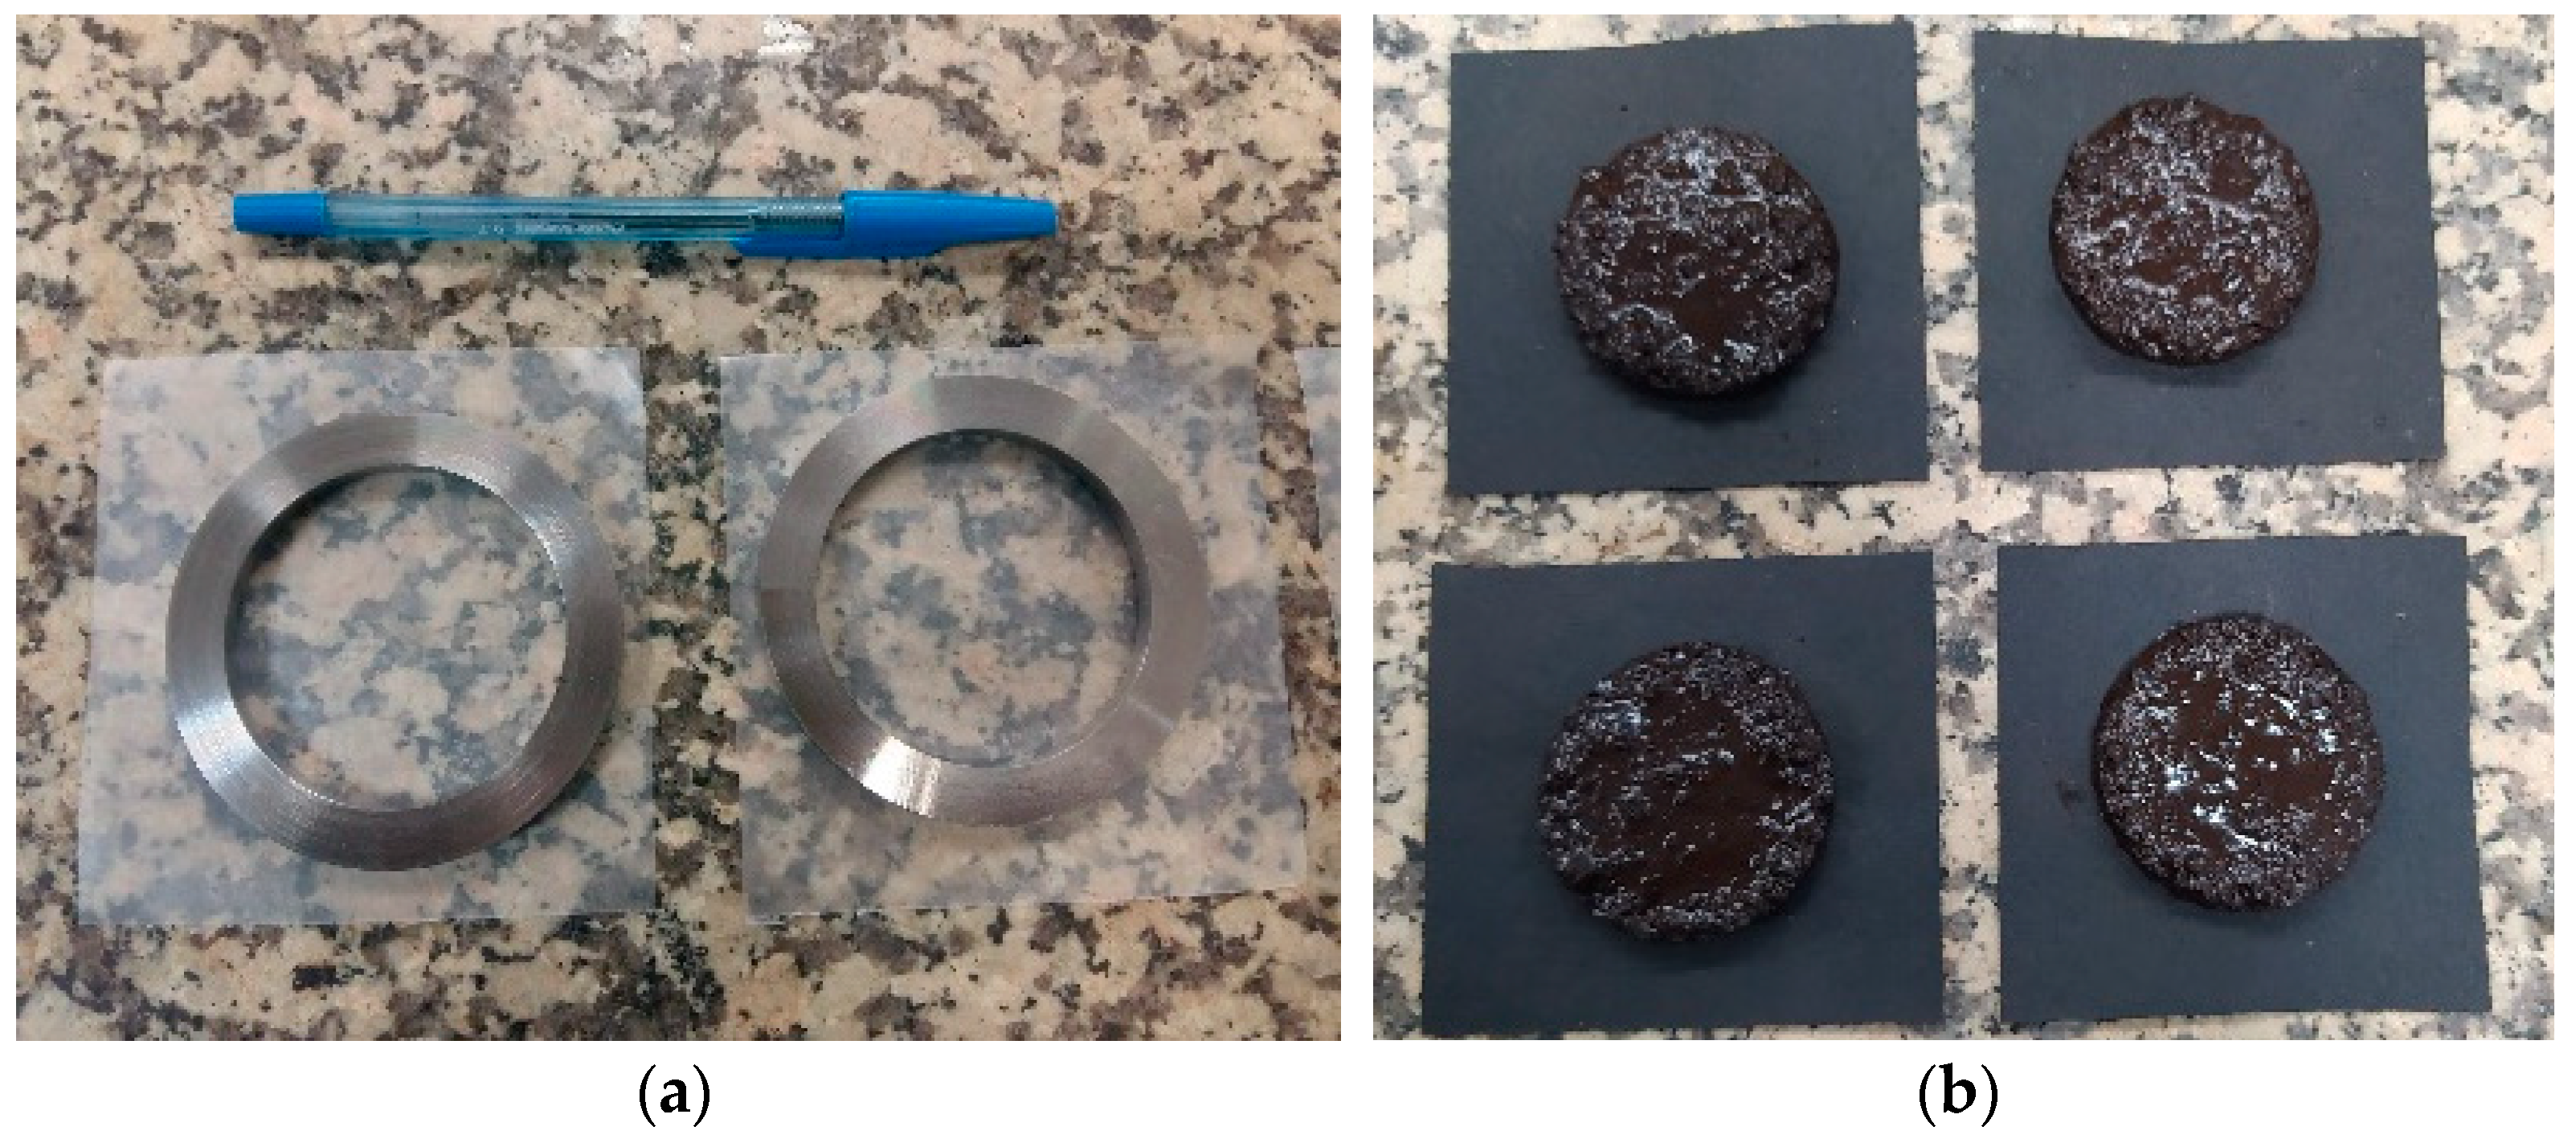
2.6.3. Cohesion Test

The cohesion test (EN 12274-4) is used to determine the development of the curing process of a microsurfacing mixture over time when subjected to torque. Thus, this test determines the time required for the microsurfacing to be open to traffic. Also, this test was used in this work to determine the ideal relationship between the percentage of emulsion, added water, and cement in microsurfacing mix designs.
The test was carried out with specific equipment and measured the torque applied to microsurfacing samples at different curing times, i.e., 5, 10, 15, 30, 60, 90, and 120 min. The first step of carrying out this test was to prepare the mixture samples and place them in metallic molds soon removed to inhibit the mixture from adhering to them while waiting for the pre-set curing time of each sample. After the predetermined curing period, the sample was placed centrally under the equipment piston, which was gently lowered, applying an air pressure of 200 kPa. Soon after, the torque meter was placed on the upper end of the cylinder rod and twisted in a smooth and firm horizontal movement through an arc of 90° to 120°, and the applied torque was recorded using dedicated software.

2.6.4. Shaking Abrasion Test

This test was carried out following the EN 12274-7 standard; it determines the loss of adhesiveness of microsurfacing mixtures due to their sensitivity to water, as it measures the loss of material from compacted standard specimens when they are placed in cylinders filled with water that is turned from end to end in specific equipment. Four cylindrical samples, each with a height of 25 mm and a diameter of 30 mm, were tested.
The specimens were obtained by adding approximately 45 g of the mixture (prepared following the EN 12274-7 standard) in a mold, compacted by applying a 10 KN load at a speed of 20 mm/min. Subsequently, the water absorption of each specimen is calculated according to the procedure presented in the EN 12274-7 standard.
After this process, each sample was placed inside a different stirring cylinder previously filled with 750 mL of fresh drinking water at 25 °C. The mechanical stirrer operated at 20 rpm at room temperature until reaching 3600 rotations, i.e., after 3 h of testing. Finally, the samples were removed from the cylinders, washed to remove all loose material, allowed to dry, and reweighed. The mass loss was then calculated to determine each specimen’s adhesiveness loss.

3. Results

3.1. Aggregate Characteristics

The grading curve of the mixture of aggregates studied was adjusted to the grading envelope defined by Infraestruturas de Portugal [29]. Only the most commonly used microsurfacing asphalt mixture among the three alternatives presented in Infraestruturas de Portugal [29] was studied. Thus, the grading envelope of the second layer in a double microsurfacing was selected. The best fit for the recommended grading envelope is presented in Figure 4. The percentage of aggregates passing through the 2 mm sieve dividing the coarse and fine fractions previously mentioned was 52%.
The value of the MDE coefficient of the basaltic aggregate (between the dimensions of 4 mm and 6.3 mm) obtained in this study was 9.7%. This value is significantly lower than the threshold value of 25% established in the specifications from Infraestruturas de Portugal [29]. The aggregates showed a 2.78 Mg/m3 density and a water absorption value of 1.85%, typical of a basalt aggregate.
The results of the aggregate’s affinity to both emulsions studied (the percentage of the aggregate surface covered with binder) are presented in Table 1. Figure 5 shows the visual appearance of some aggregate particles covered with Emulsion 1 after 6 h, 24 h, and 48 h of testing to demonstrate the reduction in the area of the aggregate surface covered with binder over time.
This test showed a better affinity of the basalt aggregates with Emulsion 1 compared with Emulsion 2, which could result in a better performance of the corresponding microsurfacing mixture. The visual assessment of the aggregate surface covered with binder over time was more difficult using basalt due to its color, but the brightness of the binder in water facilitates this task.

3.2. Asphalt Emulsions’ Characteristics

The breaking values obtained were 121.9 for Emulsion 1 and 158.3 for Emulsion 2. According to the EN 13808 standard, the emulsions can be classified as class 4 for the breaking value parameter (values between 110 and 195). The asphalt content and the emulsifier’s amount and type influence the emulsion’s breaking value. Therefore, emulsions with the same classification but different suppliers may have different breaking values.
The adhesion value obtained for Emulsion 1 was 90%, and for Emulsion 2, it was 75%. Concerning the EN 13808 standard for this parameter, Emulsion 2 can be classified as class 2 (≥75%), while Emulsion 1 belongs to class 3 (≥90%). These results align with those previously obtained when studying the aggregates’ affinity to both emulsions (EN 12697-11).
After the binder recovery by evaporation, characterization tests were carried out. The results are shown in Figure 6. Regarding the EN 13808 standard for cationic asphalt emulsions, the penetration values of the bitumen recovered from the two studied emulsions can be classified as class 3 (≤100 × 0.1 mm). Regarding the softening temperature result, the Emulsion 1 bitumen belongs to class 3 (TR&B > 55 °C), and the Emulsion 2 bitumen belongs to class 2 (TR&B > 60 °C).
According to the cohesion results, the bitumen recovered from Emulsion 1 had a value greater than 1 J/cm2 at a temperature of 5 °C, corresponding to class 4 of the EN 13808 standard. The bitumen recovered from Emulsion 2 did not reach the minimum cohesion value established for this test temperature, corresponding to a lower performance class. The results of the elastic recovery test showed that the bitumen binders recovered from the two studied emulsions belonged to class 5, with values greater than 50%.
Figure 7 shows the dynamic viscosity results obtained for both emulsions using the dynamic shear rheometer (DSR) for temperatures up to 88 °C (parallel plates configuration) and the rotational viscometer for temperatures above 90 °C (cup and bob configuration).
According to the results, it is possible to conclude that at lower temperatures (below 40 °C), the Emulsion 1 binder presents higher viscosity values. A different behavior was observed above the temperature of 40 °C: there was a faster decrease in the viscosity with increasing temperature in the Emulsion 1 binder, and the Emulsion 2 binder presented viscosity values that were less susceptible to temperature variations.
The master curves of the stiffness modulus and phase angle values obtained in the DSR after carrying out frequency sweep tests at different temperatures under controlled strain levels are presented in Figure 8 for a reference temperature of 40 °C. The equipment software carried out the time–temperature superposition using the WLF equation because the tests were performed in the linear viscoelastic regime.
The stiffness modulus results showed that the binder recovered from Emulsion 1 was stiffer than that recovered from Emulsion 2 at higher frequencies (i.e., above 1 Hz), demonstrating that this binder had a higher strength at temperatures lower than 40 °C. At higher temperatures, the stiffness of the binder recovered from Emulsion 2 became higher, confirming the viscosity and softening point test results. These results suggest that the base bitumen used to produce Emulsion 1 was more viscous than that of Emulsion 2, but the latter should have a higher polymer content that increases the strength at higher temperatures.
The phase angle results also suggested a lower modification level of the binder recovered from Emulsion 1 compared with Emulsion 2 since it achieved a higher peak value of around 80° at a higher equivalent frequency, which, according to Peralta et al. [31], corresponds to a lower relaxation time (i.e., the inverse of frequency) and reduced resistance to permanent deformation at high temperatures.
Additionally, the rheological characterization of the binders recovered from both emulsions provided their high-temperature PG grades, which are typically used to compare the performance of asphalt binders. Thus, the asphalt binder recovered from Emulsion 1 was a PG 70 binder, while that recovered from Emulsion 2 was a PG 76 binder.

3.3. Microsurfacing Test Results

3.3.1. Preliminary Design of Microsurfacing Mixtures

Several preliminary tests were performed for each microsurfacing mixture with two test repetitions per composition to determine the initial amounts of added water and cement. According to a previous study by RILEM TC 280-CBE, asphalt emulsion was fixed at 12% for all mixtures to estimate the starting percentages of added water and cement for performance testing. The results obtained at this stage for the mixtures produced with both asphalt emulsions are presented in the following paragraphs.
The first microsurfacing mixture produced with asphalt Emulsion 1 used 10% water and 2.0% cement. This mixture showed poor workability, and molding the pizza and the ball was impossible. Then, the amount of cement was increased to 2.5%, allowing the pizza and ball samples to be shaped. However, the mixture still presented a dry aspect with a low consistency. Thus, a new mixture was prepared with 2.5% cement, increasing the amount of water to 11%. This composition presented improved consistency, fulfilling the expected results in both preliminary tests. The pizza cured after one hour, and the ball did not break after falling to the ground. Figure 9 shows the test samples of this final microsurfacing mixture with Emulsion 1.
The first microsurfacing mixture produced with Emulsion 2 was based on the last composition studied for Emulsion 1, comprising 11% water and 2.5% cement. However, the water content was too high, delaying the pizza curing process. Thus, a new mixture was designed for Emulsion 2 with a lower water content (10%) and the same cement content (2.5%). This final mixture fulfilled the expected results in both preliminary tests: the pizza cured after one hour, and the ball did not break after falling from a 1.5 m height.

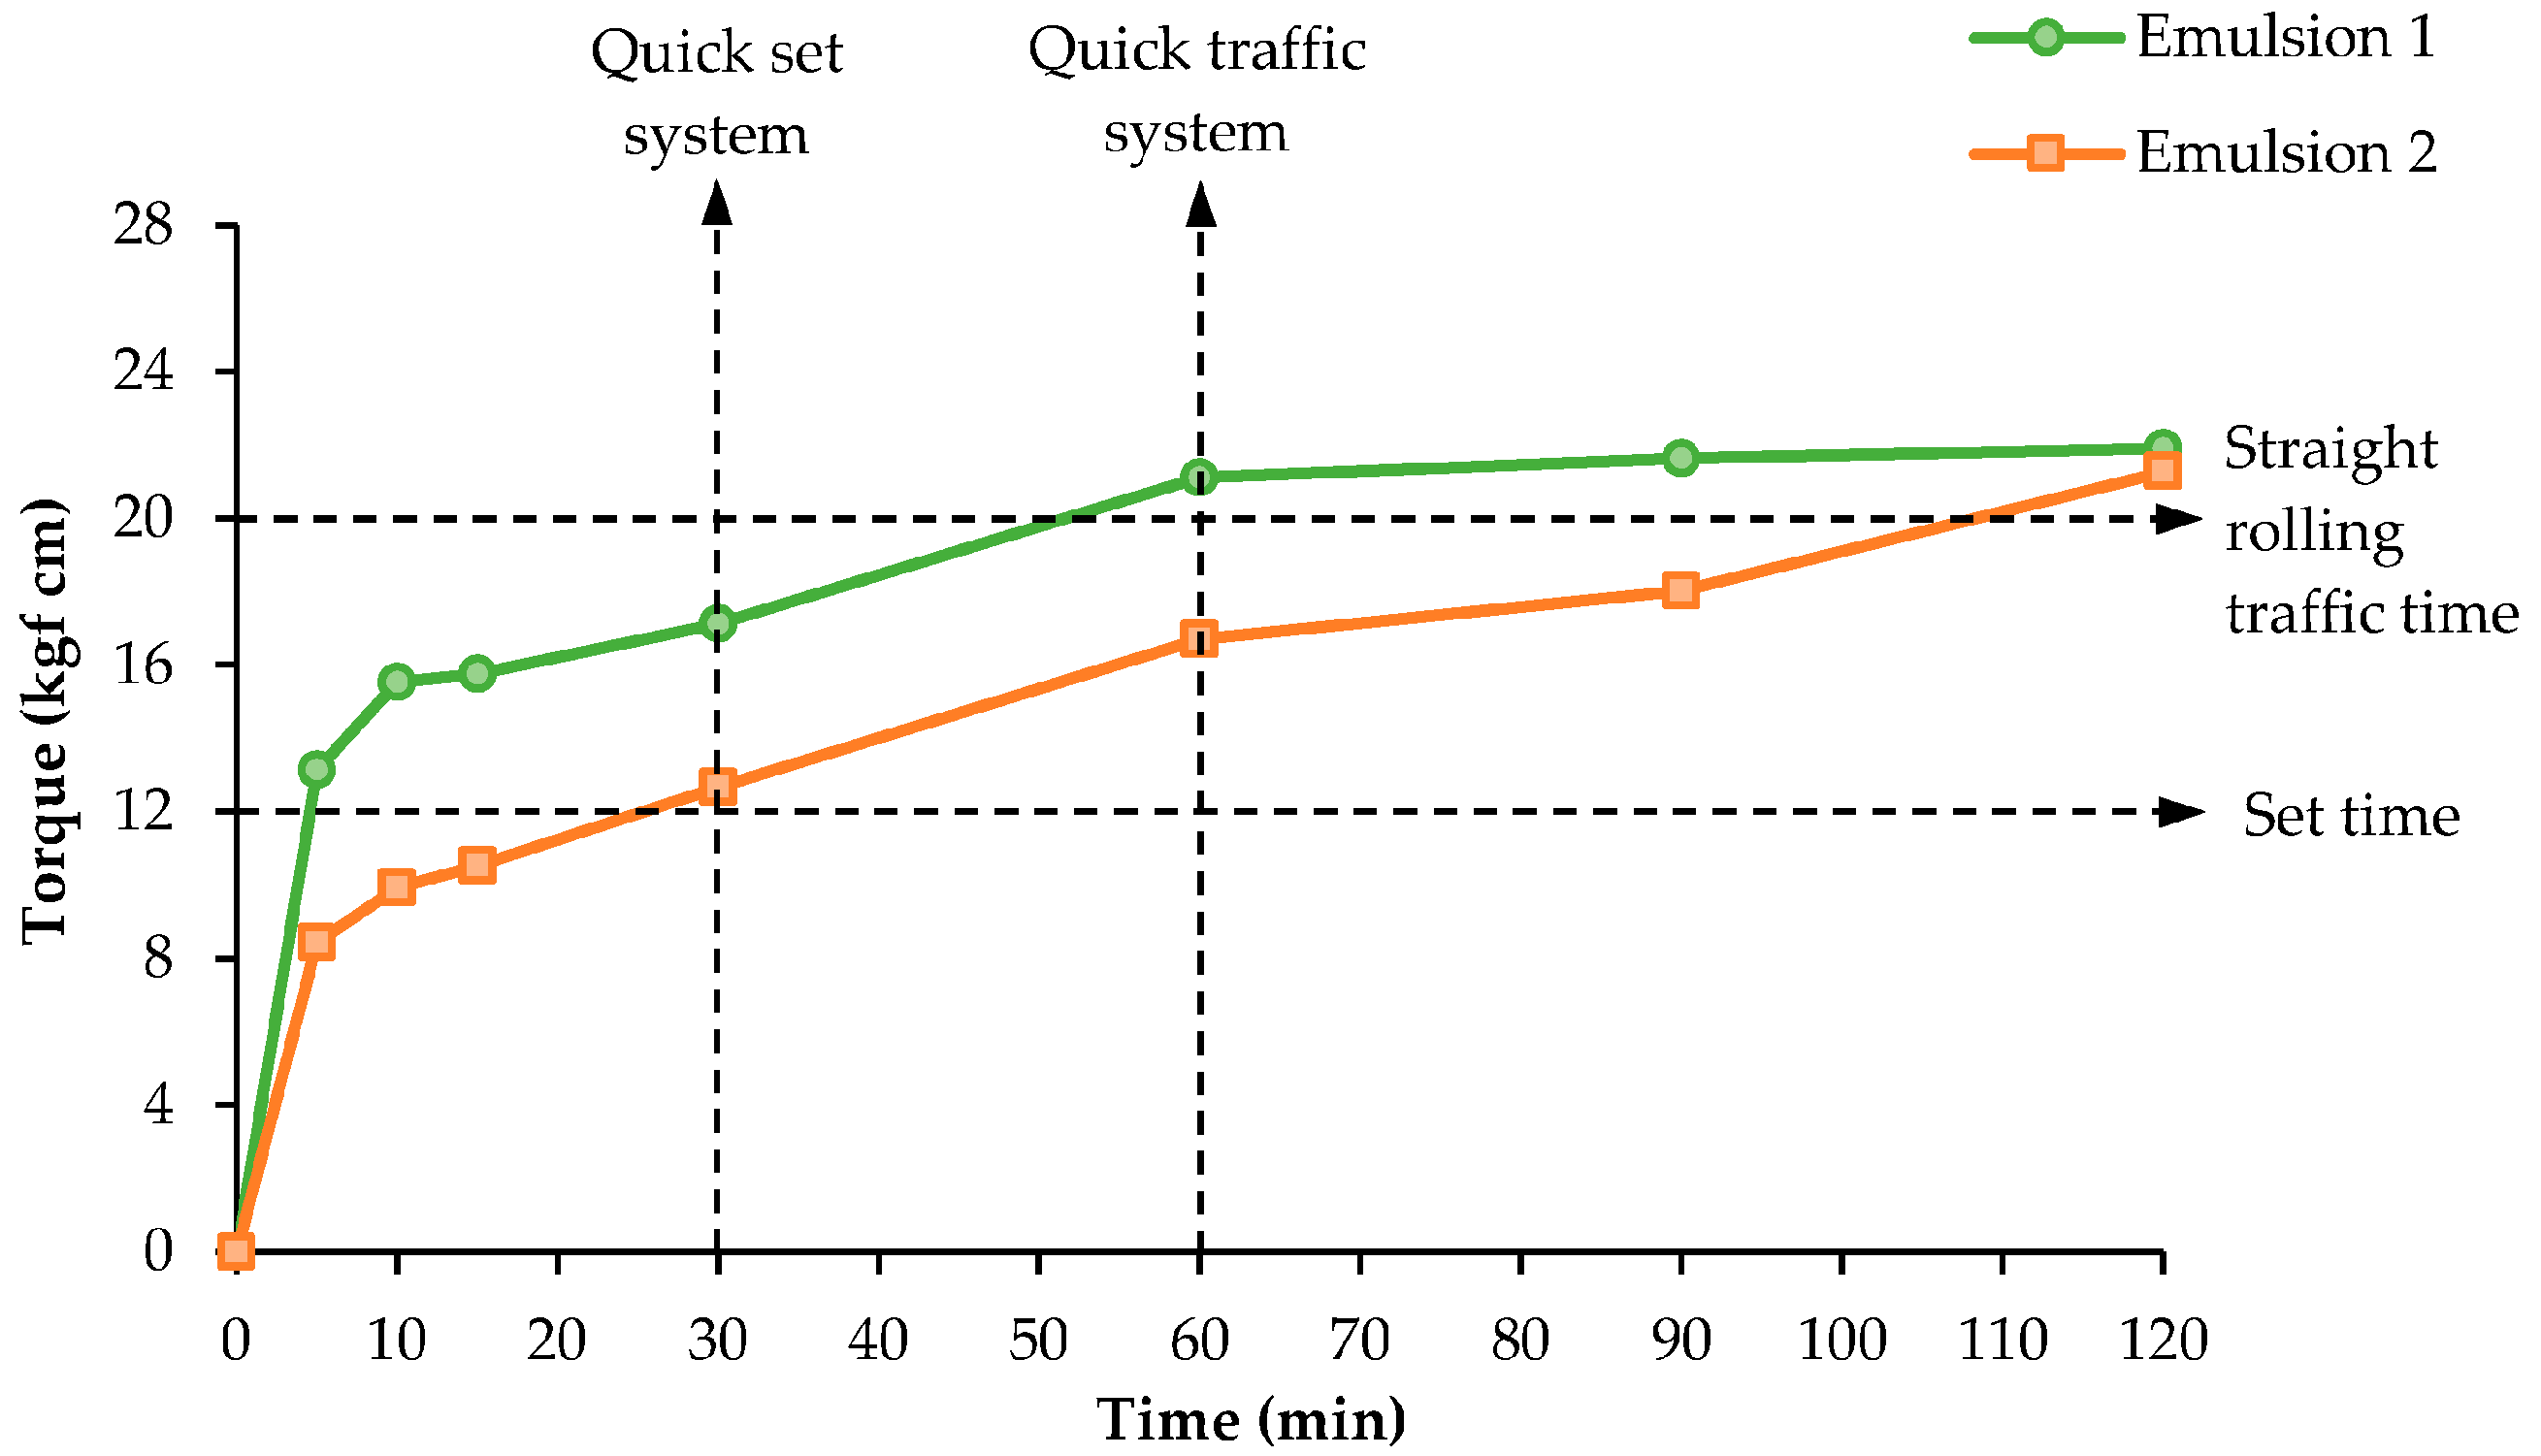
3.3.2. Consistency Test Results

The consistency test results for the microsurfacing mixtures produced with both asphalt emulsions studied in this work are presented below. The initial compositions studied at this stage were based on the preliminary test results for Emulsions 1 and 2.
Firstly, 400 g of microsurfacing mixture was produced with emulsion 1, using 52% fine aggregates and 48% coarse aggregates, 2.5% cement, 12% emulsion, and 11% water. The average flow value of the mixture measured at four points in perpendicular directions was 25 mm, confirming that 11% water assures adequate workability for mixtures produced with Emulsion 1. Figure 10 shows the test preparation and its final result.
The initial mixture produced with Emulsion 2 used 52% fine aggregates and 48% coarse aggregates, 2.5% cement, 12% emulsion, and 10% water. However, the average flow of the mixture was higher than 35 mm, showing that 10% water was excessive for mixtures produced with Emulsion 2. Therefore, a new microsurfacing mixture was designed with less water (9%), which presented an average flow of 30 mm measured at four points in perpendicular directions, thus improving the workability of the mixture produced with Emulsion 2.
The results of this test demonstrated that microsurfacing mixtures can use varying amounts of added water to guarantee adequate workability depending on the type of emulsion used. The results of this work suggest that emulsions with lower residual binder contents, such as Emulsion 2, may result in microsurfacing mixtures demanding lower amounts of added water.

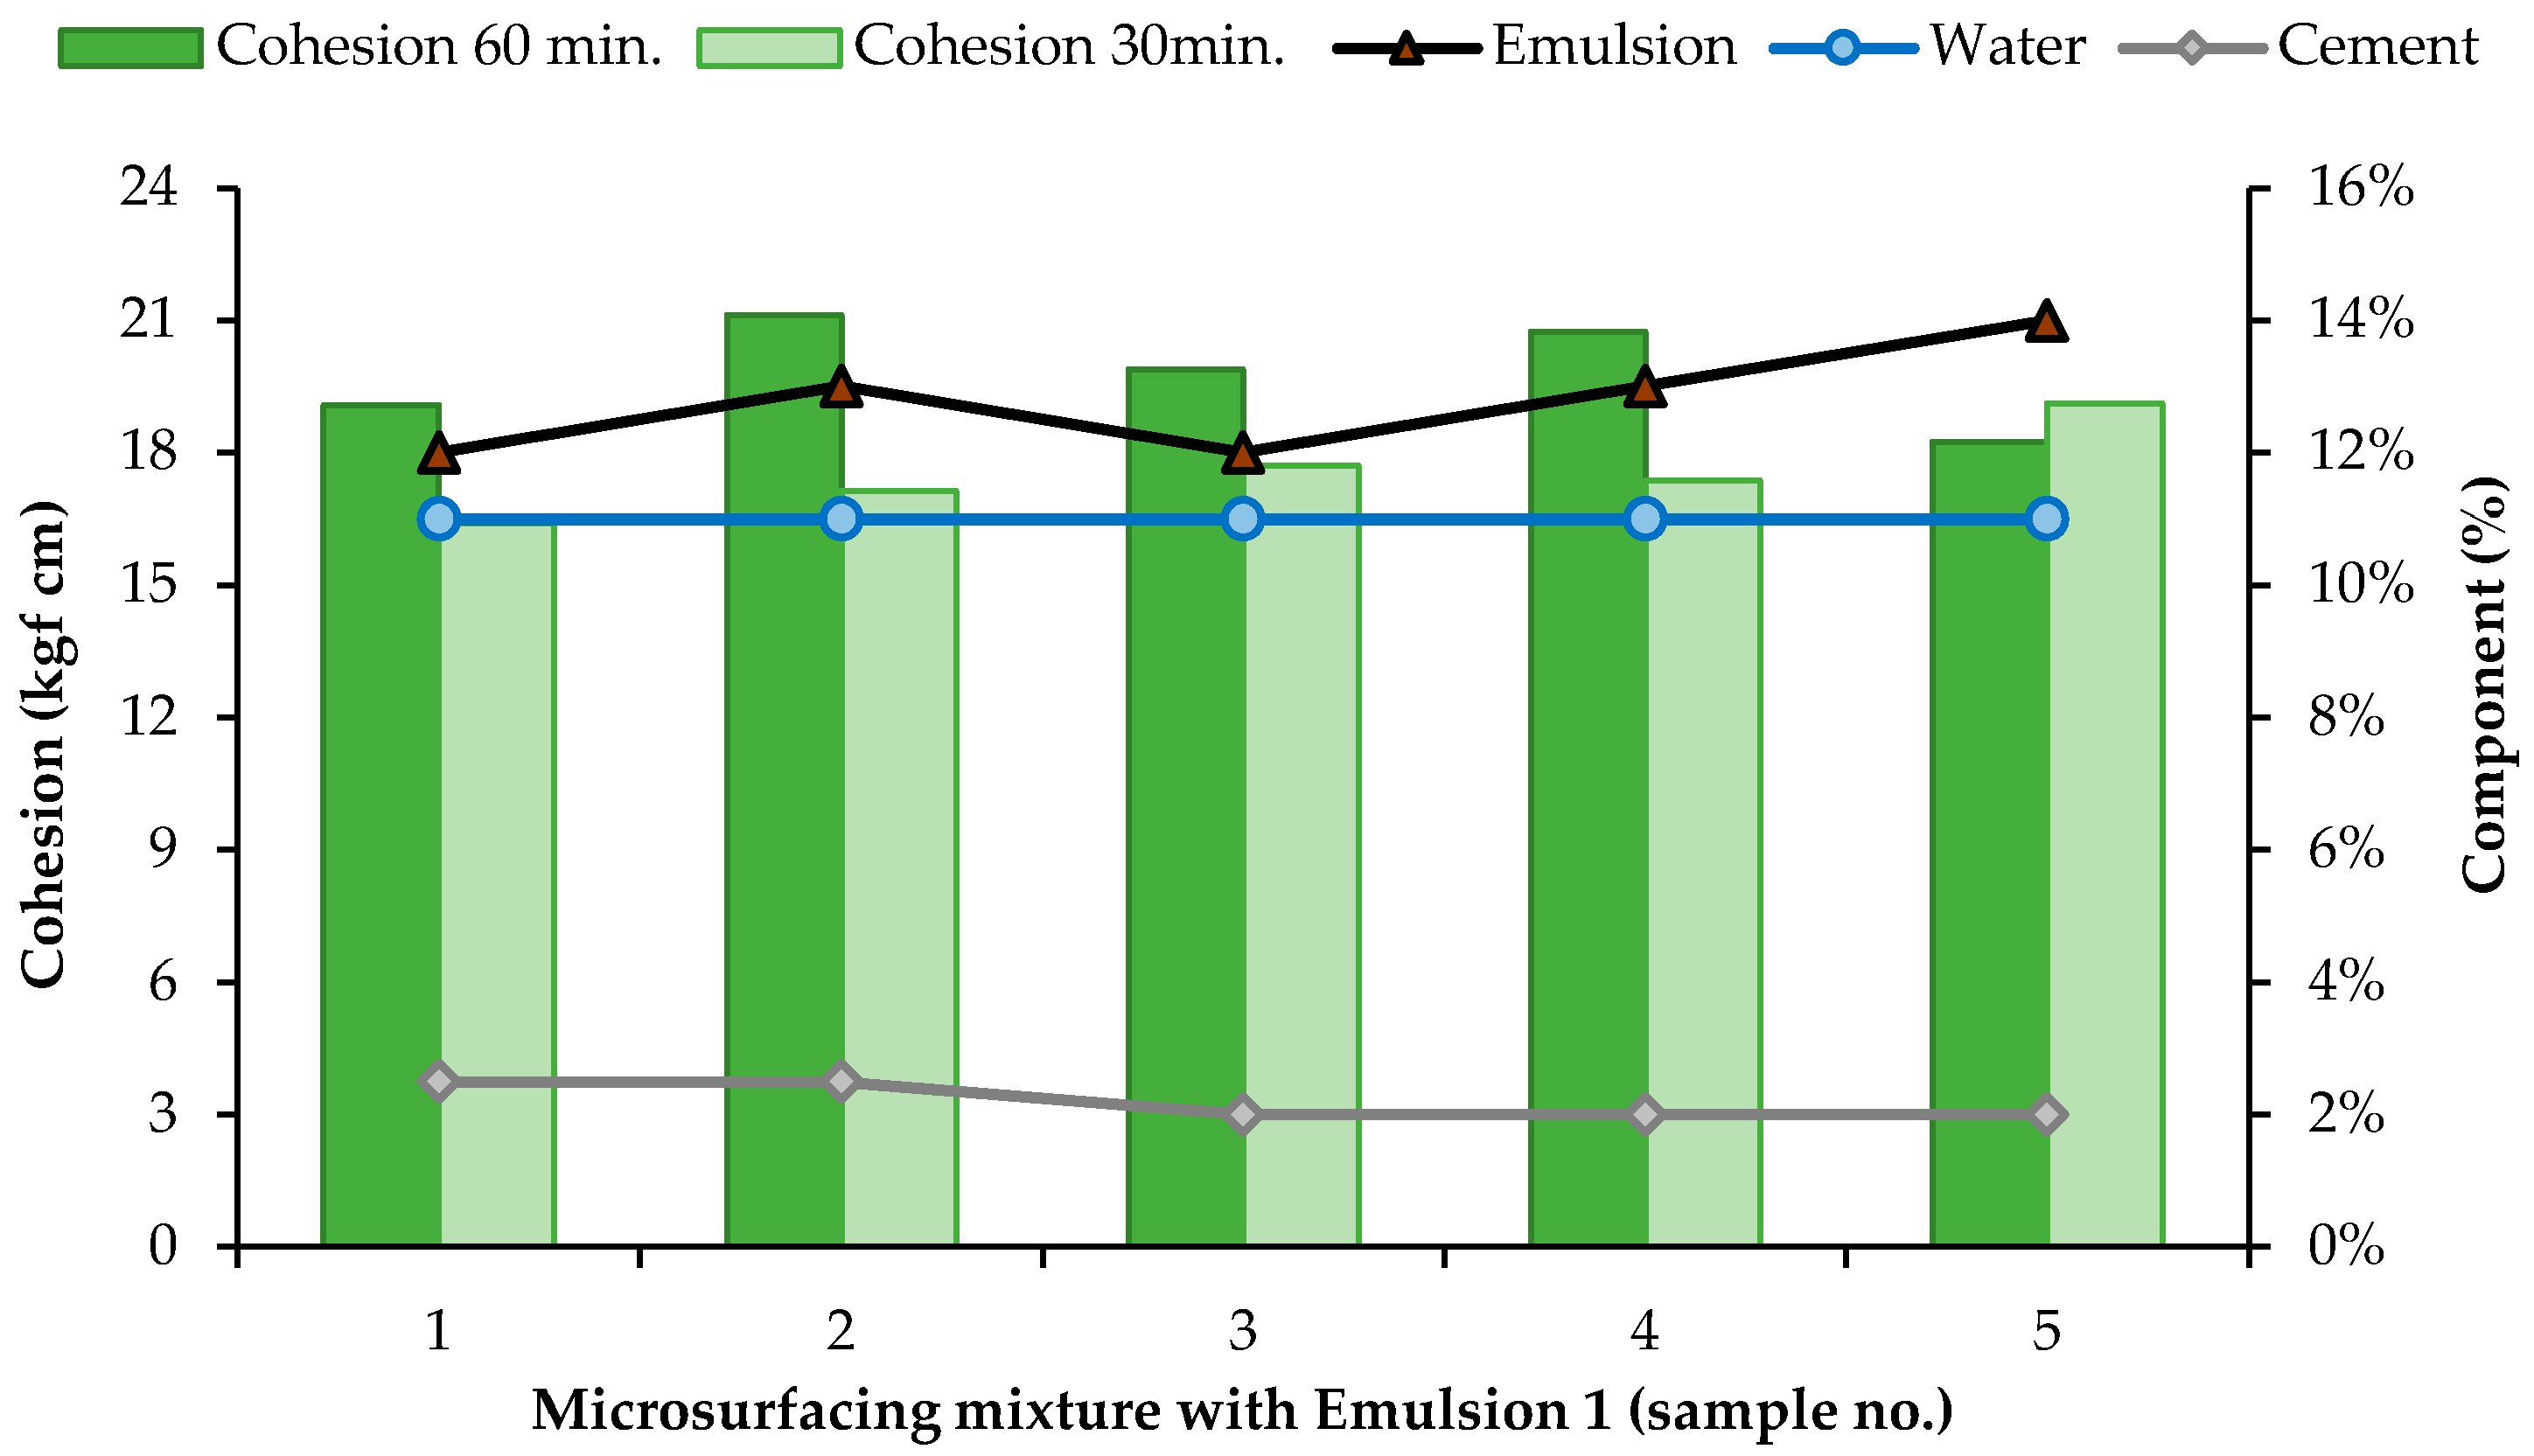
3.3.3. Cohesion Test Results

This test was carried out following the EN 12274-4 standard. Seven samples were produced for each composition and tested after 5, 10, 15, 30, 60, 90, and 120 min of curing. Figure 11 shows the molds used to produce the test samples and the samples in the curing process before the test. According to the ISSA [32], the most critical parameters assessed in the cohesion test are the torque values obtained after 30 and 60 min of microsurfacing curing. For this test, the ISSA defines the set time as the point at which the microsurfacing system reaches a minimum of 12 kgf cm torque, and the straight rolling traffic time corresponds to a minimum torque of 20 kgf cm. Therefore, a quick-set system should reach 12 kgf cm of torque within 30 min, while a quick-traffic system should reach 20 kgf cm of torque within 60 min.
The initial composition studied in this test for the microsurfacing mixture produced with Emulsion 1 was based on the mix design resulting from the consistency test, i.e., 52% fine aggregates and 48% coarse aggregates, 12% emulsion, 2.5% cement, and 11% water. However, the mixture did not reach the cohesion values defined by ISSA for a quick-set and quick-traffic system after 30 and 60 min of curing. Thus, new compositions were designed to improve the microsurfacing cohesion values.
The second microsurfacing mixture studied increased the emulsion content to 13% while maintaining all the other composition parameters. This mixture presented a cohesion value of 17.12 kgf cm within 30 min of curing and 21.11 kgf cm within 60 min, fulfilling the target results defined by the ISSA for a quick-set and quick-traffic system and confirming that this composition can be assumed to have adequate performance. Nevertheless, new mix compositions were studied to assess the possibility of producing more sustainable solutions with equivalent cohesion values.
The third mixture kept the added water at 11%, reducing the asphalt emulsion to 12% and the cement to 2.0%. This composition slightly increased the cohesion value after 30 min of curing, but decreased it after 60 min. Finally, two additional compositions were studied to evaluate the effect of increasing the emulsion content to 13% and 14%, keeping the added water at 11% and the cement at 2%. Table 2 summarizes all the results obtained for Emulsion 1.
Since the amount of water was fixed at 11%, the results showed the mutual influence of the emulsion and cement contents on the cohesion test performance of these microsurfacing mixtures. The amount of Emulsion 1 showing the best compromise between the 30 and 60 min curing times was 13%, although the quick-set performance may be improved for higher emulsion contents. Increasing the amount of cement improved the cohesion values only if the emulsion content was also increased.
Figure 12 shows the variation of cohesion values according to the amount of material added to the mixture produced with Emulsion 1. The second composition, with 11% water, 2.5% cement, and 13% emulsion, presented the best overall cohesion test performance and was selected for the shaking abrasion test.
Figure 13 presents the final appearance of the samples after the cohesion test for the selected microsurfacing mixture. According to the visual assessment criteria defined by EN 12274-4, the samples with 5 to 30 min of curing time were considered disintegrated, those with 60 and 90 min of curing time were classified as cracked, and the sample with 120 min of curing time was considered solid. These observations demonstrate the rapid evolution of the cohesion with the curing time for this mixture composition.
Regarding the microsurfacing mixtures produced with Emulsion 2, the first composition studied was also based on the final mix design obtained in the consistency test, i.e., 52% fine aggregates and 48% coarse aggregates, 12% emulsion, 2.5% cement, and 9% water. However, the mixture with this configuration did not achieve the target cohesion values mentioned by the ISSA after 30 and 60 min of curing. Thus, new compositions were also designed to improve the cohesion results.
The second mixture was only increased in the emulsion content by 1%, but that change had little effect on the microsurfacing cohesion values, which were still typical of a slow-set and slow-traffic system. Therefore, a third mixture was produced with 13% emulsion and 3% cement, improving the cohesion results and turning it into a quick-set system, confirming that the active filler (cement) is vital in the mixture cohesion. However, this solution could not be considered a quick-traffic system due to insufficient cohesion after 60 min of curing. Thus, a new composition was assessed by increasing the water content by 1%, which slightly lowered the cohesion value after 30 min but increased the cohesion value after 60 min (although not reaching a quick-traffic class).
Intending to look for a better combination of the amounts of emulsion, added water, and cement to improve cohesion, new mix designs were defined that varied the amount of added water and emulsion but kept the amount of cement at 3%. Table 3 summarizes all the results obtained for Emulsion 2.
After fixing the amount of cement at 3%, the results of mixtures 3 to 7 showed the mutual influence of the emulsion and added water contents on the cohesion of these microsurfacing mixtures. After 30 and 60 min, the best cohesion values were obtained for 10% water and 13% emulsion. Increasing the water or emulsion contents reduced the 30-min curing time cohesion values by increasing the amount of water needing evaporation. Reducing the emulsion content also had a negative effect due to a reduction in the amount of residual binder available in the microsurfacing mixture.
Figure 14 shows the variation of cohesion values according to the amount of material added to the mixture produced with Emulsion 2. As can be observed, the composition showing the best cohesion values was that with 10% water, 3% cement, and 13% emulsion, which, according to ISSA, can be classified as a quick-set and slow-traffic system.
Figure 15 presents the samples’ final appearance after the cohesion test for the selected mixture produced with Emulsion 2. According to the visual assessment defined by EN 12274-4, the 5 and 10 min samples were considered disintegrated, the 15 and 30 min samples were classified as cracked, and the 60 to 120 min samples were considered solid. These results confirmed the quick-set class of this microsurfacing mixture.
After analyzing each microsurfacing mixture separately, Figure 16 shows the evolution of the cohesion values with the curing time for the two selected compositions.
This graph demonstrates how the mixtures developed strength with time. It can be noted that both mixtures showed similar patterns, even though cohesion increased more rapidly and for higher values in the case of Emulsion 1. According to the ASTM [33] classification, the pattern of cohesion-time curves was a quick-set, quick-traffic system for Emulsion 1 and a quick-set, slow-traffic system for Emulsion 2. These results could be related to the binder cohesion values presented previously (1.00 J/cm2 and 0.46 J/cm2 for bitumen recovered from Emulsion 1 and 2, respectively). Thus, the bitumen cohesion could be used as an indicator of the shear strength of the microsurfacing mixture. Nevertheless, the ultimate cohesion values observed after 120 min were similar for both emulsions and higher than 20 kgf cm, showing that the mix design method proposed in the present work could adequately select the compositions for different types of emulsions.

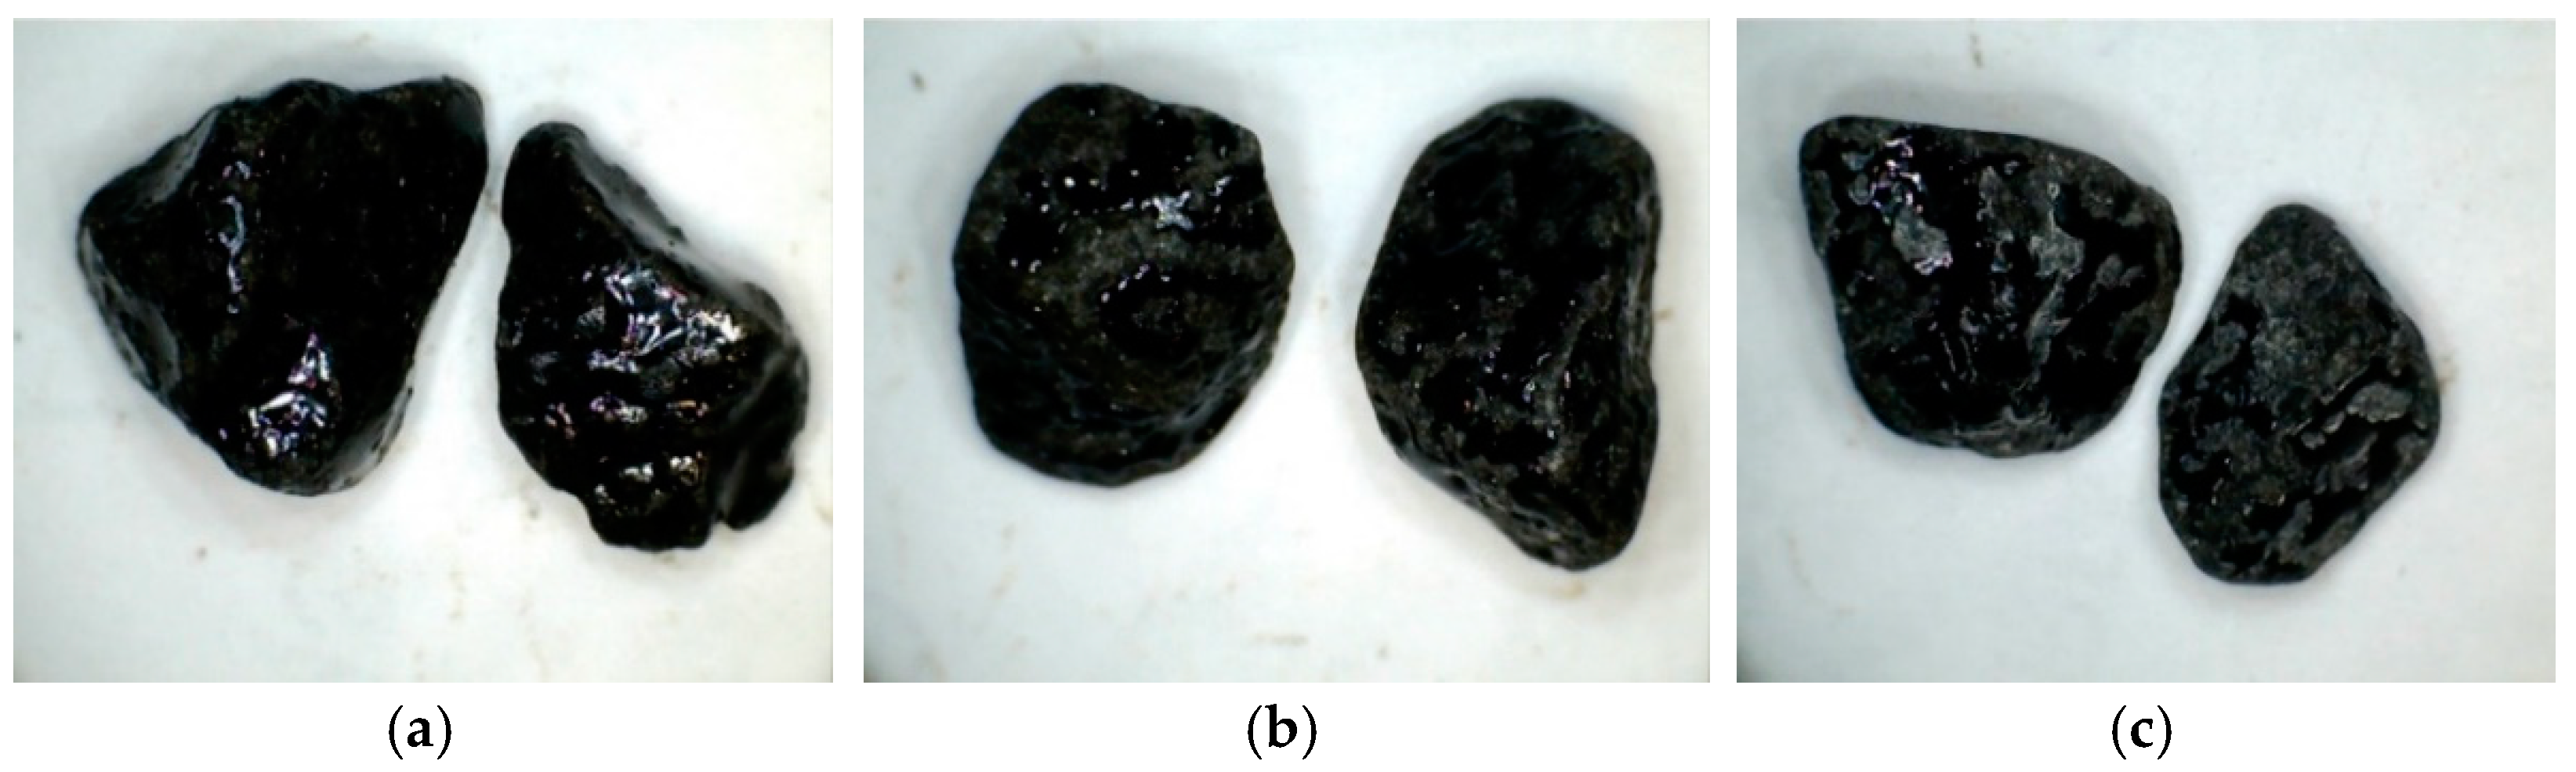
3.3.4. Shaking Abrasion Test

The shaking abrasion test was carried out to determine the loss of adhesiveness of mixtures studied due to their water sensitivity. This test was performed for the compositions with higher cohesion values previously obtained for both emulsions.
Figure 17 presents the appearance of a sample before and after the test; it can be seen that the edges of the specimens are polished after the test.
Table 4 presents the results of the tests carried out with the microsurfacing mixtures produced with both emulsions. The abrasion results are expressed as the mass loss percentage and were obtained by averaging the results of the four test specimens. The mixture with the best performance (lowest mass loss) was prepared with Emulsion 2. Table 4 also presents the water absorption of the mixtures and the volume of the specimens (Vv) after vacuum application, showing that the samples produced with Emulsion 1 had slightly higher volumes than those produced with Emulsion 2. Even though there were no significant differences between the two mixtures, the mixture with higher mass loss also presented a higher volume and water absorption.
The abrasion test rated the microsurfacing mixtures produced with Emulsions 1 and 2 differently from the cohesion test. This demonstrates that the properties of the emulsions used in microsurfacing mixtures significantly influence the final performance of the material. The lower abrasion of the mixture with Emulsion 2 may be related to the potential higher polymer modification of this emulsion, as inferred from its residual binder’s higher elastic recovery and softening point temperature. The higher amount of cement in that mixture may have also contributed to the lower abrasion and air void content values measured, which indirectly reduced water absorption.

4. Conclusions

This work proposed a new mix design procedure for microsurfacing mixtures, which was used to assess the influence of the type and amount of asphalt emulsion and the added water and cement contents on the characteristics of the mixture.
The study started with materials characterization, which provided valuable insights to help elucidate the mixtures’ behavior in the following tests. The basalt aggregates demonstrated better compatibility with Emulsion 1 than Emulsion 2, suggesting that Emulsion 1 may be more suitable for optimal performance. Emulsion 1 also exhibited higher adhesion and cohesion results than Emulsion 2, meeting the relevant standards. Regarding rheological properties, Emulsion 1 displayed higher viscosity at lower temperatures, while Emulsion 2 showed less susceptibility to temperature changes. Additionally, Emulsion 1 had higher stiffness at lower temperatures, whereas Emulsion 2 showed higher stiffness at higher temperatures, likely due to different polymer contents. The phase angle results indicated that Emulsion 1 had lower modification levels than Emulsion 2, affecting its resistance to permanent deformation at high temperatures.
After the materials characterization, two mixtures were produced with emulsions C65BP4 (Emulsion 1) and C60BP4 (Emulsion 2). A sequence for adding each material was proposed to standardize the procedure of mixture production since these indications are missing in the European standards and significantly influence the mixture’s workability. Furthermore, two preliminary tests were suggested to determine the mixture’s initial amount of cement and added water: the pizza and ball tests. This work showed that the pizza and ball tests had good capability in evaluating the effects of water and cement on the material’s behavior. These tests save time for the subsequent mix design by quickly approximating the values of water and cement needed for adequate performance.
The consistency test can be used to confirm the amount of added water and the workability of the mixture. In this work, the amount of water determined in the pizza and ball tests was confirmed for the microsurfacing mixture with Emulsion 1, while the mixture with Emulsion 2 required a reduction of 1% in the water content to obtain the expected workability.
The cohesion test was the most time-consuming phase of the mix design procedure, as it is necessary to identify the best relationship between the amount of asphalt emulsion, added water, and cement until a higher cohesion value is found. The cohesion results of this test were generally higher for Emulsion 1, resulting in a quick-set quick-traffic system for that emulsion and a quick-set slow-traffic system for Emulsion 2. Moreover, the ultimate cohesion values observed after 120 min were higher than 20 kgf cm and similar for both emulsions, showing that the mix design method proposed in the present work could adequately select the mix compositions for different types of emulsions.
The mixture produced with Emulsion 2 presented better results than those obtained with Emulsion 1 in the shaking abrasion test, which may be related to this emulsion’s potential higher polymer modification, as inferred from its residual binder’s higher elastic recovery and softening point temperature.
Summing up, microsurfacing systems are strongly influenced by asphalt emulsions (usually modified), aggregate types, and the water and cement contents. Therefore, their performance depends on several physical interactions and chemical reactions that are difficult to isolate. Nevertheless, the mix design process presented in this paper was able to select the best microsurfacing mix composition for two different emulsions.

Author Contributions

Conceptualization, C.F.N.M., J.R.M.O., H.M.R.D.S., C.A.O.F.P. and C.S.; methodology, C.F.N.M., J.R.M.O., H.M.R.D.S., C.A.O.F.P. and C.S.; validation, J.R.M.O., H.M.R.D.S. and C.A.O.F.P.; formal analysis, C.F.N.M., J.R.M.O. and H.M.R.D.S.; investigation, C.F.N.M., J.R.M.O. and H.M.R.D.S.; writing—original draft preparation, C.F.N.M., J.R.M.O., H.M.R.D.S. and C.A.O.F.P.; writing—review and editing, C.F.N.M., J.R.M.O., H.M.R.D.S. and C.S.; supervision, J.R.M.O. and H.M.R.D.S. All authors have read and agreed to the published version of the manuscript.

Funding

This research was funded by Fundação para a Ciência e a Tecnologia through a Ph.D. grant (number 2021.08004.BD). This work was also partly financed by FCT/MCTES through national funds (PIDDAC) under the R&D Unit Institute for Sustainability and Innovation in Structural Engineering (ISISE), reference UIDB/04029/2020, and under the Associate Laboratory Advanced Production and Intelligent Systems ARISE, reference LA/P/0112/2020.

Institutional Review Board Statement

Not applicable.

Informed Consent Statement

Not applicable.

Data Availability Statement

Data sharing does not apply to this article.

Acknowledgments

The authors would like to acknowledge the support from the University of Minho staff involved in this work and RILEM’s Technical Committee 280-CBE for providing the materials.

Conflicts of Interest

The authors declare no conflict of interest. The funders had no role in the study’s design; in the collection, analyses, or interpretation of data; in the writing of the manuscript; or in the decision to publish the results.

References

  1. Shanbara, H.K.; Dulaimi, A.; Al-Mansoori, T.; Al-Busaltan, S.; Herez, M.; Sadique, M.; Abdel-Wahed, T. The future of eco-friendly cold mix asphalt. Renew. Sustain. Energy Rev. 2021, 149, 111318. [Google Scholar] [CrossRef]
  2. Wulandari, P.S.; Tjandra, D. The effect of crumb rubber in dense graded and open graded cold mixture asphalt. In Proceedings of the IOP Conference Series: Earth and Environmental Science, Surabaya, Indonesia, 20 August 2021. [Google Scholar]
  3. Dash, S.S.; Panda, M. Influence of mix parameters on design of cold bituminous mix. Constr. Build. Mater. 2018, 191, 376–385. [Google Scholar] [CrossRef]
  4. Xiao, F.P.; Yao, S.L.; Wang, J.G.; Li, X.H.; Amirkhanian, S. A literature review on cold recycling technology of asphalt pavement. Constr. Build. Mater. 2018, 180, 579–604. [Google Scholar] [CrossRef]
  5. Bhargava, N.; Siddagangaiah, A.K.; Ryntathiang, T.L. State of the art review on design and performance of microsurfacing. Road Mater. Pavement Des. 2020, 21, 2091–2125. [Google Scholar] [CrossRef]
  6. Zalnezhad, M.; Hesami, E. Effect of steel slag aggregate and bitumen emulsion types on the performance of microsurfacing mixture. J. Traffic Transp. Eng. (Engl. Ed.) 2020, 7, 215–226. [Google Scholar] [CrossRef]
  7. Bae, A.; Stoffels, S.M. Economic effects of microsurfacing on thermally-cracked pavements. KSCE J. Civ. Eng. 2008, 12, 177–185. [Google Scholar] [CrossRef]
  8. Madane, A.; Taye, S.; Mamidwar, S.; Chavan, S. A laboratory investigation on type III micro-surfacing with different fillers. Int. Res. J. Eng. Technol. (IRJET) 2019, 6, 3321–3324. [Google Scholar]
  9. Broughton, B.; Lee, S.-J. Microsurfacing in Texas; Texas State University: San Marcos, TX, USA, 2012. [Google Scholar]
  10. Freeman, T.; Pinchett, D.; Haobo, R.; Spiegelman, C. Analysis and Treatment Recommendations from the Supplemental Maintenance Effectiveness Research Program (SMERP); Texas Transportation Institute: College Station, TX, USA, 2002. [Google Scholar]
  11. Callai, S.C.; Sangiorgi, C. A review on acoustic and skid resistance solutions for road pavements. Infrastructures 2021, 6, 41. [Google Scholar] [CrossRef]
  12. Keymanesh, M.R.; Ziari, H.; Zalnezhad, H.; Zalnezhad, M. Mix design and performance evaluation of microsurfacing containing electric arc furnace (EAF) steel slag filler. Constr. Build. Mater. 2021, 269, 121336. [Google Scholar] [CrossRef]
  13. Grilli, A.; Graziani, A.; Carter, A.; Sangiorgi, C.; Pivoto Specht, L.; Copetti Callai, S. Slurry surfacing: A review of definitions, descriptions and current practices. RILEM Tech. Lett. 2019, 4, 103–109. [Google Scholar] [CrossRef]
  14. Broughton, B.; Lee, S.-J.; Kim, Y.-J. 30 Years of Microsurfacing: A Review. ISRN Civ. Eng. 2012, 2012, 1–7. [Google Scholar] [CrossRef] [Green Version]
  15. Xia, Y.F.; Jia, J.; Chen, Q. Road Performance Comprehensive Evaluation of Polymer Modified Emulsified Asphalt Fiber Microsurfacing. Adv. Mater. Sci. Eng. 2022, 2022, 8179137. [Google Scholar] [CrossRef]
  16. Destrée, A.; Vansteenkiste, S.; Tanghe, T.; De Visscher, J.; Grilli, A. Reliable Laboratory Tests: A Prerequisite for the Design of High-Quality Slurry Surfacing Mixtures. Adv. Mater. Sci. Eng. 2022, 2022, 1–20. [Google Scholar] [CrossRef]
  17. Lonbar, M.S.; Nazirizad, M. Laboratory Investigation of Materials Type Effects on the Microsurfacing Mixture. Civ. Eng. J. 2016, 2, 86–94. [Google Scholar] [CrossRef]
  18. Gransberg, D.D. Microsurfacing: A Synthesis of Highway Practices. NCHRP Synthesis 411; Transportation Research Board: Washington, DC, USA, 2010. [Google Scholar]
  19. Robati, M.; Carter, A.; Perraton, D. Evaluation of a modification of current microsurfacing mix design procedures. Can. J. Civ. Eng. 2015, 42, 319–328. [Google Scholar] [CrossRef] [Green Version]
  20. Robati, M.; Carter, A.; Perraton, D. Repeatability and reproducibility of micro-surfacing mixture design tests and effect of aggregates surface areas on test results. Aust. J. Civ. Eng. 2013, 11, 41–55. [Google Scholar] [CrossRef]
  21. Bhargava, N.; Siddagangaiah, A.K.; Ryntathiang, T.L. Systematic approach to address challenges in microsurfacing mix design. Constr. Build. Mater. 2021, 270, 121759. [Google Scholar] [CrossRef]
  22. Poursoltani, M.; Hesami, S. Performance evaluation of microsurfacing mixture containing reclaimed asphalt pavement. Int. J. Pavement Eng. 2020, 21, 1491–1504. [Google Scholar] [CrossRef]
  23. Robati, M. Evaluation and Improvement of Micro-Surfacing Mix Design Method and Modelling of Asphalt Emulsion Mastic in Terms of Filler-Emulsion Interaction. Ph.D. Thesis, École de Technologie Supérieure, Université du Québec, Montreal, QC, Canada, 2014. [Google Scholar]
  24. Robati, M.; Carter, A.; Perraton, D. Evaluation of test methods and selection of aggregate grading for type III application of micro-surfacing. Int. J. Pavemnet Eng. Asph. Technol. 2013, 14, 11–66. [Google Scholar] [CrossRef]
  25. Kumar, R.; Ryntathiang, T.L. New Laboratory Mix Methodology of Microsurfacing and Mix Design. Transp. Res. Procedia 2016, 17, 488–497. [Google Scholar] [CrossRef]
  26. European Standard EN 12274-3; CEN. Slurry Surfacing—Test Methods—Part 3: Consistency. European Committee for Standardization: Brussels, Belgium, 2018.
  27. European Standard EN 12274-4; CEN. Slurry Surfacing—Test Methods—Part 4: Determination of Cohesion of the Mix. European Committee for Standardization: Brussels, Belgium, 2018.
  28. European Standard EN 12274-7; CEN. Slurry Surfacing—Test Methods—Part 7: Shaking Abrasion Test. European Committee for Standardization: Brussels, Belgium, 2005.
  29. Infraestruturas de Portugal. Caderno de Encargos Tipo Obra. 14.03—Pavimentação. Características dos Materiais; Infraestruturas de Portugal: Almada, Portugal, 2014. [Google Scholar]
  30. Austroads Test Method AGPT-T270-18; Determination of Optimum Amount of Added Water for Bituminous Slurry (Consistency Test). Austroads: Sydney, Australia, 2018.
  31. Peralta, J.; Hilliou, L.; Silva, H.M.R.D.; Machado, A.V.; Pais, J.C.; Oliveira, J.R.M. Rheological Quantification of Bitumen Aging: Definition of a New Sensitive Parameter. Appl. Rheol. 2010, 20, 63293. [Google Scholar] [CrossRef]
  32. Technical Bulletin No. 139; Test Method to Determine Set and Cure Development of Slurry Surfacing Systems by Cohesion Tester. International Slurry Surfacing Association: Glen Ellyn, IL, USA, 2017.
  33. ASTM D6372-15; Standard Practice for Design, Testing, and Construction of Micro-Surfacing. American Society for Testing and Materials: West Conshohocken, PA, USA, 2016.
Figure 1. Flowchart of the microsurfacing mix design procedure proposed in this work.
Applsci 13 07925 g001
Figure 2. Initial phase of microsurfacing production: (a) aggregate fraction separation, (b) mixture of fine aggregates with half the total water, and (c) addition of cement.
Applsci 13 07925 g002
Figure 3. Final phase of microsurfacing production: (a) incorporation of coarse aggregates, (b) addition of asphalt emulsion, and (c) microsurfacing mixture immediately after production.
Applsci 13 07925 g003
Figure 4. Aggregate gradation adopted for each microsurfacing asphalt mixture.
Applsci 13 07925 g004
Figure 5. Example of basalt aggregates surface covered with bitumen when using Emulsion 1 after the following testing periods: (a) 6 h, (b) 24 h, and (c) 48 h.
Applsci 13 07925 g005
Figure 6. Characterization test results of binders recovered from asphalt emulsions: (a) penetration and softening point and (b) cohesion and elastic recovery.
Applsci 13 07925 g006
Figure 7. Dynamic viscosity of the binders recovered from the studied emulsions.
Applsci 13 07925 g007
Figure 8. Rheological characterization of binders recovered from asphalt emulsions (master curves obtained for a reference temperature of 40 °C): (a) stiffness modulus and (b) phase angle.
Applsci 13 07925 g008
Figure 9. Samples used for preliminary design of microsurfacing asphalt mixtures: (a) pizza sample just after molding, (b) pizza sample after 60 min, (c) sample for ball test.
Applsci 13 07925 g009
Figure 10. Example of the different phases of the consistency test for the microsurfacing asphalt mixture prepared with one of the emulsions: (a) test preparation and (b) final result.
Applsci 13 07925 g010
Figure 11. Preparation of microsurfacing asphalt samples for cohesion test: (a) molds used in the test and (b) samples in the curing process.
Applsci 13 07925 g011
Figure 12. Variation of cohesion values according to the material added to the mixture produced with Emulsion 1.
Applsci 13 07925 g012
Figure 13. Samples’ final appearance after the cohesion test for the selected mixture produced with Emulsion 1.
Applsci 13 07925 g013
Figure 14. Variation of cohesion values according to the material added to the mixture produced with the Emulsion 2.
Applsci 13 07925 g014
Figure 15. Samples’ final appearance after the cohesion test for the selected mixture produced with Emulsion 2.
Applsci 13 07925 g015
Figure 16. Cohesion values for all curing times for better mix designs for both mixtures.
Applsci 13 07925 g016
Figure 17. Samples before (left) and after (right) carrying out the shaking abrasion test.
Applsci 13 07925 g017
Table 1. Result of the affinity test between the basalt aggregate and the studied emulsions.
TimeEmulsion 1Emulsion 2
After 6 h95%90%
After 24 h70%50%
After 48 h50%30%
Table 2. Mixture compositions produced with Emulsion 1 for the cohesion test.
MixtureDesign of the Microsurfacing MixtureCohesion (kgf cm)
Water (%)Cement (%)Emulsion (%)After 30 minAfter 60 min
111%2.5%12%16.4019.06
211%2.5%13%17.1221.11
311%2.0%12%17.7019.89
411%2.0%13%17.3620.74
511%2.0%14%19.1218.22
Table 3. Mixture compositions produced with Emulsion 2 for the cohesion test.
MixtureDesign of the Microsurfacing MixtureCohesion (kgf cm)
Water (%)Cement (%)Emulsion (%)After 30 minAfter 60 min
192.5128.0911.34
292.5138.7413.99
393.01313.4916.04
4103.01312.6816.71
5113.01310.6213.63
6103.01410.3514.88
7103.01210.0213.50
Table 4. Abrasion results for the microsurfacing asphalt mixtures produced with both emulsions studied in this work.
EmulsionSampleVv
(cm3)
Water Absorption
(%)
Abrasion
(%)
Emulsion
1
118.213.591.95
218.013.261.97
318.012.712.21
417.813.482.49
Mean18.013.262.15
Emulsion
2
117.912.220.74
217.312.070.51
317.911.110.49
417.911.730.74
Mean17.811.780.62
Disclaimer/Publisher’s Note: The statements, opinions and data contained in all publications are solely those of the individual author(s) and contributor(s) and not of MDPI and/or the editor(s). MDPI and/or the editor(s) disclaim responsibility for any injury to people or property resulting from any ideas, methods, instructions or products referred to in the content.

