Article

Comparative Analysis of Hybrid-Electric Regional Aircraft with Tube-and-Wing and Box-Wing Airframes: A Performance Study

Department of Civil and Industrial Engineering, University of Pisa, Via G. Caruso 8, 56122 Pisa, Italy
*
Author to whom correspondence should be addressed.
Appl. Sci. 2023, 13(13), 7894; https://doi.org/10.3390/app13137894
Submission received: 29 May 2023 / Revised: 29 June 2023 / Accepted: 3 July 2023 / Published: 5 July 2023

Abstract

:
The continuously expanding transport aviation sector has a significant impact on climate change, and measures must be taken to limit its environmental impact. The study of advanced airframes, which may increase the lift-to-drag ratio and structural efficiency, and the development of innovative high-efficient powertrains, could be a way to achieve air transport decarbonization. This paper explores this broad topic by proposing a classical performance comparison between an aircraft with a traditional tube-and-wing (TW) airframe and a corresponding one with an advanced box-wing (BW) lifting architecture, both equipped with a parallel hybrid-electric powertrain. In fact, the propulsion technologies selected for this comparative study are consistent with the 2035 forecast, and both aircraft concepts are designed to belong to the regional transport category. The comparison between TW and BW is conducted on a conceptual and multi-disciplinary level, offering an analysis of the competitive benefits and limitations in terms of the aerodynamic, structural, and propulsive performance of the two configurations. The metrics selected to make the comparison are related to aircraft performance, such as the structural weight, the block fuel, or the energy required to accomplish the assigned mission. The outcomes obtained highlight the potential of BW airframes coupled with hybrid-electric powertrains to reduce fuel consumption, and hence the related greenhouse gas emissions, because of improvements introduced by this advanced architecture in both the aircraft’s empty weight and energy efficiency.

1. Introduction

The decarbonization of air transport by 2050 is not a negotiable target and, in order to pursue it, breakthrough technological solutions should be adopted, such as the development of unconventional airframes, such as truss braced wings [1,2], the blended wing body [3,4,5,6], and the box-wing (BW) [7,8,9,10], and the integration of innovative propulsion systems, such as hybrid-electric [11,12,13] and hydrogen-based [14,15]. On one hand, unconventional airframes may allow the increase of the lift-to-drag ratio and/or the structural efficiency with respect to state-of-the-art [16,17]; on the other hand, the adoption of innovative hybrid powertrains may enable reductions in fuel consumption and greenhouse gas emissions [18,19,20]. Battery-powered aircraft are suitable for regional aircraft [21,22,23], whereas hydrogen-powered aircraft seem more relevant to medium- and long-range aircraft [24,25].
Electric aircraft are under deep investigation as, ideally, this specific technology can totally suppress flight-related CO2 emissions and reduce noise during close-to-ground operations [26]. Nowadays, the largest barrier to aircraft electrification is the low specific energy density of the batteries: for the current Li-ion batteries, this important index is about 250 Wh/kg at the cell level [27,28], and it is not sufficient to provide enough energy for transport aircraft. Power electronics, electric motors, and batteries are technologically moving forward, and the related technology forecast allows for optimism about the use of electric propulsion on regional transport aircraft [29,30]. Currently, several works are available in the literature reporting the environmental benefits coming from the adoption of different airframes or different propulsion systems, but the coupling of these two technology elements seems to represent the proper step forward to achieve major improvements. In this regard, the authors’ recent review [21] discusses the coupling between the BW airframe concept and the hybrid-electric propulsion system in a regional class aircraft and shows the potential of joining these technology bricks to cut greenhouse gas emissions.
Following these encouraging results, this paper aims to assess a comprehensive performance comparison between a BW and a classical tube-and-wing (TW) hybrid-electric aircraft. In fact, as highlighted in previous works [31,32,33], the BW airframe may represent a more efficient lifting architecture that could introduce different gains to aircraft performance, namely: (i) the optimal design of the BW leads to the minimum induced drag with respect to the corresponding monoplane with the same lift and wingspan; (ii) the lifting system is over-constrained to the fuselage, providing the possibility to exploit this feature to achieve structural mass reductions; (iii) the possibility to design the coupling of the lifting system and fuselage to enlarge the available internal volume, hence providing benefits if there is a necessity to store components with large volumes, such as large battery packs; and (iv) a higher generated lift for the same wingspan as TW, without any penalization in the overall lift-to-drag ratio, hence allowing to efficiently transport larger weights and to comply with current airport apron constraints [7]. The focus of this work is, therefore, on the comparison between a BW and a TW configuration equipped with a hybrid-electric powertrain. In this context, to fairly compare the two configurations, the same assumptions on the propulsion system have been considered, namely: (i) a parallel architecture is selected for the hybrid-electric powertrain; and (ii) the envisioned entry to service is 2035 so that the electric powertrain components performance have been defined to be compliant with the forecast for such a time horizon.
This paper is structured as follows: Section 2 describes the aircraft design methodology, while in Section 3 the performance analysis comparison between a BW and a TW hybrid-electric aircraft is widely discussed. Section 4 presents the results for the optimized aircraft configurations and, finally, Section 5 outlines the conclusions of this research.

2. Methodology

2.1. Overview of Aircraft Design Framework

The design methodology used in this work was implemented in an in-house tool named THEA-CODE (“Tool for Hybrid-Electric Aircraft COnceptual DEsign”), specifically developed to deal with the design of hybrid-electric aircraft. In the following, a brief overview of the methodology is reported, whereas more details can be found in [34,35]. The design process, based on an iterative procedure on the convergence of the MTOW, is composed of a set of interconnected blocks, involving aerodynamic assessment, powertrain sizing, mission simulation, and weight evaluation. The aircraft polar drag curve s evaluated by properly computing induced drag and parasitic drag, as detailed in Section 2.2. The installed power is calculated by means of the matching chart [36,37], which correlates the specific power P/W with the wing loading W/S, taking into account regulation constraints [38]; for hybrid-electric powertrain, by using the matching chart, it is possible to assess the split of the installed power between the electric and the thermal chains, and the related degree of hybridization HP can be defined according to Equation (1):
H P = P i t P i e + P i t
where P i t and P i e   represent the installed power of thermal engine and electric motor, respectively. Consequently, the mission simulation s performed by considering the aircraft point mass equations of motion, taking into account taxi in/out, take-off, climb, cruise, descent, and diversion, to compute the block fuel and the battery mass needed to accomplish the design mission; specific in-depth focus on hybrid-electric mission simulation and performance analysis can be found in [18]. In particular, the general power supply strategy adopted is the following: taxi in/out is accomplished by using only electric power; full thermal and electric power are provided in the take-off phase, whereas the supplied power is split between thermal and electric chain during climb, cruise, and descent according to a designer-specified strategy; and the diversion is accomplished by means of only the thermal power. Finally, the weight breakdown of the aircraft is obtained as described in Section 2.3. Note that the THEA-CODE has not been designed to modify and/or optimize the aircraft geometry, instead, that is an input for the process. In fact, this particular (automatic) tool only allows for homothetically scaling the input geometry by using the wing loading W/S as a scaling factor, as sketched in Figure 1.
The input geometry can be provided by another numerical tool, named AEROSTATE [39,40,41], that allows for designing aircraft lifting systems to optimize lift-to-drag ratio L/D, fulfilling the constraints on longitudinal stability and trim. AEROSTATE, by means of an optimization procedure, whose details are discussed in [40,41], is based on the same aerodynamic solvers described in Section 2.2 and handles all the geometrical parameters describing the lifting system to maximize L/D in a prescribed design point, i.e., the initial point of the cruise phase. The problem of longitudinal stability and trim is properly assessed within the AEROSTATE optimization by the introduction of a set of specific constraints; namely, the lifting system geometry is designed to fulfill a prescribed static margin of stability and to satisfy the pitch trim in cruise without elevator deflection. For the box-wing architecture, these constraints can be satisfied by properly acting on the longitudinal positioning of the two horizontal wings, as well as by managing their sweep angles and other geometrical variables, and, finally, by the proper aerodynamic load distribution between the front and rear wings, as detailed in [41,42]. The input geometry adopted as a reference in this work, both for the BW and the TW configuration, has been optimized by means of AEROSTATE, with the same objective function, constraints, and design space, to assess the performance comparison.

2.2. Aerodynamic Assessment

The aircraft’s polar drag is obtained by evaluating both induced and parasitic drag, where the induced drag is computed by means of a Vortex Lattice Method (VLM) solver, named Athena Vortex Lattice (AVL) [43]. In fact, such a model allows for properly assessing the potential aerodynamic performance of any lifting system, making consistent the comparison between TW and BW. In this context, Figure 2 shows an example of AVL modeling for both configurations studied in this work; for both configurations, the fuselage is replaced with a flat plate resembling its planform [44]; this choice to model the fuselage is an outcome of the work presented in [45], which investigated the accuracy of AVL fuselage modeling among the different possibilities, i.e., doublets distribution, flat plate, and fuselage elimination. The flat plate model resulted in being more accurate for aeromechanics predictions in the longitudinal plane.
On the other hand, the parasitic drag D p is calculated according to the classical component build-up method [46] for both airframes. In particular, the wing, tail, and fin drag are calculated according to Equation (2):
D p = ρ V 2 0 b / 2 C d ( y ) c ( y ) d y
where p is the air density, V is the airspeed, y is a generic spanwise station, c is the chord distribution, and C d is the airfoil drag coefficient evaluated by the classic tool XFOIL [47]. Finally, fuselage and nacelle drag are calculated according to the semi-empirical method proposed in [46].

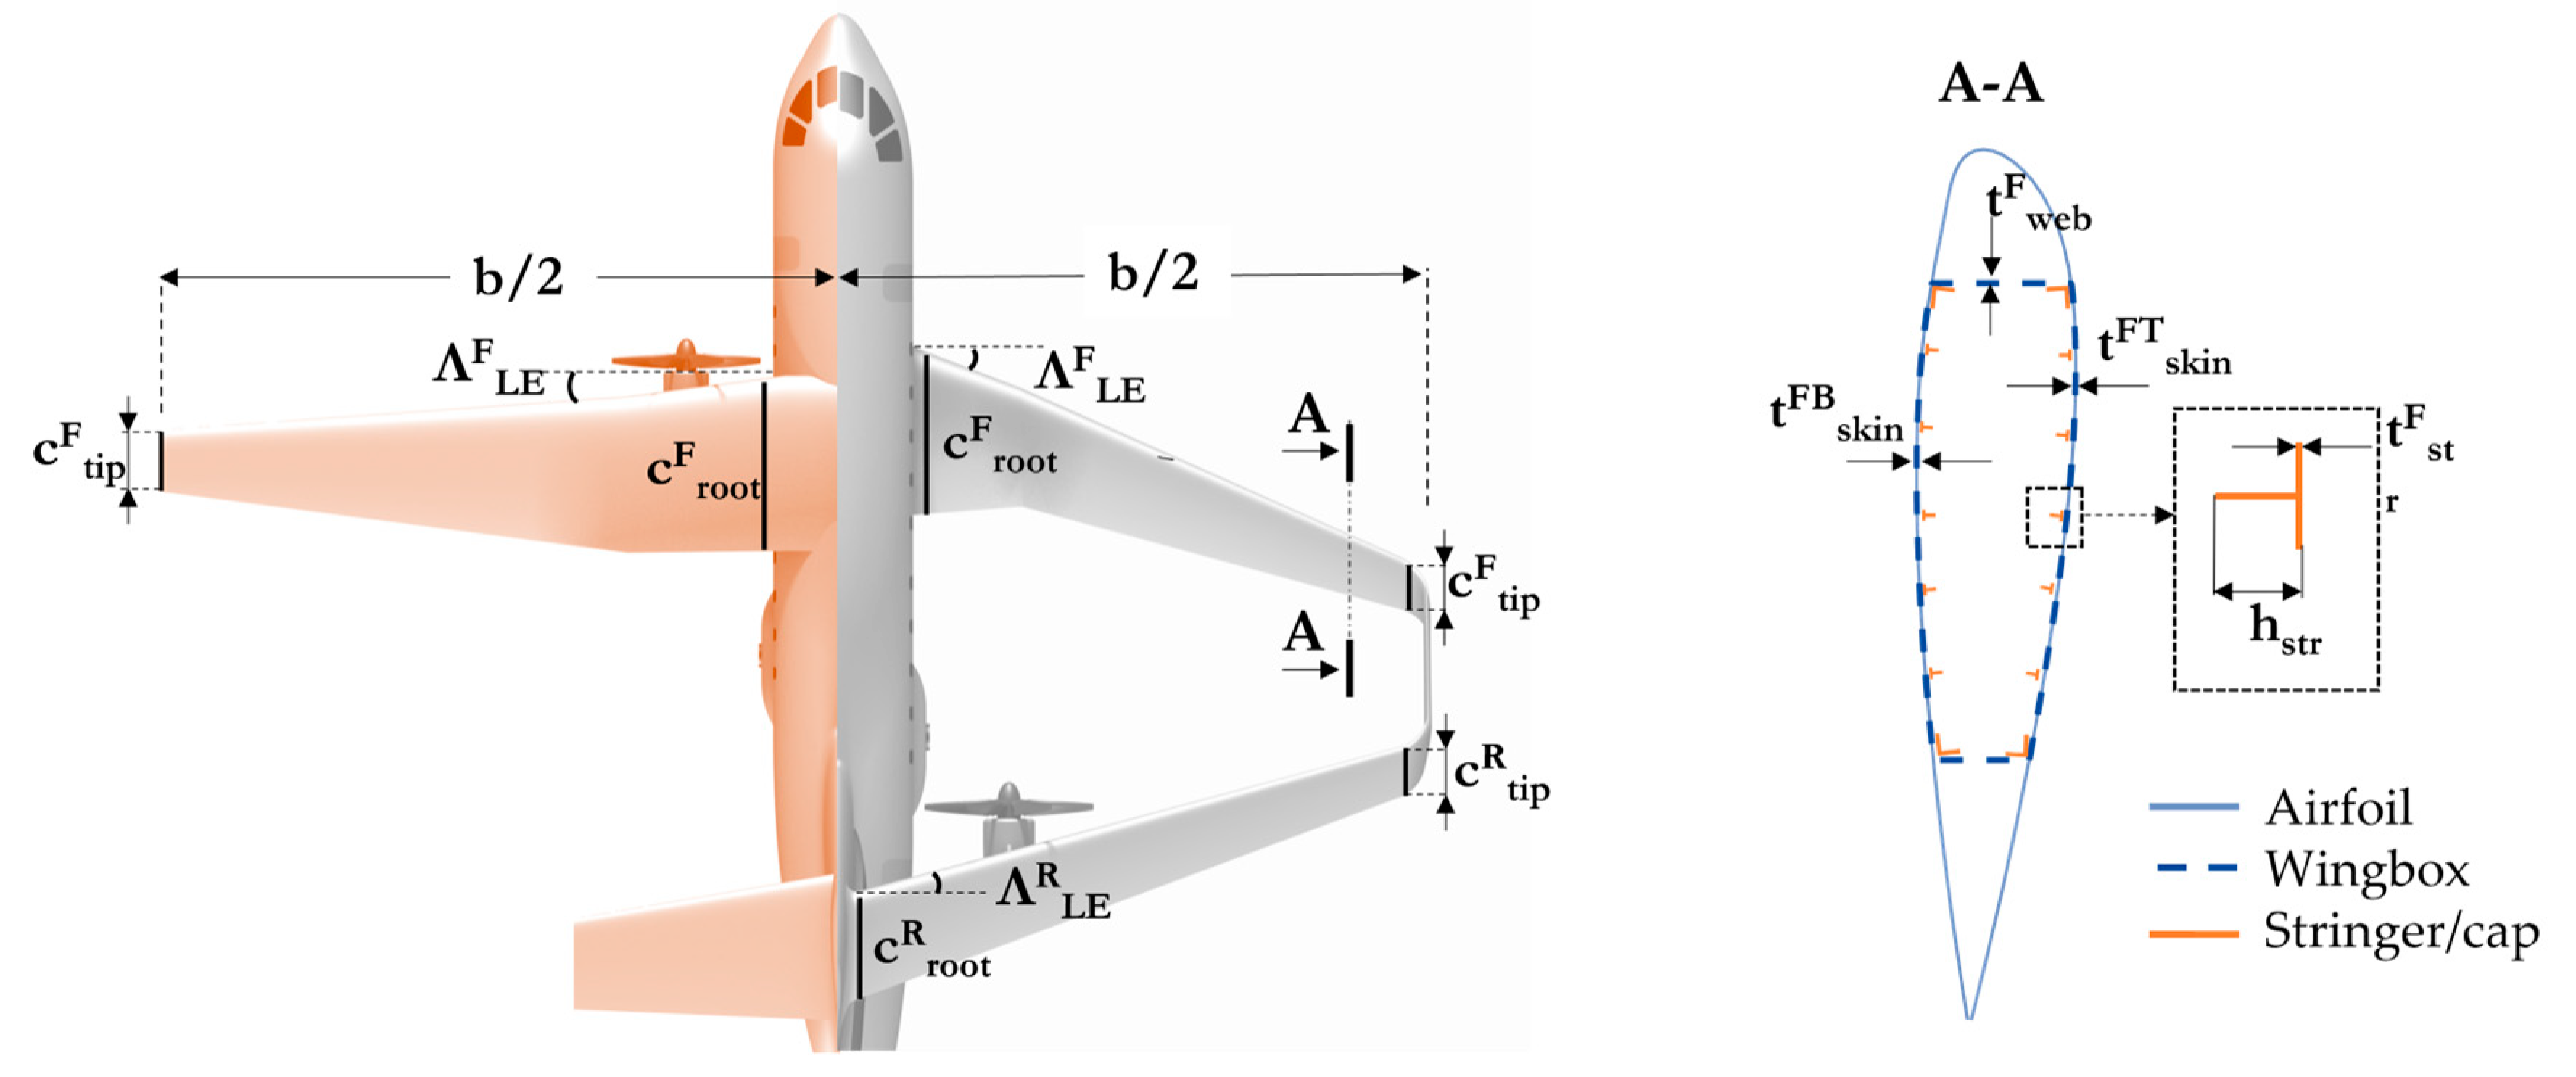
2.3. Weight Breakdown Evaluation

The aircraft weight breakdown is expressed as in Equation (3):
W = ( m st + m w + m sy + m op + m p + m pr + m f + m b ) g
where g is the standard gravity. In particular, the structural mass of fuselage, fin, nacelle, and landing gear ( m st ), the onboard systems mass ( m sy ), and the operating items mass ( m op ) are calculated according to the semi-empirical relations collected in [48], whereas payload mass ( m p ) is evaluated by assuming 95 kg/passenger (including the baggage). The propulsion system mass ( m pr ) is evaluated as a function of the installed specific power obtained through the matching chart for both thermal and electrical power sources, and by using the literature data on their specific power density [49,50], while the fuel ( m f )   and the battery mass ( m b ) are two outputs of the numerical simulation. In particular, the term m st does not include the structural wing mass ( m w ) , which is evaluated by means of a specific structural model developed to estimate the mass of lifting system of both cantilever-wing and BW.
This is of paramount importance in this comparative work, as the two lifting architectures being compared have quite different structural configurations, and using models that are unable to detect such differences could lead to errors in the comparative evaluation. Therefore, it was decided to use physics-based structural mass prediction models starting from a finite element modeling (FEM) of the wings-fuselage assembly. Specifically, the developed structural model exploits metamodeling technique to estimate the structural mass of the lifting system, as this approach allows for obtaining high level of accuracy and low computational cost [51,52], which is an important feature in conceptual assessments; the developed procedure is widely described in [53,54], whereas a brief overview is proposed in the following. The metamodeling process mainly follows these steps: (i) definition of the main design variables and their boundaries, hence identifying an n-dimensional design space; (ii) sampling of the design space by means of a specific technique (e.g., central composite or Latin hypercube) to identify a subset of configurations to be analyzed; (iii) run of FEM simulations for each configuration belonging to the subset; (iv) definition of an interpolative model (e.g., polynomial function or splines) and calculation of its unknown coefficients through fitting models (e.g., least square regression or best linear predictor); and (v) the interpolative model represents a response surface able to predict the output of the physical problem. This procedure has been used to develop a FEM-based metamodel that allows for predicting the lifting system structural mass, without the need to conduct a FEM analysis for each assessed configuration during the conceptual design, hence providing a huge cut of the computation time. Regarding phase (i), geometric and structural design variables defining the lifting system have been selected for both BW and TW, as sketched in Figure 3; due to the different shapes of BW and TW, geometric design variables are different, whereas structural variables defining the wing box are fixed equally for the two architectures.
The FEM simulations to sample the design space have been carried out by means of the software ABAQUS (v 6.14) [55,56] to obtain relevant outputs, such as wing tip displacement (u), maximum equivalent stress on forward (σF) and rear (σR) wing, and wing structural mass. The structural mesh consists of shell and beam elements; shell elements are used to model skins, ribs, and spar webs, whereas beam elements are utilized to model stringers and spar caps. The finite element mesh primarily focuses on the wing-box structure of the wings, excluding the fixed and movable parts of the leading and trailing edges, which are represented as point masses attached to the spar webs by means of surface-based constraint relationships. Only a stress-based static structural assessment has been performed, neglecting buckling and/or aeroelastic loads; specifically, the loading condition is evaluated according to Equation (4), referring to the cruise flight condition:
F Z =   n z   L - n z ( m w + m b + m f ) g
where L is the lift distribution, extracted by AVL (a qualitative distribution is shown in Figure 4), and n z is the load factor fixed equal to 2.5. Battery and fuel weights have been introduced as distributed vertical load according to this assumed layout: for the BW, the two terms m b and m f are placed in the front (60%) and rear (40%) wing, whereas, for TW, the whole masses m b and m f have been placed in the main wing.
The metamodel provides (simplified) interpolated functions that relate the main structural figures of merit (i.e., the values of u, σF, σR, and m w ) to the geometrical x and structural z design variables. These specific (simple) functions allow for setting an optimization problem useful for sizing the structure of the lifting system by minimizing the wing structural mass according to the problem described in Equation (5):
min m w x , z σ F x , z   σ Ys C sf 0 σ R x , z   σ Ys C sf 0 u x , z 0.125 · b 2 0 l b x   u b l b z   u b
where σ Ys 345 Mpa is the yielding stress of Al2024 and C sf 1.5 is a safety factor. Once the geometry of the lifting system is determined, the optimization procedure can act on the structural variables to minimize the structural wing mass. The optimization problem is subject to the following constraints: (i) the maximum equivalent Von Mises stress of both front and rear wing (σF and σR) must be lower than yielding stress of the material scaled by the safety factor; and (ii) the maximum tip displacement u must be lower than 12.5% of the half-wingspan. The optimization problem described in Equation (5) focuses on the minimization of the structural mass of the lifting system; however, non-structural mass has been considered as well in the FE model. The movable surfaces of secondary structures, namely the leading edge and trailing edge, are represented as point masses connected to the primary structures, specifically to the spar webs of the wingbox structure. The determination of these masses has been conducted following the methodology outlined in [57]. Apart from considering the weight of primary and secondary aircraft structures, the finite element (FE) model also incorporates additional masses associated with systems, equipment, and other non-structural components; these miscellaneous masses have been assessed based on the guidelines presented in [58].

2.4. Architectural Assumptions and Design Requirements

In this section, the main design choices on both the TW and BW airframe are described. First, the same fuselage is selected for both configurations and, in particular, both the fuselage shape and internal layout are designed to be similar to the reference regional aircraft ATR-42 [59]. Hence, the TW configuration shows a high wing attached to the upper part of the fuselage, engines and propellers installed on the main wing, and a T-tail configuration for the horizontal and vertical tailplanes; see Figure 5 left. The BW lifting system shows a front wing attached to the low part of the fuselage and a rear wing attached to the fin (see Figure 5 right); engines and propellers are mounted below the rear wing, as the low front wing does not guarantee enough clearance between propellers and runway during ground operations. For both configurations, the main landing gear is in fuselage sponsons. The selected hybrid-electric powertrain architecture is the parallel one.
Regional hybrid-electric aircraft have been designed to fulfill the following top-level aircraft requirements, set to be comparable to reference ATR-42 [59,60]: a number of passengers equal to 40, a design range of 600 nm flown at Mach 0.4 and at an altitude of 6100 m, and a take-off and landing required field of 1100 m. To provide a benchmark for quantitative performance comparison assessments, a thermal-powered regional aircraft has also been designed according to the same TLARs and the same methodology proposed in Section 2.1; this reference TW exhibits the features reported in Table 1.

3. Performance Comparison

This section presents a general assessment of the performance comparison between the TW and the BW regional hybrid-electric aircraft. The comparison is proposed following a wide sensitivity analysis, performed by varying the design variables summarized in Table 2 and taking into account the block fuel m fb as the main figure of merit (FoM).
The design variables selected have an impact on the powertrain sizing and on the aerodynamic and structural performance of the aircraft. In particular, the value of HP defines the share between the electric and thermal installed power, while Φ CR t and Φ CL t , named the supplied thermal power fractions, are defined according to Equations (6) and (7):
Φ CR t = P CR t P i t
Φ CL t = P CL t P i t
where P CR t and P CL t are the thermal power supplied in cruise and climb, respectively. Accordingly, the terms Φ CR t and Φ CL t   indicate the share of the supplied power from the thermal engines, and consequently allow for also estimating the electric supplied power, as the requested power is known in each instant of the mission. Finally, the wing loading W/S has a direct impact on the matching chart, on the aerodynamic performance, on the geometry scaling of the lifting system, on the field performance, and on the structural weight. The selected values of the design variables used to perform the sensitivity analysis, reported in Table 2, allow for generating a set of 103 configurations for both the TW and the BW airframes. The technological parameters related to the electric components, in terms of specific energy or power, have been selected according to the 2035 time frame horizon forecast [21], and the selected values are reported in Table 3.
The results of the sensitivity analysis are reported in 2D plots, where the x-axis reports the MTOW of the designed configuration, and the y-axis reports the selected FoM. Each point of the chart represents a designed configuration with the tool THEA-CODE.

3.1. Block Fuel Comparison

Figure 6 shows the results in terms of block fuel consumption of each designed configuration for both BW and TW. The results have been split into either wingspan groups, as this parameter may be crucial for aircraft operativity features. Indeed, having a wingspan smaller than 24 m (hence, being compatible with ICAO Aerodrome Code ‘B’ [61]) can expand the number of accessible regional airports [60]; this factor holds significance in the regional market scenario as it enables the exploration of new routes and uncharted opportunities [62].
Considering configurations where b < 24 m, a disparity between the BW and the TW emerges, as only a few hybrid-electric TW configurations were identified since increases in the MTOW trigger rapid increases in the (TW) wingspan. Conversely, considering the same MTOWs, several BW configurations comply with the ICAO ‘B’ constraint, as the higher lifting capability of the BW system allows for generating the same lift requiring a smaller wingspan. A second main outcome from the trends in Figure 6 indicates that both aircraft can reduce fuel consumption by increasing the MTOW, as a higher MTOW implies the possibility to embark on a higher battery mass, hence reducing fuel consumption, consistent with the detailed findings presented in the recent authors’ work [21]. From Figure 6, it is also evident that the BW configurations exhibit lower absolute values of block fuel and a larger slope of the block fuel reduction compared to the TW configurations. This aspect is also illustrated in Figure 7, which presents the statistical analysis of the block fuel output for both BW and TW, providing a comprehensive overview of the dataset: For each dataset, the chart showcases the median, lower, and upper quartiles, as well as the minimum and maximum values. In this context, the analysis reveals that the maximum value of the interquartile range for BW configurations is lower than the minimum value for TW configurations: this outcome emphasizes that a significant majority of BW configurations burn less fuel compared to TW aircraft.
This specific outcome is related to three main aspects: (i) the lower structural mass of the BW lifting system; (ii) its higher lift-to-drag ratio; and (iii) a better usage of the hybrid-electric propulsion system, as detailed in the following.

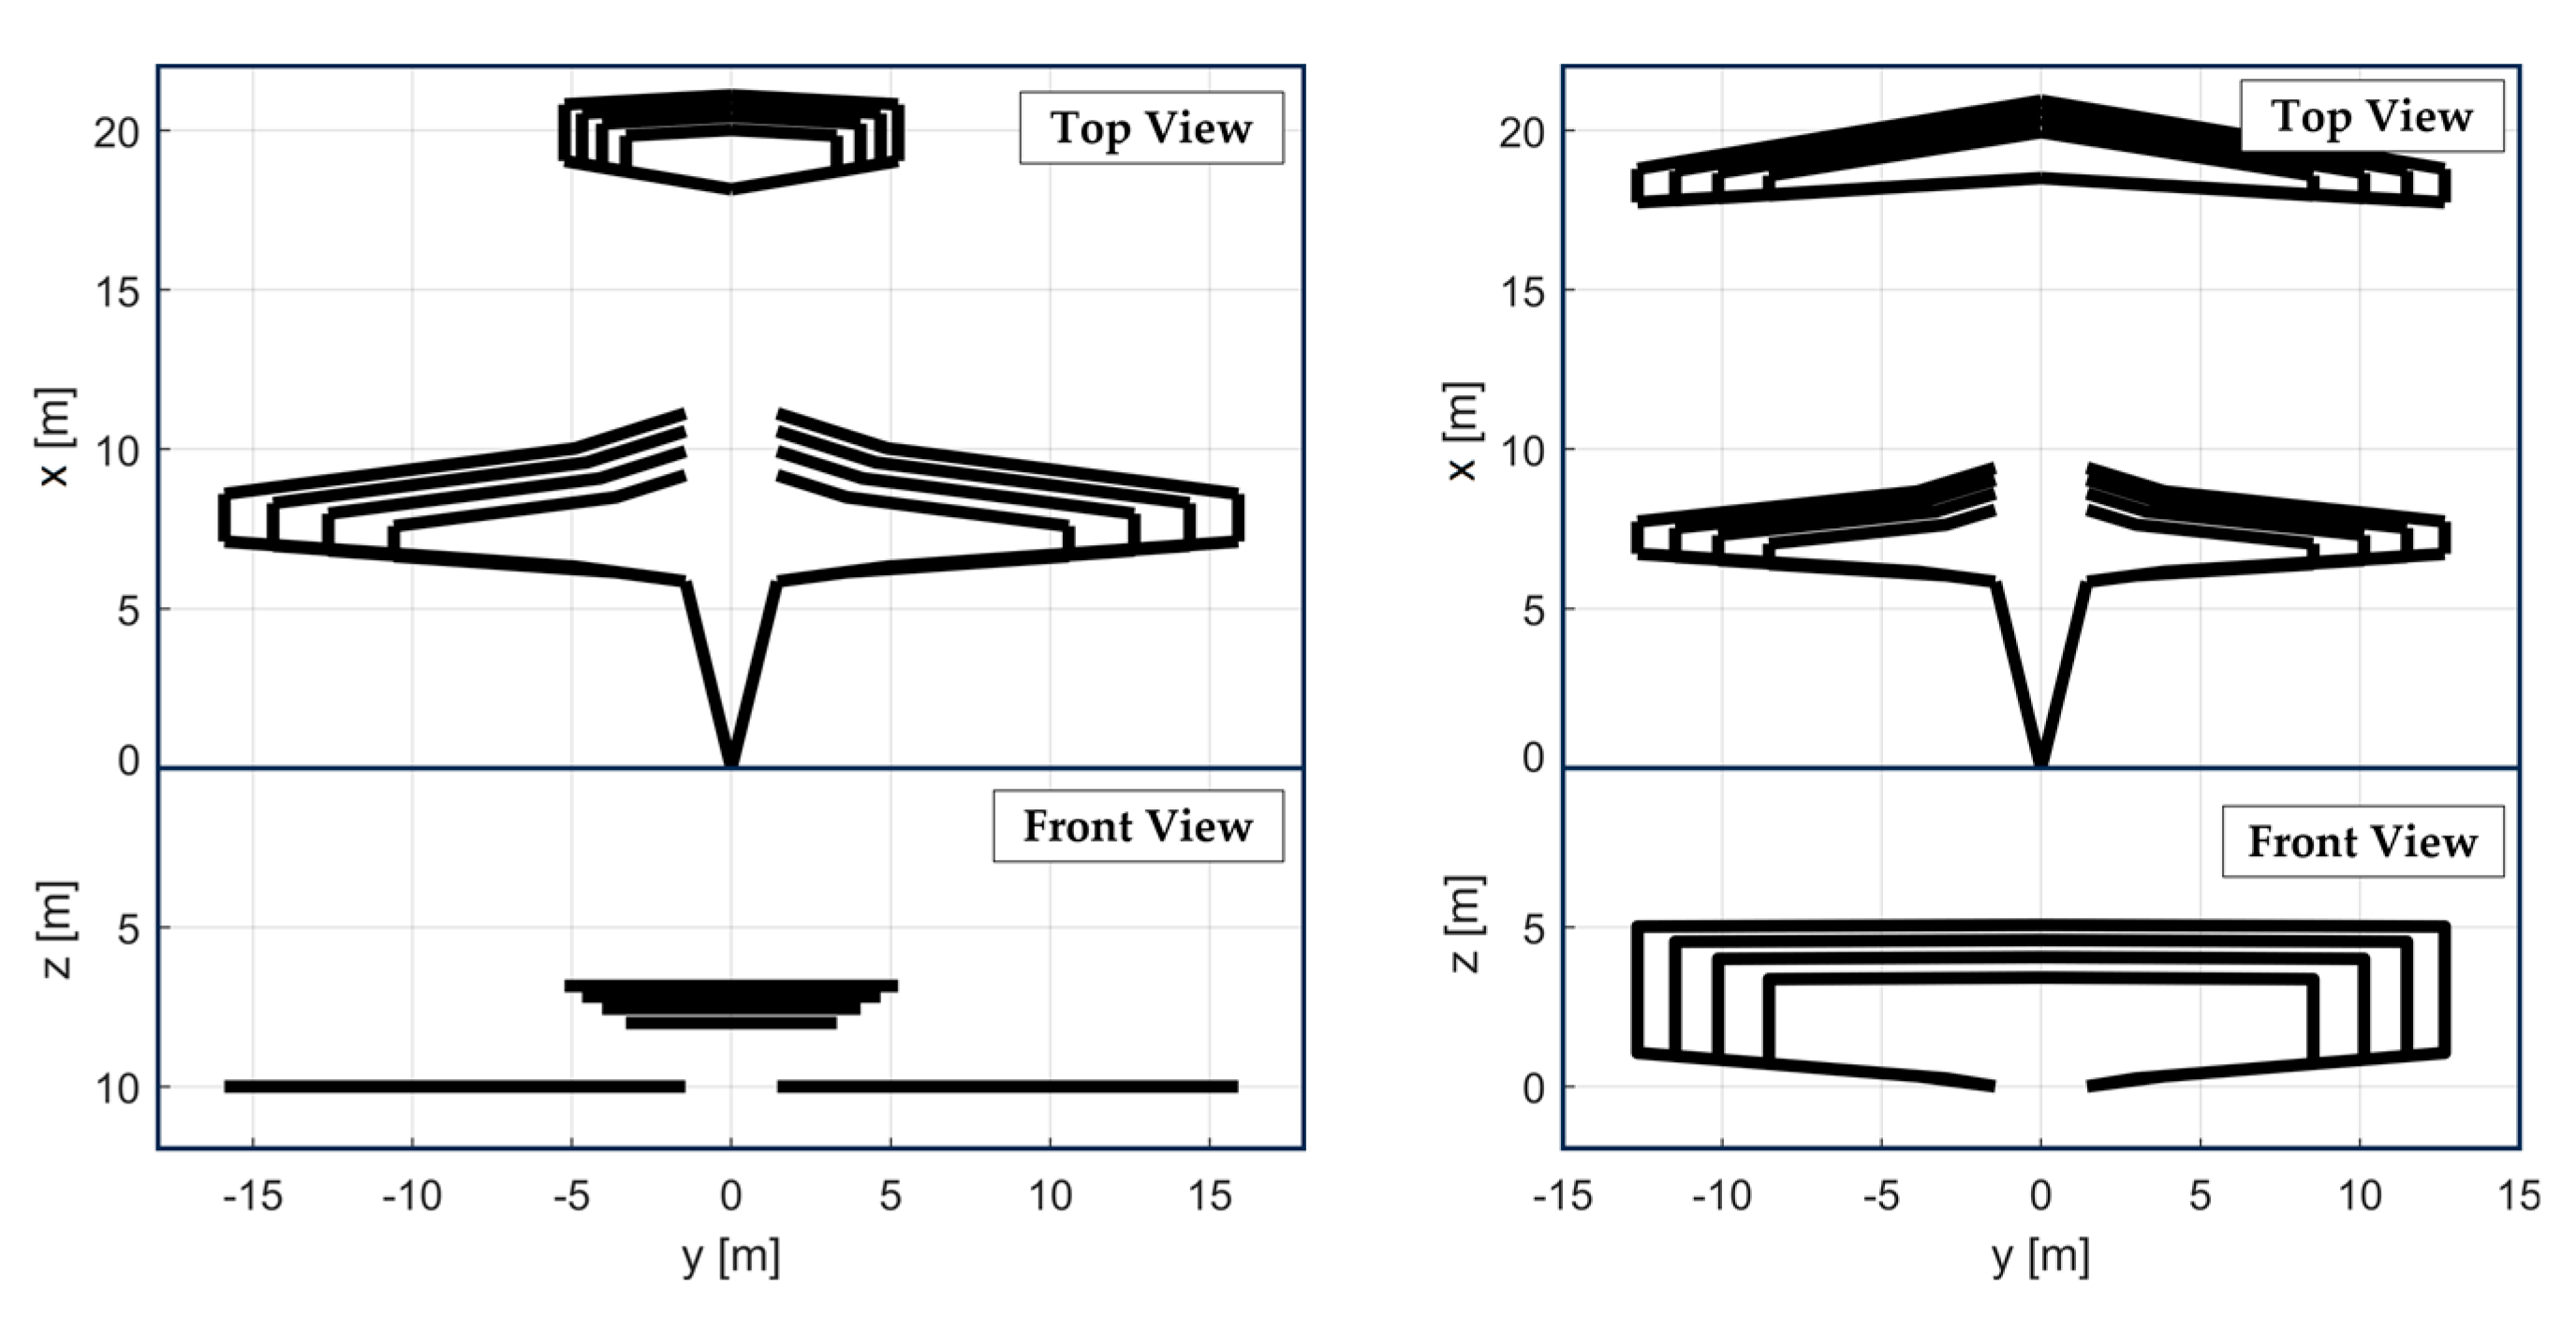
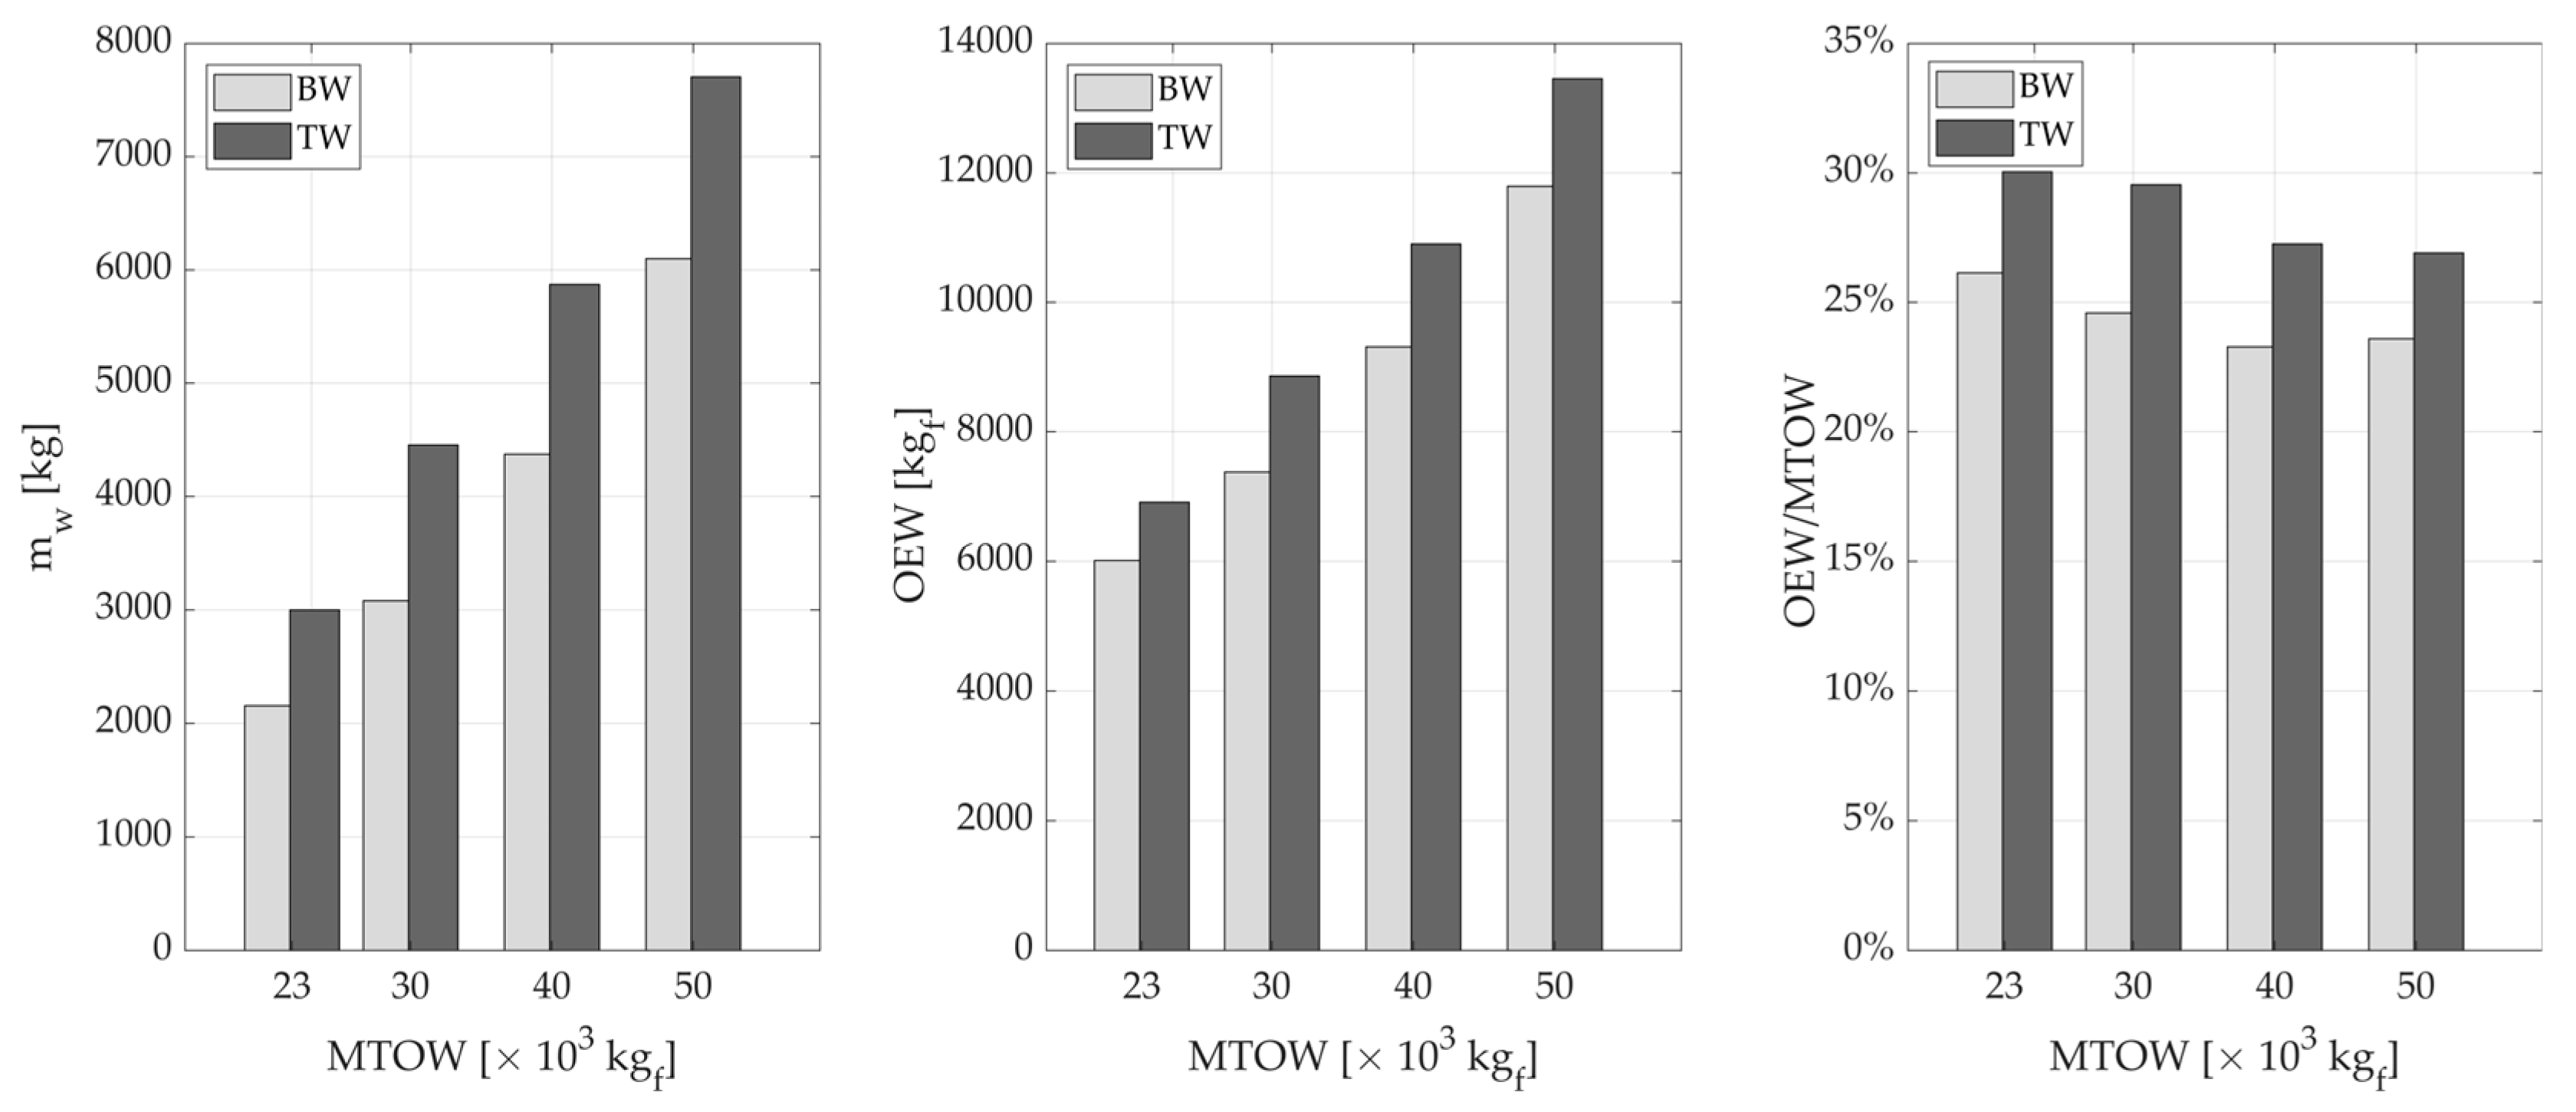
3.1.1. Lifting System Structural Mass

The statistical extrapolation of the mass breakdown of the lifting system subcomponents, i.e., the front wing ( m w f ), rear wing ( m w r ), and tip wing ( m w b ), of the configurations designed in the sensitivity analysis is reported in Figure 8. It is worth noting that the terms front and rear wing are suitable for BW architecture, whereas, in the case of TW, the term front wing refers to the main wing and the term rear wing refers to the tail. The results show:
(i) Lifting functions: For the TW, the trim lift must be generated by the main wing only, whereas, for the BW, the trim lift is generated by both the front and rear wings; thus, the main wing of the TW, considering similar wing loadings, is larger in surface, in span, and undergoes higher bending loading than the individual horizontal wings of the BW. Furthermore, the static condition of the main wing of the TW is different than that of the BW lifting system, as the first is a cantilever structure, whereas the BW is over-constrained to the fuselage. The smaller wingspan combined with the different structural assembly, and the lower lift acting on each individual wing, allow for reducing the internal forces acting on the lifting system (e.g., bending moment) and designing thinner and lighter structural components with respect to TW. Accordingly, the BW front wing structure, which is the one that carries the largest part of the trim wing loading (on average about 60%, as demonstrated in [63]), is significantly lighter than the TW main wing; see the left part of Figure 8.
(ii) Longitudinal stability and trim functions: For the TW, these functions are typically allocated to the combination of wing-tail design, whereas, for the BW, these functions are inherently provided by the horizontal wings. Hence, the TW needs an additional component with respect to the BW (i.e., the horizontal tailplane), introducing weight penalties.
(iii) Structural connections: BW needs vertical joint tip wings to provide proper structural connections between the front and rear wings, and to provide the aerodynamic shape required for the optimal BW lift distribution. In this case, is the BW that needs an additional component with respect to the TW, hence introducing weight penalties; see the right part of Figure 8.
The sum of the different contributions previously described turns out to generally provide overall lifting system structural weight reductions for the BW; see Figure 9. Having a less severe loading condition for the lifting system structure, and incorporating lifting, stability, and trim functions in a unique component, introduce structural benefits that overcome the penalization due to the presence of the vertical tip wings.
Reductions in the lifting system structural mass, hence in the operating empty weight OEW, have a direct beneficial impact on the reduction in block fuel. Let us consider Equations (8) and (9):
BED m b η ec + FED m fb η tc =   E fly
( m b +   m fb +   m fd +   m p ) g   + OEW = MTOW
The fuel and the battery stored on board must provide the energy required to accomplish the mission E fly ; looking at Equation (9), considering a fixed MTOW, it results that a higher OEW leads to a lower available mass of the energy sources ( m b +   m fb ). A lower mass of energy sources, to allow Equation (8) to be satisfied, implies an increase in m fb and a decrease in m b , as the fuel energy density FED is one order of magnitude higher than BED. To qualitatively assess this effect, Equations (8) and (9) have been plotted in a m b - m fb chart (Figure 10) considering a fixed value of MTOW; this chart highlights how if the aircraft OEW increases, the solution moves toward higher block fuel and a lower battery mass.

3.1.2. Lift-to-Drag Ratio

In the following, a general comparison of the aerodynamic performance of BW and TW is provided, taking the lift-to-drag ratio L/D as the performance metric. The comparison in terms of L/D is shown in Figure 11 left, for each configuration designed in this sensitivity study, and in Figure 11 right in the form of the corresponding statistical analysis. The general outcome is that the BW configurations exhibit a higher L/D than the TW aircraft, while Figure 11 right highlights that the BW dataset achieved from the sensitivity analysis exhibits the median and the interquartile range median is 2.4% higher than the TW dataset, and the interquartile range is 1% lower.
Improvements in L/D imply reductions of E fly , and, consequently, reductions in block fuel. An analysis of the drag breakdown, in terms of induced and parasitic contributions (Figure 12), is discussed in the following to highlight the aerodynamic differences between the TW and BW configurations designed within the sensitivity analysis.
Induced drag for the BW is generally higher than the TW (Figure 12a); this result seems counterintuitive since it is well-known the BW can minimize the induced drag. Nevertheless, it is worth noting that this result is achieved if the comparison is carried out assuming the same wingspan and lift, whereas comparing lifting systems with different wingspans results in different outcomes than that of the best wing system theory. To clarify this concept, we recall the definition of induced drag for BW ( D ind BW ) [31], which is given by Equation (10):
D ind BW = L 2 π q ( b BW ) 2 1 2 + v 12 2
where q is the dynamic pressure, bBW is the BW wingspan, and v 12 is the parameter that quantifies the mutual interactions of the wings, defined as follows:
v 12 = 1 8 log 1 + b BW h w 2
where hw is the vertical gap between the front and rear wing. The induced drag of a monoplane can be written as follows:
D ind TW = L 2 π q ( b TW ) 2
If the value of the MTOW is the same for both architectures, then the total trim lift is also the same. Exploiting Equations (10) and (12), it is possible to derive the following inequality which, if satisfied, establishes if BW’s induced drag is higher than the TW one:
1 2 + v 12 2 > b BW b TW 2
The statistical analysis of the term b BW b TW 2 for the configurations designed in this sensitivity analysis is reported in Figure 13; the term v 12 0.41 since the hw/b ratio is 0.2 for each BW aircraft; accordingly, the first member of the inequality (13) is about 0.7, which is always higher than the term b BW b TW 2 . Therefore, the BW induced drag is higher than the TW for the considered designs. It is worth noting that this result does not influence the Oswald factor, which remains higher in the case of the BW configuration.
Nevertheless, the BW configurations show, on average, a higher cruise L/D; this is due to the prevailing contribution of the BW wing parasitic drag reductions with respect to the TW (Figure 12b). Being the same fuselage shape, the combination of the main wing and tail wetted surfaces is always higher than those of the BW designed in this study case, as shown in Figure 14, and this contribution overcomes the induced drag penalization previously discussed. In this sensitivity study, however, the effect of L/D on block fuel reductions resulted in being much less important than that of the OEW reductions, which instead is predominant.

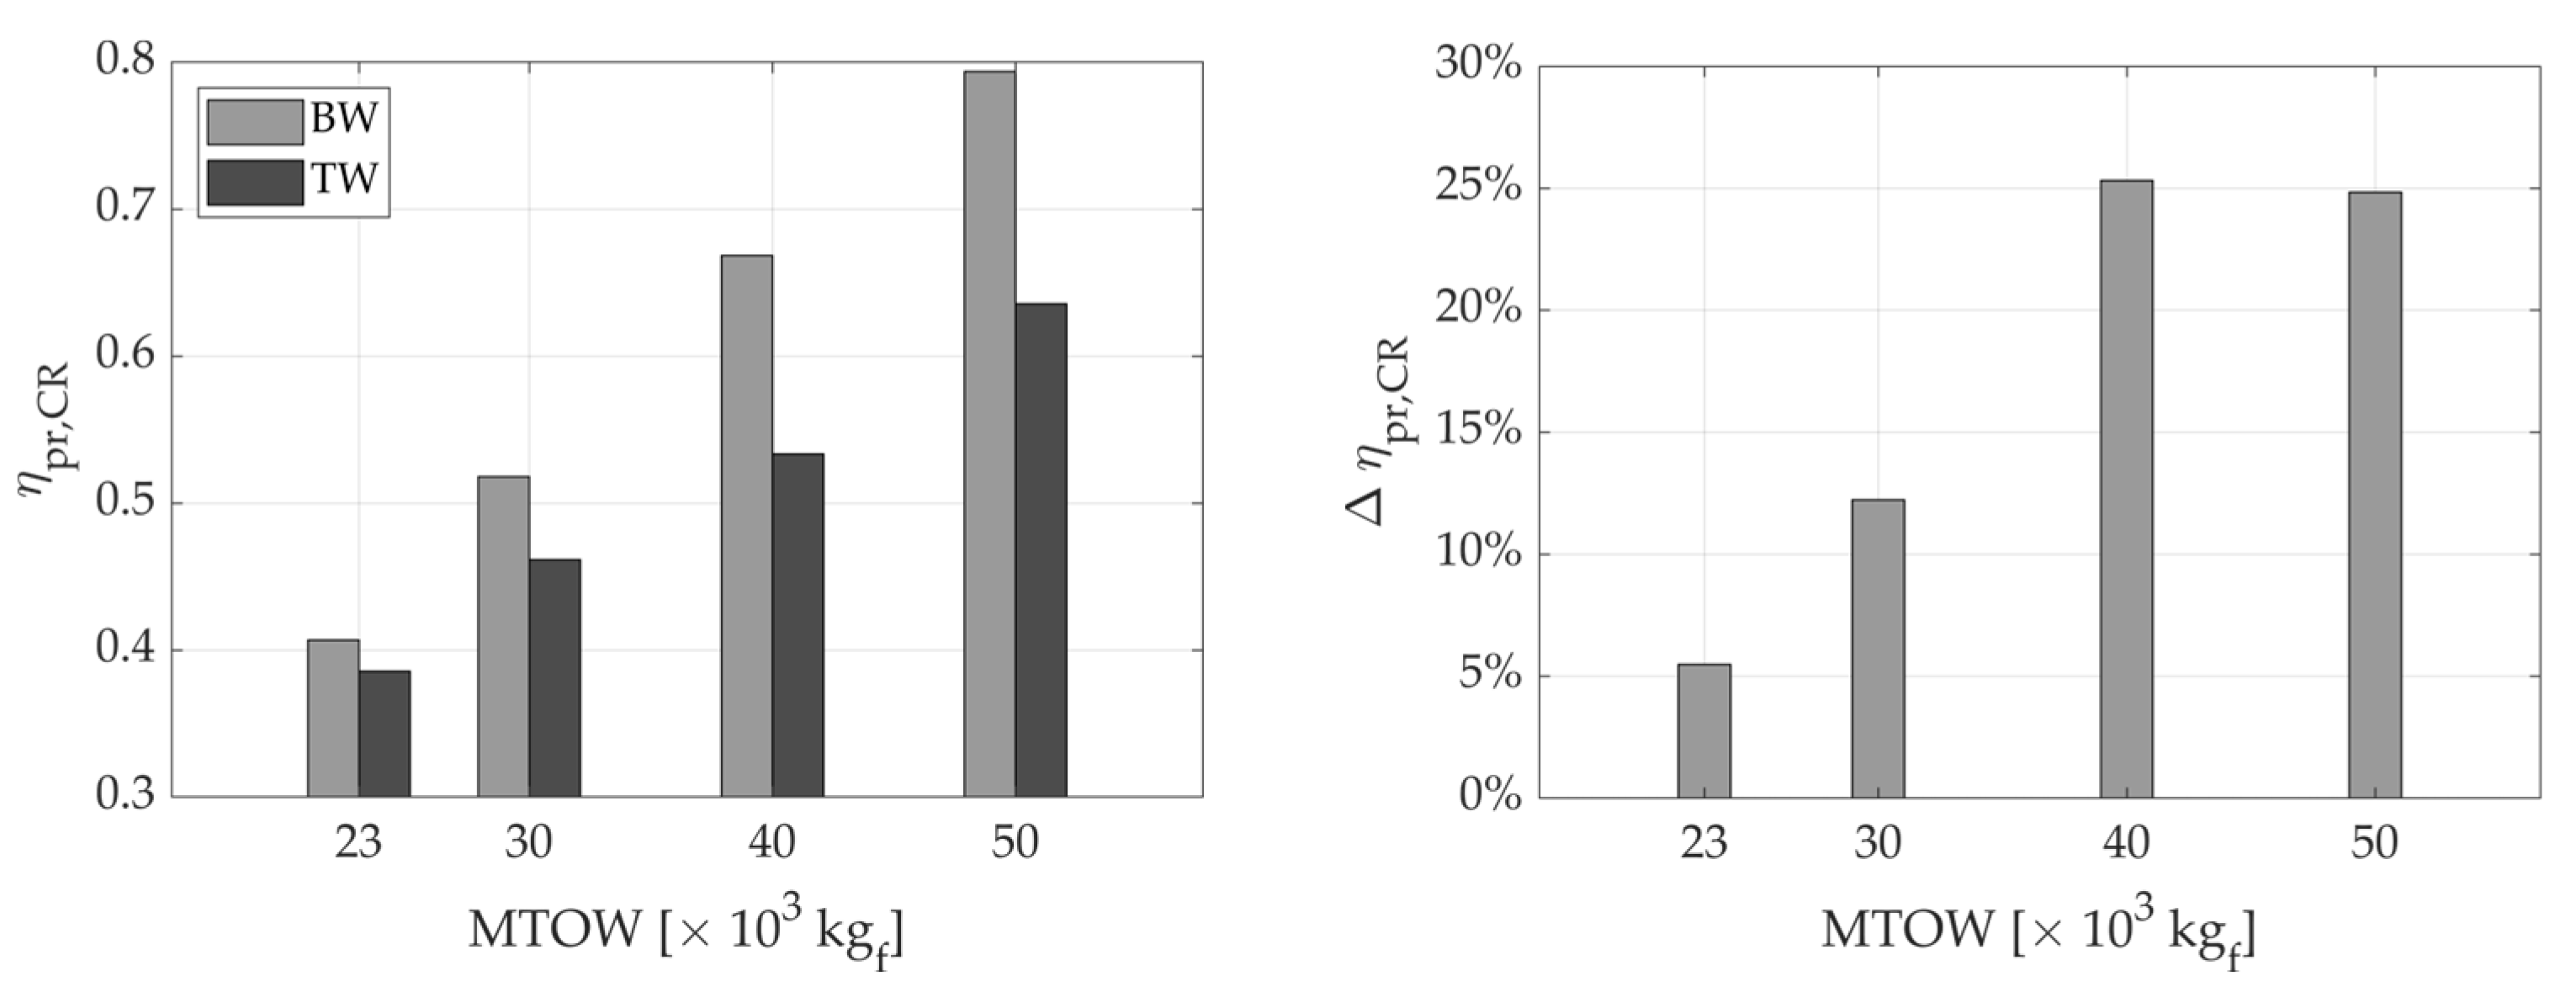
3.1.3. Powertrain Efficiency

The average powertrain efficiency η pr   during the mission can be defined according to Equation (14):
η pr = E p E s
where E s is the amount of energy supplied during the operating mission by battery and fuel, and E p is the energy effectively supplied to the propeller considering the powertrain losses E l , as sketched in Figure 15.
Figure 16 shows that, for the same MTOW, the BW configurations exhibit a higher propulsive efficiency. This is due to the concatenation of two aspects; first, the lower OEW at the MTOW allows the BW configurations to embark on a larger number of batteries, as discussed in Section 3.1. Consequently, this aspect favors a higher utilization of the electrical power chain of the hybrid powertrain, which exhibits a higher efficiency than the thermal one, resulting in higher overall efficiency, as discussed extensively in the authors’ recent work [21]. The higher utilization of the electrical power chain thus reflects in two distinct effects: first, for the same MTOW, the supplied thermal power fractions are lower for the BWs, or, the other way around, for the same supplied thermal power fractions, correspond in a lower MTOW as shown in Figure 17; second, the higher propulsive efficiency introduces an additional contribution to the reduction in fuel consumption.

4. Hybrid-Electric Aircraft Design Optimization

4.1. Optimization Framework

In Section 3, the comparison between BW and TW has been performed by discussing the overall output of a sensitivity analysis, based on the sampling of the design space with four relevant design variables, namely HP, W/S, Φ CR t , and Φ CL t . The sensitivity analysis allowed for extracting some relevant trends between the FoMs and design variables, and to generally frame the comparison between the two configurations. However, this approach does not allow for specifically designing the best configuration to assess in detail the performance of a designed aircraft; to perform this, starting from the design space previously described, an optimization procedure has been set up to specifically design the optimal BW and TW configurations and to perform a direct comparison between the two aircraft. The FoM selected as the objective function to minimize is the block fuel, the design variables are again HP, W/S, Φ CR t , and Φ CL t , (and also the thermal power fraction for the descent Φ DE t ), but the design space is expanded to the whole feasible space, hence providing a wider exploration than that of the sensitivity analysis; two constraints have been imposed into the procedure, namely: (i) the electric supplied power fraction Φ i e during the mission must not exceed its maximum continuous value to avoid electric motors overheating, and (ii) the MTOW must not exceed a threshold value. This latter constraint has been varied into the interval MTOWmax = [23 30 40 50] × 103 kgf to identify the different optimal configurations, as MTOW is heavily impactful on the hybrid-electric aircraft design, as discussed in Section 3. The aircraft design procedure is the same as discussed in Section 2; the optimization problem formulation is reported in Equation (15):
min m fb x l b < x < u b M T O W   MTOW max Φ i e Φ max e
The optimization framework searches for the optimal aircraft configuration by means of a local gradient-based algorithm, specifically the sequential quadratic programming, whose general description can be found in [64,65]. Since local algorithms cannot find the global minima, a multi-start procedure has been adopted to search for a set of local minima by initializing multiple local optimizations from different starting points and, finally, extracting the best solution. The optimization procedure has been implemented within the MATLAB environment.

4.2. Results of the Optimization

Table 4 reports the main results related to the optimal BW and TW configurations; the last two columns report the percentage difference of m fb with respect to the thermal TW benchmark described in Table 1.
As expected from the output of the sensitivity analysis, the BW configurations show better performance in terms of block fuel consumption with respect to the TW; the discrepancy increases as the MTOW increases. Figure 18 shows the mass breakdown of the BW and TW optima; the increase of OEW for the TW is related to the higher mass of the TW lifting system, as discussed in Section 3.1.1. For these optimal solutions, the ΔOEW ranges from 900 kg to 1660 kg between TW and BW.
The reduction of block fuel depends also on two different aspects: the higher L/D and the better usage of the propulsion system, depicted in Figure 19 and Figure 20, respectively. Figure 19 top reports a comparison between BW and TW of the energy required to accomplish the climb (left) and the cruise (right); it is observed that the BW exhibits a reduction in energy consumption of about 1.5% in the climb and 4% in cruise. This is also due to the highest L/D ratio of the BW configurations; indeed, as reported in Figure 19 bottom, the BW exhibits an L/D higher than the corresponding TWs, of about 2% in the climb and 4.5% in cruise. The overall energy saving allows for improving BW fuel reduction.
Figure 20 shows that the BW powertrain utilization is better than the TW aircraft, as η pr is 25% higher than the TW aircraft in cruise; this contributes to reducing the energy loss in the powertrain and reducing fuel consumption.
Another interesting comparison is regarding the aircraft dimension, specifically the wingspan, which is a fundamental aspect considering airport apron compliance. According to ICAO [61], each apron is regulated to host aircraft with a prescribed maximum wingspan. The reference categories for the aircraft studied in this work are ICAO Aerodrome Reference Code ‘B’, which limits the wingspan to up to 24 m, and Code ‘C’, which limits the wingspan to up to 36 m. Figure 21 shows the sketch of the planform of the optimal BW (first row) and TW (second row) configurations; for each MTOW, the TW wingspan is higher than the BW one. As commented in Section 3.1.1, this is due to the fact that for TW, only the front wing generates the trim lift, whereas, for the BW configurations, the trim lift is split between two lifting surfaces. Accordingly, since non-dimensional parameters (i.e., the aspect ratio) are similar for the lifting surfaces of both architectures, the TW exhibits a higher wingspan to achieve the same lift.
Table 5 resumes the comparison between BW and TW in terms of wingspan for each MTOW category; the BW airframe, in conjunction with the performance gains, offers an operative advantage when compared with the TW architecture. In particular:
  • If the hybrid-electric propulsion is exploited to cut block fuel as much as possible, hence increasing MTOW, the BW configuration is compatible with the aprons of category ‘C’; this category is the most widespread in the airport infrastructure [66]. The competitor hybrid-electric TW is not able to fulfill the constraint of category ‘C’; it is compatible with category ‘D’, which is usually devoted to aircraft that transport a high number of passengers a long distance, hence limiting the integration of this configuration in the regional aviation market.
  • If the hybrid-electric propulsion is exploited to mitigate the fuel consumption without exceeding the current weight reference of regional aircraft, BW is compatible with the aprons belonging to category ‘B’, while the TW hybrid-electric aircraft wingspan is not compatible with ICAO ‘B’.
To have a more comprehensive view of the comparison of BW and TW, the aircraft performance has been analyzed in the pax-range diagram according to the methodology proposed in [18]. Figure 22 shows the maps of block fuel to accomplish the mission for a given number of passengers and a fixed range. A very relevant aspect of this performance analysis is that all the BW configurations can achieve lower fuel consumption than the corresponding TWs throughout the entire operational envelope. The areas highlighted in bright green represent those with absolute minimum fuel consumption, i.e., where there is fuel consumption only in the take-off phase (which is not subject to optimization, as specified in Section 2), and hence there is only electric power supply during the in-flight operations. The 50 × 103 kgf BW configuration has an almost completely optimal operational envelope in terms of fuel consumption. The block fuel of the BW at 23 × 103 kgf, within the operating envelope analyzed, is averagely comparable with the TW performance at 30 × 103 kgf for a range lower than 450 nm and with the TW performance at 40 × 103 kgf for a range higher than 450 nm: this highlights the fundamental advantages coming from the coupling of BW architecture and hybrid-electric propulsion.

5. Conclusions

In this paper, a comparative analysis of the performance of hybrid-electric regional aircraft with tube-and-wing and box-wing airframes has been presented. This conceptual study involved a multi-disciplinary investigation, with the aim of identifying the performance differences mainly in terms of fuel consumption, and of detecting the main architectural features influencing the comparison. The main result of this comparative study shows that hybrid-electric box-wing configurations can exhibit substantial gains in terms of fuel consumption reduction; this result is mainly driven by the possibility of designing box-wing lifting systems that can have a lower structural mass for the same MTOW than the corresponding tube-and-wing aircraft. This reduction in structural mass derives from the possibility of distributing the lifting load on both the horizontal wings, which are more compact, as well as over-constrained to the fuselage; these characteristics alleviate the static load that the wing structures must support, favoring the design of thinner and, therefore, lighter structures. Furthermore, the box-wing lifting system inherently fulfills the functions of stability and longitudinal trim, thus not requiring an additional component, such as the horizontal tailplane. The box wing also exhibits advantages in terms of lift-to-drag ratio and propulsive efficiency, which have less impact on the overall fuel consumption gain.
The results presented in this paper outline the general possibility of introducing performance advantages for hybrid-electric aircraft with box-wing architecture compared to the corresponding tube-and-wing; this proposed conceptual study paves the way for more in-depth and higher fidelity analyses on the crucial issues of the comparison. For example, given the central role of the structural mass of the lifting system, it is conceivable to increase the quality of such a comparison by also including in the structural sizing procedure the constraints deriving from other loading conditions, such as those relating to aeroelastic loads.

Author Contributions

Conceptualization, G.P. and K.A.S.; methodology, G.P. and K.A.S.; software, G.P. and K.A.S.; validation, G.P. and K.A.S.; formal analysis, G.P. and K.A.S.; investigation, G.P. and K.A.S.; resources, G.P. and K.A.S.; data curation, G.P. and K.A.S.; writing—original draft preparation, G.P. and K.A.S.; writing—review and editing, A.A.Q.; visualization, G.P. and K.A.S.; supervision, G.P., K.A.S. and A.A.Q.; funding acquisition, A.A.Q. All authors have read and agreed to the published version of the manuscript.

Funding

This research is partly supported by the University of Pisa, Progetti di Ricerca di Ateneo (Grant no. PRA_2022_1).

Data Availability Statement

The data presented in this study are available on request from the authors G.P. and K.A.S.

Conflicts of Interest

The authors declare no conflict of interest.

List of Symbols and Acronyms

List of SymbolsDescriptionUnit
bWingspanm
cAirfoil chordm
CdAirfoil drag coefficient
CsfSafety factor
DindInduced dragkgf
DpParasitic dragkgf
EflyEnergy to accomplish the missionJ
ElEnergy lost in the propulsion systemJ
EpEnergy supplied to propellerJ
EsEnergy supplied by the source of energyJ
FzVertical net force on lifting systemkgf
gStandard gravitym/s2
HPDegree of hybridization
hwVertical gap between front and rear wingm
LLiftkgf
L/DLift-to-drag ratio
lbUpper bound vector
mbBattery masskg
mfFuel masskg
mfbBlock fuel masskg
mfdDiversion fuel masskg
mopOperating masskg
mprPropulsion system masskg
mstStructural masskg
msyOnboard systems masskg
mwWing masskg
m w b Tip wing masskg
m w f Forward wing masskg
m w r Rear wing masskg
nzVertical load factor
P/WSpecific powerW/kgf
P i e Electric motor installed powerW
P i t Thermal engine installed powerW
PtSupplied thermal powerW
qDynamic pressurePa
uWing tip vertical displacementm
ubLower bound vector
VAirspeedm/s
v12Mutual wing interaction parameter
WAircraft weightkgf
W/SWing loadingkgf/m2
ηecEfficiency electric chain
ηprPropulsion system efficiency
ηtcEfficiency thermal chain
ρAir densitykg/m3
σFMaximum stress on forward wingMPa
σRMaximum stress on rear wingMPa
σYsYielding stress of Al2024MPa
ΦePower fraction supplied by the electric motor
ΦtPower fraction supplied by the thermal engine
List of AcronymsDescriptionUnit
BEDGravimetric battery energy densityWh/kg
BWBox-wing
FEDGravimetric fuel energy densityWh/kg
FoMFigure of merit
MTOWMaximum take-off weightkgf
OEWOperative empty weightkgf
TWTube and wing

References

  1. Hosseini, S.; Vaziri-Zanjani, M.A.; Ovesy, H.R. Conceptual design and analysis of an affordable truss-braced wing regional jet aircraft. Proc. Inst. Mech. Eng. Part G J. Aerosp. Eng. 2020; in press. [Google Scholar] [CrossRef]
  2. Harrison, N.A.; Gatlin, G.M.; Viken, S.A.; Beyar, M.; Dickey, E.D.; Hoffman, K.; Reichenbach, E.Y. Development of an Efficient M = 0.80 Transonic Truss-Braced Wing Aircraft. In Proceedings of the AIAA Scitech Forum, Orlando, FL, USA, 6–10 January 2020. [Google Scholar] [CrossRef]
  3. Karpuk, S.; Liu, Y.; Elham, A. Multi-Fidelity Design Optimization of a Long-Range Blended Wing Body Aircraft with New Airframe Technologies. Aerospace 2020, 7, 87. [Google Scholar] [CrossRef]
  4. Chen, Z.; Zhang, M.; Chen, Y.; Sang, W.; Tan, Z.; Li, D.; Zhang, B. Assessment on critical technologies for conceptual design of blended-wing-body civil aircraft. Chin. J. Aeronaut. 2019, 32, 1797–1827. [Google Scholar] [CrossRef]
  5. Okonkwo, P.; Smith, H. Review of evolving trends in blended wing body aircraft design. Prog. Aerosp. Sci. 2016, 82, 1–23. [Google Scholar] [CrossRef]
  6. Zhu, W.; Fan, Z.; Yu, X. Structural mass prediction in conceptual design of blended-wing-body aircraft. Chin. J. Aeronaut. 2019, 32, 2455–2465. [Google Scholar] [CrossRef]
  7. Abu Salem, K.; Cipolla, V.; Palaia, G.; Binante, V.; Zanetti, D. A Physics-Based Multidisciplinary Approach for the Preliminary Design and Performance Analysis of a Medium Range Aircraft with Box-Wing Architecture. Aerospace 2021, 8, 292. [Google Scholar] [CrossRef]
  8. Bravo-Mosquera, P.D.; Cerón-Muñoz, H.D.; Catalano, F.M. Design, aerodynamic analysis and optimization of a next-generation commercial airliner. J. Braz. Soc. Mech. Sci. Eng. 2022, 44, 609. [Google Scholar] [CrossRef]
  9. Andrews, S.A.; Perez, R.E. Comparison of box-wing and conventional aircraft mission performance using multidisciplinary analysis and optimization. Aerosp. Sci. Technol. 2018, 79, 336–351. [Google Scholar] [CrossRef]
  10. Gagnon, H.; Zingg, D.W. Aerodynamic Optimization Trade Study of a Box-Wing Aircraft Configuration. J. Aircr. 2016, 53, 971–981. [Google Scholar] [CrossRef] [Green Version]
  11. Brelje, B.J.; Martins, J.R. Electric, hybrid, and turboelectric fixed-wing aircraft: A review of concepts, models, and design approaches. Prog. Aerosp. Sci. 2018, 104, 1–19. [Google Scholar] [CrossRef]
  12. Pornet, C.; Isikveren, A. Conceptual design of hybrid-electric transport aircraft. Prog. Aerosp. Sci. 2015, 79, 114–135. [Google Scholar] [CrossRef]
  13. Marciello, V.; Orefice, F.; Nicolosi, F.; Ciliberti, D.; Della Vecchia, P. Design of hybrid-electric aircraft with fault-tolerance considerations. Chin. J. Aeronaut. 2023, 36, 160–178. [Google Scholar] [CrossRef]
  14. Khandelwal, B.; Karakurt, A.; Sekaran, P.R.; Sethi, V.; Singh, R. Hydrogen powered aircraft: The future of air transport. Prog. Aerosp. Sci. 2013, 60, 45–59. [Google Scholar] [CrossRef]
  15. Baroutaji, A.; Wilberforce, T.; Ramadan, M.; Olabi, A.G. Comprehensive investigation on hydrogen and fuel cell technology in the aviation and aerospace sectors. Renew. Sustain. Energy Rev. 2019, 106, 31–40. [Google Scholar] [CrossRef] [Green Version]
  16. Cavallaro, R.; Demasi, L. Challenges, Ideas, and Innovations of Joined-Wing Configurations: A Concept from the Past, an Opportunity for the Future. Prog. Aerosp. Sci. 2016, 87, 1–93. [Google Scholar] [CrossRef]
  17. Bravo-Mosquera, P.D.; Catalano, F.M.; Zingg, D.W. Unconventional aircraft for civil aviation: A review of concepts and design methodologies. Prog. Aerosp. Sci. 2022, 131, 100813. [Google Scholar] [CrossRef]
  18. Palaia, G.; Abu Salem, K. Mission Performance Analysis of Hybrid-Electric Regional Aircraft. Aerospace 2023, 10, 246. [Google Scholar] [CrossRef]
  19. Hoelzen, J.; Liu, Y.; Bensmann, B.; Winnefeld, C.; Elham, A.; Friedrichs, J.; Hanke-Rauschenbach, R. Conceptual Design of Operation Strategies for Hybrid Electric Aircraft. Energies 2018, 11, 217. [Google Scholar] [CrossRef] [Green Version]
  20. Sahoo, S.; Zhao, X.; Kyprianidis, K. A Review of Concepts, Benefits, and Challenges for Future Electrical Propulsion-Based Aircraft. Aerospace 2020, 7, 44. [Google Scholar] [CrossRef] [Green Version]
  21. Abu Salem, K.; Palaia, G.; Quarta, A.A. Review of hybrid-electric aircraft technologies and designs: Critical analysis and novel solutions. Prog. Aerosp. Sci. 2023, in press. [Google Scholar]
  22. Abu Salem, K.; Palaia, G.; Quarta, A.A.; Chiarelli, M.R. Medium-Range Aircraft Conceptual Design from a Local Air Quality and Climate Change Viewpoint. Energies 2023, 16, 4013. [Google Scholar] [CrossRef]
  23. Marciello, V.; Di Stasio, M.; Ruocco, M.; Trifari, V.; Nicolosi, F.; Meindl, M.; Lemoine, B.; Caliandro, P. Design Exploration for Sustainable Regional Hybrid-Electric Aircraft: A Study Based on Technology Forecasts. Aerospace 2023, 10, 165. [Google Scholar] [CrossRef]
  24. Verstraete, D. Long range transport aircraft using hydrogen fuel. Int. J. Hydrog. Energy 2013, 38, 14824–14831. [Google Scholar] [CrossRef]
  25. Clean Sky 2. Hydrogen-Powered Aviation a Fact-Based Study of Hydrogen Technology, Economics, and Climate Impact by 2050; Report, Clean Sky 2 Joint Undertaking; Clean Sky 2 Publication Office: Luxembourg, 2020. [Google Scholar] [CrossRef]
  26. Riboldi, C.E.; Trainelli, L.; Mariani, L.; Rolando, A.; Salucci, F. Predicting the effect of electric and hybrid-electric aviation on acoustic pollution. Noise Mapp. 2020, 7, 35–56. [Google Scholar] [CrossRef]
  27. Löbberding, H.; Wessel, S.; Offermanns, C.; Kehrer, M.; Rother, J.; Heimes, H.; Kampker, A. From Cell to Battery System in BEVs: Analysis of System Packing Efficiency and Cell Types. World Electr. Veh. J. 2020, 11, 77. [Google Scholar] [CrossRef]
  28. Xue, N.; Du, W.; Martins, J.; Shyy, W. Lithium-Ion Batteries: Thermomechanics, Performance, and Design Optimization. In Encyclopedia of Aircraft Engineering, Green Aviation; Cambridge University Press: Cambridge, UK, 2015. [Google Scholar] [CrossRef]
  29. Dever, T.P.; Duffy, K.P.; Provenza, A.J.; Loyselle, P.L.; Choi, B.B.; Morrison, C.R.; Lowe, A.M. Assessment of Technologies for Noncryogenic Hybrid Electric Propulsion; NASA/TP-2015-216588; National Technical Information Service: Alexandria, VA, USA, 2015. [Google Scholar]
  30. Zhang, H.; Li, X.; Zhang, H. Li–S and Li–O2 Batteries with High Specific Energy; Springer: Singapore, 2017; pp. 1–48. [Google Scholar] [CrossRef]
  31. Frediani, A.; Montanari, G. Best wing system: An exact solution of the Prandtl’s problem. In Variational Analysis and Aerospace Engineering; Springer Optimization and Its Applications; Springer: Berlin/Heidelberg, Germany, 2009; Volume 33. [Google Scholar] [CrossRef]
  32. Frediani, A.; Cipolla, V.; Rizzo, E. The PrandtlPlane Configuration: Overview on Possible Applications to Civil Aviation. In Variational Analysis and Aerospace Engineering: Mathematical Challenges for Aerospace Design; Springer Optimization and Its Applications; Springer: Boston, MA, USA, 2012; Volume 66. [Google Scholar] [CrossRef]
  33. Cipolla, V.; Abu Salem, K.; Picchi Scardaoni, M.; Binante, V. Preliminary design and performance analysis of a box-wing transport aircraft. In Proceedings of the AIAA Scitech Forum, Orlando, FL, USA, 6–10 January 2020. [Google Scholar] [CrossRef]
  34. Palaia, G. Design and Performance Assessment Methodologies for Box-Wing Hybrid-Electric Aircraft from Urban to Regional Transport Applications. Ph.D. Thesis, University of Pisa, Pisa, Italy, 2022. Available online: https://etd.adm.unipi.it/t/etd-11092022-150110/ (accessed on 28 May 2023).
  35. Palaia, G.; Zanetti, D.; Abu Salem, K.; Cipolla, V.; Binante, V. THEA-CODE: A design tool for the conceptual design of hybrid-electric aircraft with conventional or unconventional airframe configurations. Mech. Ind. 2021, 22, 19. [Google Scholar] [CrossRef]
  36. Fioriti, M. Adaptable conceptual aircraft design model. Adv. Aircr. Spacecr. Sci. 2014, 1, 43–67. [Google Scholar] [CrossRef]
  37. Sforza, P.M. Commercial Airplane Design Principles; Elsevier: Amsterdam, The Netherlands, 2014. [Google Scholar] [CrossRef]
  38. FAA. FAR 25, Airworthiness Standards: Transport Category Airplanes; FAA: Washington, DC, USA, 1980.
  39. Cappelli, L.; Costa, G.; Cipolla, V.; Frediani, A.; Oliviero, F.; Rizzo, E. Aerodynamic optimization of a large PrandtlPlane configuration. Aerotec. Missili Spaz. 2016, 95, 163–175. [Google Scholar] [CrossRef] [Green Version]
  40. Rizzo, E.; Frediani, A. Application of Optimisation Algorithms to Aircraft Aerodynamics. In Variational Analysis and Aerospace Engineering; Springer Optimization and Its Applications; Springer: New York, NY, USA, 2009; Volume 33. [Google Scholar] [CrossRef]
  41. Abu Salem, K.; Palaia, G.; Cipolla, V.; Binante, V.; Zanetti, D.; Chiarelli, M. Tools and methodologies for box-wing aircraft conceptual aerodynamic design and aeromechanic analysis. Mech. Ind. 2021, 22, 39. [Google Scholar] [CrossRef]
  42. Abu Salem, K.; Palaia, G.; Quarta, A.A.; Chiarelli, M.R. A comprehensive conceptual analysis of the stability and controllability of box-wing aircraft. Aerosp. Sci. Technol. 2023. under review. [Google Scholar]
  43. Drela, M.; Youngren, H. AVL 3.36 User Primer, Online Software Manual. 2017. Available online: https://perma.cc/R35R-W29F (accessed on 28 May 2023).
  44. Cipolla, V.; Abu Salem, K.; Bachi, F. Preliminary stability analysis methods for PrandtlPlane aircraft in subsonic conditions. Aircr. Eng. Aerosp. Technol. 2019, 91, 525–537. [Google Scholar] [CrossRef] [Green Version]
  45. Zanetti, D. Studio Preliminare Della Dinamica Libera e Delle Qualità di Volo Della Configurazione PrandtlPlane, (Transl. “Pre-liminary Study of the Flight Dynamics and Handling Qualities of the PrandtlPlane Configuration”). Master’s Thesis, University of Pisa, Pisa, Italy, 2014. Available online: https://etd.adm.unipi.it/theses/available/etd-09172014-114441/ (accessed on 28 May 2023).
  46. Raymer, P. Aircraft Design: A Conceptual Approach; AIAA Education Series: Washington, DC, USA, 1992; ISBN 0-930403-51-7. [Google Scholar]
  47. Drela, M.; Youngren, H. XFOIL 6.9 User Primer, Online Software Manual. 2001. Available online: https://web.mit.edu/drela/Public/web/xfoil/ (accessed on 28 May 2023).
  48. Wells, D.P.; Horvath, B.L.; McCullers, L.A. The Flight Optimization System Weights Estimation Method. NASA Technical Reports. 2017. Available online: https://ntrs.nasa.gov/citations/20170005851 (accessed on 28 May 2023).
  49. Bolam, R.C.; Vagapov, Y.; Anuchin, A. A review of electrical motor topologies for aircraft propulsion. In Proceedings of the 55th International Universities Power Engineering Conference (UPEC), Torino, Italy, 1–4 September 2020; pp. 1–6. [Google Scholar]
  50. Alvarez, P.; Satrustegui, M.; Elosegui, I.; Martinez-Iturralde, M. Review of High Power and High Voltage Electric Motors for Single-Aisle Regional Aircraft. IEEE Access 2022, 10, 112989–113004. [Google Scholar] [CrossRef]
  51. Wang, G.G.; Shan, S. Review of Metamodeling Techniques in Support of Engineering Design Optimization. J. Mech. Des. 2006, 129, 370–380. [Google Scholar] [CrossRef]
  52. Simpson, T.W.; Poplinski, J.D.; Koch, P.N.; Allen, J.K. Metamodels for Computer-based Engineering Design: Survey and recommendations. Eng. Comput. 2001, 17, 129–150. [Google Scholar] [CrossRef] [Green Version]
  53. Cipolla, V.; Abu Salem, K.; Palaia, G.; Binante, V.; Zanetti, D. A DoE-based approach for the implementation of structural surrogate models in the early stage design of box-wing aircraft. Aerosp. Sci. Technol. 2021, 117, 106968. [Google Scholar] [CrossRef]
  54. Palaia, G.; Abu Salem, K.; Cipolla, V.; Zanetti, D.; Binante, V. A DoE-based scalable approach for the preliminary structural design of Box-Wing aircraft from regional to medium range categories. In Proceedings of the AIAA SciTech 2023 Forum, National Harbor, MD, USA, 23–27 January 2023. [Google Scholar] [CrossRef]
  55. Dassault Systèmes Simulia Corp. ABAQUS User Manual, v 6.14; Dassault Systèmes Simulia Corp: Johnston, RI, USA, 2014. [Google Scholar]
  56. Scardaoni, M.P.; Binante, V.; Cipolla, V. WAGNER: A new code for parametrical structural study of fuselages of civil transport aircraft. Aerotec. Missili Spaz. 2017, 96, 136–147. [Google Scholar] [CrossRef] [Green Version]
  57. Torenbeek, E. Development and Application of a Comprehensive, Design Sensitive Weight Prediction Method for Wing Structures of Transport Category Aircraft; Report LR-693; Delft University of Technology, Faculty of Aerospace Engineering: Delft, The Netherlands, 1992. [Google Scholar]
  58. Beltramo, M.N.; Trapp, D.L.; Kimoto, B.W.; Marsh, D.P. Parametric Study of Transport Aircraft Systems Cost and Weight; NASA-CR-151970; NASA: Greenbelt, MD, USA, 1977.
  59. ATR. ATR 42-600 Aircraft. Available online: https://www.atr-aircraft.com/our-aircraft/atr-42-600/ (accessed on 28 May 2023).
  60. Eisenhut, D.; Moebs, N.; Windels, E.; Bergmann, D.; Geiß, I.; Reis, R.; Strohmayer, A. Aircraft Requirements for Sustainable Regional Aviation. Aerospace 2021, 8, 61. [Google Scholar] [CrossRef]
  61. ICAO. Annex 14, Aerodromes: Volume I—Aerodrome Design and Operations. In International Standards and Recommended Practices; Technical Reports AN14-1; International Civil Aviation Organization: Montreal, QC, Canada, 2022. [Google Scholar]
  62. ATR. Connecting the Future. Turboprop Market Forecast 2018–2037. Available online: http://www.atr-aicraft.com/wp-content/uploads/2020/09/2018-MarketForecast_Digital.pdf (accessed on 28 May 2023).
  63. Abu Salem, K. Development of Design Tools and Methods for Box-Wing Airplanes and Application of the PrandtlPlane Concept to a Short-Medium Range Aircraft. Ph.D. Thesis, University of Pisa, Pisa, Italy, 2021. Available online: https://etd.adm.unipi.it/theses/available/etd-05312021-171241/ (accessed on 28 May 2023).
  64. Fletcher, R. Practical Methods of Optimization; John Wiley & Sons: Hoboken, NJ, USA, 2013; ISBN 978-1-118-72318-0. [Google Scholar]
  65. Martins, J.R.; Ning, A. Engineering Design Optimization; Cambridge University Press: Cambridge, UK, 2021; ISBN 978-1108833417. [Google Scholar]
  66. Bishop, K. Assessment of the Ability of Existing Airport Gate Infrastructure to Accommodate Transport Category Aircraft with Increased Wingspan for Improved Fuel Efficiency. Master’s Thesis, Department of Aeronautics and Astronautics, Massachusetts Institute of Technology, Boston, MA, USA, 2012. Available online: http://hdl.handle.net/1721.1/76095 (accessed on 28 May 2023).
Figure 1. Scaled geometries of a TW (left) and a BW (right) configuration.
Applsci 13 07894 g001
Figure 2. AVL model of TW (left) and BW (right) configurations.
Applsci 13 07894 g002
Figure 3. Geometrical (left) and structural (right) design variables identifying the lifting system.
Applsci 13 07894 g003
Figure 4. Conceptual sketch of the lift distribution in a BW (left) and a TW (right) configuration.
Applsci 13 07894 g004
Figure 5. Artistic view of a classical TW (left) and a BW (right) configuration.
Applsci 13 07894 g005
Figure 6. Block fuel vs. MTOW for the designed configuration; BW (left) and TW (right).
Applsci 13 07894 g006
Figure 7. Statistical analysis of m fb for BW and TW dataset.
Applsci 13 07894 g007
Figure 8. Statistical analysis of the structural mass of the lifting system for the BW and TW datasets.
Applsci 13 07894 g008
Figure 9. Comparison of the lifting system mass between BW and TW datasets.
Applsci 13 07894 g009
Figure 10. m b - m fb chart varying OEW.
Applsci 13 07894 g010
Figure 11. L/D vs. MTOW chart (left) and related statistical analysis (right) of BW and TW.
Applsci 13 07894 g011
Figure 12. Average values of induced (a) and parasitic drag (b) vs. MTOW for BW and TW.
Applsci 13 07894 g012
Figure 13. Statistical output for the b BW / b TW 2 parameter.
Applsci 13 07894 g013
Figure 14. Wetted surface of lifting systems of BW and TW configurations.
Applsci 13 07894 g014
Figure 15. Simplified sketch of energy transmission chain for parallel hybrid-electric powertrain.
Applsci 13 07894 g015
Figure 16. Propulsive efficiency vs. MTOW for BW and TW configurations.
Applsci 13 07894 g016
Figure 17. Statistics of MTOW of BW and TW datasets for ϕ CR t equal to 0.55 (left) and 0.45 (right).
Applsci 13 07894 g017
Figure 18. Structural mass breakdown of optimal configurations.
Applsci 13 07894 g018
Figure 19. Energy (top) and L/D (down) in cruise (right) and climb (left).
Applsci 13 07894 g019
Figure 20. Powertrain efficiency (left) and percentage difference (right) during cruise phase.
Applsci 13 07894 g020
Figure 21. Wingspan comparison between BW and TW configurations.
Applsci 13 07894 g021
Figure 22. Pax-range diagram BW and TW diagram considering block fuel as FoM.
Applsci 13 07894 g022
Table 1. Main features of the thermal powered TW benchmark.
Applsci 13 07894 i001Reference Thermal Powered TW
Wingspan24 m
Length21.9 m
Wing surface49.2 m2
Tail surface6.9 m2
MTOW16,020 kgf
OEW10,702 kgf
Payload40 × 95 kgf
Total fuel @ 600 nm1479 kgf
Block fuel @ 600 nm1155 kgf
ICE power2 × 2167 kW
Table 2. Range of design parameters.
Design ParameterRange Value
HP[0.1, 0.2, 0.3, 0.4, 0.5]
W/S [kgf/m2][255, 265, 275, 285, 295, 305, 315, 325]
Φ CR t [0.35, 0.40, 0.45, 0.50, 0.55]
Φ CL t [0.35, 0.40, 0.45, 0.50, 0.55]
Table 3. Selected electric chain parameters.
Electric ComponentSpecific Power/EnergyEfficiency
Battery500 Wh/kg0.96
Electric motor13 kW/kg0.96
Inverter19 kW/kg0.98
Wire352 kWm/kg0.99
Table 4. Data of hybrid-electric optimal configurations with BED = 500 Wh/kg.
Design VariablesConstraintObj.
(W/g)/S [kgf/m2]HP Φ C L i c e Φ C R i c e Φ D E i c e MTOWMAX [kg]mfb [kg]Δ% mfb
TagBWTWBWTWBWTWBWTWBWTWBWTWBWTWBWTW
23t3203250.380.270.230.330.350.330.170.2222,97622,962705907−39−21
30t3143050.400.390.150.290.210.300.160.3030,11730,000523816−55−29
40t3113250.590.450.190.110.130.200.150.1340,13239,913320631−72−45
50t3093250.460.400.110.130.010.100.100.1150,16050,019113525−90−55
Table 5. BW and TW compatibility of each designed configuration with ICAO requirements.
ArchitectureMTOW [tons]Span [m]ICAO ‘B’ ≤ 24 mICAO ‘C’ ≤ 36 m
BW2323.8
3027.8🗶
4029.9🗶
5035.4🗶
TW2328.8🗶
3032.8🗶
4038.0🗶🗶
5042.4🗶🗶
Disclaimer/Publisher’s Note: The statements, opinions and data contained in all publications are solely those of the individual author(s) and contributor(s) and not of MDPI and/or the editor(s). MDPI and/or the editor(s) disclaim responsibility for any injury to people or property resulting from any ideas, methods, instructions or products referred to in the content.

