Article

The Use of Empirical Mode Decomposition on Heart Rate Variability Signals to Assess Autonomic Neuropathy Progression in Type 2 Diabetes

by
Sandra Cossul
1,*,
Felipe Rettore Andreis
2,
Mateus Andre Favretto
1 and
Jefferson Luiz Brum Marques
1,*
1
Institute of Biomedical Engineering, Department of Electrical and Electronic Engineering, Federal University of Santa Catarina, Florianopolis 88040-900, Brazil
2
Center for Neuroplasticity and Pain (CNAP), Department of Health Science and Technology, Aalborg University, 9100 Aalborg, Denmark
*
Authors to whom correspondence should be addressed.
Appl. Sci. 2023, 13(13), 7824; https://doi.org/10.3390/app13137824
Submission received: 6 April 2023 / Revised: 26 June 2023 / Accepted: 28 June 2023 / Published: 3 July 2023
(This article belongs to the Section Biomedical Engineering)

Abstract

:
In this study, we investigated the use of empirical mode decomposition (EMD)-based features extracted from electrocardiogram (ECG) RR interval signals to differentiate between different levels of cardiovascular autonomic neuropathy (CAN) in patients with type 2 diabetes mellitus (T2DM). This study involved 60 participants divided into three groups: no CAN, subclinical CAN, and established CAN. Six EMD features (area of analytic signal representation— A S R a r e a ; area of the ellipse evaluated from the second-order difference plot— S O D P a r e a ; central tendency measure of SODP— S O D P C T M ; power spectral density (PSD) peak amplitude— P S D p k a m p ; PSD band power— P S D b p o w ; and PSD mean frequency— P S D m f r e q ) were extracted from the RR interval signals and compared between groups. The results revealed significant differences between the noCAN and estCAN individuals for all EMD features and their components, except for the P S D m f r e q . However, only some EMD components of each feature showed significant differences between individuals with noCAN or estCAN and those with subCAN. This study found a pattern of decreasing A S R a r e a and S O D P a r e a values, an increasing S O D P C T M value, and a reduction in P S D b p o w and P S D p k a m p values as the CAN progressed. These findings suggest that the EMD outcome measures could contribute to characterizing changes associated with CAN manifestation in individuals with T2DM.

1. Introduction

According to the International Diabetes Federation (IDF) [1], it is estimated that 537 million people are living with diabetes mellitus (DM), which represents 10.5% of the world’s population. DM is a chronic disorder that occurs when the body cannot produce enough insulin or cannot effectively use the insulin it produces, resulting in raised blood glucose levels [2]. The metabolic disorders of DM lead to diffuse and widespread damage to the peripheral and autonomic nerves and small vessels. Among these, damage to the autonomic nerve fibers that innervate the heart and blood vessels is known as cardiovascular autonomic neuropathy (CAN), resulting in abnormalities in heart rate and vascular dynamics [3]. CAN prevalence is estimated at 17–66% among patients with type 1 DM and 31–73% in patients with type 2 DM [4].
The gold standard for CAN diagnosis is the series of cardiac autonomic reflex tests (CARTs), which measure the heart rate and blood pressure responses to simple interventions such as deep breathing, the Valsalva maneuver, and lying-to-standing [5]. These responses are compared to normal and age-adjusted cut-off values [6]. Nevertheless, CAN has a silent presentation and may exhibit no symptoms or have subtle symptoms, making it challenging to identify and diagnose in the initial stages with only the CARTs [7]. In addition, CARTs must follow consistent and standardized protocols, which require active patient collaboration [8]. Early or subclinical CAN is limited to baroreceptor abnormalities and changes in heart rate variability (HRV) [4]. Hence, HRV indices are a different approach to CARTs for assessing autonomic function, as they are easier and quicker than CARTs, patient-independent, and sensitive to early dysfunction [9]. HRV refers to the time elapsed between two successive R-waves of the QRS complex on the electrocardiogram (ECG) (i.e., the RR interval) [10]. HRV indices are amongst the simplest and most reliable ways to assess CAN and are obtained by time- and frequency-domain methods, which measure, respectively, the overall magnitude of the fluctuations of the RR interval between each heartbeat around the average values and the magnitude of fluctuations in a predetermined range of frequency [11]. Despite having a wide basis of evidence for the supportive value of HRV analysis in CAN diagnosis and risk stratification in diabetic individuals [12,13,14], HRV methods and indices for decision-making and, most importantly, CAN severity quantification remain an active and expanding research topic [15].
HRV reflects the dynamic changes of the autonomic nervous system’s regulation and is determined by the combined inputs of the sympathetic and parasympathetic systems [5]. HRV signals involve nonlinear contributions and are essentially non-stationary [10]. Thus, measures from information and invariant domains that can accurately describe the nonlinear properties of HRV signals are strongly recommended to be used in conjunction with traditional techniques because they may provide supplementary information about the underlying mechanisms involved in cardiovascular regulation [16,17]. Several studies have demonstrated the usefulness of the nonlinear analysis of HRV for assessing cardiac abnormalities and have explored techniques such as the correlation dimension, Poincare plots, entropy parameters, recurrence plots, and detrended fluctuation analysis [18,19,20,21,22].
Among these techniques, a nonlinear method that has been explored for HRV analysis is empirical mode decomposition (EMD). EMD is a data analysis method proposed by Huang et al., (1998) [23] that decomposes a time series into a set of simpler and more interpretable oscillatory modes called intrinsic mode functions (IMFs). The Hilbert transform can be applied to IMFs to obtain their analytical signal, from which additional information can be calculated, such as the instantaneous frequency and the amplitude and phase modulation of the IMF [24]. EMD is an adaptive and data-driven technique, which makes it well-suited to analyzing signals that have complex, nonlinear, and non-stationary characteristics. Compared to other methods of time-frequency analysis of signals, EMD addresses some limitations. For example, the Fourier transform is a linear technique that assumes the signal is stationary over time [24], which is not the case for HRV signals that exhibit nonlinear interactions between different frequency components [15]. On the other hand, the Wavelet transform is a frequency-based method that selects an appropriate wavelet basis function and scale, while EMD is a time-based method that does not require a priori knowledge of the signal frequency content [24].
As a result of its different approach and the advantages over the analysis of complex and nonlinear time-series signals, the use of the EMD technique has gained increasing attention and has been adopted for a variety of biomedical signals, such as the electroencephalogram for epileptic seizure classification [25,26], emotion recognition [27,28], and the identification of autism severity level [29], electromyography for the analysis of amyotrophic lateral sclerosis [30,31] or for the classification of neuromuscular disorders [32,33], and ECG signals for the classification of cardiovascular diseases [34], ECG denoising [35,36], the classification of ventricular arrhythmias [37], the prediction of sudden cardiac death [38], and the detection of hypertension [39] or the extraction of fetal ECG [40].
The study by Echeverria et al. [41] was one of the first to propose the application of EMD to HRV analysis, concluding that EMD and the associated Hilbert spectral representation are powerful techniques for HRV time-frequency analysis due to their capabilities of independently isolating the main frequency components and dealing with non-stationary and nonlinear features of the ECG signal. Subsequently, a study by Souza Neto et al. [42] also showed that EMD is a flexible processing method that enhances the assessment of cardiovascular autonomic control, overcoming the limitations posed by the linearity and stationarity assumptions inherent in traditional spectral techniques. Pachori et al. [43] proposed a set of EMD-based features applied to the RR interval signals that allowed differentiation between subjects with and without diabetes. In the same context, Pachori et al. [44] presented a methodology for screening patients with DM by applying the EMD method to decompose HRV signals, achieving a classification accuracy of 95.63%. To identify and classify normal and congestive heart failure, Acharya et al. [45] subjected HRV signals to the EMD technique, obtaining an accuracy of 97.01%. Sood et al. [46] proposed a methodology for discriminating between normal and coronary artery disease subjects using heart rate signals, showing statistically significant EMD-based features.
Similarly, Shi et al. [47] investigated EMD-based features applied to HRV signals on sudden cardiac death (SCD), predicting subjects at risk earlier with an accuracy of 96.1% and outperforming the classical linear estimators of SCD. These studies highlighted that analyzing HRV signals using the EMD technique provides relevant information about overall cardiac abnormalities. Furthermore, within the context of DM, the scope of these studies is limited to characterizing DM and distinguishing between normal and diabetic patients, with no studies analyzing the progression of CAN.
Therefore, our study’s significance is based on four complementary aspects: (a) the importance of identifying parameters that characterize the subtle changes occurring in the early stages of CAN (i.e., the subclinical phase, where the disease is present but symptoms are not yet evident or are very mild), enabling the initiation of preventive treatment to control symptoms and potentially slow or reverse the disease progression [4,5]; (b) a novel application of the EMD method; to the best of our knowledge, the EMD method has not been applied to analyze HRV signals of DM patients with CAN at different levels of severity; (c) proposing the utilization of HRV indices as a replacement for CARTs in diagnosing CAN, offering the advantages of time-effectiveness, patient-independence, and providing quantitative measurements; and (d) contributing to ongoing research on the relevance of nonlinear HRV analysis approaches in investigating the neural control of the cardiovascular system in the presence of CAN.
Therefore, our research aims to investigate the relevance of the EMD-based features extracted from HRV signals to differentiate between progression levels of cardiovascular autonomic neuropathy among type 2 DM patients (i.e., no CAN, subclinical CAN, and established CAN).
The paper is organized as follows: Section 2 delineates the methodology, which includes: (i) a description of participants and the inclusion criteria, (ii) the data acquisition process and data pre-processing, (iii) the EMD method and feature extraction, and (iv) the statistical analysis. Section 3 and Section 4 present the results and discussion, respectively. Finally, Section 5 concludes the paper.

2. Materials and Methods

A block diagram of our proposed methodology for CAN investigation based on the EMD method applied to HRV signals is presented in Figure 1 and will be further explained in the following sections.

2.1. Participants

An a priori sample size estimation was performed in G*Power [48], assuming a statistical power of 0.80 and a significance level of 0.05. For a one-way ANOVA with three groups and a moderate effect size (Cohen’s d = 0.05), the study required a minimum sample size of 42 participants. However, to ensure robustness and address potential limitations, sixty participants diagnosed with type 2 DM were recruited from the Professor Polydoro Ernany University Hospital of the Federal University of Santa Catarina—HU/UFSC/EBSERH (see Table 1). The inclusion criteria specified that participants were 18–75 years old and of any gender. The exclusion criteria included the diagnosis of retinopathy, chronic infectious or inflammatory diseases, use of an implantable electronic device (e.g., a cardiac pacemaker), and use of drugs that can affect cardiovascular function (e.g., beta-blockers). The institutional research ethics committee approved the study (protocol number 3.326.385), and participants only entered the study after informed consent.
The anthropometric and clinical data (e.g., age, DM duration, use of medications, presence of complications, and the last results of the glycated hemoglobin (HbA1c) test—a blood test that shows the average blood sugar (glucose) level over the past two to three months) were obtained from previous ECG and photoplethysmography (PPG) data. The participants were given cardiac autonomic reflex tests (CARTs) and baroreflex sensitivity (BRS) analyses to classify them into three levels of CAN (i.e., noCAN—no presence of CAN, subCAN—subclinical CAN, and estCAN—established CAN). The CARTs comprised tests for heart rate response, including the RR interval to paced breathing, the Valsalva maneuver, and postural change from lying to standing [4]. The standardized CARTs used in this study are the gold standard method recommended for CAN assessment in patients with diabetes [7]. Furthermore, BRS is a quantitative description of the arterial baroreflex, a critical determinant of the neural regulation of the cardiovascular system, relying on the analysis of spontaneous fluctuations of beat-by-beat arterial pressure and cardiac interval [49]. BRS is a sensitive indicator of CAN in type 2 DM [49,50] and an accurate screening tool for staging CAN, even in the subclinical phase when the usual clinical tests do not detect alteration due to the absence of overt symptoms [51].
The CARTs were performed according to the O’Brien tests [6], based on Ewing [52], and incorporated a composite score (CS). The CARTs were evaluated as normal (i.e., CS up to 1) or abnormal (i.e., CS greater than 2). For the BRS analysis, two steps were performed: (i) an estimation of systolic blood pressure (SBP) from ECG and PPG signals based on a model proposed by Rajala et al. [53]; and (ii) a BRS value estimation from the estimated SBP and the RR intervals based on the sequence method [54]. The mean values of BRS were compared against age-adjusted reference values to determine normal or abnormal results [55,56]. Subsequently, the noCAN group was defined when the CARTs and BRS analysis were considered normal, and the subCAN group was defined when the CARTs were normal and the BRS analysis was abnormal. Finally, estCAN was defined when both the CART and BRS results were abnormal.

2.2. ECG and PPG Recording and Processing

The ECG and PPG signals were recorded using a custom-made acquisition system developed by the Federal University of Santa Catarina’s Institute of Biomedical Engineering with a sampling frequency of 500 Hz. The ECG data were obtained following a bipolar three-lead configuration using disposable adhesive electrodes (3M, Red Dot, 2560). The PPG was measured with a pulse oximeter sensor on the index finger.
The ECG signals were bandpass-filtered (fourth-order Butterworth FIR filter, 0.5–40 Hz) to remove high-frequency noise, including power line interference and baseline wander. Subsequently, the RR intervals between successive R peaks of QRS complexes were detected and calculated based on the Pan–Tompkins algorithm [57]. Lastly, the RR sequence was inspected to remove spurious RR peaks where the RR intervals changed more than 20% within a median value window of the following five and the previous five RR intervals [58]. The corrected HRV signals proceeded for analysis.

2.3. Feature Extraction

The HRV segments were analyzed using the original EMD method outlined in [23] with the official MATLAB code (R2018a, MathWorks, MA, USA). Custom software was created in MATLAB to extract features from the EMD modes, including the area of the analytical signal ( A S R a r e a ), the area of the second-order difference plot ( S O D P a r e a ), the central tendency measure of the second-order difference plot ( S O D P C T M ), and the features extracted after power spectral density estimation: peak amplitude ( P S D p k a m p ), band power ( P S D b p o w ), and mean frequency ( P S D m f r e q ). The following section further describes the details of the EMD technique and the extracted features.

2.3.1. Empirical Mode Decomposition

The EMD method is an adaptive data analysis method applicable to nonlinear and non-stationary signals [23]. The EMD model decomposes data into finite intrinsic mode functions (IMFs) based on directly extracting the energy associated with various intrinsic time scales. With the Hilbert transform, the IMFs yield instantaneous frequencies as functions of time that give sharp identifications of embedded structures. The final presentation of the results is an energy-frequency-time distribution, designated as the Hilbert spectrum, which accurately represents non-stationary and nonlinear signals [23].
Unlike Fourier analysis or wavelet transforms, EMD breaks down a time signal into a set of base signals derived from the data itself; this unique approach allows EMD to preserve the full non-stationarity of the signal [24]. In addition to contrasting the Fourier analysis that produces a series of sine and cosine functions of fixed amplitudes to represent each frequency constituent in the signal, the IMFs are oscillatory modes whose amplitude and frequency vary over time [23].
The EMD of a time-series signal x(t) can be represented as a sum of IMFs, IMF i t , and a residue component, r N t , as represented in Equation (1):
x ( t ) = i = 1 N IMF i t +   r N t  
The algorithm to extract the IMFs of a time-series signal using EMD follows an iterative process known as the sifting process, summarized as follows [23]:
(i)
Identify the signal maxima and minima;
(ii)
Compute the interpolated upper and lower envelopes and the instantaneous local mean of the envelopes;
(iii)
Subtract the obtained local mean from the original signal x(t) to obtain the first component IMF i t ;
(iv)
Check whether the component IMF i t satisfies the two basic conditions of the IMF:
  • The number of extrema—maxima and minima—and the number of zero-crossings in a signal should be either equal or differ by a maximum of one;
  • At any point, the mean value of two envelopes, one formed by connecting local maxima and the other by local minima, should be zero.
(v)
Repeat steps (i)–(iii) until it satisfies the conditions of the IMF (or by applying a stopping criterion such as the number of repetitions);
(vi)
Repeat steps (i)–(iii) again for the calculation of the next IMFs, until no more components can be extracted (or by removing criteria such as the number of required IMFs).
After the signal decomposition, the Hilbert transformation applied to the obtained IMFs provides an analytical signal representation (ASR) of IMFs (i.e., a complex-valued function with no negative frequency components). Any complex signal, z(t), can be considered the sum of its real part, IMF i t , and its imaginary part, Im(t), and rewritten in a polar coordinate system, as demonstrated in Equation (2). Equations (3) and (4) denote the instantaneous amplitude A(t) and phase Ɵ(t) of the complex analytic signal, respectively:
z ( t ) = IMF i t + jIm ( t ) = A ( t )   e j θ t
A ( t ) = IMF i t 2 +   Im t ²
θ ( t ) = tan 1 ( Im t IMF i t )
When applied to HRV analysis, the RR interval is decomposed into amplitude and frequency-modulated (AM–FM) signal components, the IMFs. The study in [41] demonstrated that the isolation of the first four components of the EMD is necessary to recognize the spectral bands of the autonomic modulation. Thus, this study limited the decomposition to four IMFs, considering they held the most significant signal variation.

2.3.2. The Features of EMD-Derived IMFs

The features extracted from the EMD-derived IMFs were as follows: the area of analytical signal representation ( A S R a r e a ), the second-order difference plot area ( S O D P a r e a ), and the central tendency measure of the second-order difference plot ( S O D P C T M ). Furthermore, the features extracted after power spectral density estimation of the IMFs were: peak amplitude ( P S D p k a m p ), band power ( P S D b p o w ), and mean frequency ( P S D m f r e q ). The specifics of how these features were obtained are explained below.
  • The area of analytical signal representation ( A S R a r e a )
The IMF analytic signal s(n) can be plotted as the imaginary part, Im{s(n)}, against the real part, R{s(n)}. This IFM analytical signal representation (ASR) plot shows a circular pattern with a unique center of rotation [59]. Thus, a feature of the area can be estimated. One of the standard methods to summarize graph information is the central tendency measure (CTM). The CTM is computed by selecting a circular region of radius r around the origin, counting the number of points within the radius, and dividing by the total number of points N, as in [60]. This procedure is demonstrated in Equations (5) and (6):
CTM = n = 1 N D n N
D ( n ) = 1   if   ( R s n 2 + Im s n 2 ) 0.5 < r 0   otherwise
The radius of the plot is computed using the CTM. In this work, a radius of 95% CTM was chosen to calculate the ASR area. Finally, the A S R a r e a is computed as in Equation (7).
A S R a r e a = π r 2
  • The second-order difference plots ( S O D P a r e a   and   S O D P C T M )
The second-order difference plots (SODPs) are centered around the origin representing the variability rate; they help model biological systems, such as heart rate variations, to characterize the degree of theoretical chaos [60]. The SODPs extract the rate of the data variability (e.g., they assess the variability present in the IMFs of the RR interval signals) and provide a graphical representation of successive differences in the same series when plotted against each other [29,43].
The SODP graph of a given signal x(n) can be obtained by plotting X(n) versus Y(n), as defined in Equations (8) and (9), respectively:
X ( n ) = IMF i n + 1 IMF i n
Y ( n ) = IMF i n + 2 IMF i n + 1
Once the SODP is obtained, we used the 95% confidence ellipse area of the SODP graph to obtain the S O D P a r e a . The procedure to calculate the ellipse area is given as the following process [26,61].
Compute S x , S y , and S x y , according to Equations (10)–(12):
S x = 1 N   n = 0 N 1 X n ²  
S y = 1 N   n = 0 N 1 Y n ²
S x y = 1 N   X n   Y n  
Compute D, a, and b parameters according to Equations (13)–(15):
D = S x 2 + S y 2 4 S x 2 S y 2 S x y 2
a = 1.7321 S x 2 + S y 2 + D )  
b = 1.7321 S x 2 + S y 2 D )  
From parameters a and b, the S O D P a r e a is calculated as in Equation (16):
S O D P a r e a = π ab
In addition, the CTM method was applied to the SODP graphs. The CTM was calculated for each IMF’s fixed circular region around the SODP origin point. Therefore, a low-variable plot will have points clustered around the origin. Additionally, the diseased state of the heart exhibits a greater degree of chaos [60]. The S O D P C T M is defined as the ratio between the number of points within the fixed radius and the total number of points. The radius was defined by visual inspection as 0.02, 0.01, 0.002, and 0.001 for the 1st to 4th IMF, respectively.
  • Power spectral density estimation ( P S D p k a m p ,   P S D b p o w , and P S D m f r e q )
The power spectral density (PSD) estimation describes the power distribution over frequency contained in a signal. The x-axis represents frequency, while the y-axis represents the magnitude or power of the signal at that frequency in units expressed in decibels (dB) or squared units of the original signal. Welch’s method was used to estimate the PSD. In brief, it is an averaging method that divides the signal into overlapping segments, computes the periodogram of each segment, and averages these periodograms to obtain an estimate of the PSD over a certain frequency range [62]. In this study, the adopted frequency range was 0–0.5 Hz. Welch’s PSD was estimated for each of the four extracted IMFs. The PSD peak amplitude ( P S D p k a m p ) was defined as the absolute maximum height of the PSD waveform. The PSD band power ( P S D b p o w ) was calculated as the average power computed by integrating the PSD estimate curve, and, finally, the PSD mean frequency ( P S D m f r e q ), as the average frequency of the spectrum, was calculated as the weighted average of the frequencies, with the weights being the PSD values at each frequency.

2.4. Statistical Analysis

A one-way analysis of variance (ANOVA) was conducted to compare mean differences between CAN severity level groups (i.e., noCAN, subCAN, and estCAN). The homogeneity of variances and the normality assumptions were verified through Levene’s test and Shapiro–Wilks’s test, respectively. As a result of the non-normal distribution, variables were log-transformed to perform the analysis. Pairwise multiple comparisons were performed with Tukey (equal variances assumed) or the Games–Howell test for unequal variances. The results are shown as mean ± standard deviation, and the significance level 0.05 was adopted. The statistical analysis was performed with R 4.2.0 (R Core Team, 2022).

3. Results

The results of the Shapiro–Wilk test of normality indicate that the distributions were non-normal for the variables A S R a r e a , S O D P a r e a , P S D p k a m p , and P S D b p o w while the variables S O D P C T M and P S D m f r e q were normally distributed. The same results were observed for the four IMF components of each feature. The results of Levene’s homogeneity of variances test indicate equal variances for all features except for the S O D P C T M of the 1st, 2nd, and 4th IMF components.
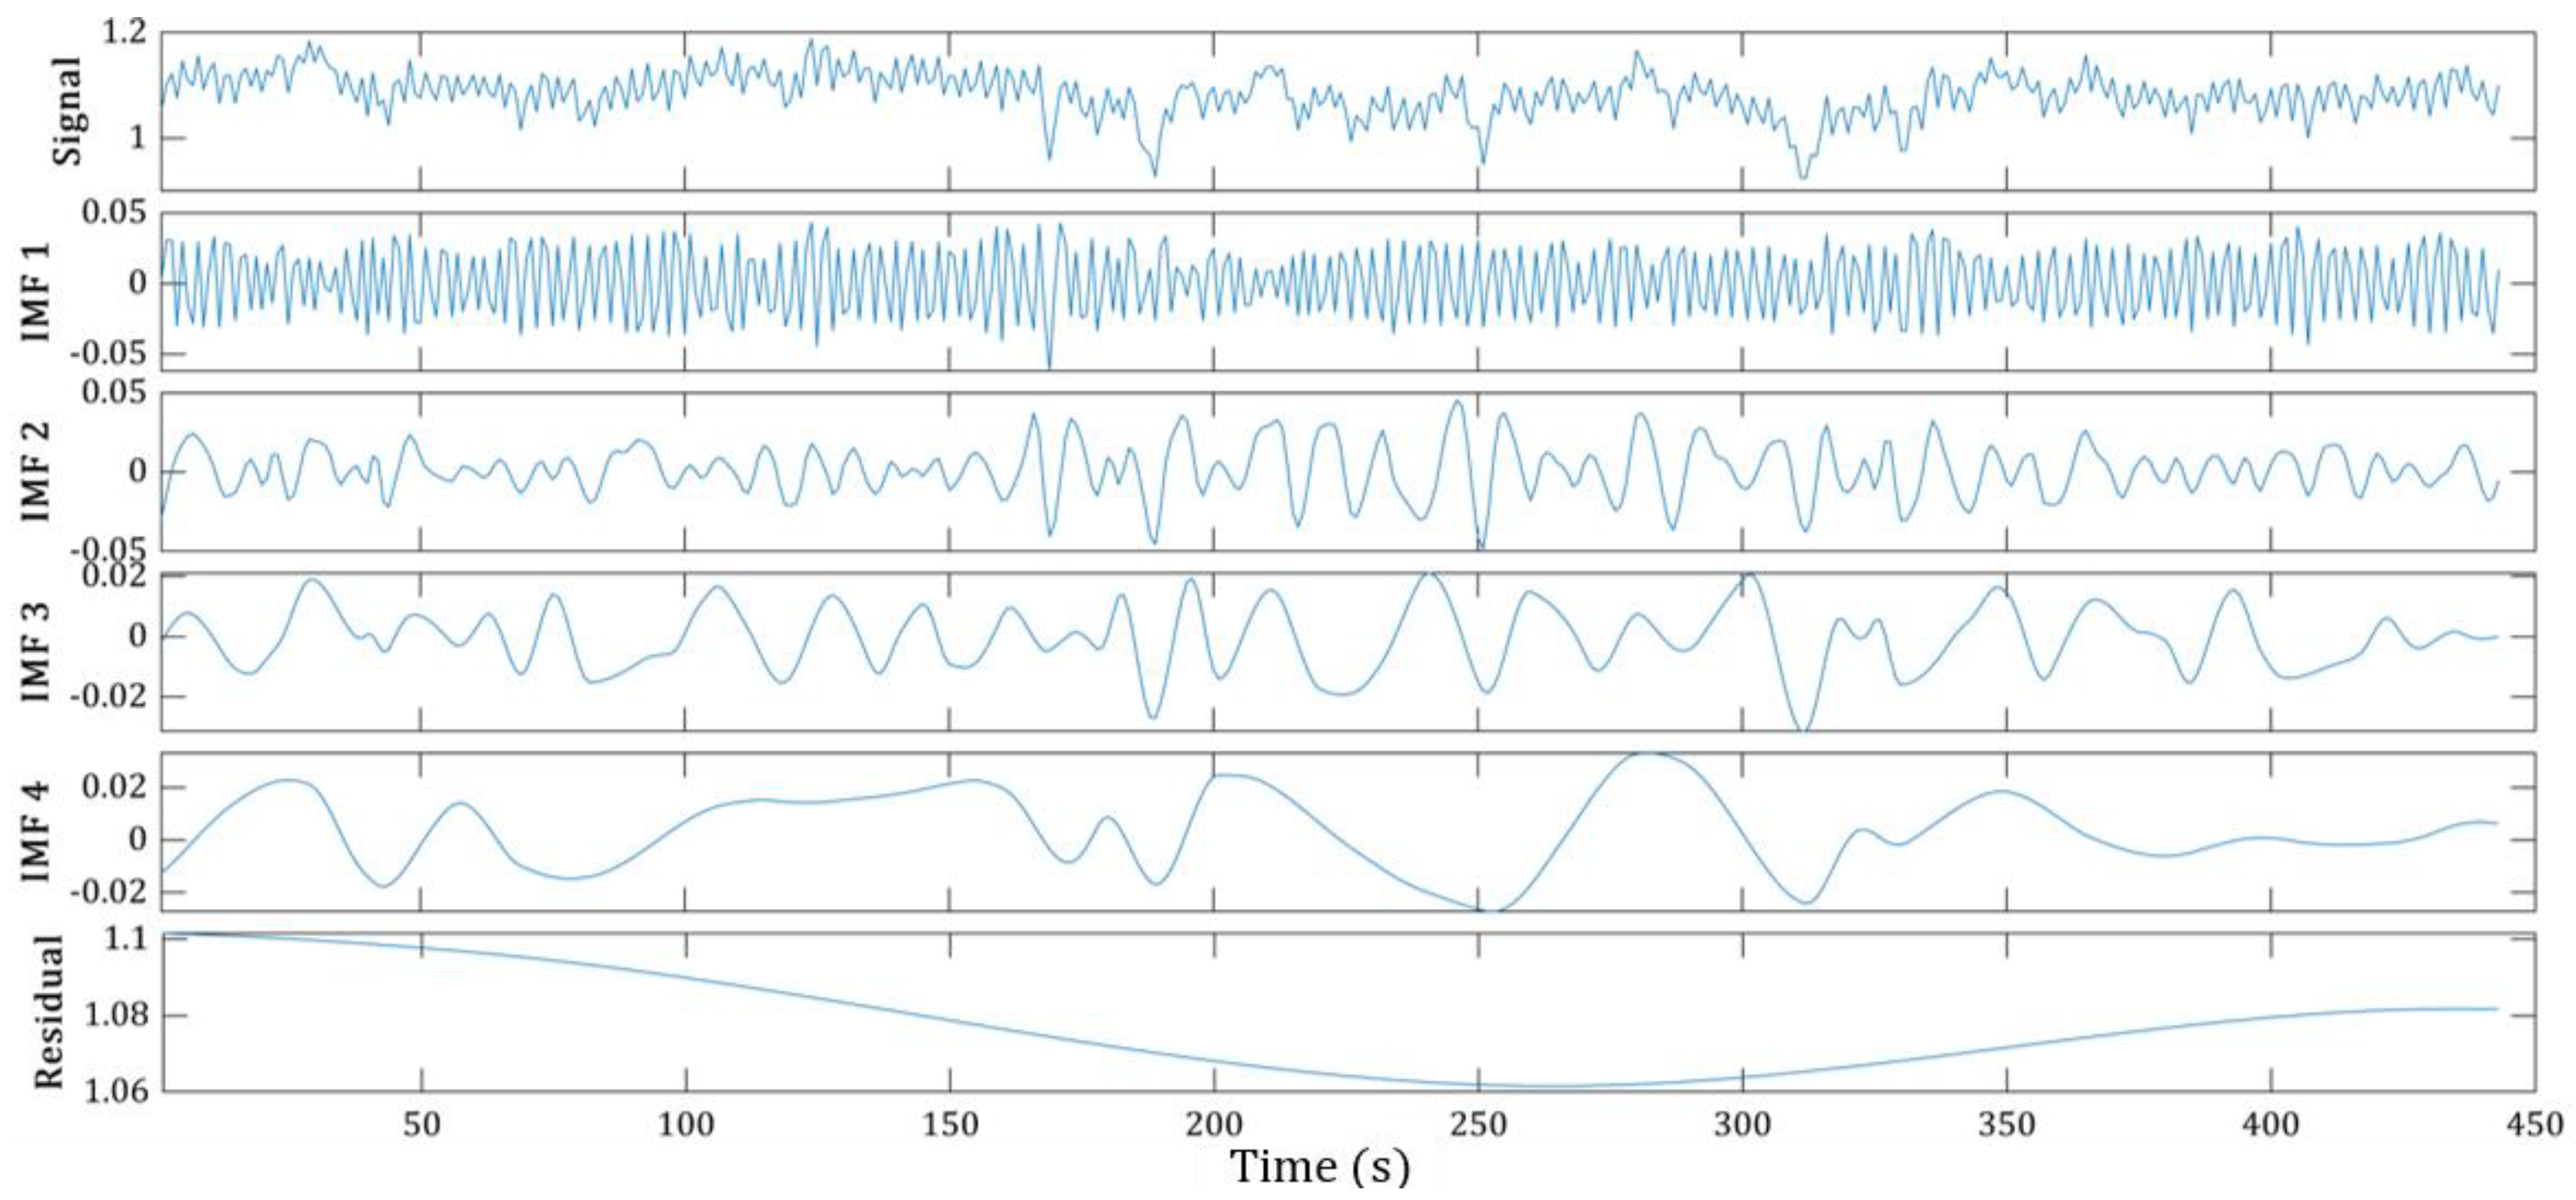
A representative illustration of the resulting EMD applied to decompose the RR interval signal in a subject with no diagnosis of CAN is illustrated in Figure 2. The top row shows the original RR interval signal. The following rows demonstrate the first four IMFs and the residual component. As expected, the higher the IMF index, the lower its frequency content.
The univariate ANOVA shows a significant difference between the CAN groups for the variables log( A S R a r e a ), log( S O D P a r e a ), SODP CTM , log( P S D b p o w ), and log( P S D p k a m p ) and their components (i.e., IMF1, IMF2, IMF3, and IMF4) (p < 0.01). In contrast, there was no significant difference between the CAN groups for the P S D m f r e q variable and its EMD components. The feature values are presented in Table 2.
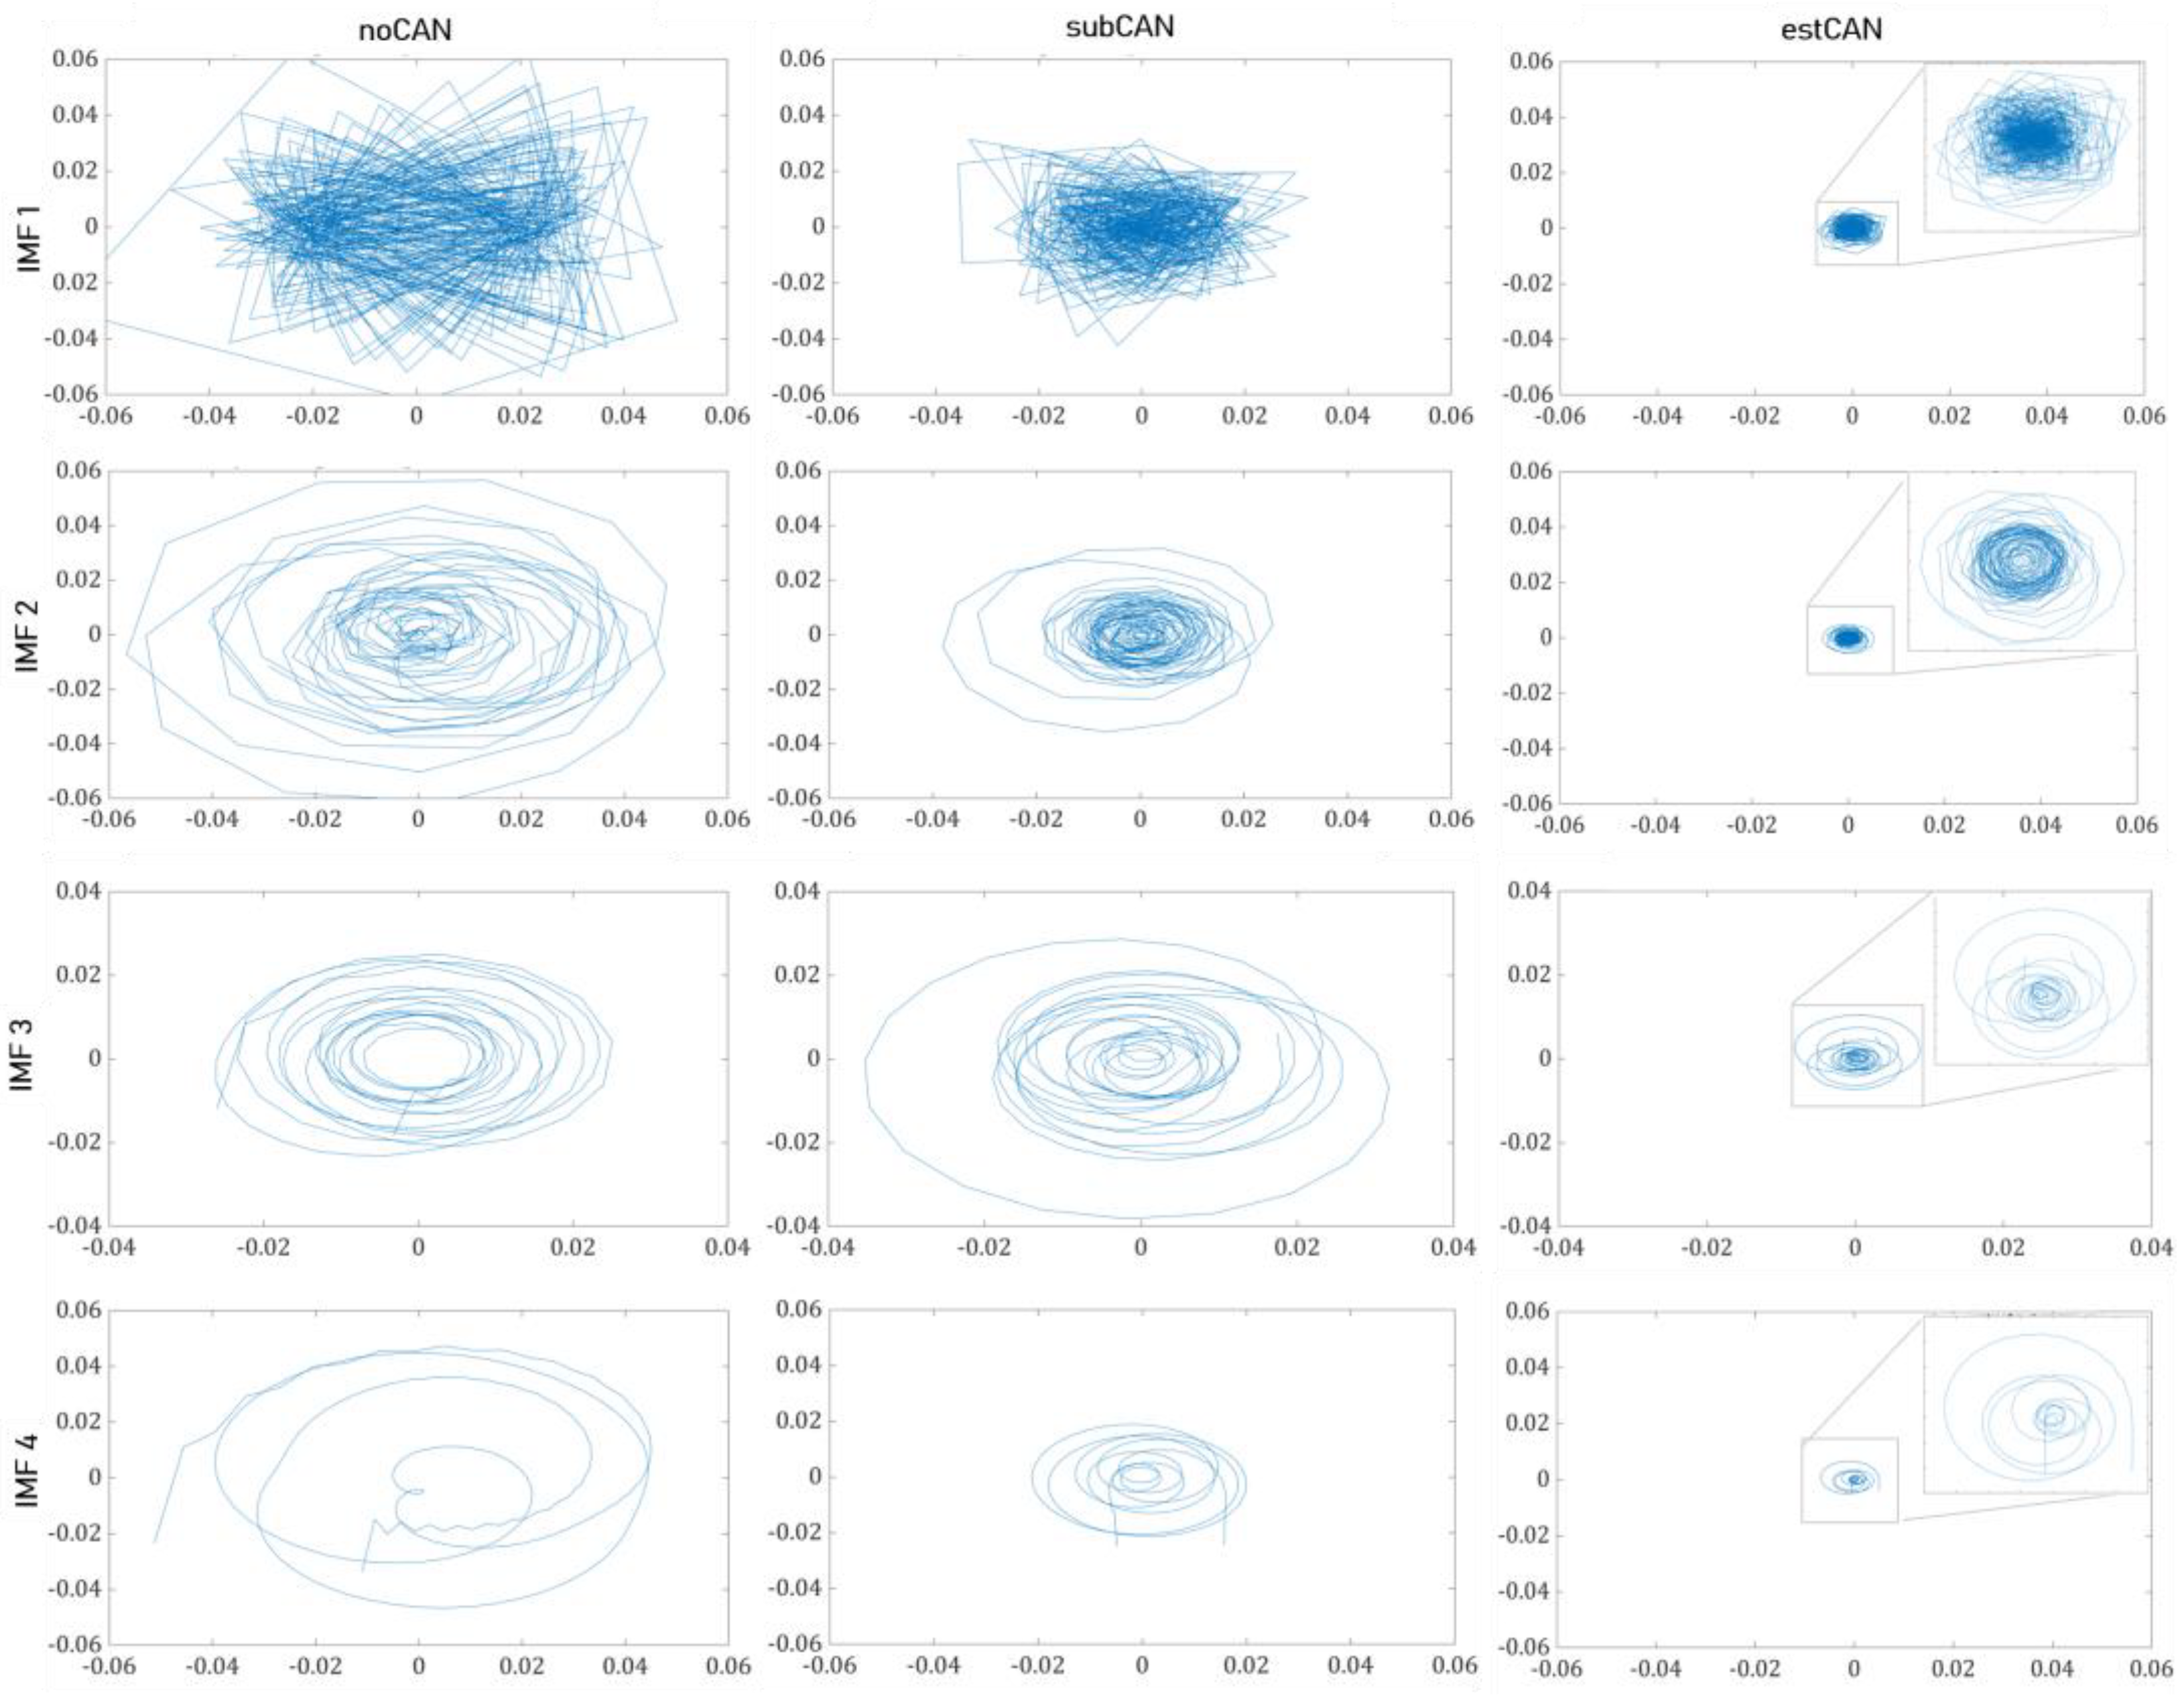
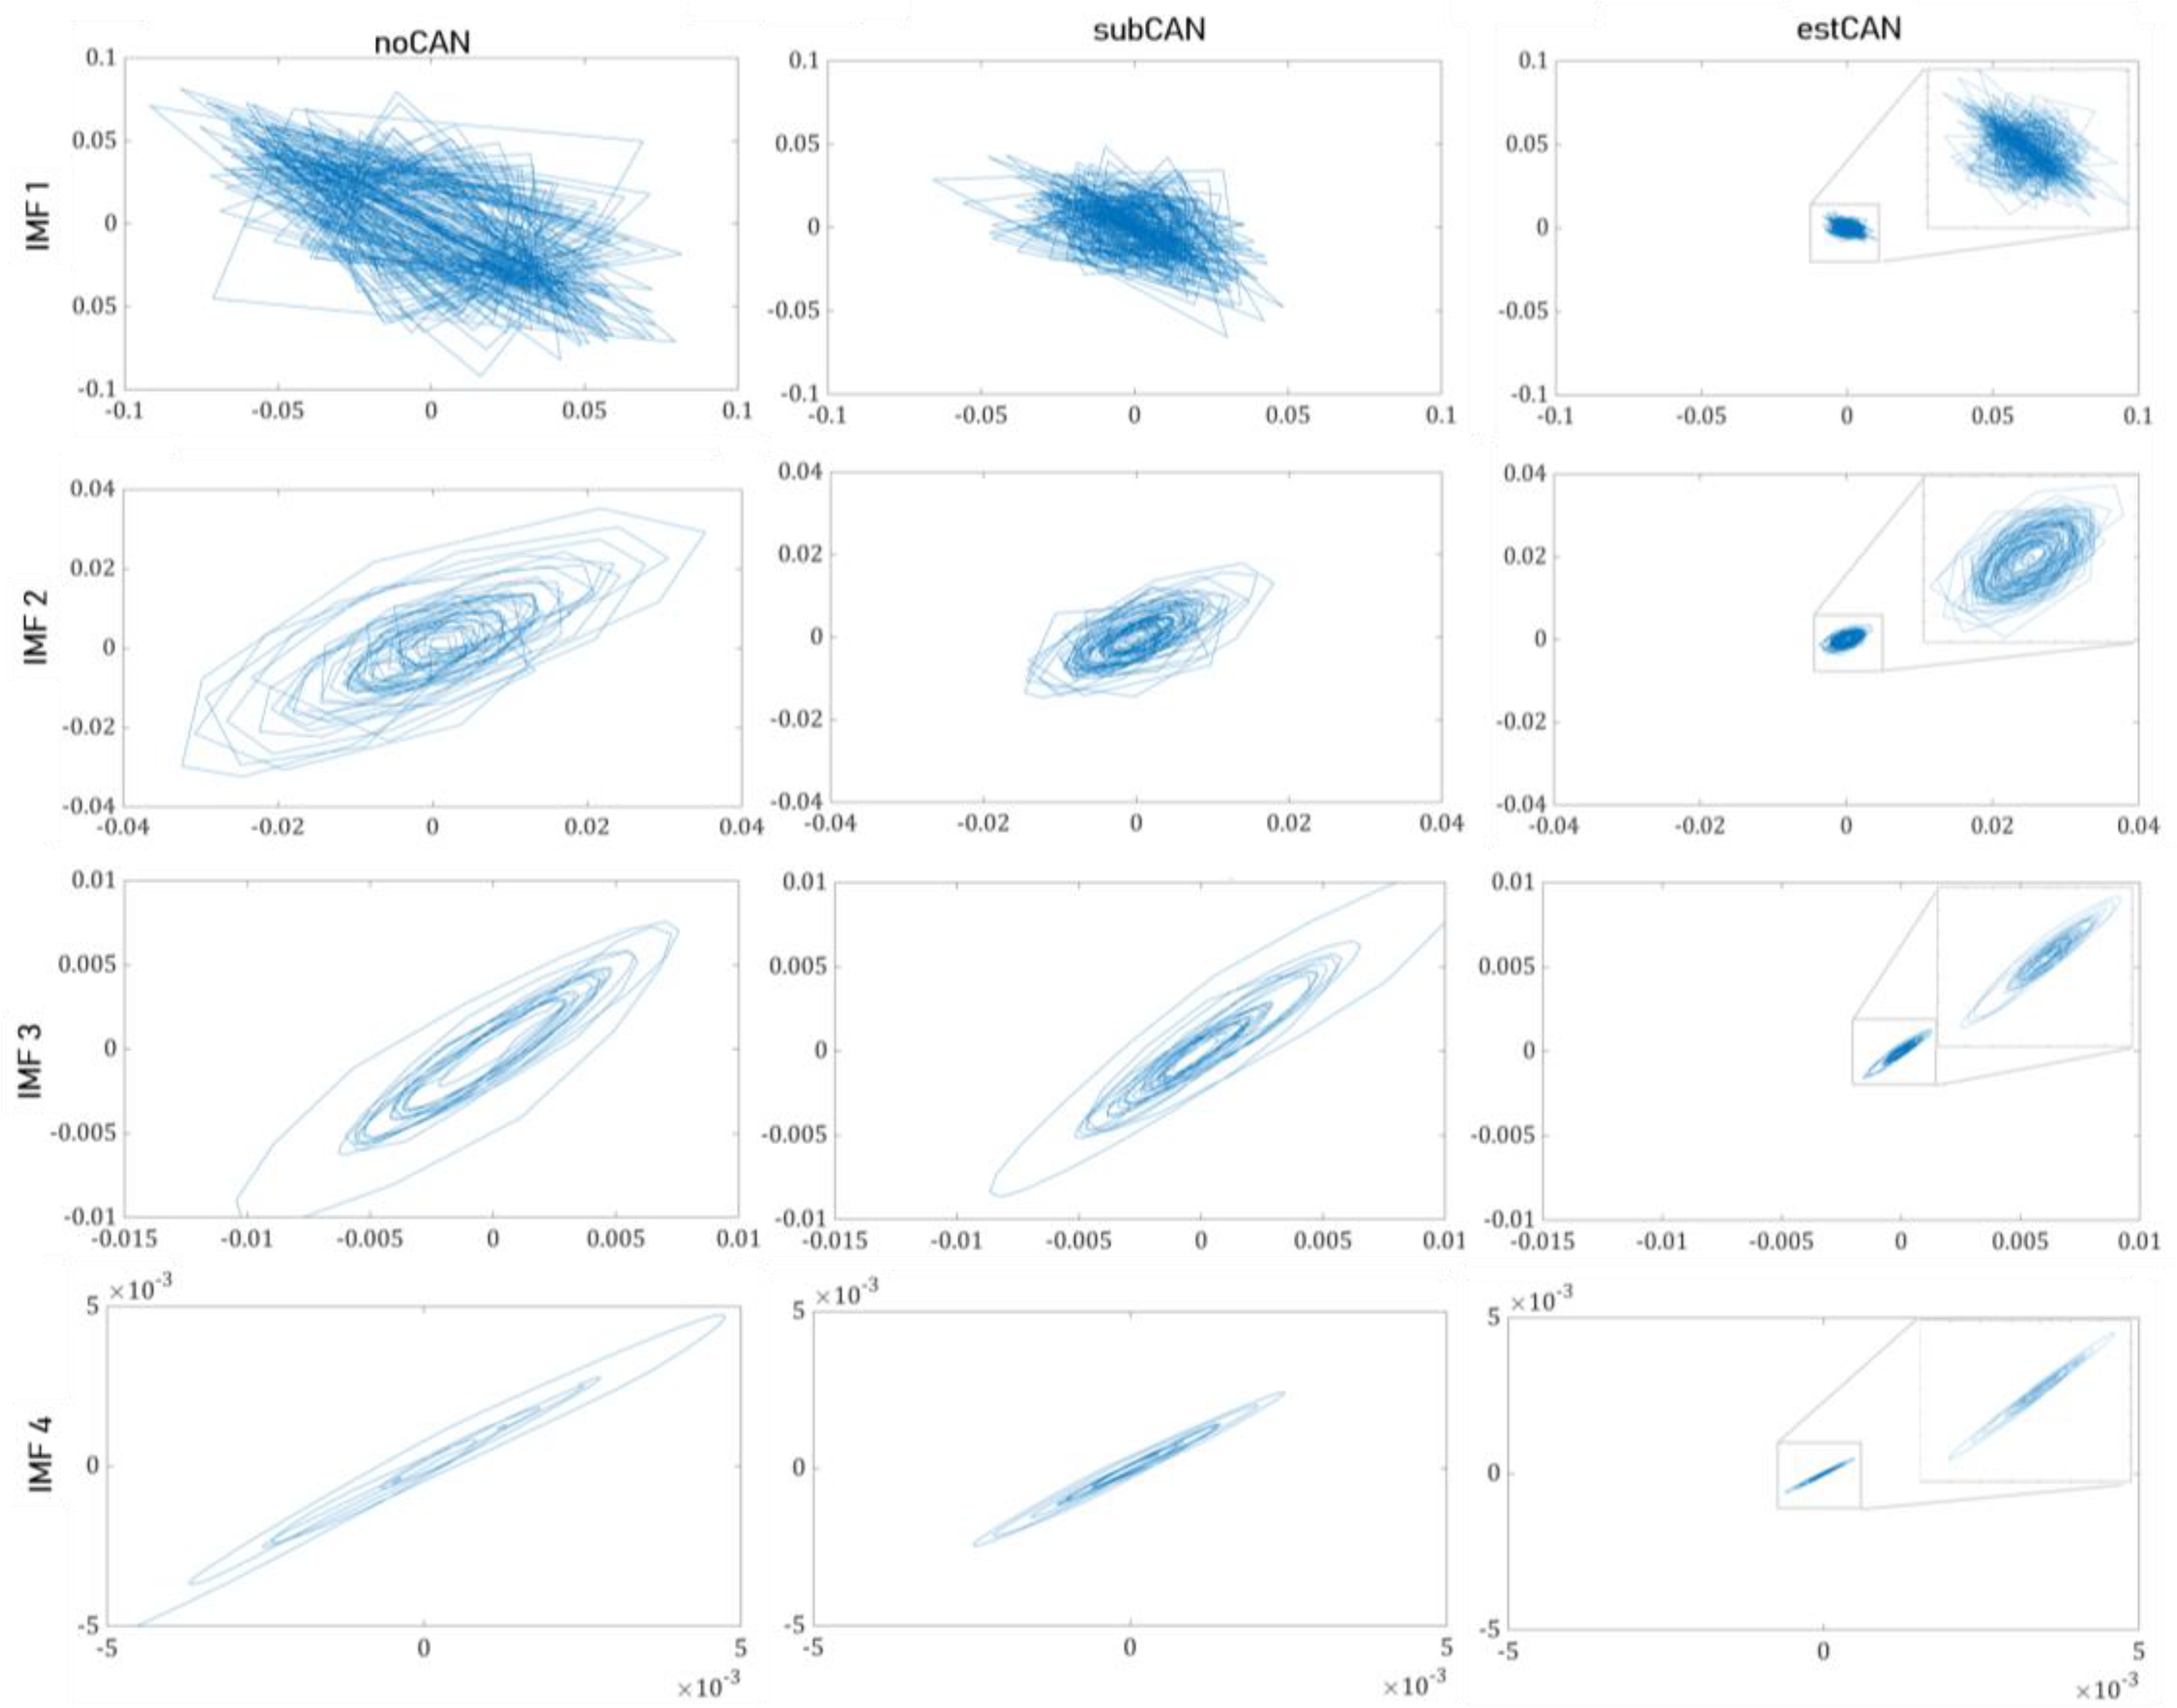
The analytic signal and the second-order difference plots of the IMFs for the three groups (noCAN, subCAN, and estCAN) are demonstrated in Figure 3 and Figure 4, respectively. From Figure 3, it can be observed that the spread of the analytic signal is lower for the estCAN group in all IMFs, resulting in a larger number of points inside the radius and, therefore, a larger A S R a r e a . Similarly, Figure 4 reveals that the second-order difference plot exhibits a greater dispersion in the noCAN group but becomes progressively more clustered in the subCAN group and even more in the estCAN group. This result is reflected by the decrease in the S O D P a r e a and an increase in the SODP CTM , which calculate the ellipse area and the grouping of points around the origin.
Welch’s power spectral density estimation plots of the intrinsic mode functions for the three groups (noCAN, subCAN, and estCAN) are demonstrated in Figure 5; the frequency content decreases as the IMF index increases. The power of all IMFs shows a decreasing trend from the noCAN group to the subCAN group and further to the estCAN group. When examining each group’s IMFs individually, the noCAN group exhibits a higher power in IMF1, while the subCAN and estCAN groups show higher powers in IMF3 and IMF4.
All features derived from the four EMD-extracted IMF components exhibited significant differences between the extreme groups (noCAN and estCAN). When comparing the noCAN and subCAN groups, the third and fourth components were particularly effective in distinguishing between them. Furthermore, for the subCAN and estCAN groups, certain EMD components of each feature presented a significant ability to distinguish between the groups. The following paragraphs provide a more detailed description of these results.
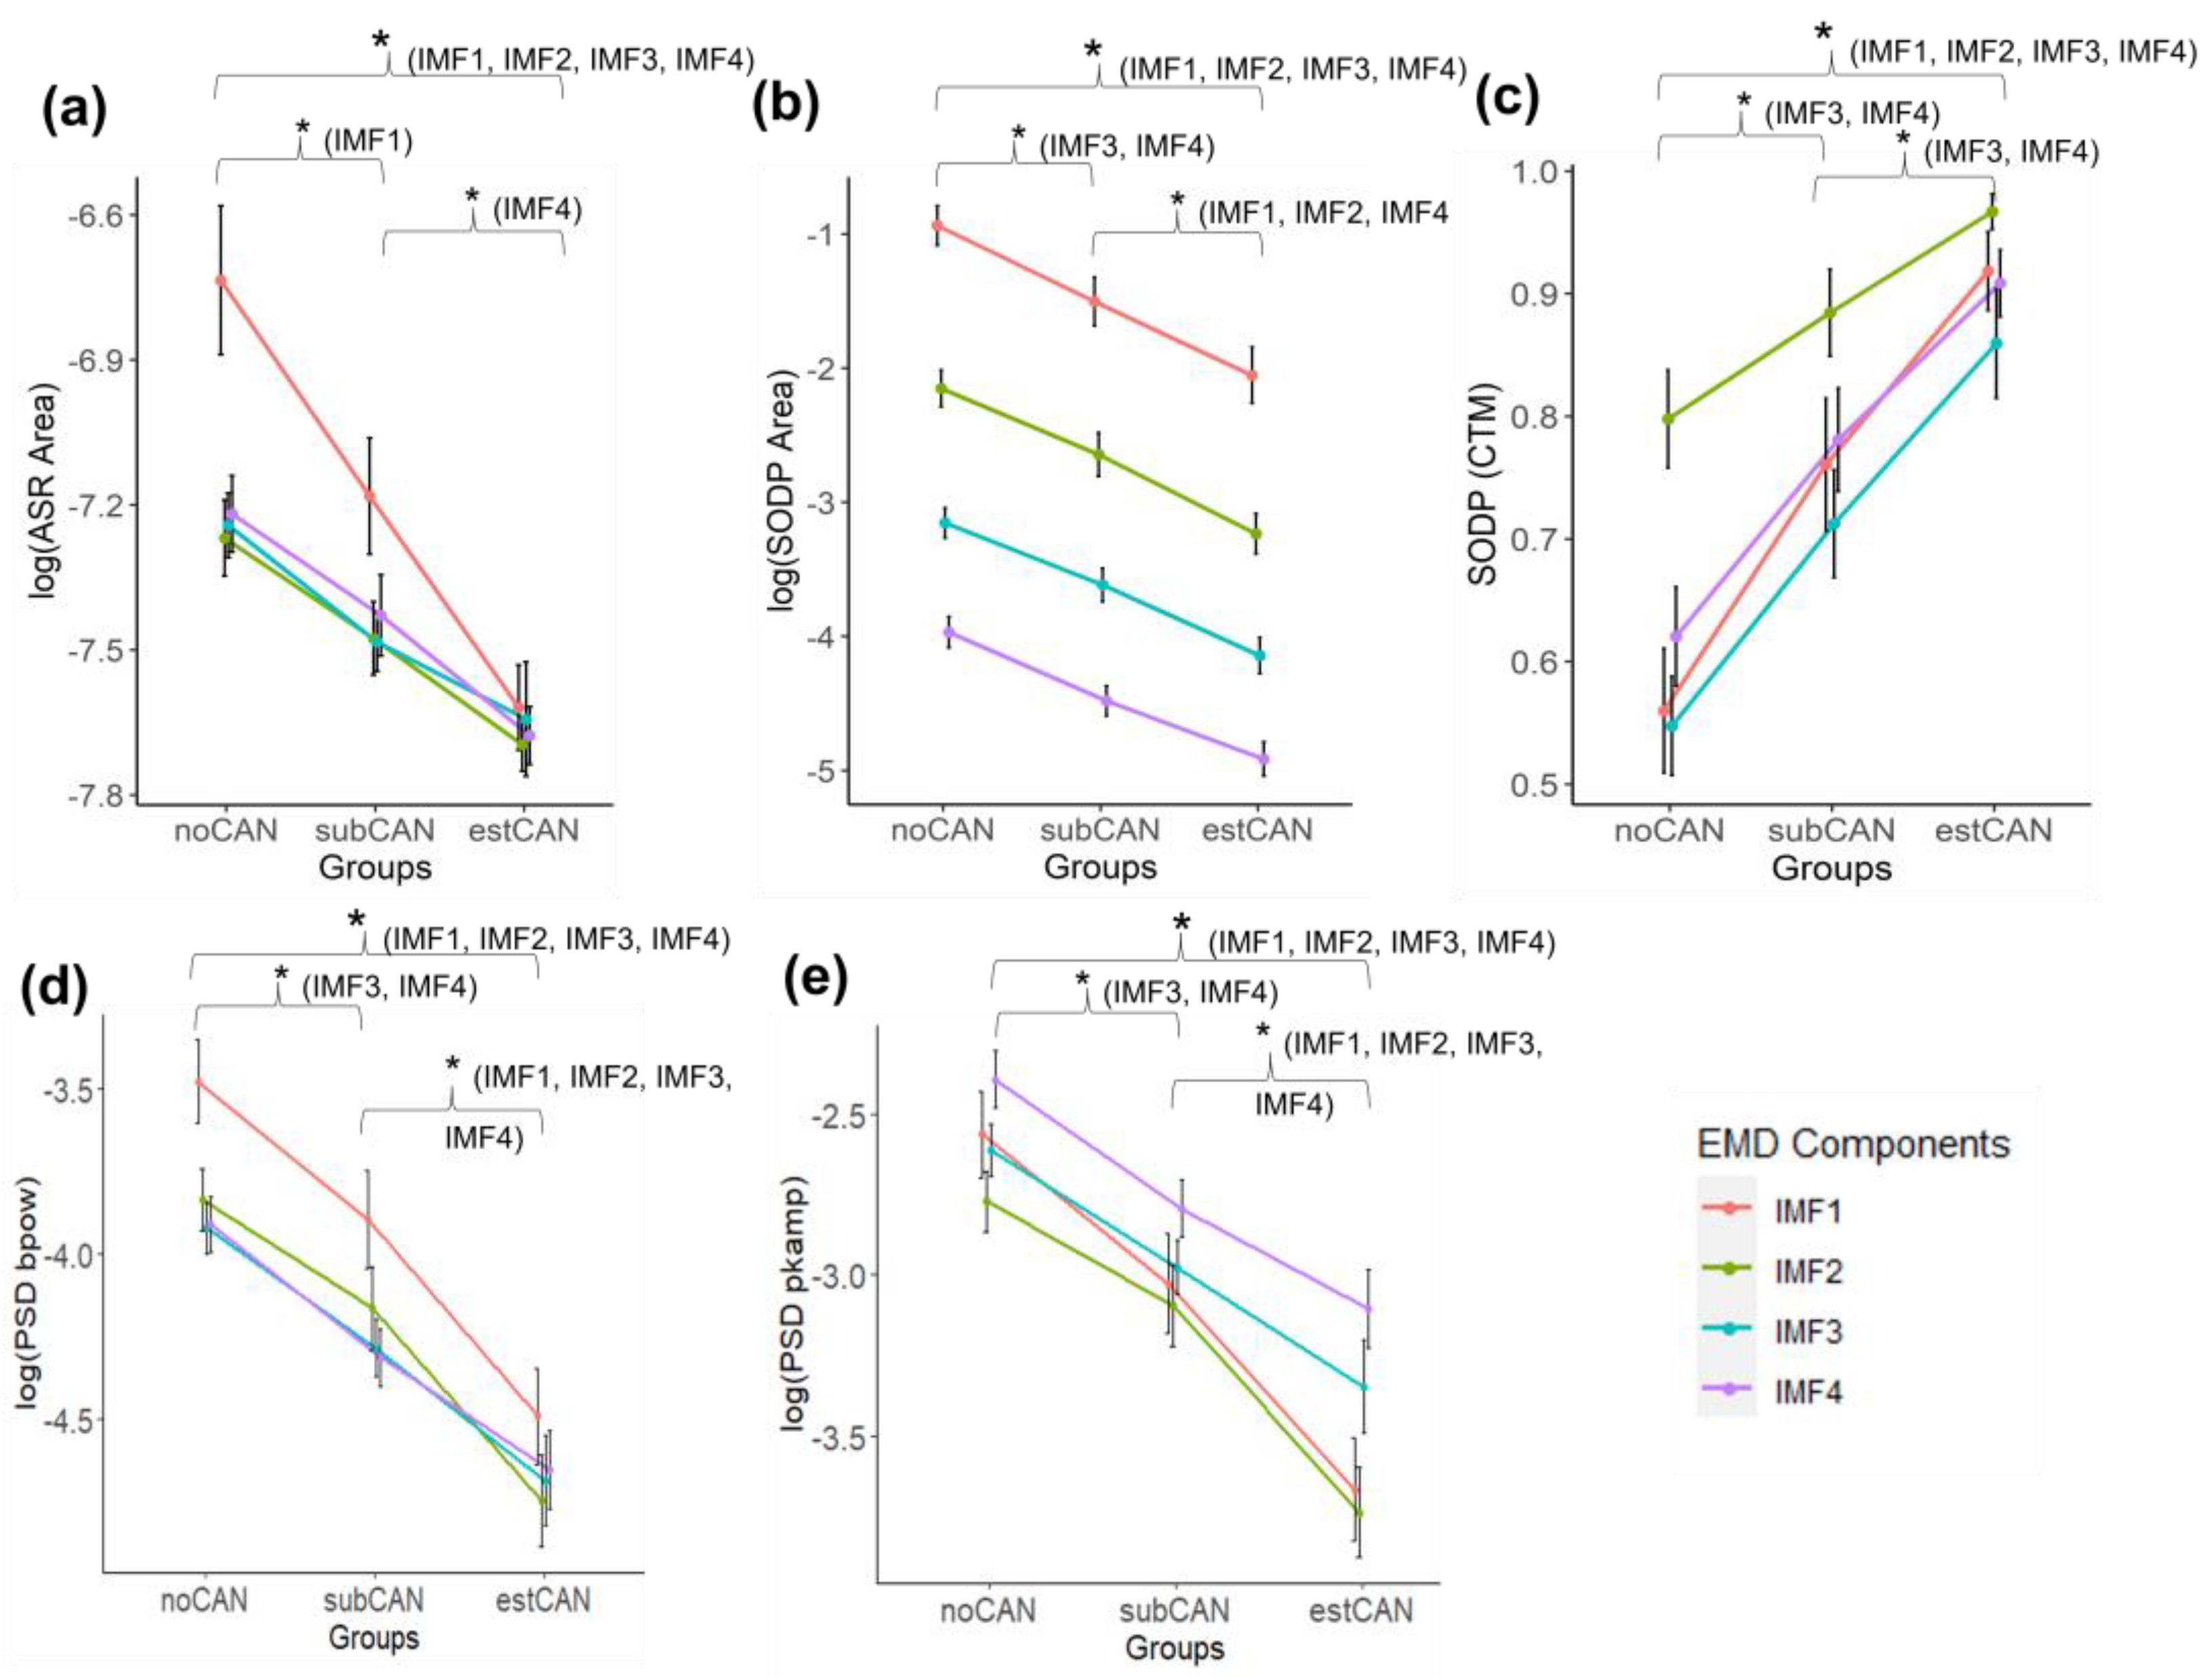
Regarding the log ( A S R a r e a ) of the four EMD components of each group, the posthoc analysis demonstrates that there was a significant difference between the noCAN and estCAN groups (p < 0.01) for all components, a significant difference between the subCAN and estCAN groups (p < 0.05) in the fourth component, and a significant difference between the noCAN and subCAN groups (p < 0.05) in the first component (see Table 2 and Figure 6a).
Considering the log ( S O D P a r e a ) , the posthoc analysis of the four EMD components of each group also revealed a significant difference between the noCAN and estCAN groups (p < 0.01) for all components. Additionally, a significant difference between the noCAN and subCAN (p < 0.05) groups was found for the log ( S O D P a r e a ) of the third and fourth IMFs, and a significant difference between subCAN and estCAN (p < 0.05) for all components, except for the third one (p < 0.09) (see Table 2 and Figure 6b).
The estCAN group shows a significantly higher S O D P C T M mean value (p < 0.01) for all components compared to the noCAN group, as well as a significantly higher mean value (p < 0.05) for the 3rd and 4th IMF components compared to the subCAN group. Similarly, the estCAN group exhibited a significantly higher S O D P C T M mean value (p < 0.05) for the third and fourth components compared to the subCAN group (see Table 2 and Figure 6c).
Lastly, the posthoc analysis of PSD-derived features demonstrates significantly reduced log ( P S D b p o w ) (p < 0.05) and log ( P S D p k a m p ) (p < 0.05) mean values for the estCAN group compared to the noCAN and subCAN groups for all IMFs. Similarly, the subCAN group presented significantly reduced mean values for the log ( P S D b p o w ) (p < 0.05) and log ( P S D p k a m p ) (p < 0.05) parameters compared to the noCAN group for the 3rd and 4th IMF components (see Table 2, Figure 6d,e).

4. Discussion

In summary, it was observed that all features (except the P S D m f r e q ) calculated from the four EMD-extracted IMF components differed significantly between the extreme groups (i.e., noCAN and estCAN). More importantly, the specific IMF components of each feature could effectively distinguish individuals without a CAN diagnosis or with an established CAN from those with subclinical CAN (refer to Figure 6).
This research explores a new approach for analyzing the RR interval signals acquired from type 2 DM individuals at different stages of cardiovascular autonomic neuropathy. We used the EMD method, which decomposes non-stationary and nonlinear signals into IMFs. The findings of this study suggest that employing the nonlinear EMD method enables the extraction of several parameters from heart rate variability that hold promise in identifying changes associated with the manifestation and progression of CAN. Specifically, the complex plane plots from the analytical signal representation and the second-order difference plot of the first four IMFs were used to extract the ASR area , SODP area and SODP CTM features, while the power spectral density of the IMFs was used to obtain the P S D b p o w , PSD pkamp and P S D m f r e q features. These parameters were compared across subjects at distinct stages of CAN (noCAN, subCAN, and estCAN). The main results were as follows: (a) decreased IMF variability and (b) decreased IMF power distribution, according to CAN progression.
The autonomic nervous system (ANS) maintains homeostasis by regulating arterial pressure and all significant cardiovascular variables through the sympathetic and parasympathetic divisions [63]. The ANS imbalance manifesting as CAN in the diabetic population is an important predictor of cardiovascular events [7], as reflected in the abnormal HRV indices. The nonlinear analysis methods of HRV allow a more subtle characterization of autonomic balance and are reliable markers of morbidity and mortality in patients with cardiovascular disease [7]. Furthermore, nonlinear HRV indices in diabetic populations may have diagnostic and prognostic potential for identifying asymptomatic CAN and cardiovascular events [21]. A recent study found that prediabetes and T2DM patients were independently associated with lower HRV (both in the time and frequency domains), strongly suggesting that the HRV indices could help identify subclinical CAN [64]. In another study, T2DM patients presented an overall decrease in HRV and decreased sympathetic and parasympathetic activity [15]. Correspondingly, BRS is also a sensitive indicator of CAN in DM patients [65] and can be associated with cardiovascular events [9].
Previous studies [66,67] have demonstrated a correlation between the first four IMFs extracted by EMD and the HRV frequency components (VHF, HF, LF, and VLF, respectively). The HRV oscillatory components are usually divided into the following spectral profiles: (a) very-high-frequency (VHF, 0.4 to 1 Hz); (b) high-frequency (HF, 0.15 to 0.40 Hz); (c) low-frequency (LF, 0.04 to 0.15 Hz); (d) very-low-frequency (VLF, <0.04 Hz) bands [68]. However, in short-term recordings (5–10 min), the spectral analysis of HRV holds three main frequency bands: HF, LF, and VLF [68]. By examining the power spectrum density of the HRV signal’s EMD components (Figure 5), we could observe the energy distribution according to the different frequency components and associate IMF1 with the HF component, IMF3 with the LF component, and IMF4 with the VLF band. IMF2 is not clearly defined between the LF and HF components. Importantly, each frequency component can be related to the different activities of the autonomic nervous system. The HF band reflects parasympathetic activity and is a marker of cardiac vagal modulation. In contrast, the LF band modifies the parasympathetic and sympathetic nervous systems and indicates baroreceptor activity during resting conditions [68]. We noticed that the mean values of P S D b p o w and PSD pkamp decrease as CAN progresses. This effect was more evident when comparing the estCAN group to the noCAN or subCAN groups, as all EMD components were significant. This reduction was less noticeable when comparing the noCAN group to the subCAN group, as only the 3rd and 4th IMFs were significant. These results demonstrated reduced sympathetic and parasympathetic activity and baroreceptor activity as the disease progressed.
In the subCAN group, the sympathetic activity (IMF2, IMF3, and IMF4) had a higher amplitude than the parasympathetic activity (mainly IMF1). In contrast, in the noCAN group, the parasympathetic modulation was higher. This result was expected since autonomic nerves are affected in a length-dependent manner [69,70]. The first manifestation of CAN often occurs due to damage in the vagus nerve, the longest nerve of the ANS, disrupting the parasympathetic activity and, consequently, increasing the sympathetic tone [69,71]. This fact is reflected in the results, where the HF components of HRV, as represented by IMF1 and partly by IMF2, were not significantly different between the noCAN and subCAN groups, while the LF components represented by IMF3 and IMF4 were significantly different. Therefore, for the CAN subclinical assessment, it would be more important to use parameters derived from the lower frequency contents of the HRV.
Considering the features obtained from the analytical signal representation and the second-order difference plot, we evaluated the presence and extent of variability in the IMFs of RR intervals in the CAN groups. It was observed that the ASR area and SODP area values decreased in the IMFs of the subCAN group compared to noCAN and decreased further in the IMFs of the estCAN group compared to the others, indicating a pattern of decreasing variability according to CAN progression. In contrast, the SODP CTM values increase in the noCAN group compared to subCAN, and a further increase in the estCAN group. The lower values of the SODP CTM indicate higher dispersion as the signal is spread and the number of points within the same radius is reduced. Thus, similar to ASR area and SODP area , the SODP CTM parameter is associated with decreased variability in IMFs for more severe levels of CAN. The heart rate response test is still preserved in the subclinical stage, and symptoms are absent. However, baroreflex sensitivity tests present alterations and could explain why only the ASR area , SODP area , and SODP CTM of some IMFs could distinguish subtle changes in the RR interval of the subCAN group.
Several studies [18,21,22,43,72,73,74,75,76,77,78] have demonstrated the effectiveness of nonlinear HRV methods in evaluating the progression of CAN. However, many of these approaches have addressed CAN as a binary classification problem, distinguishing only between no CAN and CAN [21,73,74]. Others have examined cardiovascular function in healthy individuals and those with DM [18,22,43]. As a result, they fail to capture the distinct stages of disease progression. Nonetheless, some works [72,76,77,78] evaluated CAN as a multiclass problem, separating the groups by levels of severity, which aligns with the approach proposed in our work. For example, Selvan et al. [76] evaluated time segments of ECG recordings from individuals with different disease severities and healthy individuals using complexity analysis, specifically computing the fractal dimension. Similarly, Cornforth et al. [77] and Jelinek et al. [78] categorized the participants into three CAN groups (i.e., without, early, and definite) and applied techniques such as multiscale entropy, multifractal detrended fluctuation analysis, and Renyi entropy to sets of RR intervals. Additionally, Khandoker et al. [72] introduced a novel HRV parameter named tone-entropy, which demonstrated the ability to differentiate between stages of CAN progression. In contrast to our study, these studies have certain limitations. Firstly, they relied solely on CARTs to classify participants, whereas we employed CARTs and BRS measurements. Secondly, they had relatively small or disproportional sample sizes, potentially impacting the generalizability of their findings. Lastly, there was a lack of diabetes clinical data available (e.g., DM type and duration) for the participants, which restricts further analysis possibilities.

5. Conclusions

In this work, we investigated the relevance of EMD-based features extracted from RR intervals to identify changes between different levels of CAN severity. We observed a gradual reduction in the IMF variability and power distribution over the frequency correlated to the stages of CAN severity, indicating the loss of complexity and decrease in autonomic nervous system tones as CAN progressed. All the features, except P S D m f r e q , could distinguish between individuals with no CAN and those with either subclinical or established CAN. We highlight that the specific IMF components of each feature could effectively distinguish individuals without a CAN diagnosis or with established CAN from those with subclinical CAN. Subclinical CAN detection is essential for timely interventions to improve prognostics and potentially reverse disease progression. Thus, this study’s findings suggest that EMD-based outcome measures are promising in characterizing changes associated with CAN progression in individuals with T2DM.
A limitation of our study is that we did not compare the proposed features with the standard HRV features to determine whether they offer superior performance or contribute to better differentiation between the groups. Nonetheless, this method can be further developed by combining a larger sample size with other HRV-based indices and user-independent classification algorithms. Future studies could also explore the progression of CAN in individuals with type 1 DM and gestational DM. These could contribute to developing diagnostic tools for a more accurate assessment of CAN progression.

Author Contributions

Conceptualization, S.C., F.R.A., M.A.F. and J.L.B.M.; Methodology, S.C.; Software, S.C.; Validation, S.C., F.R.A., M.A.F. and J.L.B.M.; Formal analysis, S.C.; Investigation, S.C.; Resources, J.L.B.M.; Data curation, S.C.; Writing—original draft preparation, S.C.; Writing—review and editing, F.R.A., M.A.F. and J.L.B.M.; Visualization, S.C.; Supervision, J.L.B.M.; Project administration, J.L.B.M.; Funding acquisition, F.R.A. and J.L.B.M. All authors have read and agreed to the published version of the manuscript.

Funding

This research was funded by the Conselho Nacional de Desenvolvimento Científico e Tecnológico—CNPq, grants numbers: 142180/2018-1 (S.C., scholarship), 170783/2017-9 (M.A.F., scholarship), and 313792/2021-6 (J.L.B.M., research productivity scholarship).

Institutional Review Board Statement

The study was conducted in accordance with the Declaration of Helsinki and approved by the Ethics Committee of Professor Polydoro Ernany University Hospital of the Federal University of Santa Catarina—HU/UFSC/EBSERH (protocol code 3.326.385, date of approval: 26 May 2020).

Informed Consent Statement

Informed consent was obtained from all subjects involved in the study.

Data Availability Statement

The data supporting this study’s findings are available on request from the corresponding authors, S.C. and J.L.B.M. The data are not publicly available due to ethical restrictions.

Conflicts of Interest

The authors declare no conflict of interest. The funders had no role in the study’s design; in the collection, analyses or interpretation of data; in the writing of the manuscript; or in the decision to publish the results.

References

  1. International Diabetes Federation. IDF Diabetes Atlas, 10th ed.; International Diabetes Federation: Brussels, Belgium, 2021. [Google Scholar]
  2. American Diabetes Association. 2. Classification and Diagnosis of Diabetes: Standards of Medical Care in Diabetes–2021. Diabetes Care 2021, 44 (Suppl. S1), S15–S33. [Google Scholar] [CrossRef]
  3. Vinik, A.I.; Erbas, T.; Casellini, C.M. Diabetic Cardiac Autonomic Neuropathy, Inflammation and Cardiovascular Disease. J. Diabetes Investig. 2013, 4, 4–18. [Google Scholar] [CrossRef] [PubMed]
  4. Fisher, V.L.; Tahrani, A.A. Cardiac Autonomic Neuropathy in Patients with Diabetes Mellitus: Current Perspectives. Diabetes Metab. Syndr. Obes. 2017, 10, 419–434. [Google Scholar] [CrossRef] [PubMed] [Green Version]
  5. Williams, S.; Raheim, S.A.; Khan, M.I.; Rubab, U.; Kanagala, P.; Zhao, S.S.; Marshall, A.; Brown, E.; Alam, U. Cardiac Autonomic Neuropathy in Type 1 and 2 Diabetes: Epidemiology, Pathophysiology, and Management. Clin. Ther. 2022, 44, 2022. [Google Scholar] [CrossRef]
  6. O’Brien, I.A.; O’Hare, P.; Corrall, R.J.M. Heart Rate Variability in Healthy Subjects: Effect of Age and the Derivation of Normal Ranges for Tests of Autonomic Function. Heart 1986, 55, 348–354. [Google Scholar] [CrossRef] [PubMed] [Green Version]
  7. Vinik, A.I.; Casellini, C.; Parson, H.K.; Colberg, S.R.; Nevoret, M.-L. Cardiac Autonomic Neuropathy in Diabetes: A Predictor of Cardiometabolic Events. Front. Neurosci. 2018, 12, 591. [Google Scholar] [CrossRef]
  8. Ang, L.; Dillon, B.; Mizokami-Stout, K.; Pop-Busui, R. Cardiovascular Autonomic Neuropathy: A Silent Killer with Long Reach. Auton. Neurosci. 2020, 225, 102646. [Google Scholar] [CrossRef]
  9. Spallone, V. Update on the Impact, Diagnosis and Management of Cardiovascular Autonomic Neuropathy in Diabetes: What Is Defined, What Is New, and What Is Unmet. Diabetes Metab. J. 2019, 43, 3. [Google Scholar] [CrossRef]
  10. Acharya, R.; Kannathal, N.; Krishnan, S.M. Comprehensive Analysis of Cardiac Health Using Heart Rate Signals. Physiol. Meas. 2004, 25, 1139–1151. [Google Scholar] [CrossRef]
  11. Rolim, L.C.; de Souza, J.S.T.; Dib, S.A. Tests for Early Diagnosis of Cardiovascular Autonomic Neuropathy: Critical Analysis and Relevance. Front. Endocrinol. 2013, 4, 2–5. [Google Scholar] [CrossRef] [Green Version]
  12. Pop-Busui, R.; Backlund, J.Y.C.; Bebu, I.; Braffett, B.H.; Lorenzi, G.; White, N.H.; Lachin, J.M.; Soliman, E.Z. Utility of Using Electrocardiogram Measures of Heart Rate Variability as a Measure of Cardiovascular Autonomic Neuropathy in Type 1 Diabetes Patients. J. Diabetes Investig. 2022, 13, 125–133. [Google Scholar] [CrossRef]
  13. Castiglioni, P.; Faini, A.; Nys, A.; De Busser, R.; Scherrenberg, M.; Baldussu, E.; Parati, G.; Dendale, P. Heart Rate Variability for the Early Detection of Cardiac Autonomic Dysfunction in Type 1 Diabetes. Front. Physiol. 2022, 13, 1319. [Google Scholar] [CrossRef]
  14. Cardoso, C.R.L.; de Oliveira, V.A.G.; Leite, N.C.; Salles, G.F. Prognostic Importance of Cardiovascular Autonomic Neuropathy on Cardiovascular and Mortality Outcomes in Individuals with Type 2 Diabetes: The Rio de Janeiro Type 2 Diabetes Cohort. Diabetes Res. Clin. Pract. 2023, 196, 110232. [Google Scholar] [CrossRef]
  15. Benichou, T.; Pereira, B.; Mermillod, M.; Tauveron, I.; Pfabigan, D.; Maqdasy, S.; Dutheil, F. Heart Rate Variability in Type 2 Diabetes Mellitus: A Systematic Review and Meta-Analysis. PLoS ONE 2018, 13, e0195166. [Google Scholar] [CrossRef] [PubMed] [Green Version]
  16. Sassi, R.; Cerutti, S.; Lombardi, F.; Malik, M.; Huikuri, H.V.; Peng, C.-K.; Schmidt, G.; Yamamoto, Y.; Gorenek, B.; Lip, G.Y.H.; et al. Advances in Heart Rate Variability Signal Analysis: Joint Position Statement by the e-Cardiology ESC Working Group and the European Heart Rhythm Association Co-Endorsed by the Asia Pacific Heart Rhythm Society. Europace 2015, 17, 1341–1353. [Google Scholar] [CrossRef]
  17. Bravi, A.; Longtin, A.; Seely, A.J. Review and Classification of Variability Analysis Techniques with Clinical Applications. Biomed. Eng. Online. 2011, 10, 90. [Google Scholar] [CrossRef] [Green Version]
  18. Faust, O.; Acharya, U.R.; Molinari, F.; Chattopadhyay, S.; Tamura, T. Linear and Nonlinear Analysis of Cardiac Health in Diabetic Subjects. Biomed. Signal. Process. Control. 2012, 7, 295–302. [Google Scholar] [CrossRef]
  19. Jelinek, H.F.; Md Imam, H.; Al-Aubaidy, H.; Khandoker, A.H. Association of Cardiovascular Risk Using Nonlinear Heart Rate Variability Measures with the Framingham Risk Score in a Rural Population. Front. Physiol. 2013, 4, 186. [Google Scholar] [CrossRef] [Green Version]
  20. Rajendra Acharya, U.; Faust, O.; Adib Kadri, N.; Suri, J.S.; Yu, W. Automated Identification of Normal and Diabetes Heart Rate Signals Using Nonlinear Measures. Comput. Biol. Med. 2013, 43, 1523–1529. [Google Scholar] [CrossRef] [PubMed]
  21. Khandoker, A.H.; Jelinek, H.F.; Palaniswami, M. Identifying Diabetic Patients with Cardiac Autonomic Neuropathy by Heart Rate Complexity Analysis. Biomed. Eng. Online 2009, 8, 3. [Google Scholar] [CrossRef] [PubMed] [Green Version]
  22. Roy, B.; Ghatak, S. Nonlinear Methods to Assess Changes in Heart Rate Variability in Type 2 Diabetic Patients—PubMed. Arq. Bras. Cardiol. 2013, 101, 317–327. [Google Scholar]
  23. Huang, N.E.; Shen, Z.; Long, S.R.; Wu, M.C.; Shih, H.H.; Zheng, Q.; Yen, N.-C.; Tung, C.C.; Liu, H.H. The Empirical Mode Decomposition and the Hilbert Spectrum for Nonlinear and Non-Stationary Time Series Analysis. Proc. R. Soc. Lond. Ser. A Math. Phys. Eng. Sci. 1998, 454, 903–995. [Google Scholar] [CrossRef]
  24. Maheshwari, S.; Kumar, A. Empirical Mode Decomposition: Theory & Applications. Int. J. Electron. Electr. Eng. 2014, 7, 873–878. [Google Scholar]
  25. Bajaj, V.; Pachori, R.B. Classification of Seizure and Nonseizure EEG Signals Using Empirical Mode Decomposition. IEEE Trans. Inf. Technol. Biomed. 2012, 16, 1135–1142. [Google Scholar] [CrossRef]
  26. Pachori, R.B.; Patidar, S. Epileptic Seizure Classification in EEG Signals Using Second-Order Difference Plot of Intrinsic Mode Functions. Comput. Methods Programs Biomed. 2014, 113, 494–502. [Google Scholar] [CrossRef]
  27. Salankar, N.; Mishra, P.; Garg, L. Emotion Recognition from EEG Signals Using Empirical Mode Decomposition and Second-Order Difference Plot. Biomed. Signal. Process. Control. 2021, 65, 102389. [Google Scholar] [CrossRef]
  28. Abdulrahman, A.; Baykara, M.; Alakus, T.B. A Novel Approach for Emotion Recognition Based on EEG Signal Using Deep Learning. Appl. Sci. 2022, 12, 10028. [Google Scholar] [CrossRef]
  29. Hadoush, H.; Alafeef, M.; Abdulhay, E. Automated Identification for Autism Severity Level: EEG Analysis Using Empirical Mode Decomposition and Second Order Difference Plot. Behav. Brain Res. 2019, 362, 240–248. [Google Scholar] [CrossRef] [PubMed]
  30. Mishra, V.K.; Bajaj, V.; Kumar, A.; Singh, G.K. Analysis of ALS and Normal EMG Signals Based on Empirical Mode Decomposition. IET Sci. Meas. Technol. 2016, 10, 963–971. [Google Scholar] [CrossRef]
  31. Mishra, V.K.; Bajaj, V.; Kumar, A.; Sharma, D.; Singh, G.K. An Efficient Method for Analysis of EMG Signals Using Improved Empirical Mode Decomposition. AEU—Int. J. Electron. Commun. 2017, 72, 200–209. [Google Scholar] [CrossRef]
  32. Naik, G.R.; Selvan, S.E.; Nguyen, H.T. Single-Channel EMG Classification with Ensemble-Empirical-Mode-Decomposition-Based ICA for Diagnosing Neuromuscular Disorders. IEEE Trans. Neural Syst. Rehabil. Eng. 2016, 24, 734–743. [Google Scholar] [CrossRef]
  33. Dubey, R.; Kumar, M.; Upadhyay, A.; Pachori, R.B. Automated Diagnosis of Muscle Diseases from EMG Signals Using Empirical Mode Decomposition Based Method. Biomed. Signal. Process. Control. 2022, 71, 103098. [Google Scholar] [CrossRef]
  34. Hasan, N.I.; Bhattacharjee, A. Deep Learning Approach to Cardiovascular Disease Classification Employing Modified ECG Signal from Empirical Mode Decomposition. Biomed. Signal. Process. Control. 2019, 52, 128–140. [Google Scholar] [CrossRef]
  35. Rakshit, M.; Das, S. An Efficient ECG Denoising Methodology Using Empirical Mode Decomposition and Adaptive Switching Mean Filter. Biomed. Signal. Process. Control. 2018, 40, 140–148. [Google Scholar] [CrossRef]
  36. Kumar, S.; Panigrahy, D.; Sahu, P.K. Denoising of Electrocardiogram (ECG) Signal by Using Empirical Mode Decomposition (EMD) with Non-Local Mean (NLM) Technique. Biocybern. Biomed. Eng. 2018, 38, 297–312. [Google Scholar] [CrossRef]
  37. Mohanty, M.; Dash, M.; Biswal, P.; Sabut, S. Classification of Ventricular Arrhythmias Using Empirical Mode Decomposition and Machine Learning Algorithms. Prog. Artif. Intell. 2021, 10, 489–504. [Google Scholar] [CrossRef]
  38. -Bautista, C.; Rangel-Rodriguez, M.A.; Perez-Sanchez, A.H.; Amezquita-Sanchez, A.V.; Granados-Lieberman, J.P.; Valtierra-Rodriguez, D.; Bak, E.; Centeno-Bautista, M.A.; Rangel-Rodriguez, A.H.; Perez-Sanchez, A.V.; et al. Electrocardiogram Analysis by Means of Empirical Mode Decomposition-Based Methods and Convolutional Neural Networks for Sudden Cardiac Death Detection. Appl. Sci. 2023, 13, 3569. [Google Scholar] [CrossRef]
  39. Soh, D.C.K.; Ng, E.Y.K.; Jahmunah, V.; Oh, S.L.; San, T.R.; Acharya, U.R. A Computational Intelligence Tool for the Detection of Hypertension Using Empirical Mode Decomposition. Comput. Biol. Med. 2020, 118, 103630. [Google Scholar] [CrossRef]
  40. Barnova, K.; Martinek, R.; Jaros, R.; Kahankova, R.; Matonia, A.; Jezewski, M.; Czabanski, R.; Horoba, K.; Jezewski, J. A Novel Algorithm Based on Ensemble Empirical Mode Decomposition for Non-Invasive Fetal ECG Extraction. PLoS ONE 2021, 16, e0256154. [Google Scholar] [CrossRef]
  41. Echeverria, J.C.; Crowe, J.A.; Woolfson, I.M.S.; Hayes-Gill, I.B.R. Application of Empirical Mode Decomposition to Heart Rate Variability Analysis. Med. Biol. Eng. Comput. 2001, 39, 471–479. [Google Scholar] [CrossRef]
  42. Souza Neto, E.P.; Custaud, M.A.; Cejka, J.C.; Abry, P.; Frutoso, J.; Gharib, C.; Flandrin, P. Assessment of Cardiovascular Autonomic Control by the Empirical Mode Decomposition. Methods Inf. Med. 2004, 43, 60–65. [Google Scholar] [CrossRef] [PubMed] [Green Version]
  43. Pachori, R.B.; Avinash, P.; Shashank, K.; Sharma, R.; Acharya, U.R. Application of Empirical Mode Decomposition for Analysis of Normal and Diabetic RR-Interval Signals. Expert. Syst. Appl. 2015, 42, 4567–4581. [Google Scholar] [CrossRef]
  44. Pachori, R.B.; Kumar, M.; Avinash, P.; Shashank, K.; Acharya, U.R. An Improved Online Paradigm for Screening of Diabetic Patients Using RR-Interval Signals. J. Mech. Med. Biol. 2016, 16, 1640003. [Google Scholar] [CrossRef]
  45. Acharya, U.R.; Fujita, H.; Sudarshan, V.K.; Lih Oh, S.; Muhammad, A.; Koh, J.E.W.; Hong Tan, J.; Chua, C.K.; Poo Chua, K.; San Tan, R. Application of Empirical Mode Decomposition (EMD) for Automated Identification of Congestive Heart Failure Using Heart Rate Signals. Neural Comput. Appl. 2017, 28, 3073–3094. [Google Scholar] [CrossRef]
  46. Sood, S.; Kumar, M.; Pachori, R.B.; Acharya, U.R. Application of Empirical Mode Decomposition-Based Features for Analysis of Normal and CAD Heart Rate Signals. J. Mech. Med. Biol. 2016, 16, 1640002. [Google Scholar] [CrossRef]
  47. Shi, M.; He, H.; Geng, W.; Wu, R.; Zhan, C.; Jin, Y.; Zhu, F.; Ren, S.; Shen, B. Early Detection of Sudden Cardiac Death by Using Ensemble Empirical Mode Decomposition-Based Entropy and Classical Linear Features from Heart Rate Variability Signals. Front. Physiol. 2020, 11, 118. [Google Scholar] [CrossRef]
  48. Erdfelder, E.; Faul, F.; Buchner, A.; Lang, A.G. Statistical Power Analyses Using G*Power 3.1: Tests for Correlation and Regression Analyses. Behav. Res. Methods 2009, 41, 1149–1160. [Google Scholar] [CrossRef] [Green Version]
  49. Borowik, E.; Grabowicz, W.; Grycewicz, T.; Lubiński, A. Clinical Usefulness of Baroreflex Sensitivity Test in the Detection of Cardiovascular Autonomic Neuropathy in Patients with Type 2 Diabetes Mellitus. Pol. Merkur. Lek. 2015, 39, 277–280. [Google Scholar]
  50. Kück, J.-L.; Bönhof, G.J.; Strom, A.; Zaharia, O.-P.; Müssig, K.; Szendroedi, J.; Roden, M.; Ziegler, D. Impairment in Baroreflex Sensitivity in Recent-Onset Type 2 Diabetes without Progression over 5 Years. Diabetes 2020, 69, 1011–1019. [Google Scholar] [CrossRef]
  51. Petry, D.; de Godoy Marques, C.M.; Marques, J.L.B. Baroreflex Sensitivity with Different Lags for the Evaluation of Cardiovascular Autonomic Neuropathy in Subjects with Diabetes. Comput. Biol. Med. 2020, 127, 104098. [Google Scholar] [CrossRef]
  52. Ewing, D.J.; Campbell, I.W.; Clarke, B.F. Assessment of Cardiovascular Effects in Diabetic Autonomic Neuropathy and Prognostic Implications. Ann. Intern. Med. 1980, 92, 308–311. [Google Scholar] [CrossRef] [PubMed]
  53. Rajala, S.; Lindholm, H.; Taipalus, T. Comparison of Photoplethysmogram Measured from Wrist and Finger and the Effect of Measurement Location on Pulse Arrival Time. Physiol. Meas. 2018, 39, 075010. [Google Scholar] [CrossRef] [PubMed]
  54. Kuusela, T. Methodological Aspects of Baroreflex Sensitivity Analysis. In Heart Rate Variability (HRV) Signal Analysis: Clinical Applications; Kamath, M.V., Watanabe, M.A., Upton, A.R.M., Eds.; CRC Press: Boca Raton, FL, USA, 2012; pp. 43–58. [Google Scholar] [CrossRef]
  55. Tank, J.; Baevski, R.M.; Fender, A.; Baevski, A.R.; Graves, K.F.; Ploewka, K.; Weck, M. Reference Values of Indices of Spontaneous Baroreceptor Reflex Sensitivity. Am. J. Hypertens. 2000, 13, 268–275. [Google Scholar] [CrossRef] [PubMed] [Green Version]
  56. Kardos, A.; Watterich, G.; de Menezes, R.; Csanády, M.; Casadei, B.; Rudas, L. Determinants of Spontaneous Baroreflex Sensitivity in a Healthy Working Population. Hypertension 2001, 37, 911–916. [Google Scholar] [CrossRef] [PubMed] [Green Version]
  57. Pan, J.; Tompkins, W.J. A Real-Time QRS Detection Algorithm. IEEE Trans. Biomed. Eng. 1985, 3, 230–236. [Google Scholar] [CrossRef]
  58. Vest, A.N.; Da Poian, G.; Li, Q.; Liu, C.; Nemati, S.; Shah, A.J.; Clifford, G.D. An Open-Source Benchmarked Toolbox for Cardiovascular Waveform and Interval Analysis. Physiol. Meas. 2018, 39, aae021. [Google Scholar] [CrossRef]
  59. Lai, Y.-C.; Ye, N. Recent Developments in Chaotic Time Series Analysis. Int. J. Bifurc. Chaos 2003, 13, 1383–1422. [Google Scholar] [CrossRef]
  60. Cohen, M.E.; Hudson, D.L.; Deedwania, P.C. Applying Continuous Chaotic Modeling to Cardiac Signal Analysis. IEEE Eng. Med. Biol. Mag. 1996, 15, 97–102. [Google Scholar] [CrossRef]
  61. Cavalheiro, G.L.; Almeida, M.F.S.; Pereira, A.A.; Andrade, A.O. Study of Age-Related Changes in Postural Control during Quiet Standing through Linear Discriminant Analysis. Biomed. Eng. Online 2009, 8, 35. [Google Scholar] [CrossRef] [Green Version]
  62. Subasi, A. Practical Guide for Biomedical Signals Analysis Using Machine Learning Techniques: A MATLAB Based Approach; Academic Press: Cambridge, MA, USA, 2019. [Google Scholar]
  63. Orini, M.; Barbieri, R.; Nardelli, M.; Scilingo, E.P.; Valenza, G. Introduction to Complex Cardiovascular Physiology. In Complexity and Nonlinearity in Cardiovascular Signals; Barbieri, R., Scilingo, E.P., Valenza, G., Eds.; Springer: Cham, Switzerland, 2017; pp. 3–44. ISBN 9783319587097. [Google Scholar]
  64. Coopmans, C.; Zhou, T.L.; Henry, R.M.A.; Heijman, J.; Schaper, N.C.; Koster, A.; Schram, M.T.; van der Kallen, C.J.H.; Wesselius, A.; den Engelsman, R.J.A. Both Prediabetes and Type 2 Diabetes Are Associated with Lower Heart Rate Variability: The Maastricht Study. Diabetes Care 2020, 43, 1126–1133. [Google Scholar] [CrossRef]
  65. Frattola, A.; Parati, G.; Gamba, P.; Paleari, F.; Mauri, G.; di Rienzo, M.; Castiglioni, P.; Mancia, G. Time and Frequency Domain Estimates of Spontaneous Baroreflex Sensitivity Provide Early Detection of Autonomic Dysfunction in Diabetes Mellitus. Diabetologia 1997, 40, 1470–1475. [Google Scholar] [CrossRef] [Green Version]
  66. Pan, W.; He, A.; Feng, K.; Li, Y.; Wu, D.; Liu, G. Multi-Frequency Components Entropy as Novel Heart Rate Variability Indices in Congestive Heart Failure Assessment. IEEE Access. 2019, 7, 37708–37717. [Google Scholar] [CrossRef]
  67. Chen, M.; He, A.; Feng, K.; Liu, G.; Wang, Q. Empirical Mode Decomposition as a Novel Approach to Study Heart Rate Variability in Congestive Heart Failure Assessment. Entropy 2019, 21, 1169. [Google Scholar] [CrossRef] [Green Version]
  68. Shaffer, F.; Ginsberg, J.P. An Overview of Heart Rate Variability Metrics and Norms. Front. Public Health 2017, 5, 258. [Google Scholar] [CrossRef] [Green Version]
  69. Balcıoğlu, A.S. Diabetes and Cardiac Autonomic Neuropathy: Clinical Manifestations, Cardiovascular Consequences, Diagnosis and Treatment. World J. Diabetes 2015, 6, 80. [Google Scholar] [CrossRef]
  70. Vinik, A.I.; Ziegler, D. Diabetic Cardiovascular Autonomic Neuropathy. Circulation 2007, 115, 387–397. [Google Scholar] [CrossRef]
  71. Pop-Busui, R. Cardiac Autonomic Neuropathy in Diabetes: A Clinical Perspective. Diabetes Care 2010, 33, 434. [Google Scholar] [CrossRef] [PubMed] [Green Version]
  72. Khandoker, A.H.; Jelinek, H.F.; Moritani, T.; Palaniswami, M. Association of Cardiac Autonomic Neuropathy with Alteration of Sympatho-Vagal Balance through Heart Rate Variability Analysis. Med. Eng. Phys. 2010, 32, 161–167. [Google Scholar] [CrossRef] [PubMed]
  73. Alkhodari, M.; Rashid, M.; Mukit, M.A.; Ahmed, K.I.; Mostafa, R.; Parveen, S.; Khandoker, A.H. Screening Cardiovascular Autonomic Neuropathy in Diabetic Patients with Microvascular Complications Using Machine Learning: A 24-Hour Heart Rate Variability Study. IEEE Access. 2021, 9, 119171–119187. [Google Scholar] [CrossRef]
  74. Carricarte Naranjo, C.; Sanchez-Rodriguez, L.M.; Brown Martínez, M.; Estévez Báez, M.; Machado García, A. Permutation Entropy Analysis of Heart Rate Variability for the Assessment of Cardiovascular Autonomic Neuropathy in Type 1 Diabetes Mellitus. Comput. Biol. Med. 2017, 86, 90–97. [Google Scholar] [CrossRef]
  75. Lin, K.; Wei, L.; Huang, Z.; Zeng, Q. Combination of Ewing Test, Heart Rate Variability, and Heart Rate Turbulence Analysis for Early Diagnosis of Diabetic Cardiac Autonomic Neuropathy. Medicine 2017, 96, e8296. [Google Scholar] [CrossRef] [PubMed]
  76. Selvan, S.S.; Arjunan, S.P.; Swaminathan, R.; Kumar, D.K. Complexity Analysis in the PR, QT, RR and ST Segments of ECG for Early Assessment of Severity in Cardiac Autonomic Neuropathy. Appl. Sci. 2022, 12, 5746. [Google Scholar] [CrossRef]
  77. Cornforth, D.; Jelinek, H.F.; Tarvainen, M. A Comparison of Nonlinear Measures for the Detection of Cardiac Autonomic Neuropathy from Heart Rate Variability. Entropy 2015, 17, 1425–1440. [Google Scholar] [CrossRef] [Green Version]
  78. Jelinek, H.F.; Cornforth, D.J.; Tarvainen, M.P.; Khalaf, K. Investigation of Linear and Nonlinear Properties of a Heartbeat Time Series Using Multiscale Rényi Entropy. Entropy 2019, 21, 727. [Google Scholar] [CrossRef] [Green Version]
Figure 1. A block diagram illustrating the proposed methodology for investigating cardiovascular autonomic neuropathy (CAN) in individuals with type 2 diabetes mellitus (T2DM) through the application of empirical mode decomposition (EMD) to heart rate variability (HRV) signals. The participants’ electrocardiogram (ECG) and photoplethysmography (PPG) signals were collected. In the pre-processing stage, the ECG signals underwent bandpass filtering, followed by the derivation of the HRV signals. The feature extraction stage involved applying EMD to the HRV signals to obtain the first four intrinsic mode functions (IMFs) components. From these IMFs, the following features were calculated: A S R a r e a —area of the analytical signal; S O D P a r e a —area of the second-order difference plot; S O D P C T M —the central tendency measure of the second-order difference plot; P S D p k a m p —peak amplitude of the power spectral density estimation; P S D b p o w —band power of the power spectral density estimation; and P S D m f r e q —mean frequency of the power spectral density estimation. The final stage involved conducting the statistical analysis to compare the mean differences of all the features among the different CAN severity level groups: noCAN—individuals with T2DM without CAN; subCAN—individuals with T2DM and subclinical CAN; and estCAN—individuals with T2DM and established CAN. The PPG signal was used for CAN classification purposes.
Applsci 13 07824 g001
Figure 2. The first row represents the original RR interval signal, followed by its first four intrinsic mode functions and the residual obtained after empirical mode decomposition from a subject with no diagnosis of cardiovascular autonomic neuropathy.
Applsci 13 07824 g002
Figure 3. The analytic signal representation (ASR) of the first four intrinsic mode functions obtained after the empirical mode decomposition analysis of the RR interval signals for the three groups: noCAN—individuals with type 2 diabetes (T2DM) without cardiovascular autonomic neuropathy (CAN); subCAN—individuals with T2DM with subclinical CAN; and estCAN—with T2DM with established CAN. Note: The zoomed plots of the estCAN group are presented in the top corner of each IMF plot.
Applsci 13 07824 g003
Figure 4. The second-order difference plots for the first four intrinsic mode functions (IMFs) obtained after empirical mode decomposition analysis of the RR interval signal for the three groups are as follows: noCAN—individuals with type 2 diabetes (T2DM) without cardiovascular autonomic neuropathy (CAN); subCAN—individuals with T2DM with subclinical CAN; and estCAN—individuals with T2DM with established CAN. Note: The zoomed plots of the estCAN group are presented in the top corner of each IMF plot.
Applsci 13 07824 g004
Figure 5. The power spectral density (PSD) estimation for the first four intrinsic mode functions (IMFs) was obtained after the empirical mode decomposition analysis of the RR interval signals for the three groups: noCAN—individuals with type 2 diabetes (T2DM) without cardiovascular autonomic neuropathy (CAN); subCAN—individuals with T2DM with subclinical CAN; and estCAN—individuals with T2DM with established CAN. Note: The plots have different scales on the y-axis for better visualization.
Applsci 13 07824 g005
Figure 6. The comparison of parameters for cardiovascular autonomic neuropathy (CAN) groups for the four IMFs of the RR interval signals (mean ± standard error of the mean): noCAN—individuals with type 2 diabetes (T2DM) without CAN; subCAN—individuals with T2DM with subclinical CAN; and estCAN—individuals with T2DM with established CAN. (a) A S R a r e a —the area of analytic signal representation. (b) S O D P a r e a —the area of the second-order difference plot (SODP). (c) S O D P C T M —the central tendency measure of SODP. (d) P S D b p o w —the power spectral density (PSD) band power. (e) P S D p k a m p —the PSD peak amplitude. * p < 0.05—significant group difference.
Applsci 13 07824 g006
Table 1. Demographic and clinical data of the participants.
noCANsubCANestCAN
n202020
Age (yrs)60.1 ± 4.562.0 ± 7.057.0 ± 8.4
Gender7F/13M12F/8M10F/10M
DM duration (yrs)13.2 ± 9.513.9 ± 9.817.6 ± 9.3
HbA1c (mmol/mol)89 ± 2271 ± 3199 ± 19
Note: Values are presented as mean ± SD. Abbreviations: DM—diabetes mellitus; noCAN—individuals with type 2 DM without cardiac autonomic neuropathy; subCAN—individuals with type 2 DM with subclinical cardiac autonomic neuropathy; estCAN—individuals with type 2 DM and established cardiac autonomic neuropathy; HbA1c—glycated hemoglobin.
Table 2. Feature values (mean ± standard deviation) for ASR area —the area of the analytical signal; S O D P a r e a —the area of the second-order difference plot (SODP); S O D P C T M —the central tendency measure of SODP; P S D b p o w —the power spectral density (PSD) band power; P S D p k a m p —the PSD peak amplitude; and P S D m f r e q —the PSD mean frequency for the four intrinsic mode functions decomposed from the empirical mode decomposition technique of each group; noCAN—individuals with type 2 DM without cardiac autonomic neuropathy; subCAN—individuals with type 2 DM with subclinical cardiac autonomic neuropathy; and estCAN—individuals with type 2 DM and established cardiac autonomic neuropathy. Significance levels are a p < 0.05 when comparing noCAN to subCAN, b p < 0.05 when comparing noCAN to estCAN and c p < 0.05 when comparing subCAN to estCAN.
FeatureGroup I M F 1 I M F 2 I M F 3 I M F 4
log   ( A S R a r e a )noCAN−6.777 ± 0.770 b−7.399 ± 0.338 b−7.424 ± 0.287 b−7.300 ± 0.432 ab
subCAN−7.199 ± 0.540 c−7.580 ± 0.282−7.609 ± 0.204−7.616 ± 0.263 a
estCAN−7.655 ± 0.382 bc−7.739 ± 0.268 b−7.694 ± 0.450 b−7.712 ± 0.224 b
log   ( S O D P a r e a )noCAN−0.654 ± 0.665 b−1.878 ± 0.609 b−2.810 ± 0.488 ab−3.598 ± 0.527 ab
subCAN−1.957 ± 0.802 c−2.374 ± 0.740 c−3.294 ± 0.584 a−4.071 ± 0.557 ac
estCAN−1.086 ± 0.759 bc−2.963 ± 0.703 bc−3.733 ± 0.733 b−4.551 ± 0.621 bc
SODP CTM noCAN0.773 ± 0.268 b0.887 ± 0.173 b0.317 ± 0.180 ab0.694 ± 0.234 ab
subCAN0.887 ± 0.2090.941 ± 0.1050.531 ± 0.276 ac0.868 ± 0.143 ac
estCAN0.981 ± 0.037 b0.987 ± 0.029 b0.750 ± 0.253 bc0.947 ± 0.089 bc
log   ( P S D b p o w )noCAN−3.480 ± 0.574 b−3.839 ± 0.432 b−3.921 ± 0.370 ab−3.912 ± 0.390 ab
subCAN−3.897 ± 0.668 c−4.166 ± 0.564 c−4.288 ± 0.388 ac−4.314 ± 0.382 ac
estCAN−4.492 ± 0.654 bc−4.749 ± 0.622 bc−4.687 ± 0.612 bc−4.655 ± 0.527 bc
log   ( P S D p k a m p )noCAN−2.562 ± 0.617 b−2.771 ± 0.435 b−2.613 ± 0.379 ab−2.392 ± 0.403 ab
subCAN−3.028 ± 0.692 c−3.094 ± 0.570 c−2.975 ± 0.368 ac−2.793 ± 0.391 ac
estCAN−3.667 ± 0.724 bc−3.741 ± 0.626 bc−3.349 ± 0.644 bc−3.106 ± 0.551 bc
P S D m f r e q noCAN0.290 ± 0.0510.097 ± 0.0190.041 ± 0.0100.018 ± 0.003
subCAN0.266 ± 0.0540.090 ± 0.0290.039 ± 0.1210.019 ± 0.006
estCAN0.285 ± 0.04630.098 ± 0.0310.039 ± 0.0080.017 ± 0.004
Disclaimer/Publisher’s Note: The statements, opinions and data contained in all publications are solely those of the individual author(s) and contributor(s) and not of MDPI and/or the editor(s). MDPI and/or the editor(s) disclaim responsibility for any injury to people or property resulting from any ideas, methods, instructions or products referred to in the content.