Article

Study on Bond Anchorage Behavior of Small-Diameter Rebar Planting under Medium and Low Cycle Fatigue Loads

1
School of Civil Engineering, Changsha University of Science and Technology, Changsha 410114, China
2
College of Engineering, University of Georgia, Athens, GA 30602, USA
*
Author to whom correspondence should be addressed.
Appl. Sci. 2023, 13(13), 7784; https://doi.org/10.3390/app13137784
Submission received: 24 May 2023 / Revised: 19 June 2023 / Accepted: 26 June 2023 / Published: 30 June 2023
(This article belongs to the Special Issue Advances in Structural Dynamic Reliability Theory and Application)

Abstract

:
In this paper, we describe how, through the combination of field testing and finite element simulation, the bonding and anchoring performance of small-diameter rebar under the action of medium and low cycle fatigue load was studied and the corresponding conclusions were obtained: ① Through the test, the performance parameters of the 6 mm and 8 mm rebar planting specimens were obtained after the rebar was subjected to 10,000, 50,000 and 100,000 times of medium and low cycle fatigue loading at depths of 10d, 15d and 20d. The analysis shows that the medium and low cycle fatigue load has a significant effect on the elastic ultimate load, elastic ultimate slip and ultimate slip of the small-diameter rebar planting specimens. With the increase in fatigue loading times, the elastic ultimate load of the rebar specimen decreased continuously, and the elastic ultimate slip and ultimate slip showed an increasing trend. By increasing the anchor depth, the influence of fatigue load on the anchoring performance parameters of the rebar planting specimen can be reduced. Under the influence of the upper ultimate condition of 100,000 times of fatigue loading, the ultimate load and failure mode of the planted bars basically did not change compared with the control specimens without fatigue loading. ② Based on the performance parameters of the rebar planting specimens obtained from the field test, the bond–slip constitutive relationship of the adhesive–rebar interface of the small-diameter rebar planting under the medium and low cycle fatigue load is analyzed and proposed. The F-U relationship of the spring element under the fatigue load is defined to simulate the bond–slip behavior of the adhesive–rebar interface. The finite element simulation results are in good agreement with the field test results. ③ Through a large number of finite element numerical simulation results, the elastic ultimate load calculation formulas of 6 mm and 8 mm diameter rebar planting specimens under medium and low cycle fatigue loads are obtained.

1. Introduction

In recent years, with the Chinese government proposing carbon peaking and carbon neutrality goals, rebar planting as a widely used post-anchoring technology has received increasing attention. The rebar planting technology is a post-anchoring connection method in which ribbed steel bars or full-threaded screws are planted in the substrate with anchoring adhesives. Because of the simple principle, convenient operation, high efficiency and many other advantages, it is widely used in structural reinforcement and supplementary engineering in many fields, such as buildings, bridges and highways [1,2].
The bond–slip performance is the key factor to ensure the anchorage safety of the planting bar system [3,4]. Its failure modes are mainly divided into ductile failure and non-ductile failure. Researchers have obtained the bond anchorage mechanism and typical failure modes of the rebar planting system through a large number of pull-out tests. Ronald et al. [5,6,7], according to chemically bonded anchors in concrete cone failure, bond failure, and combined conebond failure, based on the failure model of elastic theory put forward and the corresponding suggestions for the design of tensile strength, and according to a large number of pull-out tests, summarized the influence factors of bond strength. Michael further elaborated on its failure development principle through elastoplastic finite element analysis [8]. Kilic [9] studied the relationship between the shape of steel bars and their ultimate bearing capacity, and concluded that the ultimate bearing capacity of ribbed steel bars is determined by the adhesion or the shear strength at the bolt–grout interface, and that under the same conditions, the ultimate bearing capacity of ribbed steel bars is 6.5 times that of smooth surface bars. Zhou et al. [10] analyzed the influence of anchorage depth, anchorage diameter, concrete strength, glue and concrete interface bond strength and other factors on the ultimate bearing capacity, and obtained the common conebond failure ultimate drawing bearing capacity formula. Wang et al. [11,12] analyzed the anchorage failure form of large-diameter anchors with a diameter of 36–150 mm, and gave a formula for calculating the pull-out bearing capacity of the large-diameter anchor systems. Bassam et al. [13] studied the influence of steel bar diameter and anchorage depth on the drawing bearing capacity of planted bars, and concluded that the ultimate drawing bearing capacity of planted bars is positively related to the anchor depth and diameter of planted bars. Wang et al. [14] found that the anchor depth of the planting bar is the most important factor affecting its failure form and ultimate bearing capacity. The strength of the substrate [15] and the type and thickness of the adhesive [16] also have a certain impact on the bearing performance of the planting bar. With the development of rebar planting technology, researchers began to explore the new application potential of this post-anchoring technology, and carried out experimental research on the anchoring performance of rebar planting in different substrates, such as wood [17,18] and brick masonry [19,20], which expanded the application carrier of rebar planting technology.
From the above research status, it can be seen that a large number of studies mainly focus on the bonding and anchoring performance of the planting bar system under a static pull-out load, or on expanding the bonding and anchoring performance of the planting bar in a non-traditional concrete substrate. The research on the performance of planting bar under the influence of fatigue load is still insufficient. Compared with static load, the mechanical properties of anchorage under fatigue load will exhibit a big difference [21,22,23,24,25]. Hawileh et al. [26] conducted experiments and finite element simulation on the mechanical properties of steel bars under low cycle fatigue loading. Zhang et al. [27] studied the group anchors’ seismic performance using expansion anchor bolts and post-cut anchor bolts under flexural and shear conditions through experiments. The load–displacement curves of the specimens were basically the same under static and dynamic loads. The ultimate load of planting bars did not decrease significantly, but the ultimate displacement had a large increase. Yan et al. [28] conducted high-cycle fatigue tests on 16~25 mm single-bar planting specimens, and found that the fatigue load weakened the bearing capacity of planting bars. The bond stress of planting bars showed a logarithmic development trend with an increase in loading times. Under the pull-out test, the peak bond stress gradually shifted to the ends of the planting bars with the increase in load. From the perspective of the actual engineering application of rebar planting technology, the existing research is mostly for medium- and large-diameter steel bars, which have a wider range of applications. However, in the face of concrete floor reinforcement, masonry structures, brick wall reinforcement and other practical projects, small-diameter planting bars also have a non-negligible use demand, and a further expansion of the research on the bonding and anchoring performances of small-diameter planting bars has important practical significance.
In this paper, the basic mechanical performance parameters of 6 mm and 8 mm diameter single-bar rebar planting specimens under medium and low cycle fatigue loads were obtained through experiments. The load–slip curves of the rebar planting specimens were compared and analyzed, and we proposed the bond–slip constitutive relationship of the adhesive–rebar interface under medium and low cycle fatigue loads. The expression of the stiffness of the adhesive–rebar interface spring element based on ABAQUS was further derived. Through a large number of numerical simulation results, the elastic ultimate load calculation formulas of 6 mm and 8 mm single-bar rebar planting specimens with respect to the anchor depth and fatigue loading times as independent variables were established by fitting. The roadmap of the research is shown in Figure 1.

2. Pull-Out Test

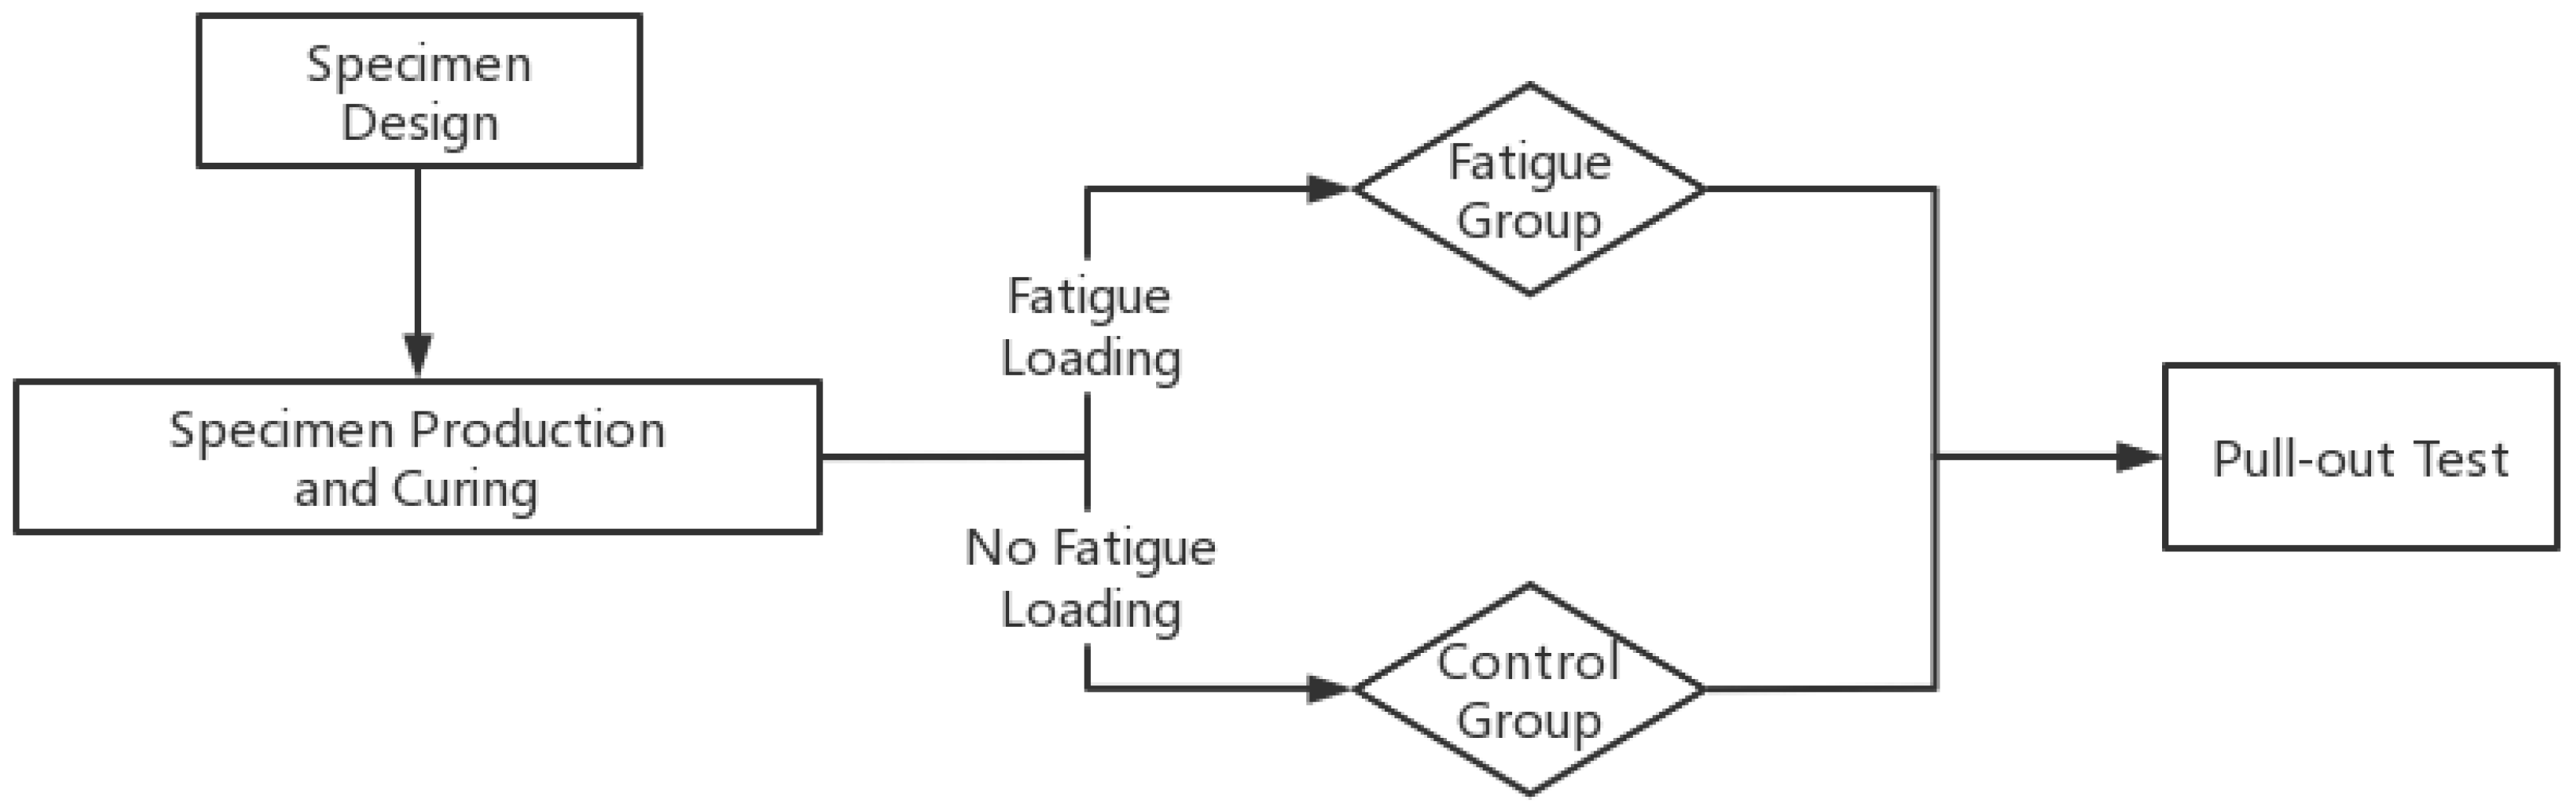
2.1. Purpose and Process

Two kinds of typical small-diameter rebar planting specimens (6 mm and 8 mm) were studied in the experiment. The experimental phenomena and data differences of specimens under different working conditions were studied by setting different anchor depths and fatigue loading times. The changes and main influencing factors of the bond anchorage behavior of small-diameter rebar planting specimens under medium and low cycle fatigue loading were compared and analyzed.
The test process is shown in Figure 2. After the specimens were made and cured, the fatigue load group specimens were fatigue loaded, while the control group specimens were not fatigue loaded. After loading, all specimens were subjected to a destructive pull-out test, and the basic data such as failure mode, load–slip curve and axial strain–load curve of each specimen were obtained for analysis.

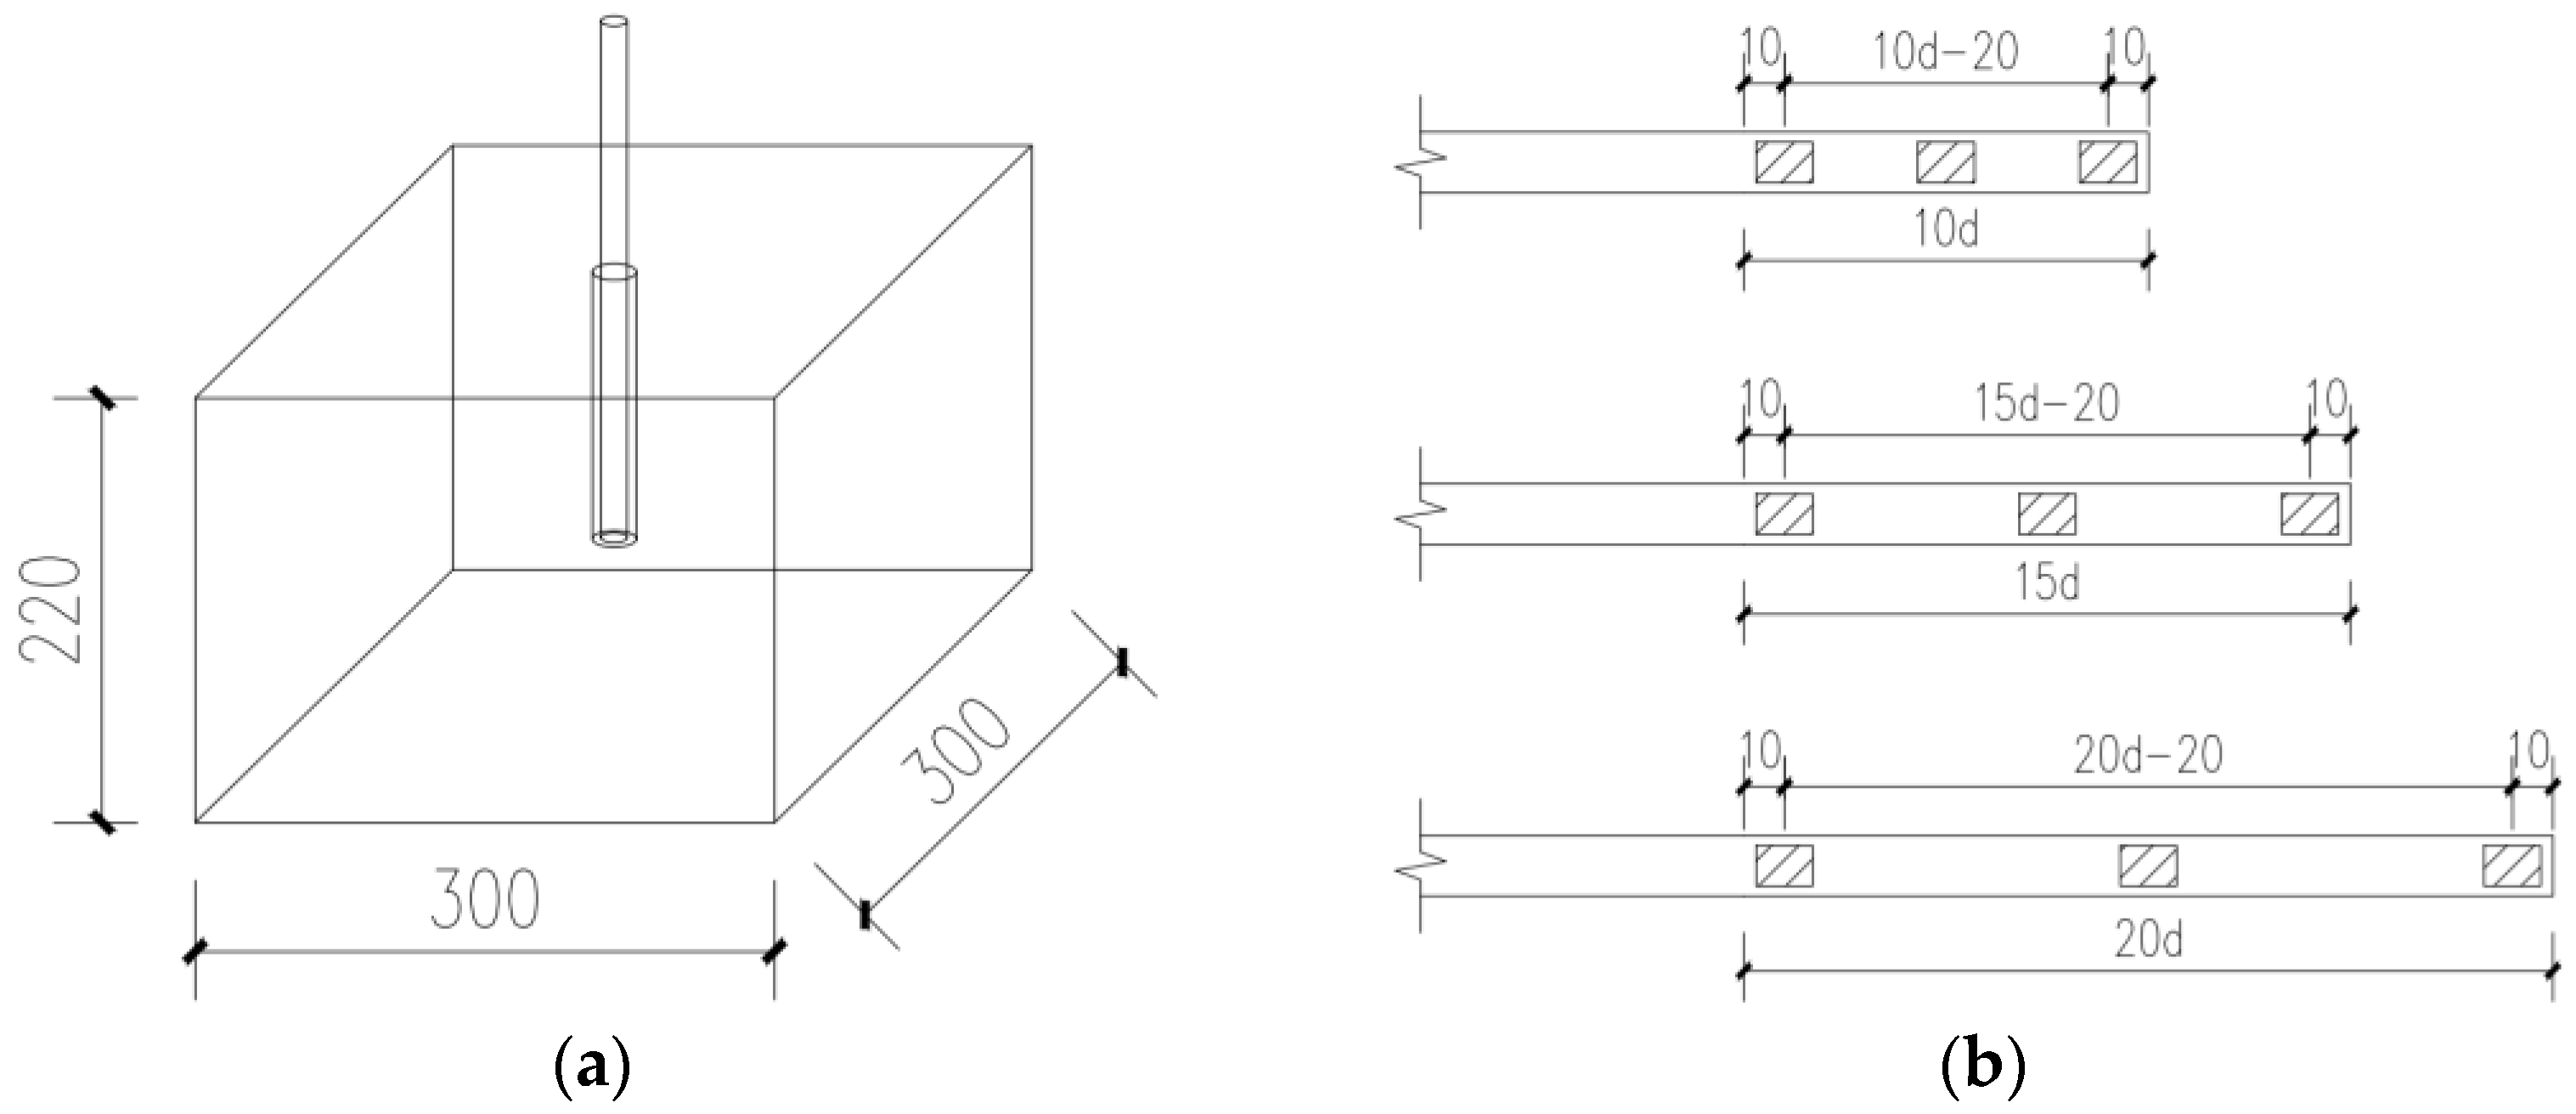
2.2. Specimen Design

For the experiment, we designed 24 concrete test blocks with length × width × height dimensions of 300 mm × 300 mm × 220 mm, and the design strength grade of the base material was C35. A single steel bar was implanted on the top of the substrate. The hole sizes in the concrete test blocks for the 6 mm and 8 mm rebar planting specimens were 10 mm and 12 mm, respectively [29]. The implanted steel bar adopted HRB400 grade 6 mm and 8 mm diameters, the anchor depths were 10d, 15d, 20d, and the fatigue loads were 10,000 times, 50,000 times and 100,000 times, and there was a group of control specimens without fatigue loading. Three steel strain gauges were arranged equidistantly in the anchor section of the planted steel bar, and the distance between the free end and the bottom end of the strain gauge was 10 mm. The schematic diagrams of single-bar rebar planting specimen and strain gauge arrangement are shown in Figure 3.
The same batch of concrete was used to pour three standard cubic test blocks of 150 mm × 150 mm × 150 mm during the production of base material test blocks, and the test pieces were cured under the same conditions. After the curing was completed, the compressive strength of each test block was tested. Table 1 shows the performance parameters of the concrete test blocks [30].
We carried out a mechanical tensile test on the planted steel bars. The rebars were HRB400-grade rebars with diameters of 6 mm and 8 mm. Three rebars of each diameter were randomly selected from the same batch of rebars with two diameters. Tensile tests were carried out by a universal testing machine to obtain the mechanical properties of the rebars [31]. Table 2 shows the mechanical properties of the rebars.
Table 3 shows the properties of the rebar planting adhesive used in the test. The performance parameters of the rebar planting adhesive meet various Chinese standards [32,33,34].

2.3. Fatigue Loading

The material and component dynamic fatigue testing machine (landmark370.25) of American MTS Company was used to fatigue load the test piece. The upper clip of the fatigue testing machine clamped the top of the free end of the planting bar, and the lower clip clamped a T-shaped steel plate which served as a test piece placement platform upon which to affix the test piece to the T-shaped steel plate.
At present, there is no unified standard for the fatigue loading system of single rebar planting. As shown in Figure 4, the fatigue loading of the rebar planting specimen was achieved by affecting the free end of the rebar. The reciprocating load of axial pull-out was transmitted from the free end of the rebar to the embedded hole, which affected the anchorage performance of the rebar planting system. However, as a kind of connection and anchorage method, both ends of planted rebar should be in a constrained state in practical application, which is different from the boundary conditions of the single rebar planting specimen. Therefore, the influence of the free-end rebar on the performance needed to be reduced as much as possible during the fatigue loading of the single rebar planting specimens, so as to achieve test results in line with actual working conditions. The research shows that the fatigue loading frequency has no obvious effect on the performance of steel bars at 3~10 Hz [35]. Yan et al. adopted a fatigue loading system of 0.2~0.45 P u ( P u is the ultimate drawing load) for 20 single rebar planting specimens with a diameter of 16~25 mm [28]. Referring to the fatigue loading system of the above similar tests and the actual situation of this test, the 6 mm and 8 mm single rebar planting specimens were fatigue loaded with a sine wave load with an average load of 0.25 P u , a loading amplitude of 1 kN and a frequency of 2 Hz.

2.4. Loading System of Pull-Out Test

Before the formal test, the specimen was preloaded to ensure that all equipment operated normally and the fixture was in the clamping state at the beginning, then during the subsequent loading process. The upper limit of the preload was 0.25 P u . After the completion of preloading, we unloaded to 0 kN and waited for 5 min before starting the formal test.
The pull-out test adopts the graded loading system [36]. At the initial stage of the pull-out test, the load rises significantly and the slip is relatively small. Therefore, the hierarchical loading system controlled by the force value was adopted at this stage. The pull-out force was increased by 1 kN step by step, and the load was held for about 1 min after each stage of loading to stabilize the specimen. With the increase in the pull-out force, the load rise was no longer obvious and the slip amount began to increase significantly. Therefore, the graded loading system controlled by the slip amount was adopted in the follow-up, and the loading step of each stage was taken as 0.2 mm. After each stage of loading was completed, the specimen was held for 2 min to wait for stability. All data were read after the specimen was stable, and all specimens were loaded to failure.

3. Analysis of the Pull-Out Test Results

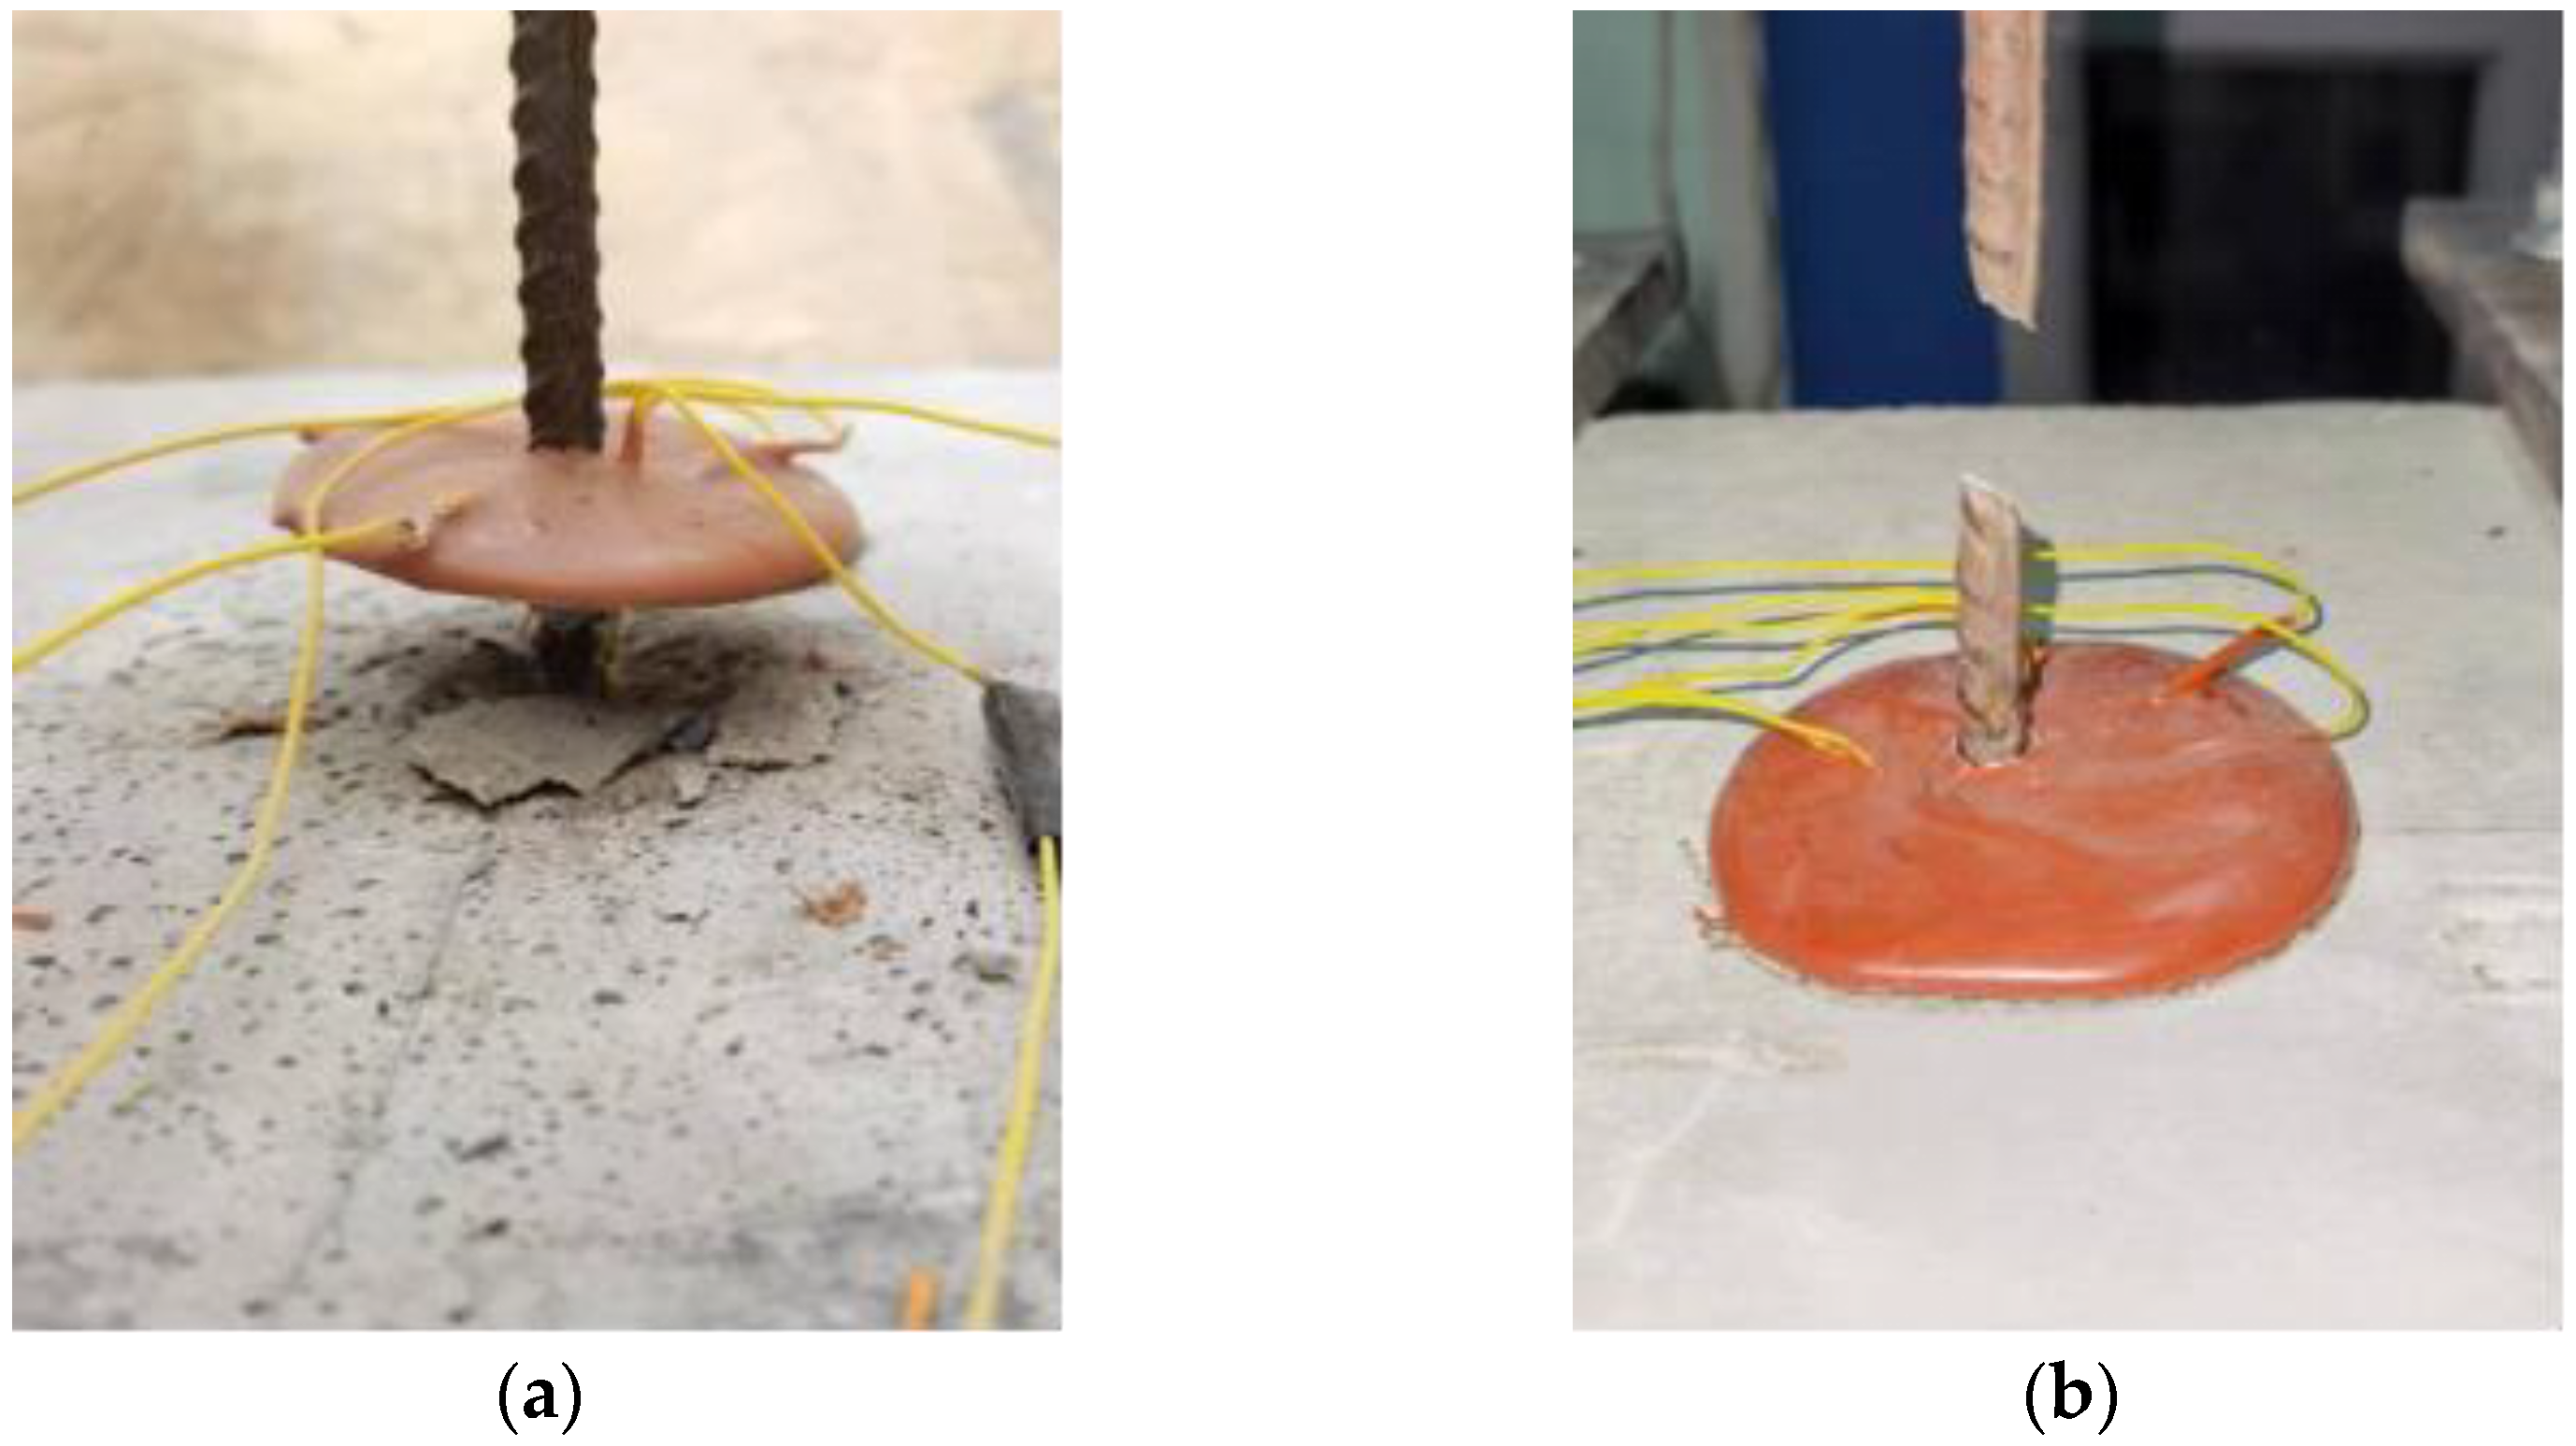
3.1. Failure Modes and Ultimate Loads

The typical failure modes of specimens are shown in Figure 5. Among the 24 rebar planting specimens, except for the D4 specimen, which exhibited a bond failure of the adhesive–rebar interface, the remaining specimens were all rebar fractured, and there was no cone failure or mixed failure. When specimen D4’s bond failed, the steel bar was pulled out from the hole. Under the action of a drawing load, a small amount of overflow anchoring adhesive from the orifice generated during the production of the specimen was pulled out with the rebar and peeled off from the surface of the substrate. There was no significant cone formation or steel bar fracture throughout the entire process. When the rebar specimen was rebar fractured, there was no significant damage to the substrate and anchoring adhesive, and the surface quality was relatively intact. Table 4 shows the ultimate load and failure mode of specimens.
Figure 6 shows the scatter plot of the ultimate load of the 24 specimens. It can be clearly seen from the figure that when the failure mode was rebar fracture, from the scatter diagram of the same diameter specimen, the ultimate load was kept at the same level. When the diameters of the steel bar were 6 mm and 8 mm, the ultimate load values were about 19 kN and 30 kN, respectively. This value did not change with the anchor depth and loading times. This shows that the fatigue loading times and anchor depth have nothing to do with the ultimate load of the implanted bar. The diameter of the steel bar was the main factor affecting the ultimate load during rebar fracture. The ultimate load of the D4 specimen with bonding failure was 8.9% lower than that of the specimen without fatigue loading with the same anchor depth and steel bar diameter. The diameter of the rebar was the main factor affecting the ultimate load during rebar fracture. With the decrease in steel bar diameter and the increase in fatigue loading times, the failure mode of the specimen tended to be non-ductile failure from the ductile failure of the steel bar breaking.

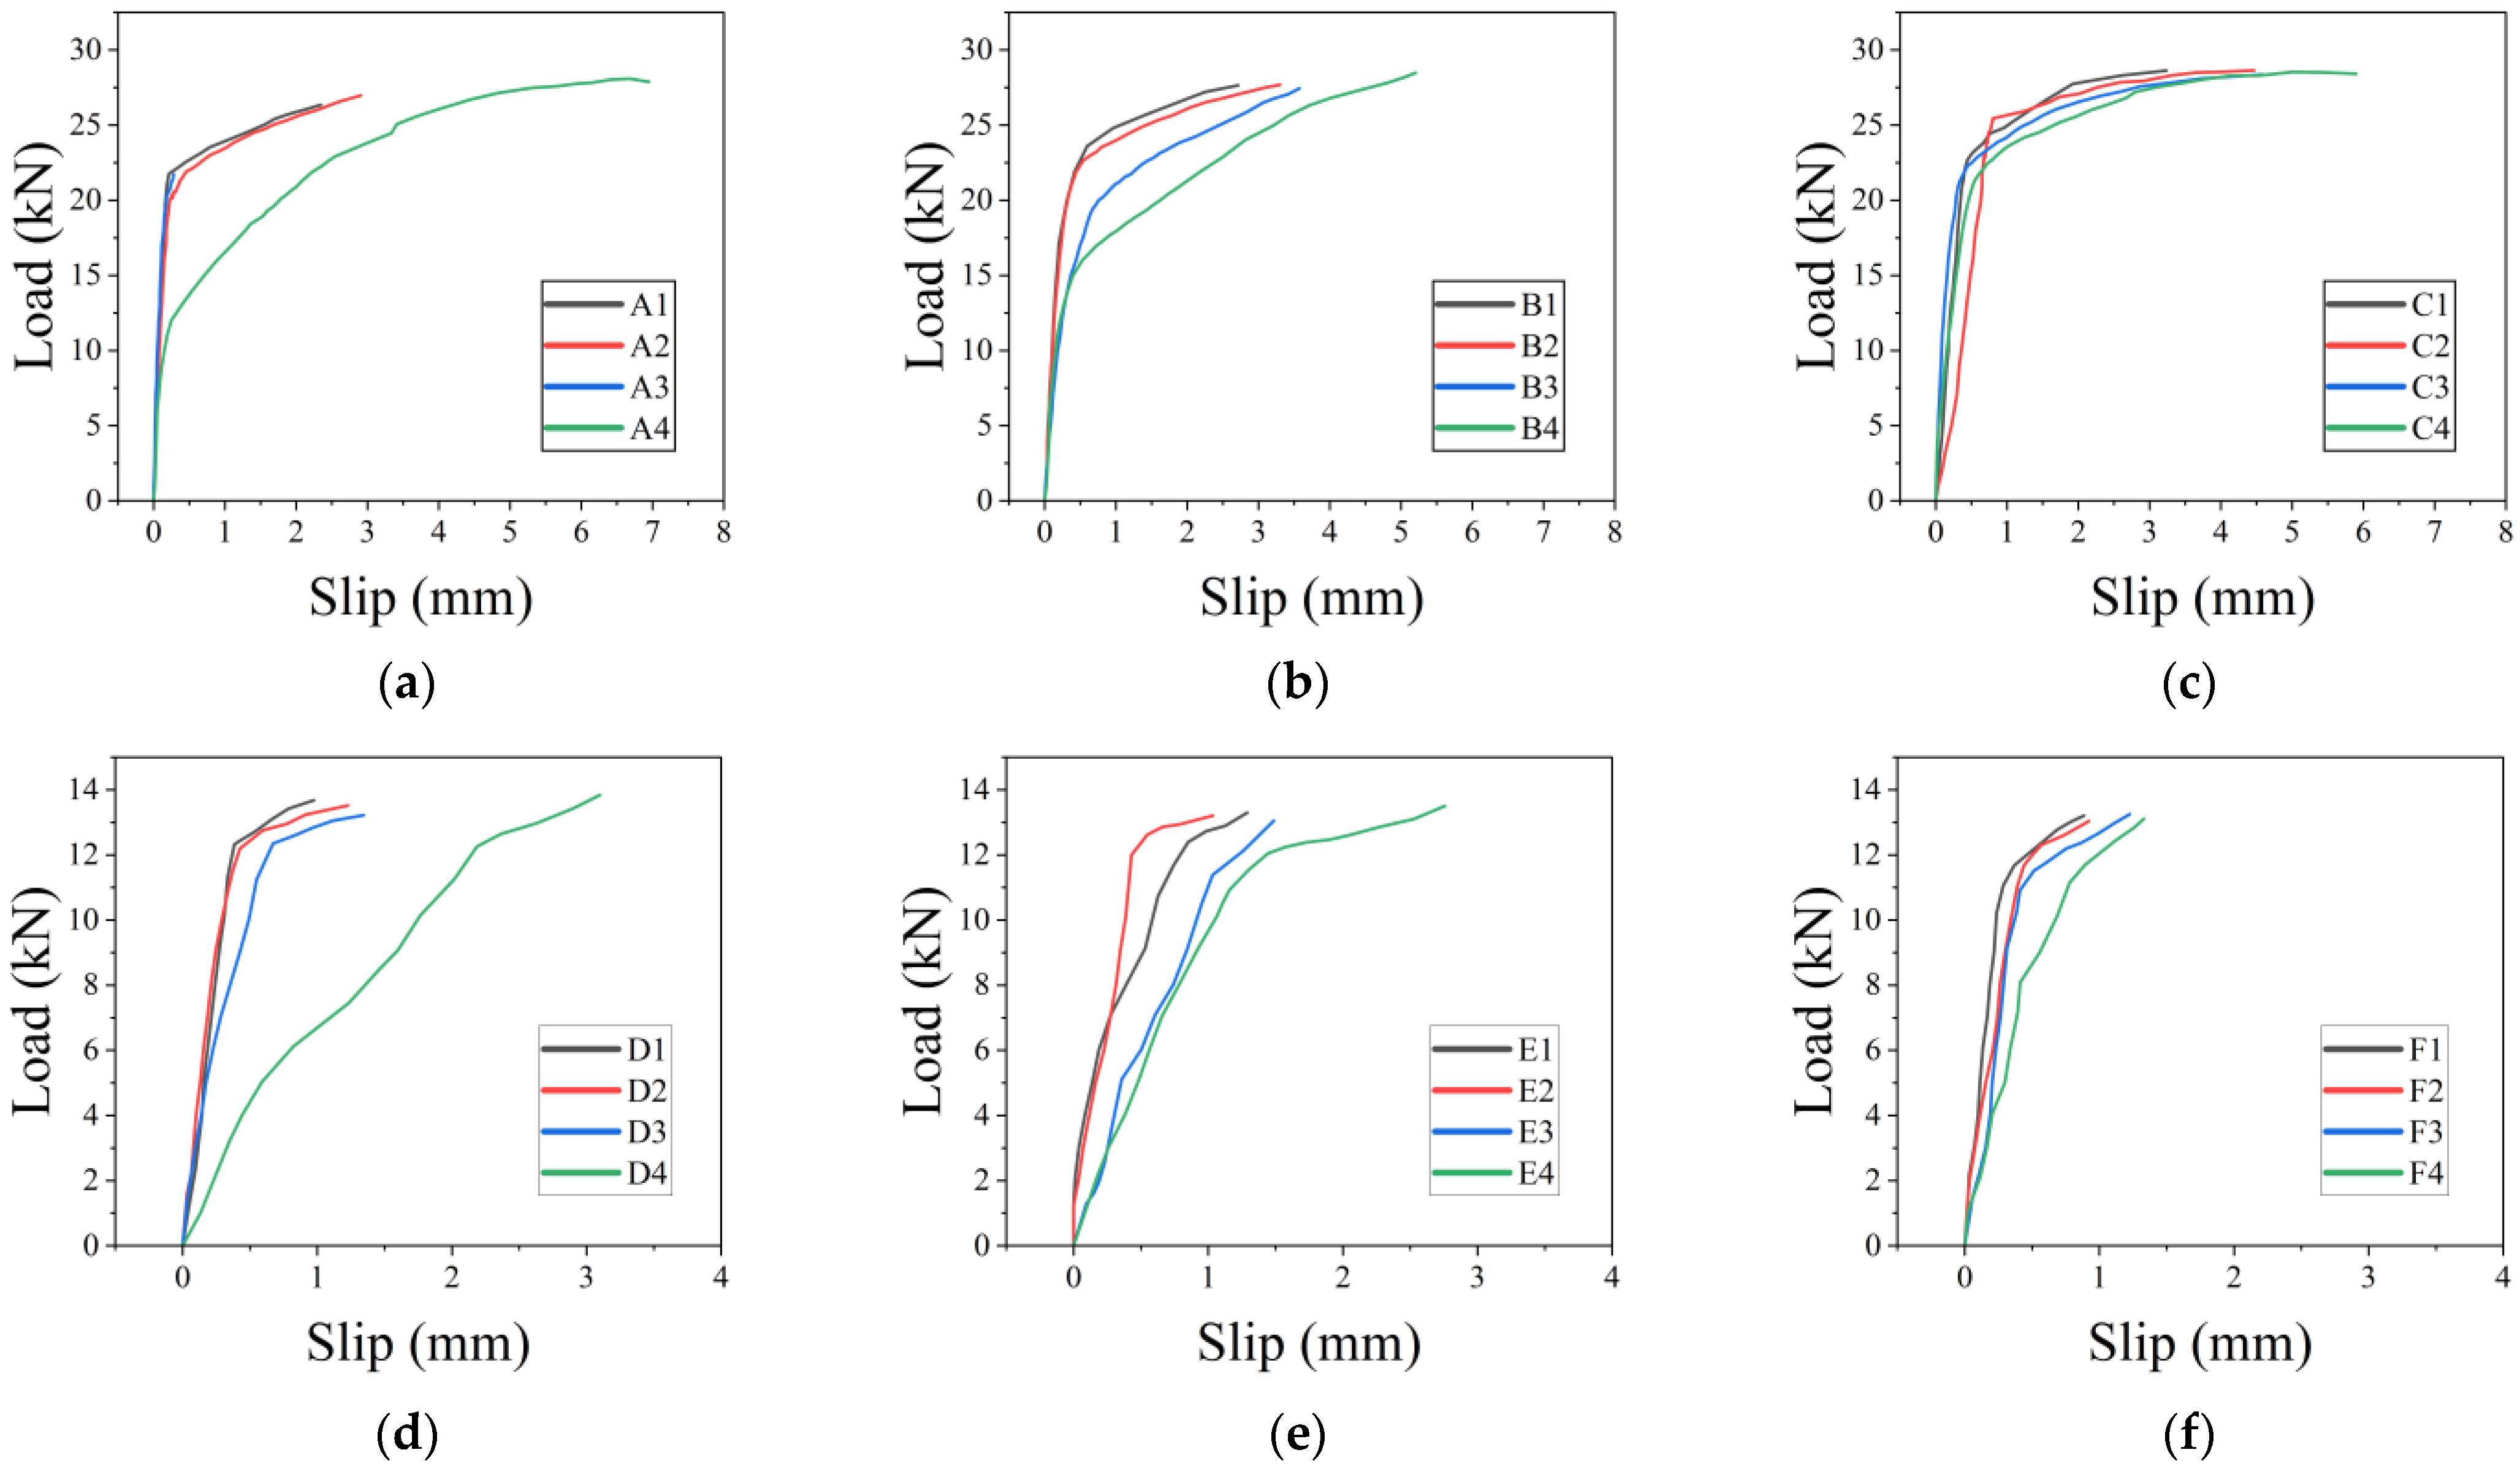
3.2. Load–Slip Curve

It can be seen from the load–slip curve of the rebar planting specimen in Figure 7 that when the failure mode of the specimen was rebar fracture, the medium and low cycle fatigue loads had no obvious effect on the ultimate load, but they had a significant effect on the ultimate slip of the specimen, the slip at the elastic ultimate point and the elastic ultimate load value, and the degree of influence increased with the increase in the number of loading times of the fatigue load. When the anchor depth was the same, the more the fatigue load was increased, the greater the increase in the ultimate slip, and the smaller the elastic ultimate load; the curve entered from elastic bonding stage to elastic-plastic slip stage in advance. When the fatigue loading times were the same, the greater the anchor depth of the planted rebar, the greater the elastic ultimate load, the ultimate slip and the slip at the elastic ultimate point. By increasing the depth of the planting rebar, the influence of fatigue load on the elastic ultimate load and the ultimate slip could be significantly reduced; that is, the ultimate slip was reduced and the elastic ultimate load was increased. Under the action of a 100,000 times fatigue load, the specimen of 6 mm rebar with the depth of 10d appeared to experience bonding failure. The shape of the load–slip curve for bond failure underwent significant changes compared to the curve shape at the time of rebar fracture. When the failure mode of the specimen was bond failure, the elastic ultimate point could not be determined in the load–slip curve. The slip amount of the specimen increased greatly with the increase in load until the rebar was pulled out.

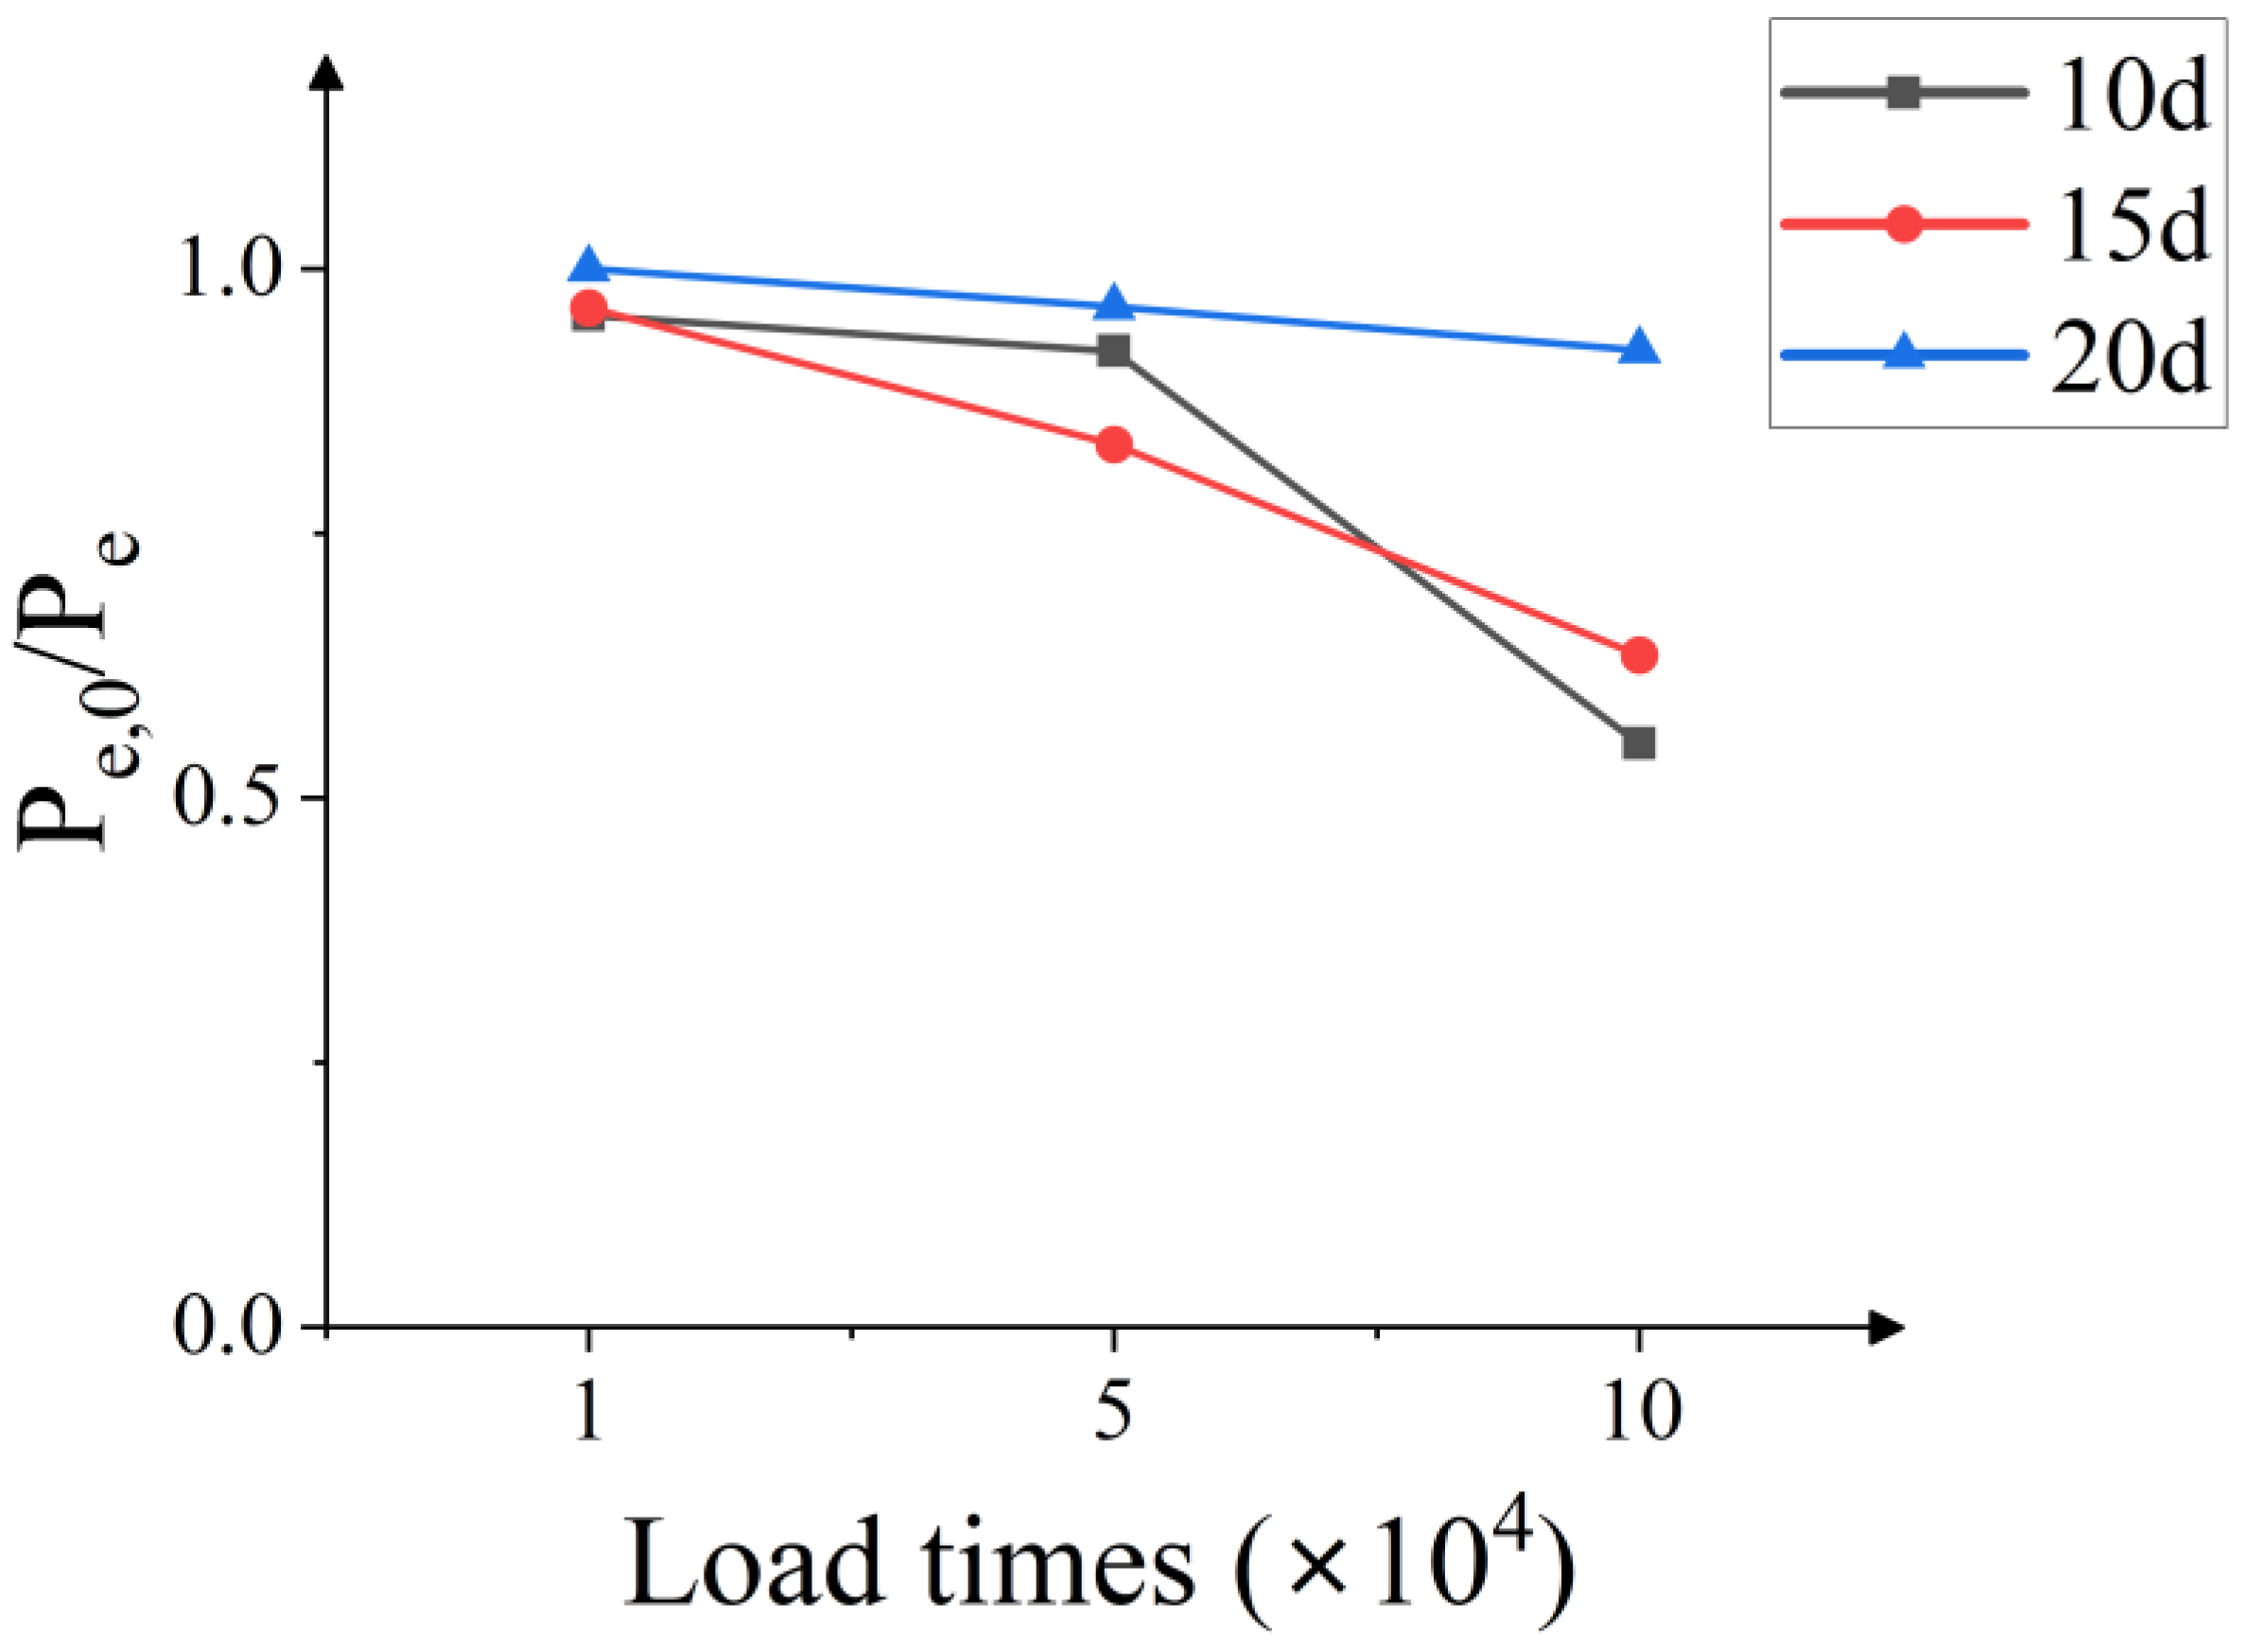
3.3. Elastic Ultimate Load

Under fatigue load, the elastic ultimate load of the specimen showed a decreasing trend. Figure 8 shows the relationship between fatigue loading times and the ratio of elastic ultimate load between non-fatigue loading specimens and fatigue loading specimens of 8 mm rebar planting specimens under different anchor depths.
The elastic ultimate load ratio of the specimen decreased with the increase in the fatigue loading times. When the anchor depth of the rebar was 20d, the specimen was minimally affected by the fatigue load. With the increase in fatigue loading times, the elastic ultimate load of the specimen under 100,000 times of fatigue loading was still 92.3% of that of the non-fatigue loading specimen. When the anchor depth of the rebar was 10d, the reduction of the elastic ultimate load by the fatigue load was the most obvious. Under 100,000 times of fatigue loading, the elastic ultimate load was only 55.1% of the non-fatigue loading specimen, and the performance of the specimen was greatly reduced. When the loading times reached more than 50,000 times, the reduction of the elastic ultimate load of the specimen increased, and the slope of the curve suddenly changed. On the whole, an increase in anchor depth is beneficial to reduce the influence of the fatigue load on the decrease in the elastic ultimate load.

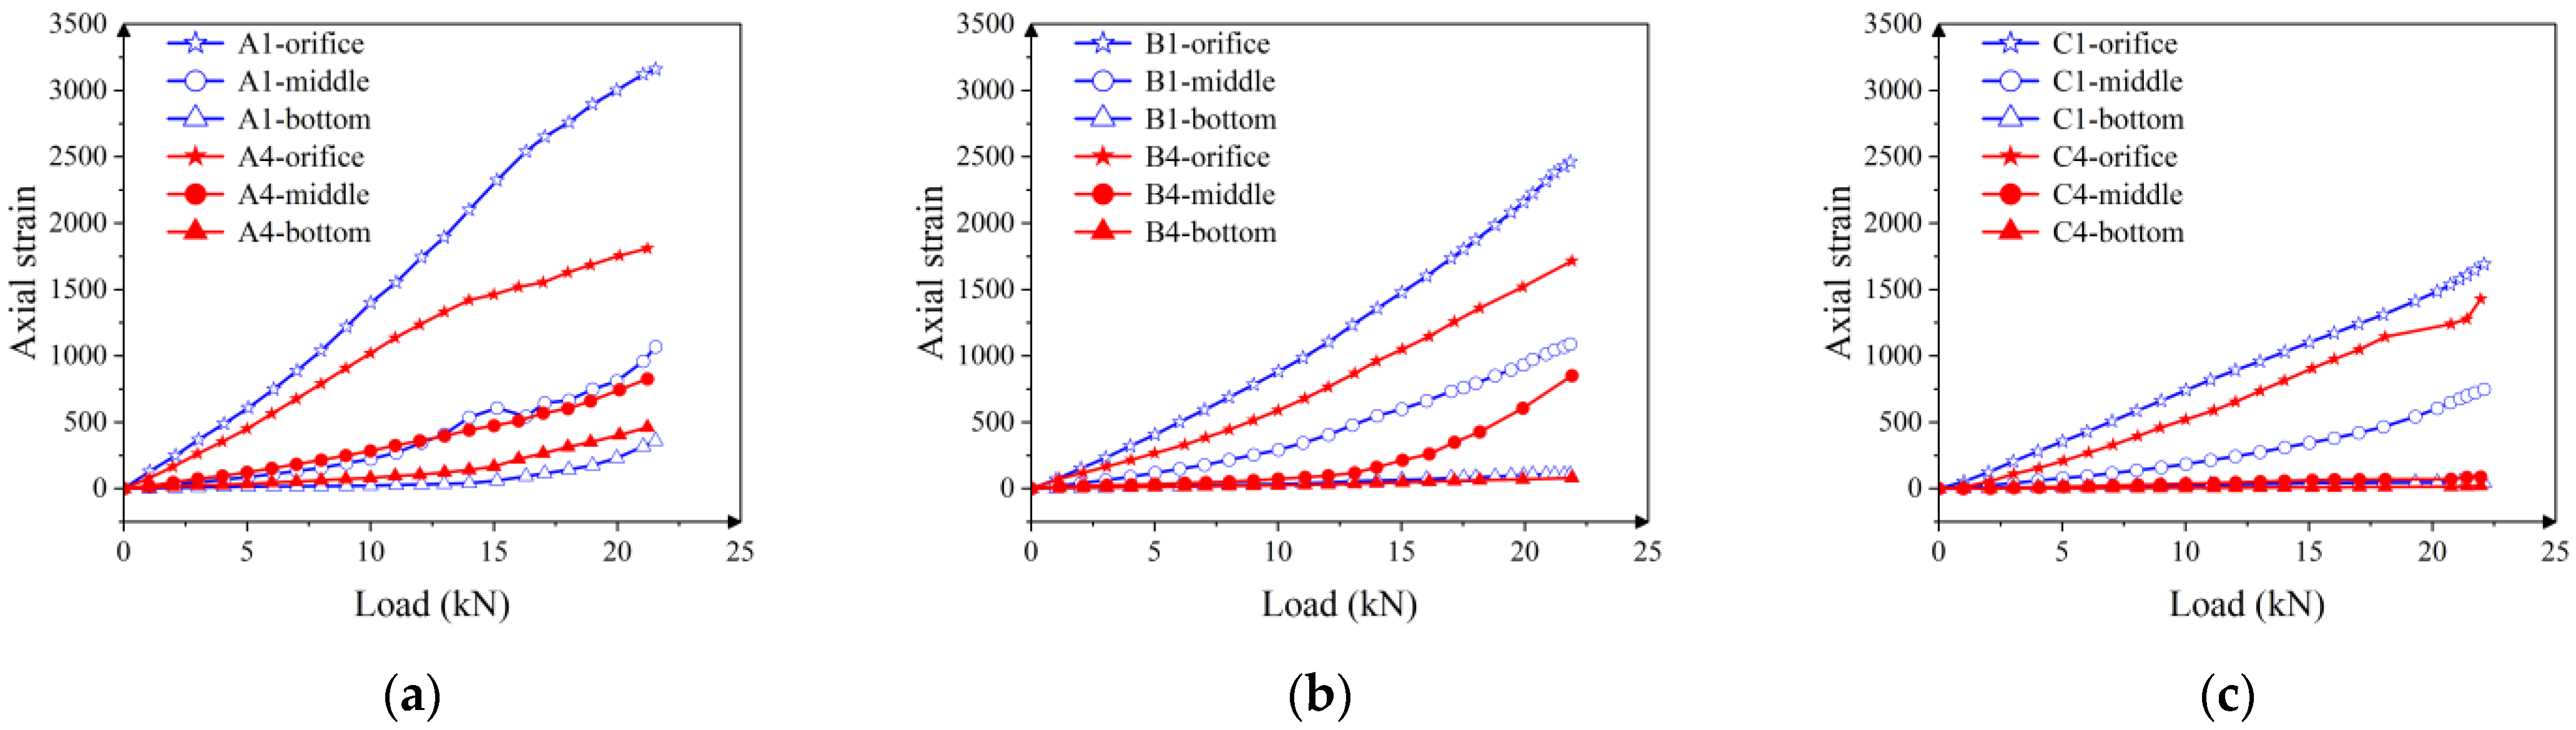
3.4. Axial Strain of Steel Bar

Figure 9 shows the axial strain–load curve of the specimen. It can be seen from the figure that the strain level of the overall steel bar of each group of specimens subjected to 100,000 times of fatigue loading is lower than that of the specimens without fatigue loading; that is, the bonding stress level of the adhesive–rebar interface of the fatigue loading specimens was lower under the same drawing load, and the influence of the free end of the steel bar is more obvious. With the increase in relative depth, the influence gradually decreased until the bottom influence basically disappeared. With the increase in the drawing load, the strain value of the free end of the steel bar increased the fastest, and the growth rate of the strain value gradually decreased along the depth direction. Fatigue load had no obvious effect on the axial strain distribution of the steel bar of the specimen, and the strain value was always distributed from large to small according to the law of orifice–middle–bottom.

4. Numerical Simulation of the Adhesive–Rebar Interface

4.1. Establishment of FE Model

For this study, ABAQUS had a good adaptability for the simulation of the pull-out and bond failure analysis of the rebar planting system, and its concrete damaged plasticity model and spring element met the requirements for the simulation of test conditions. Therefore, the finite element model of the rebar planting specimen was established by ABAQUS (ver. 2020). software.
The stress system of a rebar planting specimen can be simply summarized as three kinds of materials and two kinds of interfaces (rebar, concrete substrate, adhesive, adhesive–rebar interface, adhesive–concrete interface). In the establishment of the finite element model, the C3D8R element was selected to simulate the rebar and concrete substrate, and the Spring2 element was selected to simulate the bond–slip behavior of the adhesive–rebar interface. Previous studies have shown that the bond stress at the adhesive–rebar interface is the main factor controlling the failure of the specimen after reaching a certain depth of rebar [28]. At the same time, according to the failure mode in the above pull-out test, there was no specimen with a failure of adhesive–concrete interface. Therefore, in the establishment of the finite element model, it was assumed that there was no slip at the interface between rebar and concrete, so as to focus on the bond–slip behavior of the interface between the rebar and planting adhesive.
The double broken line model and CDP model were used for the rebar and concrete substrate, respectively. The constitutive relationship of rebar and concrete substrate were determined according to the corresponding material property test results and Appendix C, the Chinese standard [37]. The adhesive–rebar interface was simulated by the Spring2 element, and the F-U relationship of the spring was determined based on the test results.

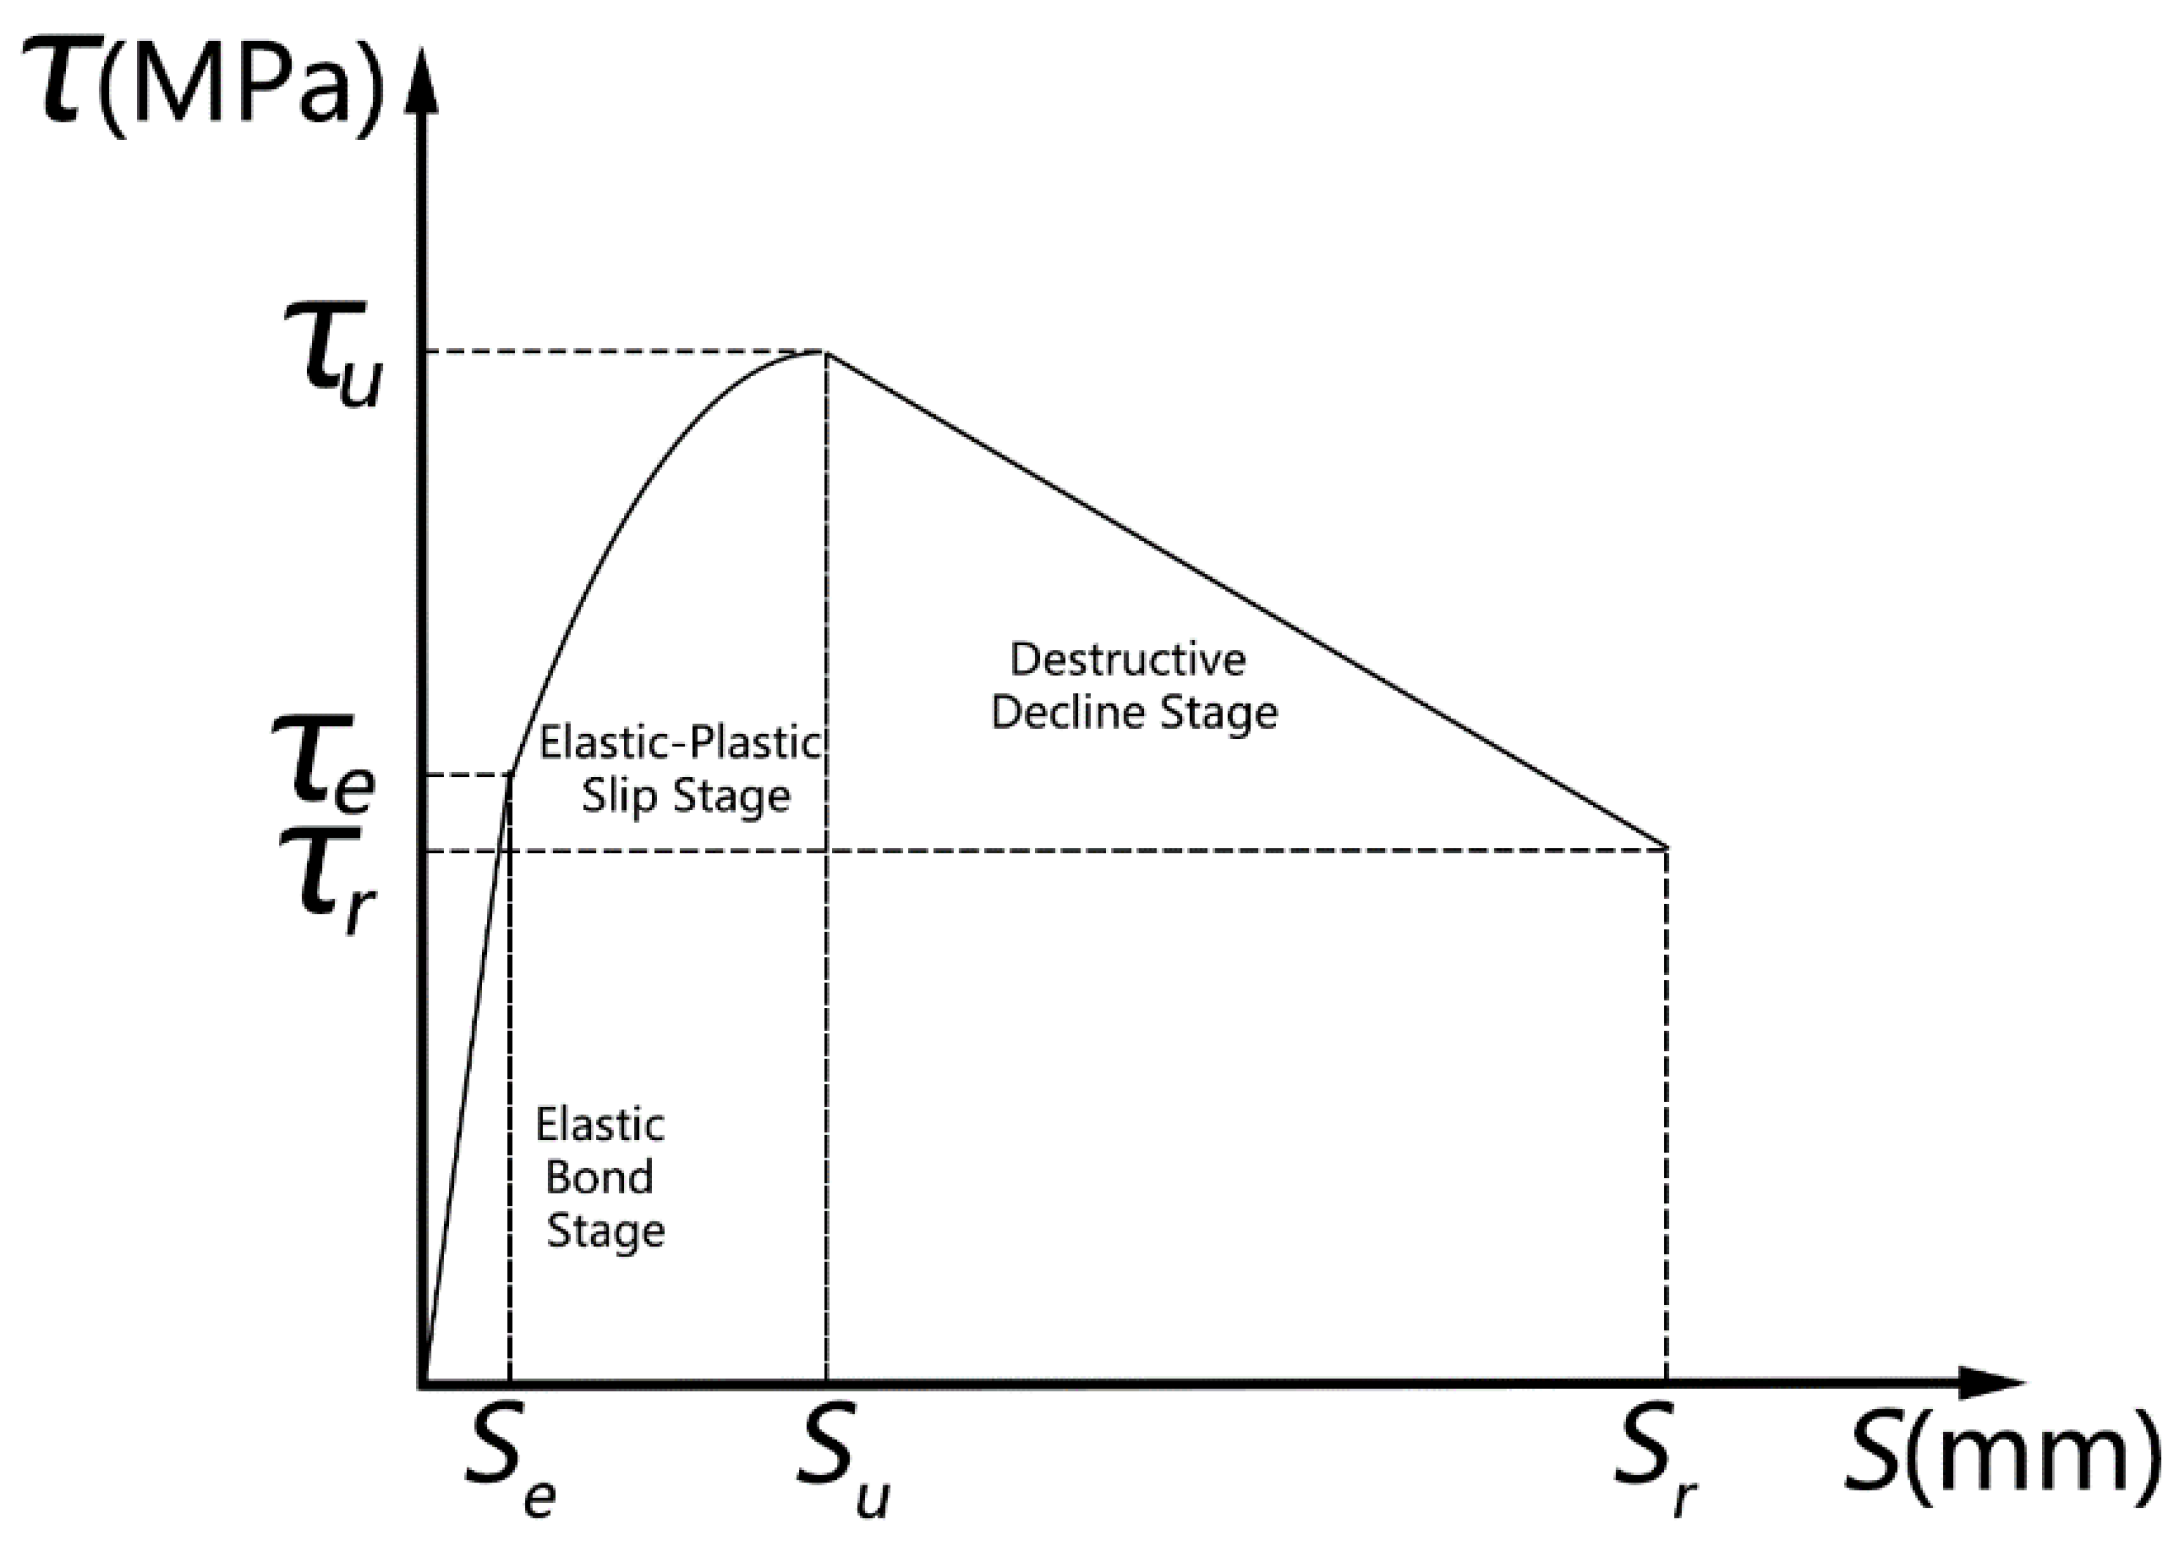
4.2. Bond–Slip Constitutive Relationship of the Adhesive–Rebar Interface under Medium and Low Cycle Fatigue Loads

According to the test and the existing research literature [38,39], the characteristics of the load–slip curve of the rebar planting specimen can be summarized. It can be seen that the average bond stress and the corresponding bond–slip constitutive model at each stage included three stages. In the time history of the pull-out test, it is divided into an elastic bond stage, elastic–plastic slip stage and failure decline stage. The elastic slip stage is an oblique straight line passing through the origin at the initial stage of the drawing load of the rebar planting specimen. The load of the specimen and the slip show a linear positive correlation. The slope of the curve is the bonding stiffness of the elastic bonding stage, and the relative slip increase in this stage was small. The elastic–plastic slip stage appears after the elastic bonding stage, and its curve form can be approximated as a quadratic parabola with an opening downward. In the definition domain of this section of the curve, the function value still maintains a monotonous increase, but the slope of the curve gradually decreases to zero. At this time, it is the end of the curve in the elastic–plastic slip stage. The position of this point corresponds to the ultimate drawing bearing capacity of the rebar specimen, and the function value reaches the maximum value of the whole curve. The failure descent curve is defined as an oblique straight line with a negative slope, which appears after the elastic–plastic slip stage.
As shown in Figure 10, the characteristic points of the constitutive relationship include: average ultimate bond stress τ u , elastic stage ultimate bond stress τ e , residual bond strength τ r , ultimate load slip displacement S u , elastic stage ultimate slip displacement S e , residual slip displacement S r . The selection of each feature point is determined as follows:
(1)
Average ultimate bond stress
The average bond stress under the ultimate drawing bearing capacity of the planting bar was calculated by ignoring the influence of depth, and the formula is as follows:
τ u = P u π D L
where P u is the ultimate drawing load of the planting bar, D is the diameter of the steel bar, and L is the anchor depth.
(2)
Elastic stage ultimate bond stress
τ e = p τ u
where p is the proportional coefficient of the elastic stage ultimate bond stress and the average ultimate bond stress; the data obtained by the test were taken as 0.71.
(3)
Ultimate load slip displacement
The ultimate load slip displacement was the corresponding displacement when the specimen reached its ultimate drawing bearing capacity. The test conclusion and analysis were obtained as follows: the size of the ultimate load slip displacement was related to the fatigue loading times, the anchor depth and the steel bar diameter. Assuming that the ultimate load slip displacement satisfied the multivariate equation, and the calculation coefficients and constant terms were set, the expression of the ultimate load slip displacement is as follows:
S u = t 1 L 2 + t 2 N 2 + t 3 D 2 + t 4 L N + t 5 L D + t 6 N D + t 7 L + t 8 N + t 9 D + a
where N is the fatigue loading times, t i is the calculation coefficient, and a is the constant term.
Using MATLAB to complete the calculation coefficients and the constant terms in Equation (3), the expression of the ultimate load slip displacement is as follows:
S u = 2.34 × 10 4 L 2 + 1.3341 × 10 2 N 2 + 3.804 × 10 2 D 2 2.906 × 10 3 L N   + 1.098 × 10 3 L D + 1.21127 × 10 1 N D 4.7863 × 10 2 L 4.55822 × 10 1 N   + 1.65341 × 10 1 D + 0.345365
Substituting the parameter information of the test specimen into Equation (4) for inverse calculation, the fitting function R2 = 0.9637 of the ultimate load slip displacement was obtained. The calculated value of the formula is similar to the measured value of the test, and the fitting result is better.
(4)
Elastic stage ultimate slip displacement
The ultimate slip displacement of the elastic stage is the corresponding displacement when the specimen reaches the peak of the drawing bearing capacity of the elastic bonding section, and the calculation formula is as follows:
S e = q S u
where q is the proportional coefficient of the elastic stage ultimate slip displacement and the ultimate load slip displacement; the data obtained by the test were taken as 0.13.
(5)
Residual slip displacement
S r = 8 ( m m )
(6)
Residual bond strength
τ r = 0.5 τ u
According to the Equations (1)~(7) and the geometric characteristics of each stage’s curve, the expression about τ - S was obtained as follows:
(1)
Elastic bond stage
According to the geometric characteristics of the curve shape, it can be assumed as a directly proportional function, and the expression of this section can be obtained by using the extreme point ( S e , τ e ) of the elastic stage:
τ = p τ u q S u S S [ 0 , S e ]
(2)
Elastic–plastic slip stage
According to the geometric characteristics of the curve shape, it can be assumed as a vertex form of quadratic function. Using the extreme points ( S e , τ e ) of the elastic stage and the extreme points ( S u , τ u ) of the whole curve, the expression of this section can be obtained:
{ τ = λ τ u S u 2 S 2 2 λ τ u S u S + ( 1 + λ ) τ u S [ S e , S u ] λ = ( p 1 ) / ( q 1 ) 2
(3)
Destructive decline stage
According to the geometric characteristics of the curve shape, it can be assumed as a linear function, and the expression of this section can be obtained by using the residual bond strength point ( S r , τ r ) and the extreme points ( S u , τ u ) of the whole curve:
τ = τ u 1 p S u 8 S + p S u 8 S u 8 τ u S [ S u , 8 ]
Combining the above Equations (8)–(10), after substituting the relevant parameters, the bond–slip constitutive relationship between adhesive and reinforcement interfaces under medium and low cycle fatigue loads can be obtained as follows:
τ = { 5.46 τ u S u S S [ 0 , S e ]   0.38 τ u S u 2 S 2 + 0.76 τ u S u S + 0.62 τ u   S [ S e , S u ] τ u 0.29 S u 8 S + 0.71 S u 8 S u 8 τ u S [ S u , 8 ]

4.3. Spring Stiffness

The bond–slip performance and behavior of the adhesive and rebar interface are simulated by the spring element (Spring2). Through this unit, the bond–slip law of the adhesive and rebar interface of the rebar planting specimen in the test was converted into the relationship between the spring force and the spring tensile displacement. In the actual pull-out test, the adhesive was evenly wrapped on the surface of the anchored part of the rebar, and the drawing strength of the rebar planting system was maintained by the bonding force of the adhesive and reinforcement interfaces. In the simulation, the spring element was not continuously and uniformly arranged on the surface of the anchored part of the reinforcement, but was limitedly arranged on the grid node of the reinforcement and the concrete base material. Therefore, combined with Equation (11), the F-U expression of a single spring was obtained as follows:
F = τ ( S ) × π D L n
where n is the total number of spring elements.

5. Numerical Model Validation

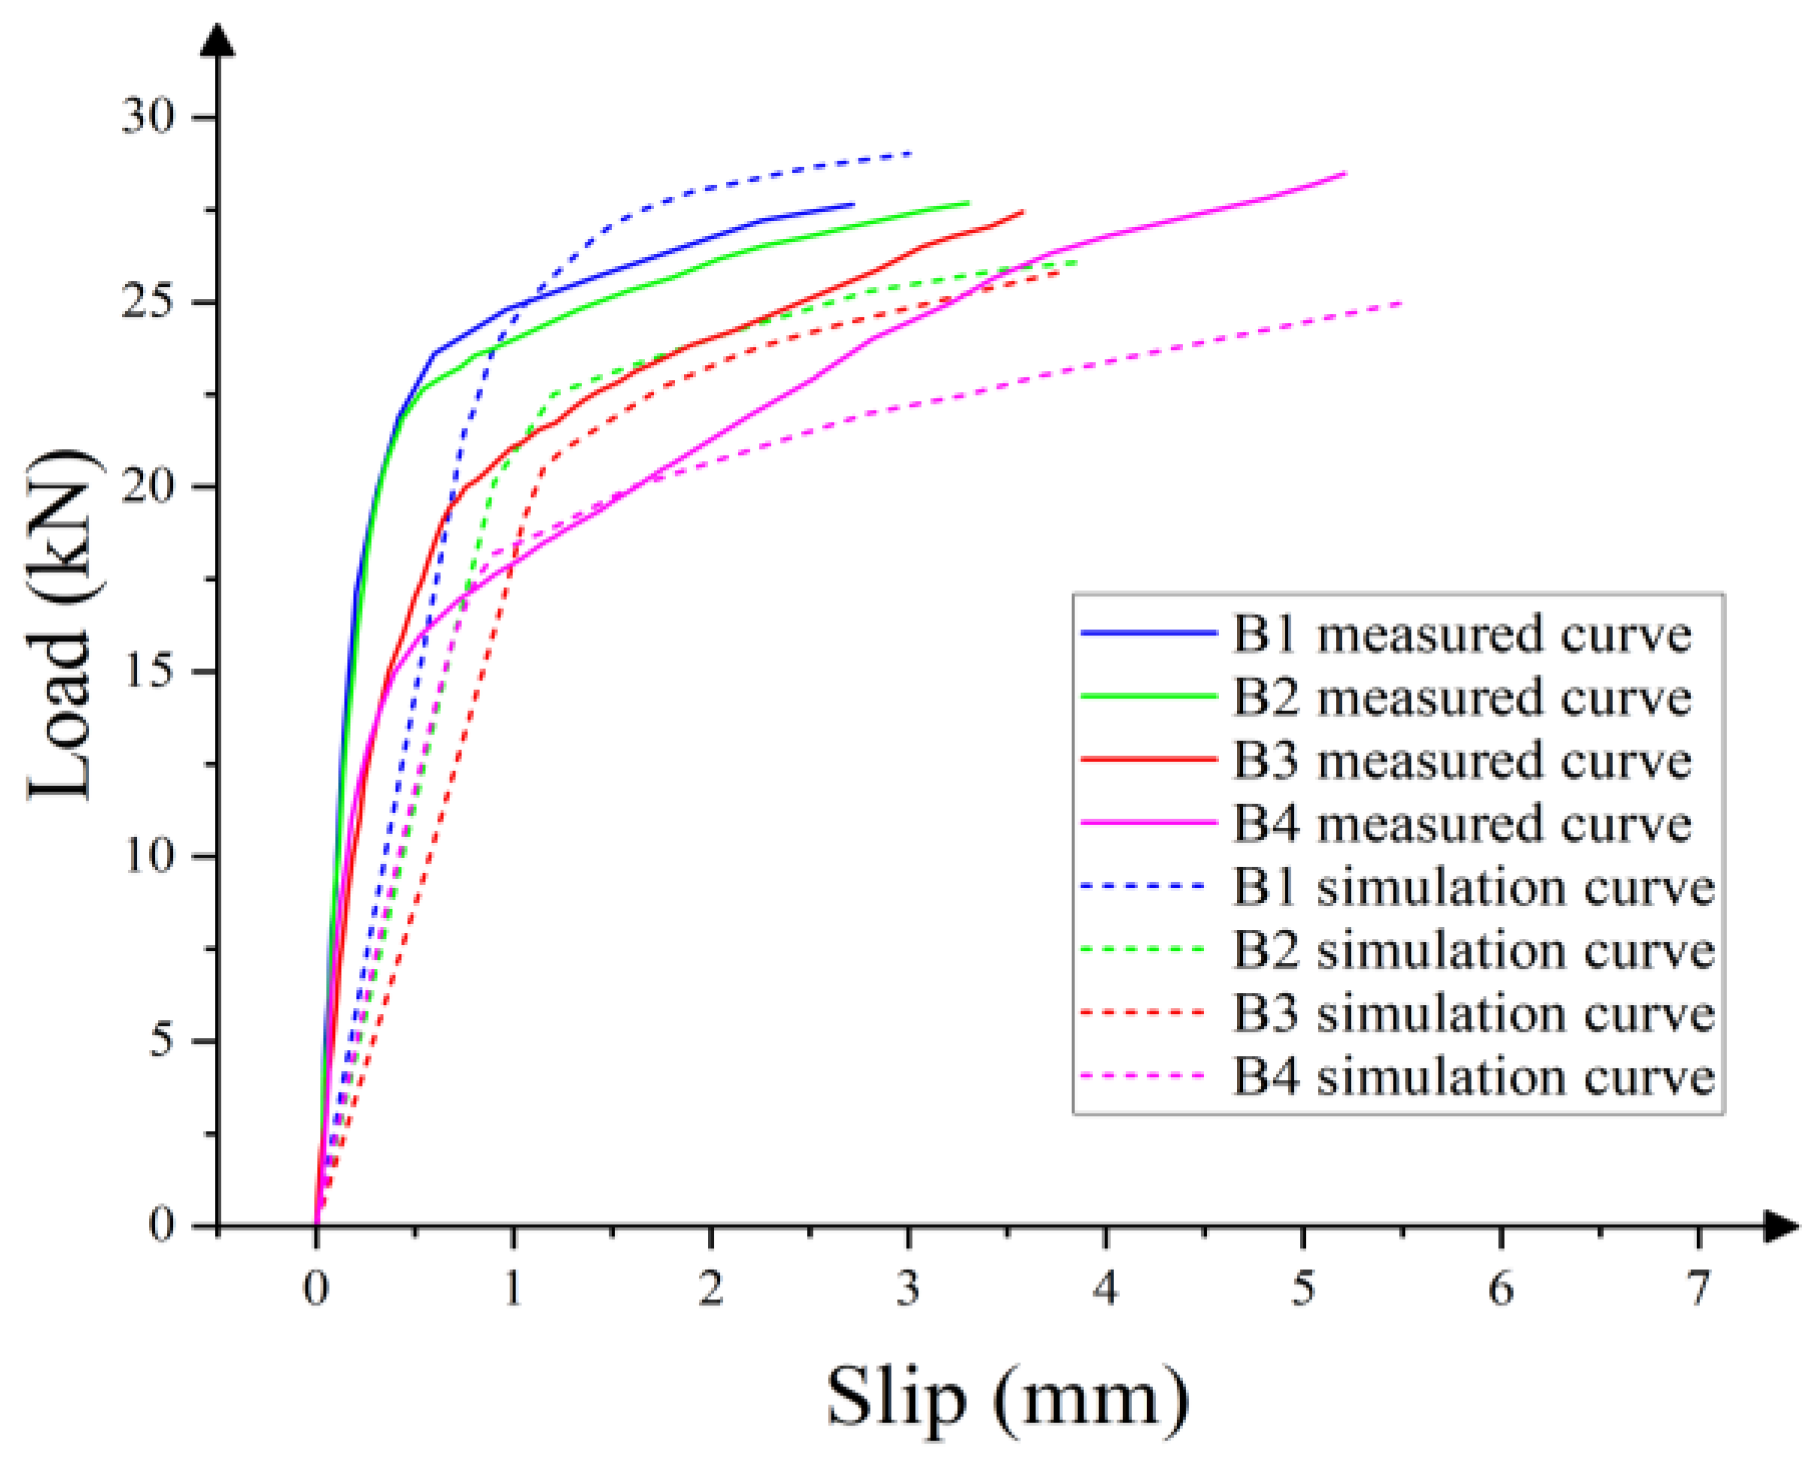
5.1. Comparison of Load–Slip Curves
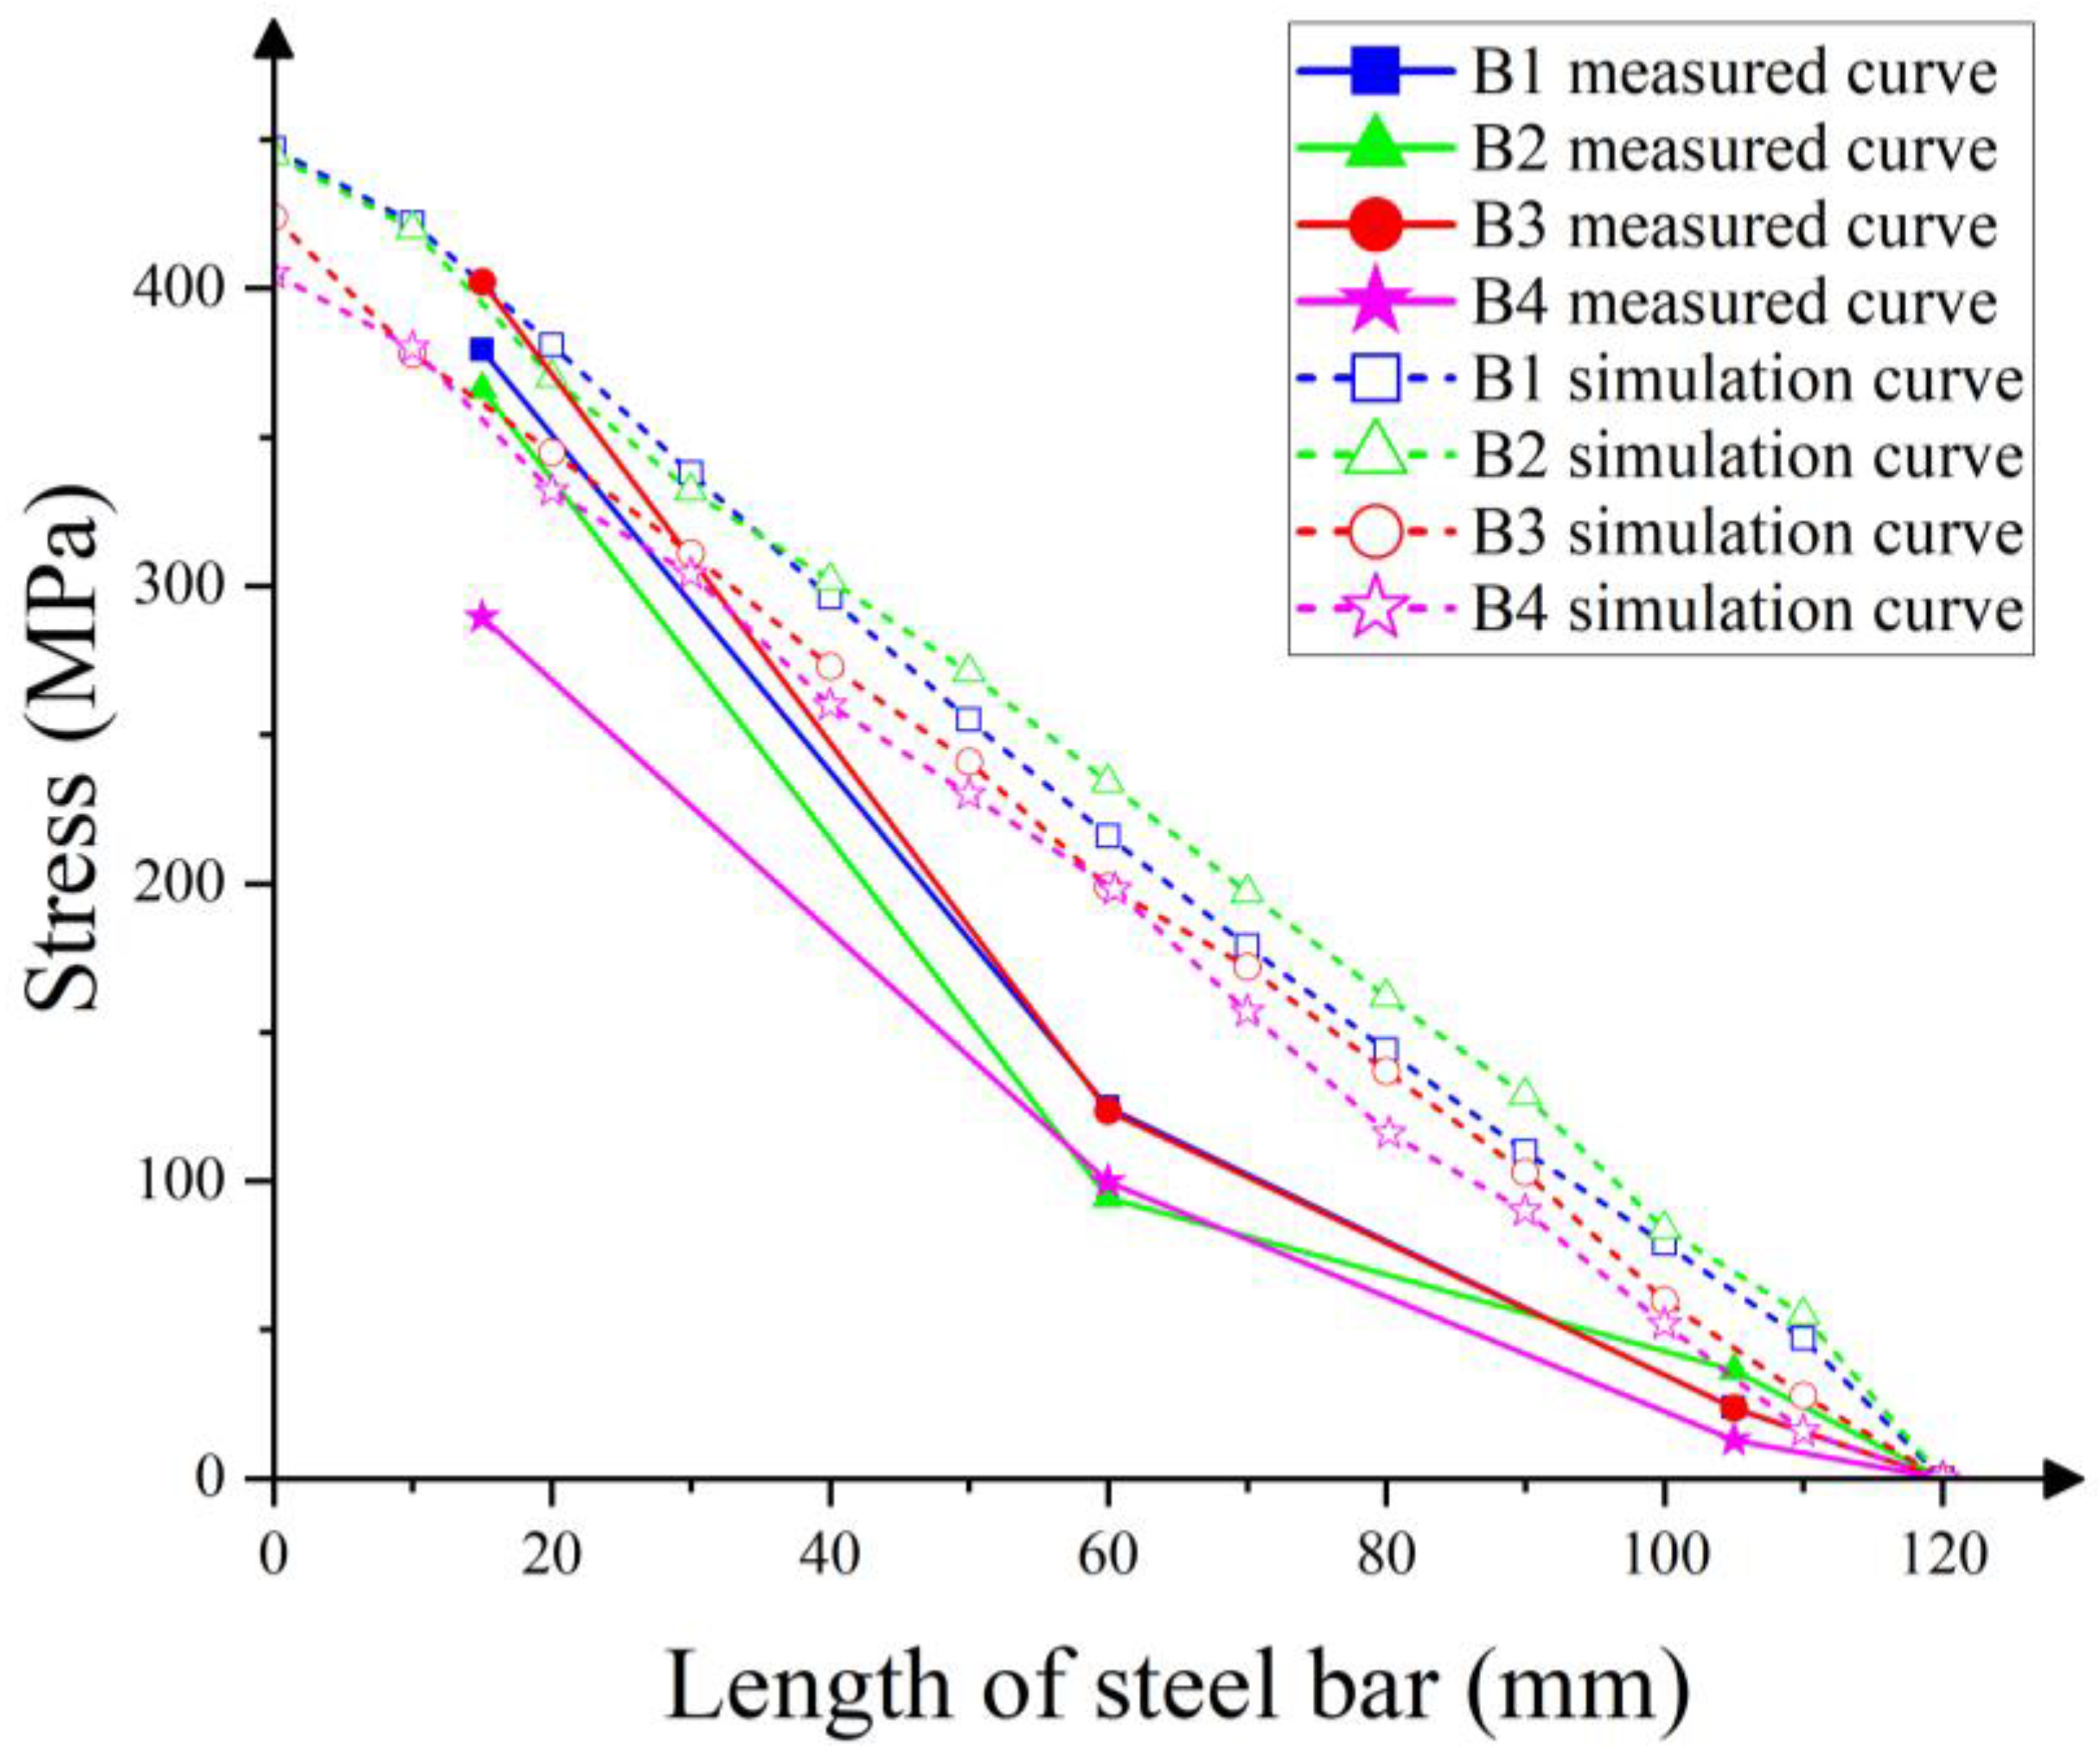
From the comparison between the simulation curve and the measured curve in Figure 11, it can be seen that the line type and trend of the curve in the elastic bond stage and the elastic–plastic slip stage are consistent with the test results, and the load and displacement values corresponding to the elastic ultimate points of the curve are basically consistent with the test results. The quantitative analysis of the load–slip curve of the simulated specimen is shown in Table 5. The ratio of the test to the simulated value of the ultimate load value of each specimen in the elastic bond stage in the simulation curve is close to 1, indicating that the numerical simulation results can truly reflect the elastic ultimate strength of the specimen.

5.2. Rebar Stress

Through the finite element numerical simulation, the stress distribution of the anchored part of the steel bar could be obtained, and it was compared with the measured stress of the steel bar. When the free end of the steel bar reached the yield strength, the distribution of the stress along the relative depth of the steel bar was drawn. The actual rebar stress in the test was obtained by the strain value, measured by the strain gauge through the following formula:
σ i = E ε i
where E is the elastic modulus of the steel bar and ε i is the strain at the measuring point.
It can be seen from Figure 12 that the simulated value of the stress of the anchored part of the steel bar had a higher stress level at the orifice, which is close to the actual yield strength of the steel bar and was the same as the actual changes trend. In the comparison of the numerical deviation between the simulated value and the measured value, the overall simulation curve is consistent with the actual situation, and the stress simulated value of all specimens is close to the measured value.

6. Elastic Ultimate Load under Medium and Low Cycle Fatigue Loads

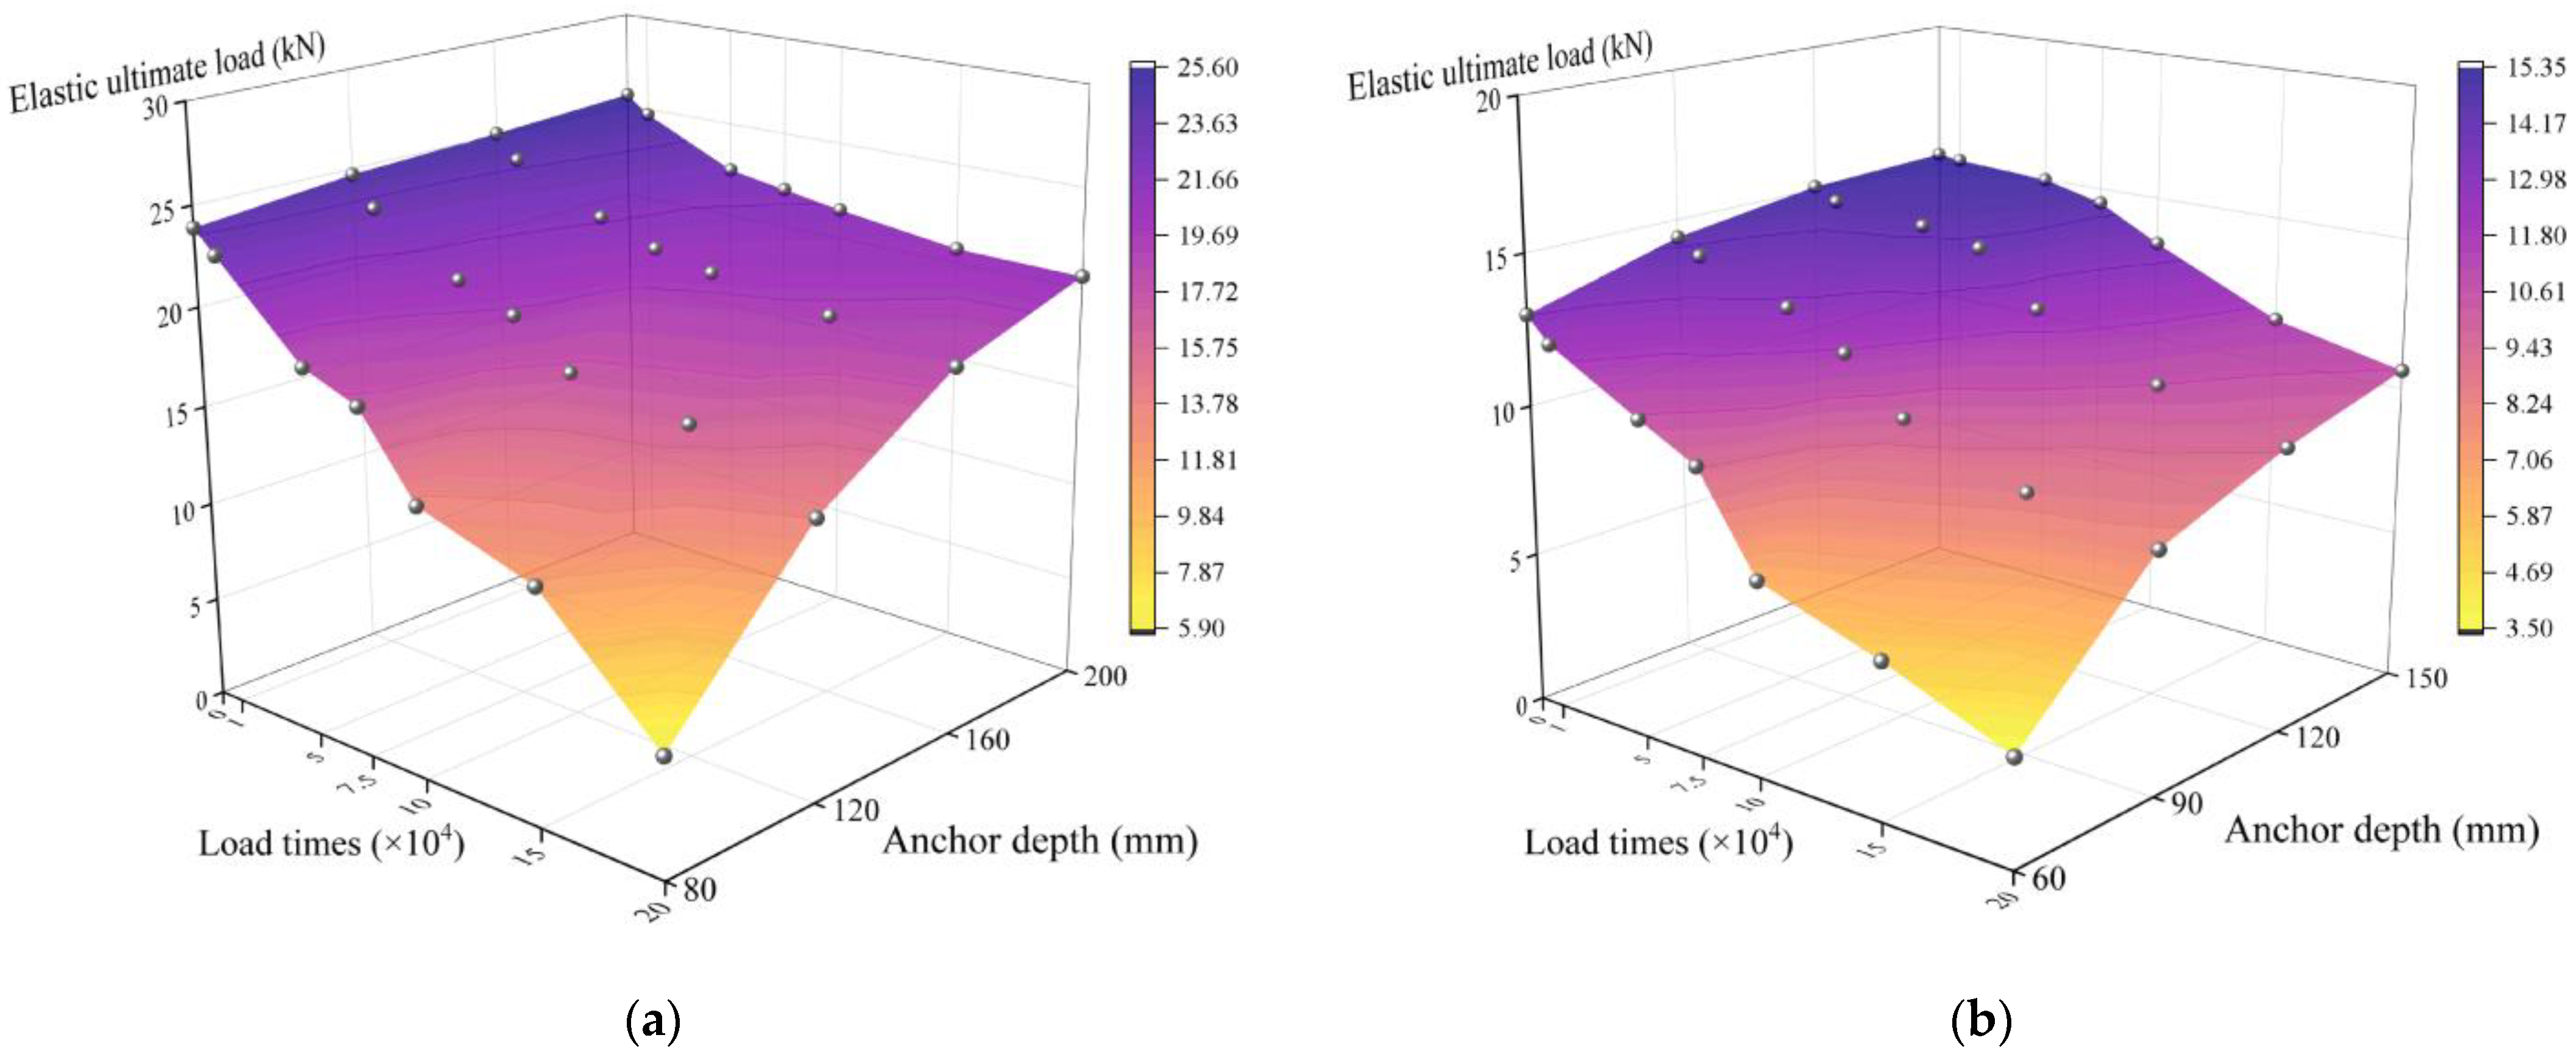
6.1. Analysis of Influencing Factors

Through the establishment of a large number of ABAQUS finite element rebar planting system models, the elastic ultimate load curve of 8 mm and 6 mm steel bars under different anchor depths and fatigue loading times was obtained, as shown in Figure 13. In this simulation, four anchor depths were set: 10d, 15d, 20d, 25d. We set the fatigue loading times to 10,000, 50,000, 75,000, 100,000, 150,000 and 200,000 for a total of six fatigue gradients, and established a set of control groups without fatigue loading.
The analysis in Figure 13 shows that when the fatigue loading times were the same, the elastic ultimate load increased with the increase in the anchor depth. In the case of different fatigue loading times, the elastic ultimate load of the specimen increased differently with the increase in the anchor depth: when the fatigue loading was of less than 10,000 times, the elastic ultimate load of the specimen was basically unchanged compared with the control specimen without fatigue loading at the same depth, and the elastic ultimate load only increased slightly with the increase in the depth. When the number of fatigue loading was of 50,000 to 75,000 times, and the depth of the planting bar was increased from 10d to 15d, the elastic ultimate load was obviously improved; with an anchor depth of greater than 15d, the increase in the anchor depth did not improve the elastic ultimate load. When the fatigue loading was of 100,000 to 200,000 times, and the depth of the planting bar was increased from 10d to 20d, this significantly increased the elastic ultimate load. If the depth of the planting bar was increased to 25d, the increment of the elastic ultimate load value was significantly reduced.
When the anchor depth of the rebar was fixed, the elastic ultimate load of the specimen decreased with the increase in fatigue loading times. The smaller the anchor depth of the rebar, the greater the influence of the fatigue load on the elastic ultimate load of the specimen, and the more obvious the decrease in the elastic ultimate load. When the anchor depth was 10d, the decrease in the elastic ultimate load of the specimen was most obvious when the number of fatigue loads increases. After the fatigue load reached 75,000 times, the decrease in the elastic ultimate load was more significant than before. When the anchor depth was 15d, the slope of the curve of elastic ultimate load–fatigue loading times begins to converge, and no large sudden changes occurred. When the fatigue load times increased, the overall load level of the specimen was greatly improved compared with that of 10d, especially when the fatigue times were 100,000 to 200,000. When the anchor depth of the specimen was 20d to 25d, the overall load level of the curve is close, and the resistance of the specimen to fatigue load disturbance tended to be close under the anchor depth. When the depth of the planting bar reached 25d, the increase in the number of the fatigue load had the least effect on the elastic ultimate load of the specimen, but the load still exhibited a certain decrease.

6.2. Formula Fitting

Based on the numerical simulation results of the ABAQUS finite element planting bar system, the function-fitting relationship between the elastic ultimate load of the planting bar, the anchor depth and the fatigue loading times was established. Assume that the elastic ultimate load is satisfied by the following expressions:
P e , 8 = k 1 L 2 + k 2 N 2 + k 3 L N + k 4 L + k 5 N + b
P e , 6 = h 1 L 2 + h 2 N 2 + h 3 L N + h 4 L + h 5 N + c
where k i and h i are the calculation coefficients, b and c are the constant terms.
Using MATLAB to complete the calculation coefficients and the constant terms in Equations (14) and (15), the expressions of the elastic ultimate load are as follows:
P e , 8 = 3.15 × 10 4 L 2 + 1.2386 × 10 2 N 2 + 5.193 × 10 3 L N   + 9.683 × 10 2 L 1.453009 N + 17.755295
P e , 6 = 5.63 × 10 4 L 2 + 8.33 × 10 4 N 2 + 2.561 × 10 3 L N   + 1.5274 × 10 1 L 6.31253 × 10 1 N + 5.369363
Substituting the parameter information of the finite element simulation specimen into Equations (16) and (17) for inverse calculation, the fitting functions R2 = 0.9758 and 0.9726 of the Equations (16) and (17) were obtained. The calculated value of the formula is similar to the simulation value.

7. Discussion

  • According to the ISO standard [40], the minimum allowable diameter of steel bar is 6 mm. Although there is no specific grade classification for the diameter of steel bars in the standard, in the engineering practice in China, steel bars with diameters of 6 mm, 8 mm and 10 mm are generally defined as small-diameter steel bars. In this study, a total of 24 single rebar planting specimens with diameters of 6 mm and 8 mm were tested, and the differences and change rules of the bond anchorage performances of rebar planting specimens under medium and low cycle fatigue loads were obtained. Although there may be some deficiencies in the number of test samples, this paper still studied the category of small-diameter rebar planting completely and obtained several similar analysis results and the formulas of the elastic ultimate load for 6 mm and 8 mm diameter rebar plantings. The next research direction could be to expand the number of test samples and expand the study to more diameters to obtain more comprehensive research conclusions. In order to obtain a more comprehensive and accurate quantitative formula for the performance of rebar plantings, a comparative test could be carried out between rebar planting with a diameter of 10 mm and a larger diameter.
  • In this study, a formula to quantify the elastic ultimate load of small-diameter rebar planting under the influence of fatigue load and anchor depth is proposed, which provides a reference for the design of rebar planting. And this paper could also provide an idea for the performance detection of rebar planting in a fatigue environment. From the test results of this study, it can be seen that even when the rebar plantings were in ductile failure (rebar fracture) and there was no significant difference in the ultimate load, the slip amount of the rebar planting specimen subjected to fatigue loading was significantly greater than that of the control specimen without fatigue loading under the same conditions, especially when the anchor depth was small. However, the excessive slip of the planted rebar is obviously not conducive to the connection and anchorage of the structure. Therefore, the evaluation of the performance of rebar planting can not only be limited to its ultimate load [36], but we also can further introduce the quantitative requirement of slip values, so that the performance deterioration degree of rebar planting affected by fatigue load can be further evaluated on the basis of the rebar fracture, so as to avoid potential security threats.
  • Through experiments and finite element simulation, this study obtained that the suitable anchorage depth of single rebar planting under a low and medium cycle fatigue load was 20d, which provided a certain reference for the design of rebar planting under similar fatigue environments. But in engineering applications, as a means of post-installation, rebar planting often undertakes the function of strengthening structures and components. Therefore, it might be a more practical research direction to study the fatigue performance and reliability of rebar planting components, which is also one of the limitations of our current research. In the future, similar fatigue tests will be carried out to study the fatigue mechanical properties [41] and the fatigue reliability assessment [42] of rebar planting specimens to verify the research conclusion of this study, which is the foreseeable research direction going forward.

8. Conclusions

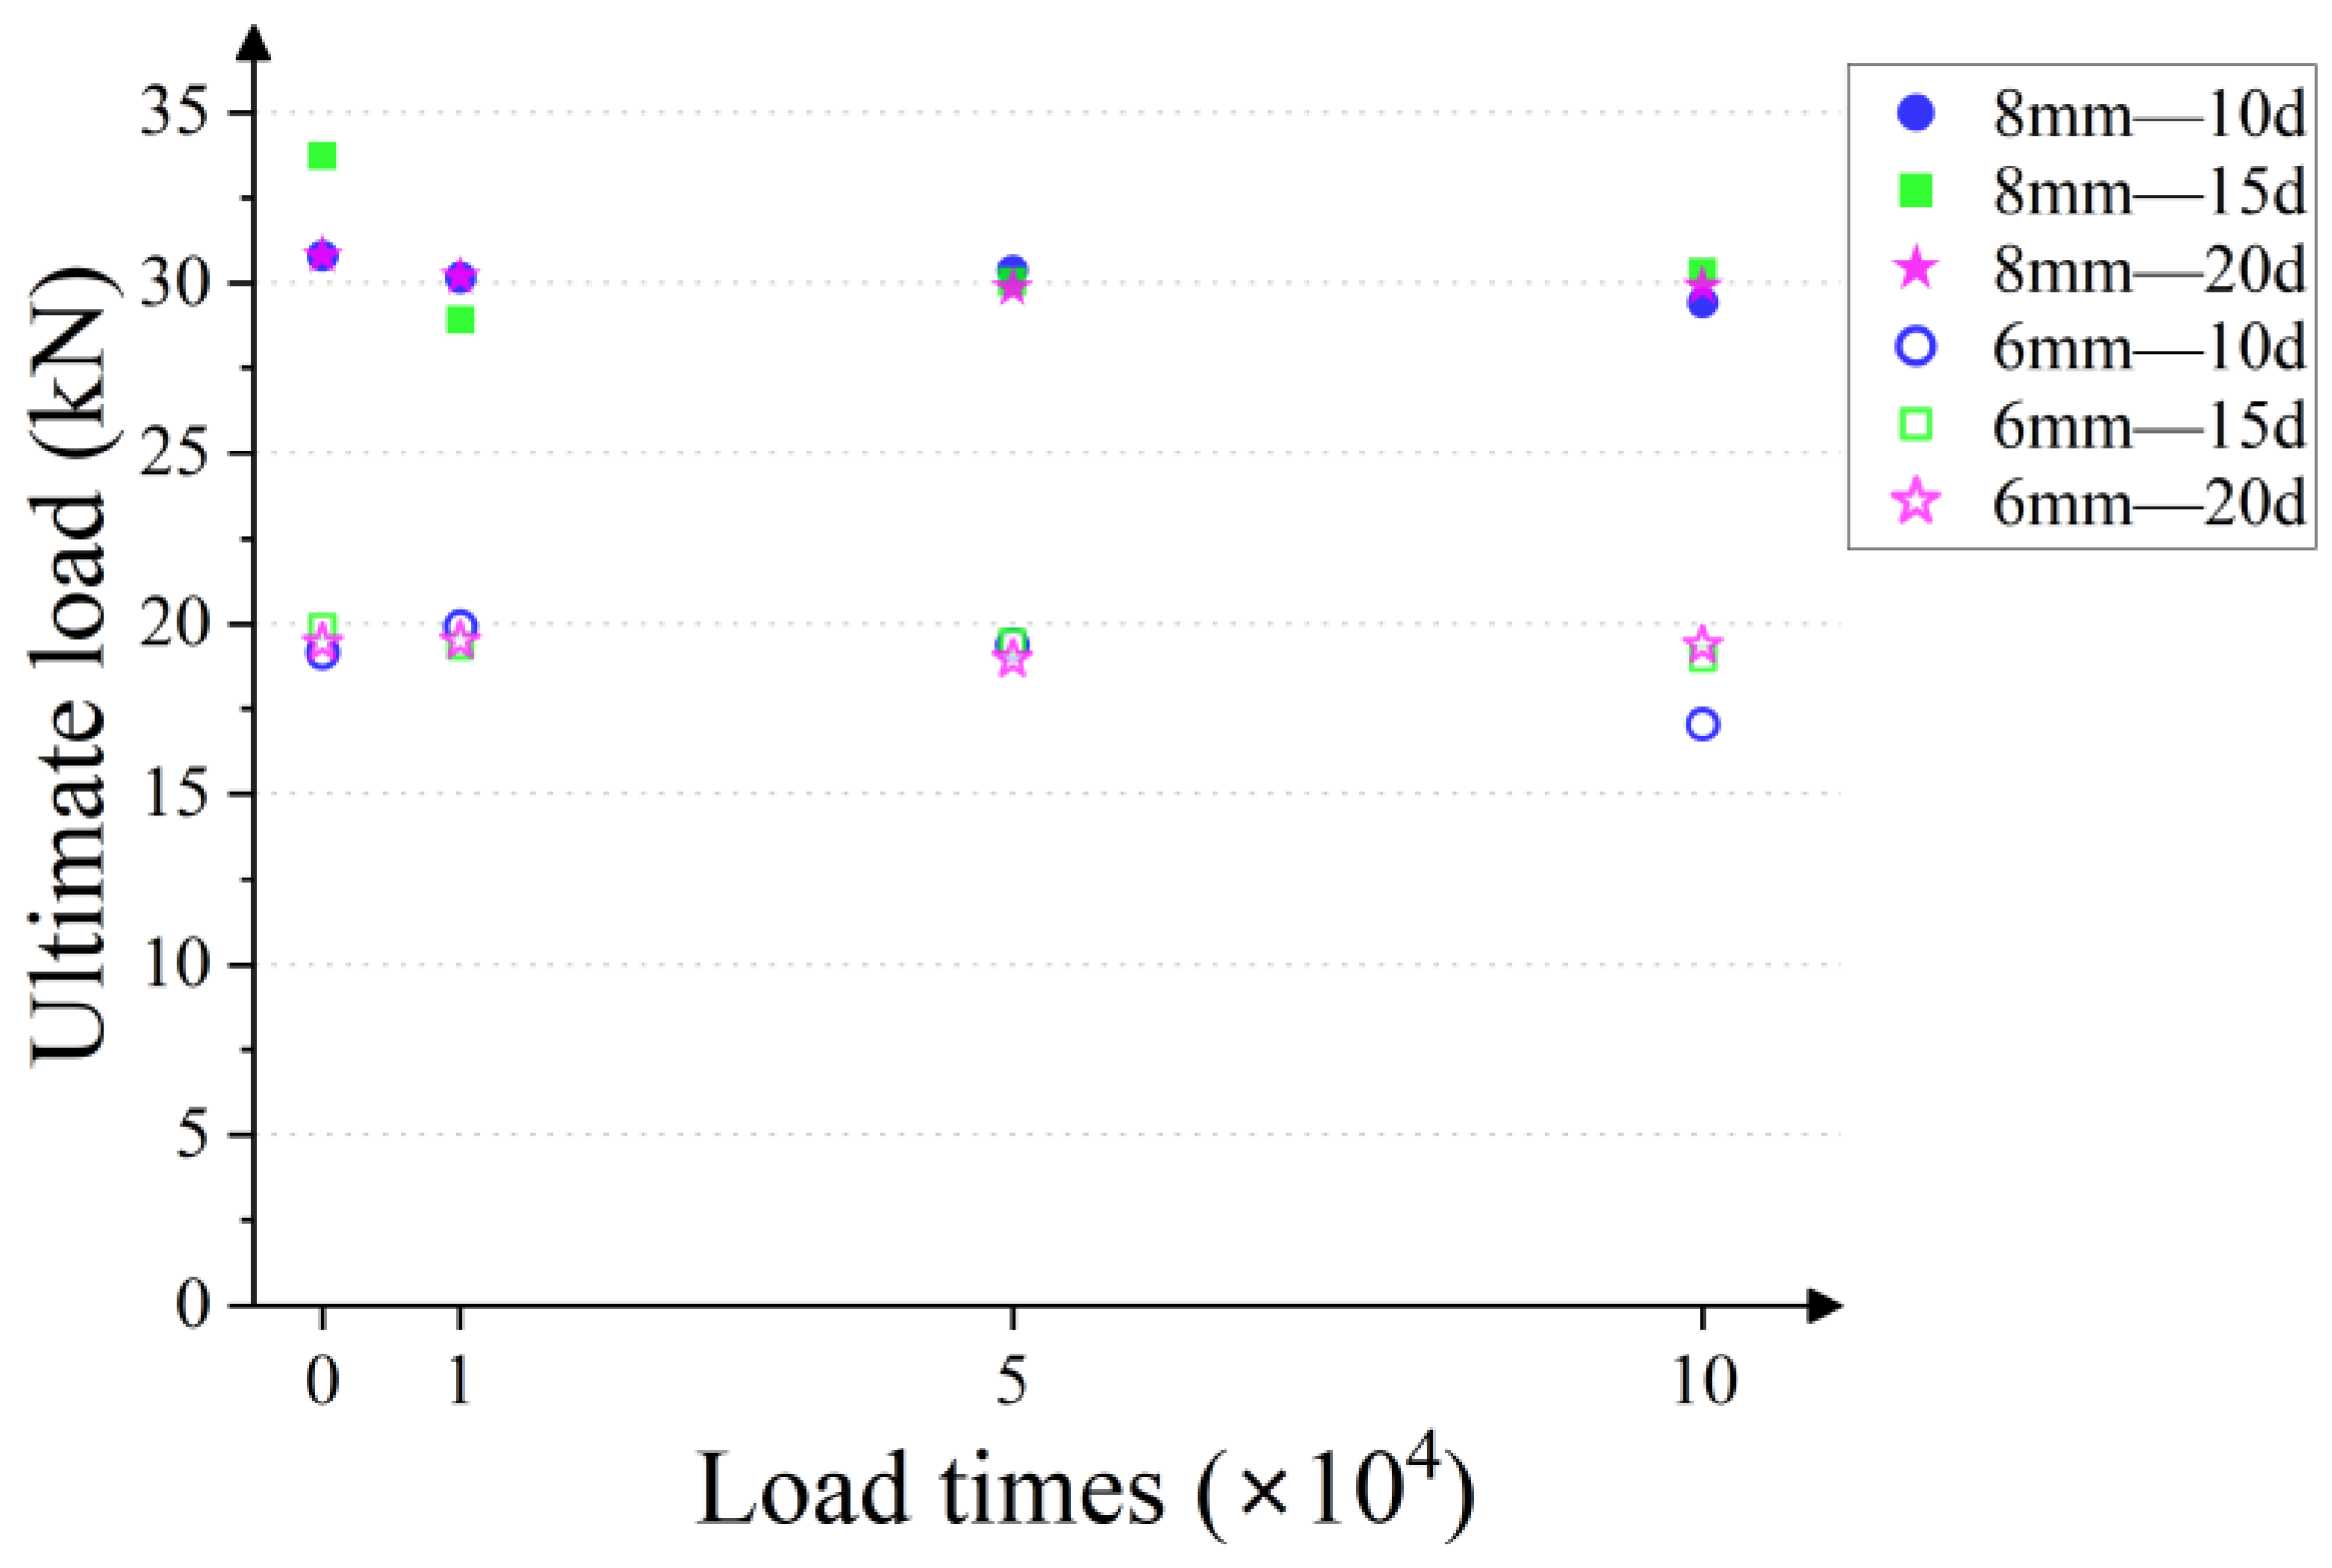
  • The ultimate drawing load of 6 mm and 8 mm small-diameter planting rebars under the medium and low cycle fatigue loads of 10,000~100,000 times does not change significantly, but the ultimate load slip displacement, elastic ultimate load and elastic stage ultimate slip displacement are significantly affected. When the anchor depth is the same, as the number of fatigue loading increases, the ultimate load slip displacement shows an increasing trend, and the elastic ultimate load decreases as the number of the loading increases. By increasing the anchor depth, the influence of fatigue load on the anchoring performance of the rebar planting specimen can be reduced. The increase in anchor depth cannot infinitely improve the elastic ultimate load of rebar planting under the medium and low cycle fatigue loads. When the anchor depth increased to 20d, the elastic ultimate load of the rebar planting was close to the load level without fatigue loading, and it was no longer effective to continue to improve the anchor depth. Under the premise of considering the economic cost, it is recommended that the design depth of rebar planting for similar projects should be 20d.
  • When the diameter of the steel bar and the anchor depth are the same, the strain level of the overall steel bar of the fatigue-loaded specimen is lower than that of the specimen without fatigue loading. With the increase in the relative depth, the influence gradually decreases until the bottom influence basically disappears. With the increase in the drawing load, the strain value of the free end of the steel bar increases the fastest, and the growth rate of the strain value gradually decreases along the depth direction. Fatigue load has no obvious effect on the axial strain distribution of rebar planting, and the strain value is always distributed from large to small according to the law of orifice–middle–bottom.
  • Through the fitting results of the elastic ultimate load of a large number of finite element numerical models, considering the joint influence of the two factors of anchor depth and fatigue loading times on the elastic ultimate load of rebar planting, it is concluded that the elastic ultimate load of rebar planting with the two diameters of 6 mm and 8 mm is a two-dimensional quadratic function with respect to anchor depth and fatigue loading times as independent variables.

Author Contributions

Conceptualization, K.C.; methodology, K.C.; software, L.Z.; validation, K.C. and L.Z.; formal analysis, K.C. and L.Z.; investigation, K.C. and L.Z.; resources, K.C. and L.Z.; data curation, K.C. and L.Z.; writing—original draft preparation, K.C.; writing—review and editing, K.C. and X.W.; visualization, K.C.; supervision, L.Z.; project administration, K.C. All authors have read and agreed to the published version of the manuscript.

Funding

This research was funded by the Young Teacher Development Program of Changsha University of Science and Technology, grant number 3020102|122500103.

Institutional Review Board Statement

This study did not involve any ethical issues. Thus, we choose to exclude this statement.

Informed Consent Statement

This study did not involve humans. Thus, we choose to exclude this statement.

Data Availability Statement

The manuscript data used to support the findings of this study are available from the corresponding author upon request.

Conflicts of Interest

The authors declare no conflict of interest.

References

  1. Yuko, S.; Satoshi, Y.; Shoichi, K.; Takashi, H.; Toru, T. Method of reinforcement for joints between steel roofs and RC columns in existing buildings. Eng. Struct. 2020, 209, 110255. [Google Scholar]
  2. Matteo, B.; Alessandra, A.; Joaquim, A.O.B. Shear strengthening of reinforced concrete beams strengthened using embedded through section steel bars. Eng. Struct. 2014, 81, 76–87. [Google Scholar]
  3. Wang, D.; Wu, D.; He, S.; Zhou, J.; Ouyang, C. Behavior of post-installed large-diameter anchors in concrete foundations. Constr. Build. Mater. 2015, 95, 124–132. [Google Scholar] [CrossRef]
  4. Brencich, A. A post-installed insert for pull-out tests on concrete up to 70 MPa. Constr. Build. Mater. 2015, 95, 788–801. [Google Scholar] [CrossRef]
  5. Ronald, A.C. Behavior of chemically bonded anchors. J. Struct. Eng. 1993, 119, 2744–2762. [Google Scholar]
  6. Ronald, A.C.; Jacob, K.; Werner, F.; Robert, C.K. Behavior and design of single adhesive anchors under tensile load in uncracked concrete. Aci. Struct. J. 1998, 95, 9–26. [Google Scholar]
  7. Ronald, A.C.; Robert, C.K. Factors influencing bond strength of adhesive anchors. Aci. Struct. J. 2001, 98, 1154–1168. [Google Scholar]
  8. Michael, M.; Ronald, A.C.; Kailash, K. Pullout simulation of postinstalled chemically bonded anchors. J. Struct. Eng. 1996, 122, 1016–1024. [Google Scholar]
  9. Kilic, A.; Yasar, E.; Atis, C.D. Effect of bar shape on the pull-out capacity of fully-grouted rockbolts. Tunn. Undergr. Sp. Tech. 2003, 18, 1–6. [Google Scholar] [CrossRef]
  10. Zhou, X.; Wang, Y.; Qu, S. Ultimate load carrying capacity analysis of adhesively bonded bars in concrete. Eng. Mech. 2002, 6, 82–86. [Google Scholar]
  11. Wang, D.; Wu, D.; Ouyang, C.; He, S.; Sun, X. Simulation analysis of large-diameter post-installed anchors in concrete. Constr. Build. Mater. 2017, 143, 558–565. [Google Scholar] [CrossRef]
  12. Wang, D.; Wu, D.; Ouyang, C.; Zhai, M. Performance and design of post-installed large diameter anchors in concrete. Constr. Build. Mater. 2016, 114, 142–150. [Google Scholar] [CrossRef]
  13. Bassam, A.T.; Zeyad, M.E.; Samir, S.; Moruf, O.Y. Pull-out behavior of post installed rebar connections using chemical adhesives and cement based binders. J. King Saud Univ. -Eng. Sci. 2019, 31, 332–339. [Google Scholar]
  14. Wang, C.P.; Wu, S.M.; Wang, C.K.; Pan, H.Y. Tensile capacity of post-Installed rebars in concrete structure. Adv. Mater. Res. 2011, 1279, 255–260. [Google Scholar] [CrossRef]
  15. Salih, Y.; Muhammet, A.Ö.; Yavuz, Y. Tensile behavior of post-installed chemical anchors embedded to low strength concrete. Constr. Build. Mater. 2013, 47, 861–866. [Google Scholar]
  16. Zavliaris, K.D.; Kollias, S.; Speare, P.R.S. An experimental study of adhesively bonded anchorages in concrete. Mag. Concrete Res. 1996, 48, 79–93. [Google Scholar] [CrossRef]
  17. Ling, Z.; Yang, H.; Liu, W.; Lu, W. Experimental study on bond and anchorage behavior of glued-in rebar in glulam. J. Build. Struct. 2013, 34, 132–141. [Google Scholar]
  18. Otero, C.M.D.; Estévez, C.J.; Martín, G.E.; Vázquez, R.J.A. Influence of timber density on the axial strength of joints made with glued-in steel rods: An experimental approach. Int. J. Adhes. Adhes. 2010, 30, 380–385. [Google Scholar] [CrossRef]
  19. Zhou, B.; Lv, X.; Ren, X. Theoretical analysis and experimental research of pull-out behavior of bonded steel bar embedded in brick wall of existing masonry structure. J. Build. Struct. 2012, 33, 132–141. [Google Scholar]
  20. Zhang, G.; Shi, K.; Li, Y. Experimental study on seismic behavior of brick walls strengthened with embedded bars. J. Build. Struct. 2013, 34, 145–150. [Google Scholar]
  21. Liu, X.; Ma, Z. Mechanical behavior analysis of fully grouted bolts under axial cyclic load. Minerals 2022, 12, 1566. [Google Scholar] [CrossRef]
  22. Liu, Y.L.; Tao, L.X.; Huan, J.H.; Xu, F.Q. Study of the anchorage seismic performance for beam-ends strengthened by bonded rebars. Adv. Mater. Res. 2014, 3137, 783–789. [Google Scholar] [CrossRef]
  23. Yi, C.; Lee, J.; Hong, K. Effect of low-level cyclic loading on bond behavior of a steel bar in concrete with pre-existing damage. Materials 2021, 14, 7080. [Google Scholar] [CrossRef]
  24. Lindorf, A.; Lemnitzer, L.; Curbach, M. Experimental investigations on bond behaviour of reinforced concrete under transverse tension and repeated loading. Eng. Struct. 2009, 31, 1469–1476. [Google Scholar] [CrossRef]
  25. Zhang, Y.; Kim, C.; Zhang, L.; Bai, Y.; Yang, H.; Xu, X.; Zhang, Z. Long term structural health monitoring for old deteriorated bridges: A copula-ARMA approach. Smart. Struct. Syst. 2020, 25, 285–299. [Google Scholar]
  26. Hawileh, R.A.; Abdalla, J.A.; Tamimi, A.A.; Abdelrahman, K.; Oudah, F. Behavior of corroded steel reinforcing bars under monotonic and cyclic loadings. Mech. Adv. Mater. Struc. 2011, 18, 218–224. [Google Scholar] [CrossRef]
  27. Zhang, Y.G.; Klingner, R.E.; Gravesiii, H. Seismic response of multiple-anchor connections to concrete. Aci. Struct. J. 2001, 98, 811–822. [Google Scholar]
  28. Yan, X.; Liang, L.; Liang, C. Bond slip behavior of post-installed anchorage under fatigue load. J. Civ. Environ. Eng. 2020, 42, 149–156. [Google Scholar]
  29. GB50367-2013; Code for Design of Strengthening Concrete Structure. China Architecture & Building Press: Beijing, China, 2013. (In Chinese)
  30. GB/T50081-2019; Standard for Test Methods of Concrete Physical Andmechanical Properties. China Architecture & Building Press: Beijing, China, 2019. (In Chinese)
  31. ISO6892-1:2019; Metallic Materials-Tensile Testing-Part 1: Method of Test at Room Temperature. ISO: Geneva, Switzerland, 2019.
  32. GB50728-2011; Technical Code for Safety Appraisal of Engineeringstructural Strengthening Materials. China Architecture & Building Press: Beijing, China, 2011. (In Chinese)
  33. GB/T2567-2008; Test Methods for Properties of Resin Casting Boby. Standards Press of China: Beijing, China, 2008. (In Chinese)
  34. ISO75-2:2013; Plastics-Determination of Temperature of Deflection under Load-Part 2: Plastics and Ebonite. ISO: Geneva, Switzerland, 2013.
  35. Ding, K. The effect of frequency on the fatigue strength of steel bars. Ind. Constr. 1989, 11, 26–29. [Google Scholar]
  36. JGJ145-2013; Technical Specification for Post-Installed Fastenings Inconcrete Structures. China Architecture & Building Press: Beijing, China, 2013. (In Chinese)
  37. GB50010-2010; Code for Design of Concrete Structures. China Architecture & Building Press: Beijing, China, 2010. (In Chinese)
  38. Zhang, J.; Huang, H.; Xiao, W.; Wu, J.; Song, L. Experimental research on interface action behavior of adhesive steel bar in concrete. Build. Struct. 2008, 38, 39–42. [Google Scholar]
  39. Zhang, Z.; Niu, Q.; Liu, X.; Zhang, Y.; Zhao, T.; Liu, M. Durability life prediction of reinforced concrete structure corroded by chloride based on the gamma process. ASCE-ASME J. Risk Uncertain. Eng. Syst. Part A Civ. Eng. Arch. 2021, 7, 04021061. [Google Scholar] [CrossRef]
  40. ISO6935-2:2015; Steel for the Reinforcement of Concrete-Part 2: Ribbed Bars. ISO: Geneva, Switzerland, 2015.
  41. Zhang, Z.; Cao, F.; Yang, J.; He, Z. Experiment on natural frequency change of reinforced concrete members under low cycle loading. Shock. Vib. 2018, 2018, 1–17. [Google Scholar] [CrossRef]
  42. Zhang, Z.; Zhao, C.; Zhao, Z.; Wang, F.; Zhao, B. Structural fatigue reliability evaluation based on probability analysis of the number of zero-crossings of stochastic response process. Eng. Fail. Anal. 2023, 143, 106923. [Google Scholar] [CrossRef]
Figure 1. Roadmap of the research.
Applsci 13 07784 g001
Figure 2. Test content and flow path.
Applsci 13 07784 g002
Figure 3. (a) Schematic diagram of single-bar rebar planting specimen (mm); (b) schematic diagram of strain gauge arrangement (mm).
Applsci 13 07784 g003
Figure 4. Loading device.
Applsci 13 07784 g004
Figure 5. Typical failure modes: (a) bonding failure; (b) rebar fracture.
Applsci 13 07784 g005
Figure 6. Ultimate load scatter plot.
Applsci 13 07784 g006
Figure 7. Load–slip curve: (a) specimen of 8 mm steel bar (10d); (b) specimen of 8 mm steel bar (15d); (c) specimen of 8 mm steel bar (20d); (d) specimen of 6 mm steel bar (10d); (e) specimen of 6 mm steel bar (15d); (f) specimen of 6 mm steel bar (20d).
Applsci 13 07784 g007
Figure 8. Relationship curve between elastic ultimate load ratio and fatigue loading times.
Applsci 13 07784 g008
Figure 9. Axial strain–load curve of steel bars: (a) specimen of 8 mm steel bar (10d); (b) specimen of 8 mm steel bar (15d); (c) specimen of 8 mm steel bar (20d).
Applsci 13 07784 g009
Figure 10. Schematic diagram of constitutive relationship.
Applsci 13 07784 g010
Figure 11. Comparison of load–slip curves between simulation and measured.
Applsci 13 07784 g011
Figure 12. Comparison of stress distribution of steel bars between experiment and finite element simulation.
Applsci 13 07784 g012
Figure 13. The relationship between fatigue loading times and anchor depth on elastic ultimate load: (a) specimens of 8 mm steel bar; (b) specimens of 6 mm steel bar.
Applsci 13 07784 g013
Table 1. Measured values of compressive strength of substrate cube.
Design GradeTest Block 1 Compressive Strength (MPa)Test Block 2 Compressive Strength (MPa)Test Block 3 Compressive Strength (MPa)Average Compressive Strength (MPa)
C3536.337.437.036.9
Table 2. Measured values of rebar strength.
Diameter (mm)Average Yield
Tension (kN)
Average Yield Strength (MPa)Average Ultimate Tension (kN)Mean Ultimate Strength (MPa)
612.0842717.35614
822.2245530.33603
Table 3. Measured values of planting adhesive.
Test ItemsStandard
Requirements
Performance
Data
Standards
Splitting Tensile Strength≥8.5 MPa12.5 MPaGB 50728-2011
Bending Strength≥50 MPa67.2 MPaGB/T 2567-2008
Compressive Strength≥60 MPa87.3 MPaGB/T 2567-2008
Bond Strength Between Rebar and Concrete under Constraint ConditionsC60, C25, L = 125 mm≥17 MPa26.4 MPaGB 50728-2011
Heat Distortion Temperature (HDT)≥60 °C66.1 °CISO 75-2: 2003
Table 4. Ultimate load and failure mode of specimens.
Specimen NumberDiameter of Rebar (mm)Anchor Depth (mm)Load Times
(×104)
Ultimate Load (kN)Failure Mode
A1880030.79Rebar fracture
A2880130.16Rebar fracture
A3880530.37Rebar fracture
A48801029.42Rebar fracture
B18120034.72Rebar fracture
B28120128.42Rebar fracture
B38120530.03Rebar fracture
B481201030.32Rebar fracture
C18160030.80Rebar fracture
C28160130.19Rebar fracture
C38160529.86Rebar fracture
C481601029.90Rebar fracture
D1660019.16Rebar fracture
D2660119.92Rebar fracture
D3660519.38Rebar fracture
D46601017.46Bonding failure
E1690019.91Rebar fracture
E2690119.35Rebar fracture
E3690519.48Rebar fracture
E46901019.00Rebar fracture
F16120019.45Rebar fracture
F26120119.50Rebar fracture
F36120518.97Rebar fracture
F461201019.37Rebar fracture
Table 5. Ultimate loads in elastic bond stage.
Name of SpecimenMeasured Value (kN)Simulation Value (kN)Ratio
B1 measured23.6124.700.956
B2 measured22.7423.200.980
B3 measured19.7020.600.956
B4 measured15.0017.400.862
Disclaimer/Publisher’s Note: The statements, opinions and data contained in all publications are solely those of the individual author(s) and contributor(s) and not of MDPI and/or the editor(s). MDPI and/or the editor(s) disclaim responsibility for any injury to people or property resulting from any ideas, methods, instructions or products referred to in the content.

