1. Introduction
When studying the movement rules of coal mining overburden, researchers usually divide the overburden into three horizontal zones and three vertical zones according to the shape of rock mass in front and back of the working face. To be specific, along the horizontal advancing direction of the working face, the overburden is divided into the recompacted zone, separation zone, and coal wall supporting zone; along the vertical direction, the overburden is divided into the caving zone, crack zone, and bending subsidence zone from the bottom up [
1].
The strata that play the control effect in the activity of rock masses were designated as the key strata, and the rules of deformation, separation, and fracture of the strata affected by the key stratum behavior were studied in detail [
2]. The position, size, and development characteristics and their influence factors of bed separations have been analyzed deeply by experimental and theoretical methods. The results show that bed separations mainly occur below the key strata [
3]. Xie and Xu investigated the effect of key stratum on the mining abutment pressure with different key stratum thicknesses and heights by numerical simulations [
4]. An in situ investigation was carried out to determine the law of fracture and movement of a key stratum [
5]. A distributed optical fiber sensor (DOFS) and multipoint borehole extensometers (MPBXs) were collaboratively employed to monitor the deformation of high-level key strata [
6]. The corresponding relationship between the change of goaf pressure and the key stratum break by physical simulation and field measurements [
7]. Ti et al. used the key stratum theory to study the fracture mechanism of overlying strata during longwall mining [
8].
According to the present research results, key strata controlled the development height of water-conducting fractures [
9]. A water-flowing fractured zone height prediction method based on an improved key stratum theory was established and applied [
10]. The influence of periodic movement of key strata on the downward leakage law of harmful gases was analyzed [
11]. Fracture types of key strata were identified through the moment tensor inversion [
12]. A fracture aperture mechanical model based on key stratum fracture was used to analyze the main influencing factors of high key stratum fracture and rotation [
13]. The fracture characteristics of overlying strata during underground coal mining were analyzed via similar simulation [
14]. The dynamic disturbance effect on front coal-rock masses as the key layer fractures which shows that dynamic disturbance effect caused by high intensity mining is relatively conspicuous on the fractured stratum [
15]. Changes in overburden movement, groundwater level, and groundwater inrush were monitored by means of borehole and working face observations, water leakage, and real-time video imaging [
16]. The distribution characteristic of mining-induced horizontal fracture in longwall panel has been studied by field investigation and a prediction model [
17]. The range of abundant restriction of strata separation fracture is elaborated, and the interstice permeability and the characteristic of gas delivery in the restriction of strata separation fracture are analyzed [
18]. The effect of seam separation distances and key stratum configurations on characteristics of strata movement and surface subsidence was evaluated using the discrete-element method [
19]. A study on the movement laws of the overlying strata at the working face ends assessed their effects on the surface deformation using field monitoring as well as physical and numerical modeling [
20]. Characteristics of multi-seam subsidence are investigated by means of several sand-plaster physical models [
21].
In the past, few studies have taken the full-columnar overburden as the research object. Full-columnar overburden refers to the whole overlying rock from coal seam to the ground surface. Based on the specific columnar conditions of a working face, this paper establishes full-columnar overburden models by 3DEC (3 Dimension Distinct Element Code) (V5.2) simulation software. Meanwhile, combined with the key stratum theory, this paper also analyzes the influence of different mining heights and widths on the separation layer and fracture distribution of mining overburden. The results of this study are of great significance to guide the engineering of separation grouting and water-retaining mining and so on.
3. Numerical Simulation of Full-Columnar Overburden
Numerical simulation was carried out with reference to the strata column in
Figure 2. In order to establish the model better, in addition to processing key strata in the column according to actual lithology, other rock layers were simplified as unified soft rock due to the excessive amount. Finally, the 99 layers were simplified into 43 layers, including surface soil layer, key strata, soft rock, coal seam, and floor. 3DEC software was used for numerical simulation, which is based on the discrete element method to describe the discrete medium and perform mechanical calculation. The finite difference method was used to simulate the discontinuous mechanical behavior of the contact surface. The length and width of the 3DEC model are 1600 m and 800 m, respectively, and the height is consistent with the actual depth of coal seam. The upper boundary of the model corresponds to the ground surface and belongs to the free boundary; the bottom and surrounding boundary of the model are fixed. The whole model itself is subject to vertical gravity. The strike length of the simulated working face is 1000 m, with 300 m coal pillars at each end. The inclined width of the working face is determined according to each scheme, and the boundary coal pillar of the same width is also left at both ends. The lithological mechanical parameters in the model are assigned with reference to the measured results in
Table 1.
Under the condition that the mining width is fixed at 300 m, three models with different mining heights, namely 3 m, 4 m, and 5 m, were established. Under the condition that the mining height is fixed at 5 m, three models with different mining widths, namely, 250 m, 300 m, and 350 m, were established, respectively. Through the above five simulation schemes, the evolution law of the internal separation layer and fracture of overlying strata movement under different mining heights and widths was simulated and studied. The specific model parameters are shown in
Table 2.
In order to master the strata movement law of each model under the influence of mining, a vertical observation borehole (NLC) was arranged in the middle of the working face. A measuring point was arranged on each key stratum to monitor the stress and displacement data during mining. During the entire mining stage, the stress and displacement results of the mining overburden were monitored within the whole process of mining.
3.1. Simulation Results of Models with Different Mining Heights
Figure 4 shows the cloud diagram of overburden displacement change in Scheme 1 during the mining process. When the working face advances to 50 m behind the NLC, a 0.1 m-thick separation layer appears below KS1 in the NLC. When the working face advances 100 m behind the NLC, the maximum separation thickness below KS1 is about 0.6 m. When the working face advances to 200 m behind the NLC, the separation layer below KS1 is about 0.2 m. From KS2 to KS4, there is no obvious separation layer.
Figure 5 shows the monitoring data curves of displacement and stress obtained from measuring points of each key stratum in NLC in Scheme 1.
As is shown in
Figure 5a, when the working face is in advance of NLC, the upper rock mass is more susceptible to advance compression than the lower rock mass. The upper rock strata KS4 to PKS begin to produce compression deformation at a distance between the working face and the NLC with −300 m (the minus sign means the position of the working face is ahead of NLC), while the lower rock strata KS1 to KS3 begin to produce compression deformation at a distance between the working face and the NLC with −200 m. When the working face advances past NLC, the displacement from KS1 to KS3 changes greatly, while the displacement above KS4 changes slightly. When the working face advances past NLC by 100 m, the maximum subsidence of KS1 is about 2.33 m.
As is shown in
Figure 5b, when the working face advances ahead NLC 90 m, stress concentration is generated within the range of KS1 to KS3 due to advanced compression, and the peak stress reaches 17.55 MPa. When the working face continues to advance to right below NLC, obvious fractures appear in KS1, and the stress of this stratum is relieved to 0 Mpa sharply. When the working face advances past NLC by 50 m, KS2 and KS3 are fractured, and the stress values of the corresponding strata are depressurized to 0 Mpa. At this time, KS4 also witnesses a large stress relief, but the stress does not drop to 0 Mpa. The stress from KS5 to PKS does not show a large relief, indicating that there is no fracture. After the working face is pushed past NLC by 150 m, the stress monitored at the measuring points in each key stratum tends to be stable, indicating that the lower goaf is in a state of compaction.
Based on the analysis results in
Figure 5, it can be concluded that the stress at measuring points from KS1 to KS3 has a sharp pressure relief and the subsidence displacement increases sharply synchronously, indicating that the three key strata have broken. However, from KS4 to PKS, the stress reduction rate is slow, and the lowest stress is much higher than 0 MPa, while the subsidence displacement increases slowly, indicating that only bending subsidence of varying degrees occurs from KS4 to PKS, but no obvious fracture occurs.
Figure 6 shows the cloud diagram of overburden displacement change in Scheme 2 during the mining process. When the working face advances to 50 m behind the NLC, a 0.5 m-thick separation layer appears below KS1 in the NLC. When the working face advances 100 m behind the NLC, the thickness of separation layer below KS1 increases to 1 m; meanwhile, separation layer also appears below KS2 and KS3. When the working face advances to 150 m behind the NLC, the separation layer below KS1 and KS2 tends to close, and the maximum thickness of the separation layer below KS3 is 0.5 m. When the working face advances to 200 m behind the NLC, the separation layer below KS1 and KS3 tends to close. No obvious separation layer is observed below KS4 throughout the whole process.
Figure 7 shows the monitoring data curves of displacement and stress obtained from measuring points of each key stratum in NLC in Scheme 2.
As is shown in
Figure 7a, when the working face is in advance of NLC, the upper rock strata KS4 to PKS begin to produce compression deformation at a distance between the working face and the NLC with −250 m due to the impact of advance compression. By contrast, compression deformation occurs in KS1 to KS3 at a distance between the working face and the NLC with −150 m. When the working face advances past NLC, the displacement from KS1 to KS3 changes greatly, while the displacement above KS4 changes slightly. When the working face advances past NLC by 150 m, the maximum subsidence of KS1 is about 3.19 m.
As is shown in
Figure 7b, when the working face advances ahead NLC70m, stress concentration is generated within the range of KS1 to KS3 due to advanced compression, and the peak stress reaches 17.44 MPa. When the working face continues to advance past NLC by 15 m, obvious fractures appear in KS1, and the stress of this stratum is relieved to 0 Mpa sharply. When the working face advances past NLC by 50 m, KS2 is fractured completely; when the working face advances past NLC by 100 m, KS3 is fractured completely. The stress of the corresponding strata is depressurized to 0 MPa. Meanwhile, the stress from KS4 to PKS does not show a large relief, indicating that there is no fracture.
Figure 8 shows the cloud diagram of overburden displacement change in Scheme 3 during the mining process. When the working face advances to 50 m behind the NLC, a 1.1 m-thick separation layer appears below KS1. As the working face continues to advance, the separation layer below KS2 and KS3 tends to close, and the maximum thickness of the separation layer below KS3 is 1.0 m. When the working face advances to 200 m behind the NLC, the separation layer below KS1 and KS2 tends to close, and the separation layer below KS3 is approximately 0.9 m. No obvious separation layer is observed below KS4 throughout the whole process.
Figure 9 shows the monitoring data curves of displacement and stress obtained from measuring points of each key stratum in NLC in Scheme 3.
As is shown in
Figure 9a, when the working face is in advance of NLC, the upper rock strata KS4 to PKS begin to produce compression deformation at a distance between the working face and the NLC with −200 m due to the impact of advance compression. By contrast, compression deformation occurs in KS1 to KS3 at a distance between the working face and the NLC with −100 m. When the working face advances past NLC by 150 m, the maximum subsidence of KS1 is about 4.34 m.
As is shown in
Figure 9b, when the working face advances ahead NLC 100 m, stress concentration is generated remarkably within the range of KS1 to KS3, and the peak stress reaches 16.22 MPa. When the working face continues to advance to right below NLC, obvious fractures appear in KS1, and the stress of this stratum is released to 0 Mpa sharply. When the working face advances past NLC by 50 m, KS2 and KS3 are fractured completely; the stress of the corresponding strata is depressurized to 0 MPa. Meanwhile, stress relief occurs from KS4 to PKS, but the stress does not drop down to 0 Mpa, indicating that there is no fracture.
3.2. Simulation Results of Models with Different Mining Widths
Figure 10 shows the cloud diagram of overburden displacement change in Scheme 4 during the mining process. When the working face advances to 50 m behind the NLC, a 0.4 m thick separation layer appears below KS1 in the NLC. As the working face continues to advance, the separation layer below KS2 and KS3 tends to close, and the maximum thickness of the separation layer below KS3 is 1.0 m. When the working face advances to 200 m behind the NLC, the separation layer below KS1 and KS2 tends to close, and the separation layer below KS3 is approximately 1.2 m. No obvious separation layer is observed below KS4 throughout the whole process.
Figure 11 shows the monitoring data curves of displacement and stress obtained from measuring points of each key stratum in NLC in Scheme 4.
As is shown in
Figure 11a, when the working face advances past NLC by 200 m, the subsidence of KS1 tends to be stable and reaches 4.32 m.
Figure 11b shows that when the working face advances ahead NLC 70 m, stress concentration is generated remarkably within the range of KS1 to KS3, and the peak stress reaches 17.35 Mpa. When the working face continues to advance to right below NLC, obvious fractures appear in KS1, and the stress of this stratum is depressurized to 0 Mpa sharply. When the working face advances past NLC by 50 m, KS2 and KS3 are fractured completely; the stress of the corresponding strata is depressurized to 0 MPa. Meanwhile, stress relief occurs from KS4 to PKS, but the stress does not drop down to 0 MPa, indicating that there is no fracture.
Figure 12 shows the cloud diagram of overburden displacement change in Scheme 5 during the mining process. When the working face advances to 50 m behind the NLC, a 0.2 m-thick separation layer appears below KS1. When the working face advances to 150 m behind the NLC, the separation layer below KS2 and KS3 is approximately 0.1 m, and the separation layer below KS3 and KS4 is 0.8 m and 0.1 m, respectively. When the working face advances to 200 m behind the NLC, the separation layer below KS1 to KS4 tends to close.
Figure 13 shows the monitoring data curves of displacement and stress obtained from measuring points of each key stratum in NLC in Scheme 5.
As is shown in
Figure 13a, when the working face advances past NLC by 200 m, the subsidence of KS1 tends to be stable and reaches 4.35 m.
Figure 13b shows that when the working face advances ahead NLC 90 m, stress concentration is generated remarkably within the range of KS1 to KS3, and the peak stress reaches 18.19 MPa. When the working face continues to advance to right below NLC, obvious fractures appear in KS1 and KS2; the stress of this stratum is depressurized to 0 MPa sharply. When the working face advances past NLC by 50 m, KS3 and KS4 are fractured completely; the stress of the corresponding strata is depressurized to 0 MPa. As the working face advances past NLC 150 m, KS5 is fractured completely, and its stress drops down to 0 MPa. Meanwhile, stress relief occurs from KS6 to PKS, but the stress does not drop down to 0 MPa, indicating that there is no fracture.
Based on a comprehensive analysis of the simulation results of the above five models, the main indicators were analyzed, and the statistical data obtained are shown in
Table 3. Generally speaking, there is no separation in the overlying strata in the advance stage of working face. However, as the mining is conducted in the working face, the separation layer gradually appears in the corresponding overlying strata, and its evolution process consists of three stages roughly: initial generation, reaching peak, and tending to close (stable). In simulation schemes 1–3, when the working face advances past NCL by 100 m, the mining width is fixed at 300 m, and the mining height is 3 m, 4 m, and 5 m, respectively. The cumulative peak volume of separation layer is 0.7 m, 1.8 m, and 2.1 m, respectively, indicating that the development of separation layer is positively correlated with the mining height (
Figure 14a). In simulation schemes 4, 3, 5, when the working face advances past NCL by 100 m, the mining height is fixed at 5 m, and the mining width is 250 m, 300 m, and 350 m, respectively. The cumulative peak volume of separation layer is 2.8 m, 2.1 m, and 1.1 m, respectively, indicating that the development of separation layer is negatively correlated with the mining width (
Figure 14b).
The pre-bearing stress concentration will be formed in the mining process at the working face. When the mining width is fixed at 300 m, the increase of mining height from 3 m to 5 m can push the peak concentration coefficient up from 1.279 to 1.289, and the subsidence can go from 2.33 m to 4.34 m (as shown in
Figure 15a). When the mining height is fixed at 5 m, the increase of mining width from 250 m to 350 m can trigger the rise of peak concentration coefficient from 1.261 to 1.343, and the subsidence remains virtually unchanged (as shown in
Figure 15b). This indicates that the change of mining width affects stress greatly whereas the change of mining height is more influential to subsidence.
4. Numerical Simulation of Water-Flowing Fracture Zone in the Working Face
As can be seen from the simulation results of the above five schemes, the development of separation layer in the working face is basically lower than KS4. Accordingly, in order to analyze further the development of water-flowing fracture zone in the working face, all the rock formations above KS4 are ignored, and all the rock formations between the coal seam and KS4 are modeled with actual lithology based on the original model, and a uniform load of 11.2 MPa is loaded on KS4. The length and width of the model is 1600 m and 800 m, respectively, and the height is equal to that of KS4. In order to be consistent with the actual mining conditions of the working face, the mining height of the model is set to be 5 m, and the mining width is 300 m.
Zhao conducted a three-dimensional numerical simulation on the overburden failure in the working face and found that when the shear stress reaches its peak value and exceeds the maximum shear strength of the rock mass, fractures will be generated in the rock mass [
22]. With reference to this finding, this study attempted to use the shear displacement in the simulation process to visually represent the mining-induced fractures.
In order to simulate the development of the water-flowing fracture zone after mining and quantitatively grasp its development height, the joint shear displacement in 3DEC software was used to represent the fracture. After the excavation of the model, the element block is hidden by setting parameters, and only the joint shear displacement in the model is displayed, and the corresponding displacement cloud diagram is obtained (shown in
Figure 16).
Due to the influence of mining, the penetration height of joint shear displacement in each model is different under different excavation conditions. By comparing the joint shear displacement cloud diagrams under various conditions, the maximum penetration height of the joint shear displacement in the cloud diagram is measured. Then, with the thickness of coal seam and floor in the model subtracted, the development height of the water-flowing fracture zone can be obtained (Equation (1)). The measurements are conducted three times, and the calculation results are averaged. In this way, the height of the water-flowing fracture zone of the model can be roughly obtained.
where
denotes the height of water-flowing fracture zone, m;
refers to the measurement height of joint shear displacement under certain mining condition;
i represents some certain mining condition (the working face is excavated for
i m), and its value is 0, 50, 100, …, and its unit is m. ∆
h denotes the possible penetration fracture thickness between overlying strata with a height lager than
in the goaf area behind the working face, and its unit is m.
denotes the thickness of coal seam in the model, and its unit is m.
represents the thickness of coal seam floor, and its unit is m as well.
The simulation of water-flowing fracture zone under different advancing states of working face is shown in
Figure 17.
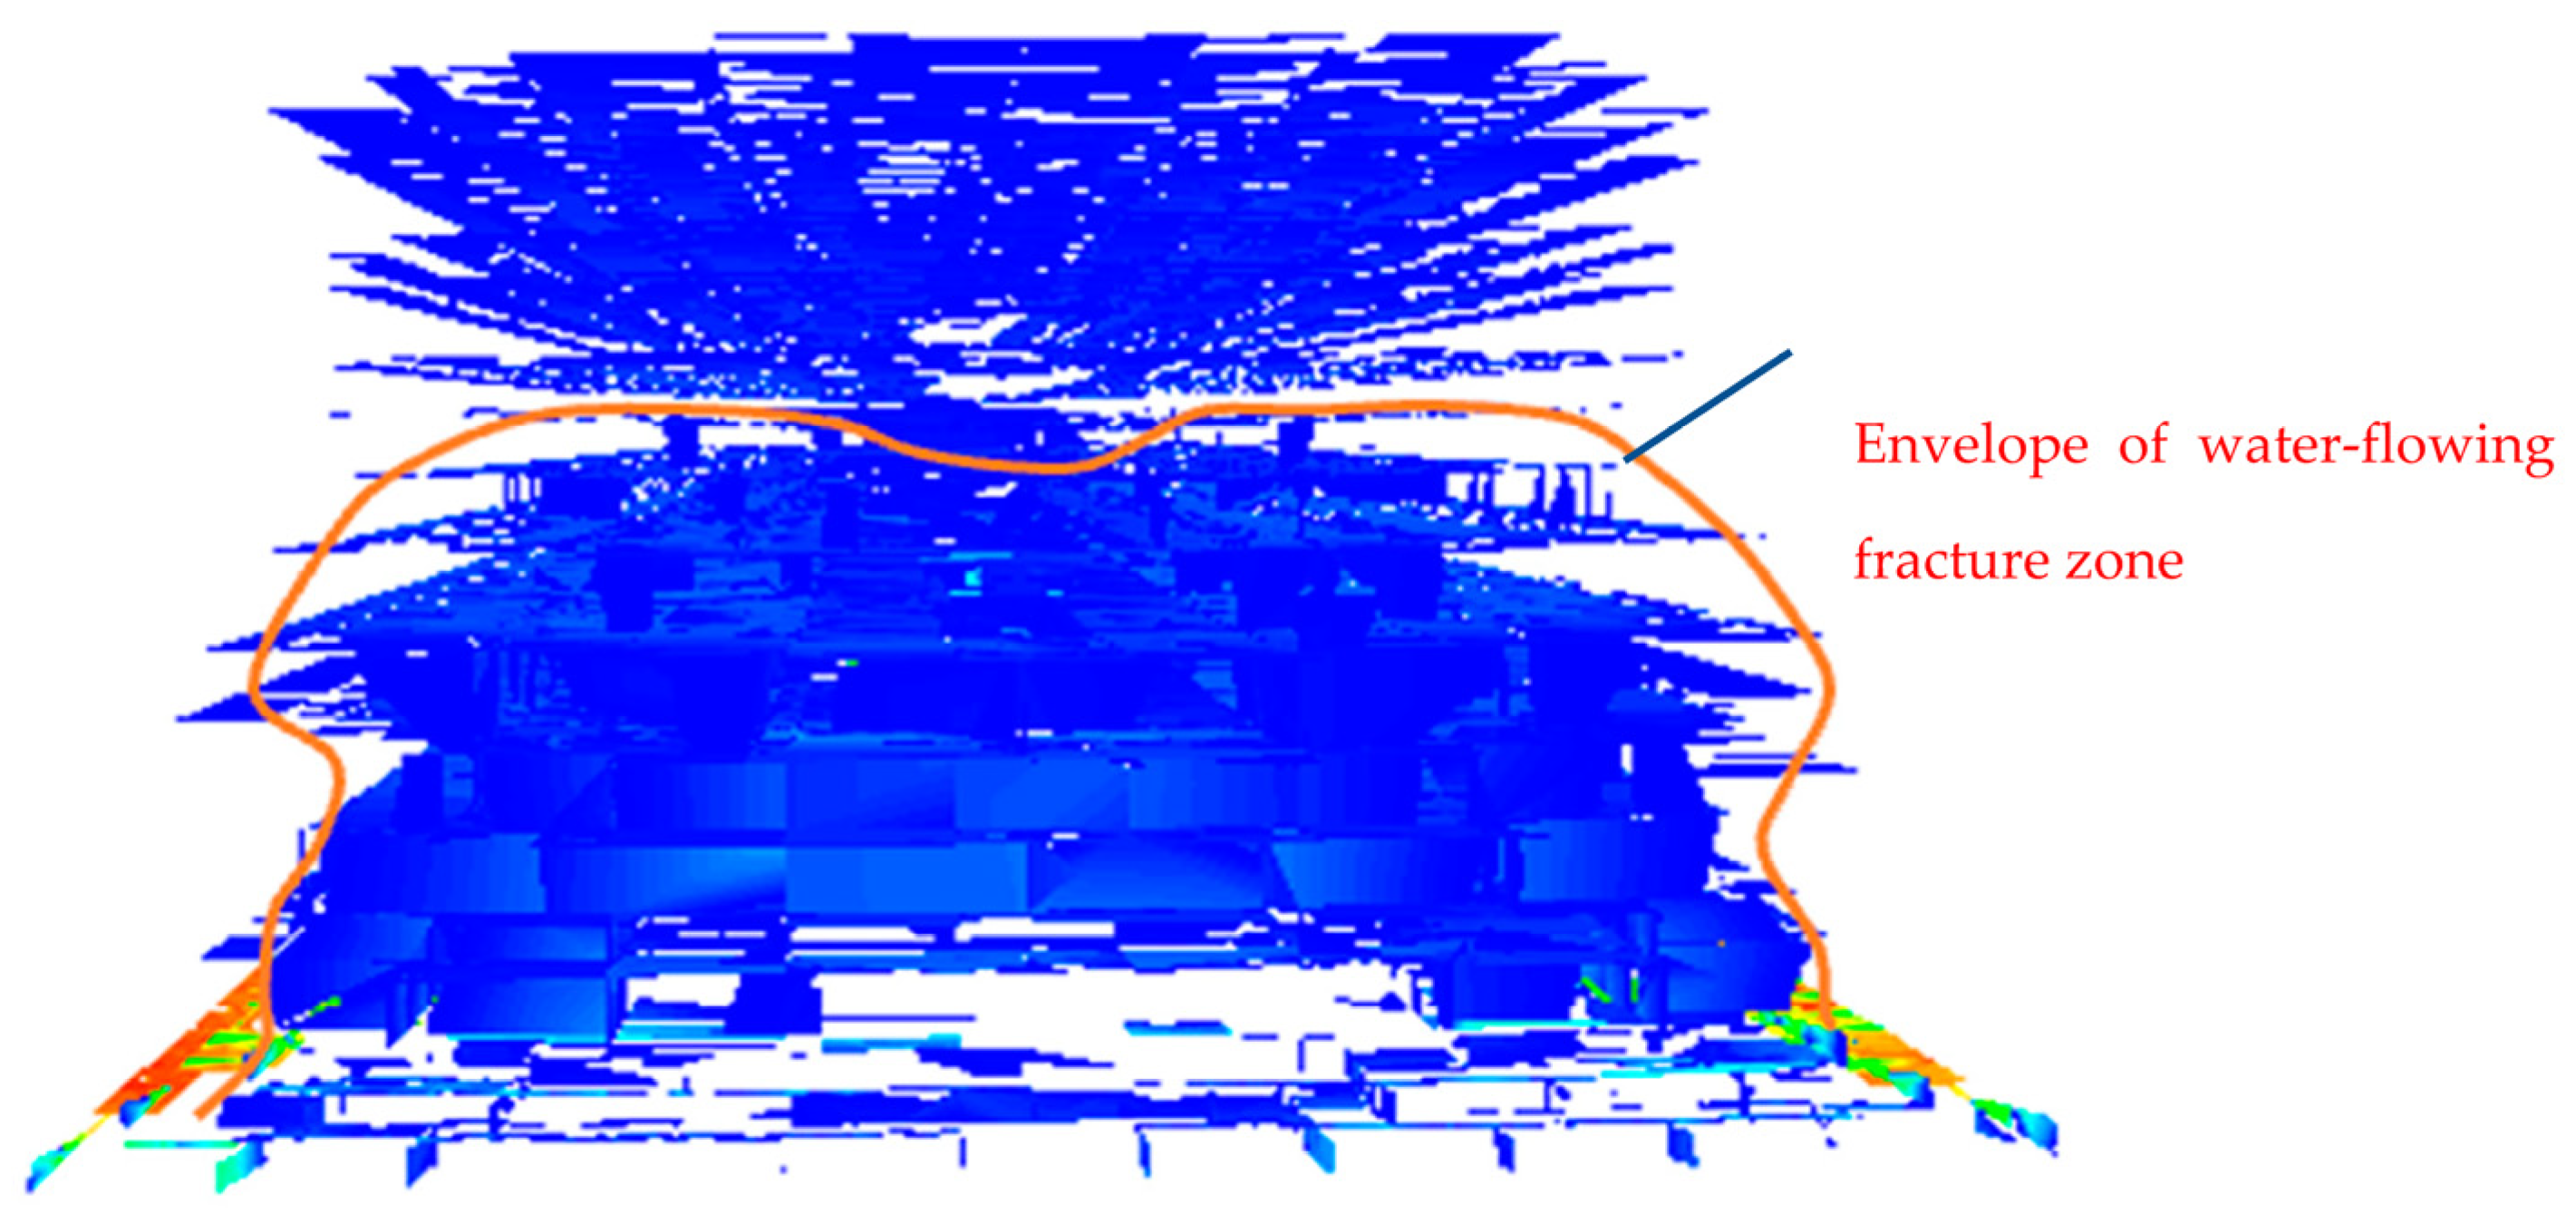
Through observation, it is found that when the model is excavated to 700 m, the sufficient conditions for mining in the working face are satisfied, and the water-flowing fracture development is clear and remarkable. The cloud diagram of the strike of the water-flowing fracture zone under this advancing distance is selected (
Figure 18), and the maximum height of the water-flowing fracture zone of the model is calculated in combination with Equation (1). The calculation results are as follows:
First calculation: the height of water-flowing fracture zone is approximately 119 m.
Second calculation: the height of water-flowing fracture zone is approximately 115 m.
Third calculation: the height of water-flowing fracture zone is approximately 118 m.
In summary, the average development height of the water-flowing fracture zone is 117.33 m.
According to the mining procedures of the working face, the height of the water-flowing fracture zone of the working face is expected to be 120 m with reference to the measured results of the adjacent working face. As can be seen from the results of numerical simulation, the height of the simulated water-flowing fracture zone is similar to the predicted height, which can provide a reference for the water prevention and control of the working face.


