Abstract
Oil-impregnated paper condenser transformer bushings are an important part of transformer equipment, and partial discharge (PD) occurred when defects exist on the condenser aluminum foil layers. Firstly, to study the PD process of the oil-paper insulated capacitance graded bushing with the defect of broken aluminum foil, a defective oil-paper bushing discharge sample is constructed to study the PD parameters and capacitance, and to discharge carbonization traces at different voltage levels. Then, in order to verify the process of condenser aluminum foil layer discharge and the space charge variation in the oil-paper insulation system of a sample model, the surface flashovers of a needle-plane discharge model based on the bipolar charge transport model and the hydrodynamic model was built. The simulation, by Transport of Diluted Species physics of COMSOL Multiphysics software, points out the discharge process of aluminum foil electrode caused by space charge action and electric field distortion under an electric field at different voltages. The results of simulation and sample bushing experiments showed that the PD process of the defective condenser foil layer is mainly divided into three stages: tip corona discharge, streamer in oil, and surface flashovers. The voltage amplitude is larger the more electrical branches are discharged and the shorter the discharge time is. The findings of the article have important implications for the discharge of the foil layer inside the oil-paper bushing.
1. Introduction
The transformer bushing is an important part of transformer equipment, and the most commonly used nowadays are mainly oil-impregnated bushings. According to CIGRE report, more than 14% of DC system failures are caused by faults in the converter transformer and its bushings, and 56% of bushing failures are accompanied with fire, which is a serious threat to the safe and stable operation of power system []. In the AC bushing fault type statistics collected by State Grid Corporation of China from 2013 to 2018, bushing PD is in the top three in all equipment failures [].
Furthermore, a structural defect is one of the most significant factors impeding the safe operation of bushings. During manufacturing process, immature local production processes and overvoltage accumulation may lead to structural defects []. Most of the PD test failures that occur in quality testing before sale by manufacturers are presumed to be due to small breaks and folds caused during the aluminum foil rolling process. The distortions of the electric field distribution are at these small breaks and folds, which leads to the abnormal space charge distribution and continuous PD. It is speculated that the cause of excessive PD is the small breaks and folds caused by the aluminum foil rolling process.
PD is considered to be one of the most important reasons for insulation damage in electrical equipment, and PD occurs in weak insulation where the electric field is too concentrated. The distortions of the electric field distribution are at these small breaks and folds, which leads to abnormal space charge distribution and continuous PD. The electric field distortions of the bushing [] are aggravated, causing the insulation to age and even fail. Long-time PD will continue to decompose the transformer oil to produce a large amount of acetylene gas, and then an explosion will occur.
Currently, many research teams focus on deterioration of the oil-paper insulation layers and the finite element method of bushings. Liao Ruijin et al. [] showed that the dielectric loss and capacitance increase significantly when the bushing condenser is exposed to moisture. Han Gui and Wang Wenduan [] studied the effect of moisture on incipient discharge voltage along the oil–paper intersection. Gao Wensheng et al. [] investigated the effect of the air gap size in solids on the PD process. Peng Zongren et al. [] used the finite elements method (FEM) to calculate bushing degradation and optimize the design. Moradnouri et al. used FEM to optimize the insulation design of the end part of the transformer bushing []. Suman Yadav et al. designed and analyzed the bushing electrothermal performance by FEM []. Milad Akbari et al. proposed a new thermal model to estimate the hotspot temperature of the OIP bushing by FEM [].
For the PD characteristics of an oil-impregnated pressboard system, the internal PD signal of a bushing insulation system can be detected by the pulse current method and the UHF method []. In addition, its space charge distribution can be measured using the electroacoustic pulse method [], etc. However, the charge transfer characteristics and the discharge mechanism of the oil-paper insulation system cannot be tested with the current experimental methods. Therefore, an equivalent simulation model can be developed to better research the charge distribution and discharge characteristics of bushing foil layers. G.E. Georgiouh [] and Davies [] proposed the use of a hydrodynamic model with Poisson’s equation to represent the effect of space charge in the electric field. Markus [] referred this method into liquid PD and built a simulation of the streamer inside the liquid. Subsequently, Jadidian [] et al. used the finite element method in Markus’s simulation and researched the space charge of needle-plane discharges with different parameters.
However, the PD process and mechanism of defects of transformer bushing is not known. Therefore, building a defect simulation model, and studying the discharge modes, space charge distribution, and PD process of a bushing condenser foil layer are important. In order to study the PD and charge distribution of condenser foil layer defects more comprehensively, this paper explores PD process by phase, PD quantity, and the phenomenon of carbonization traces. In addition, based on the hydrodynamic model and the bipolar charge transport model, we validate the charge distribution process.
2. Materials and Methods
2.1. Measurement Platform
In this paper, a set of 220 kV test apparatus were energized to test a sample bushing, which mainly consisted of a 220 kV 50 Hz AC test transformer, a bushing sample model, a PD detection device with sensitivity of 0.02 pC, a high precision dielectric loss detection device, and a temperature sensor, as shown in Figure 1. According to the instructions of the PD detector, the permissible PD of eligible oil-impregnated paper bushing at 1.05 Un (Un is the rated voltage value) is 10 pC. The laboratory noise is 1.6–1.7 pC, and the test bushing conforms to the test results.
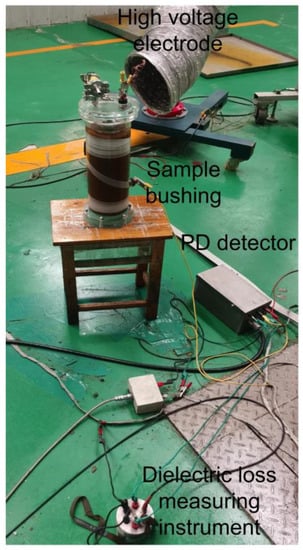
Figure 1.
The test circuit of partial discharge (PD), dielectric loss, and capacitance.
2.2. Defect Sample Bushing
This paper produced a normal oil-impregnated paper bushing sample and two foil layer defective bushing samples with rated voltage of 40.5 kV and 50 Hz. According to the bushing manufacturer reports, the obvious discharge carbonization traces or discharge points cannot be found when most of the bushing failed the PD test, but they found breaks and folds at the edges of some aluminum foil layers, as shown in Figure 2.
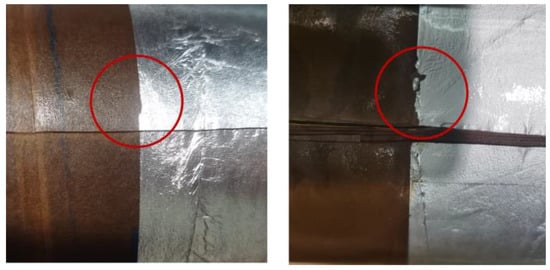
Figure 2.
Bushing foil layer breakage defects.
In order to amplify the PD signal, we set 6 uniform jagged fractures with 30 mm height and 20 mm bottom at the edge of the outermost screen to simulate a bushing foil layer defect, as shown in Figure 3a. The condenser core is composed of a conducting rod and 4 aluminum foil layers structure, which are 90 mm, 135 mm, 180 mm, and 225 mm in length, respectively, between oil-impregnated papers, as shown in Figure 3b.
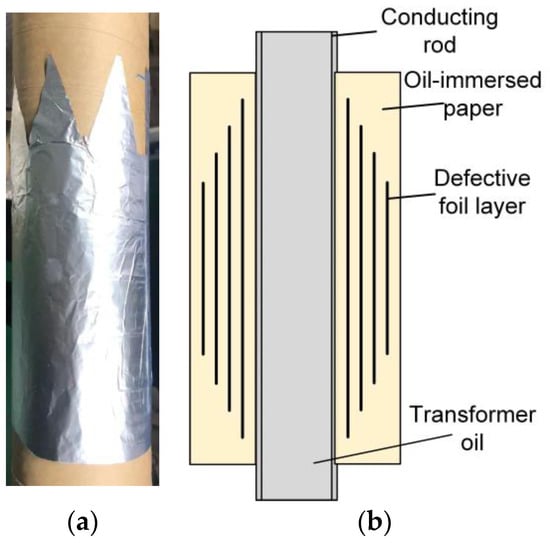
Figure 3.
Schematic diagram of the sample oil-paper test bushing and condenser core. (a) Defective foil end layer of sample bushing; (b) Schematic diagram of condenser core.
The defect sample was dried and vacuum dipped in oil in full accordance with the IEC 60641 [] standards for oil-impregnated paper insulating bushings. The test insulating paper is 0.13 mm thick kraft paper produced by DEOFT, rolled in strips and dried at 110 °C for 24 h to remove moisture, then placed in a 5# Klamath transformer oil immersion at 80 °C and 50 pa for 96 h to ensure that no more cavities are generated and each layer of insulating paper is impregnated perfectly.
2.3. Experimental Methods
A 50 Hz excitation voltage of varying amplitude was applied to the top conductive rod of sample bushing to obtain the PD response and capacitance signal at the end screen lead. According to the rate voltage of the sample bushing and the output capacity of the experiment device, the AC excitation voltage was applied to the bushing in steps of 10 kV and gradually ramped up to 30 kV, 40 kV, 50 kV, and 60 kV with measurements recorded when the parameters were stable. The interval between each test is 15 min, and the flange was always earthed during the test. Due to the significant influence of temperature on the frequency domain dielectric response of the bushing [], the lab was kept at a constant temperature during the test, and the temperature of the outermost oil-impregnated paper of the bushing was kept constant at 15 °C using a temperature measuring probe.
3. Experimental Results
3.1. PD Experimental Results
According to the IEC 60270 [] standard, the PD is recorded when PD quantity exceeds the ambient discharge. The incipient discharge voltage was 30 kV. With increasing applied voltage, the PD quantity increases, as shown in Figure 4.
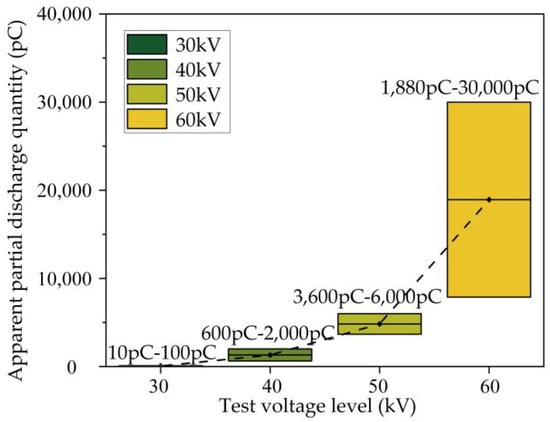
Figure 4.
PD quantity of capacitor screen process defect with equal gradient voltage.
The φ-q when the voltage was gradually increased from 30 kV to 60 kV is shown in Figure 5. At 30 kV, the discharge quantity was between 10 pC and 100 pC. The waveform diagram shows that the discharge signal phase is concentrated between 60° to 90° and 240° to 330°, which is a typical tip corona discharge.
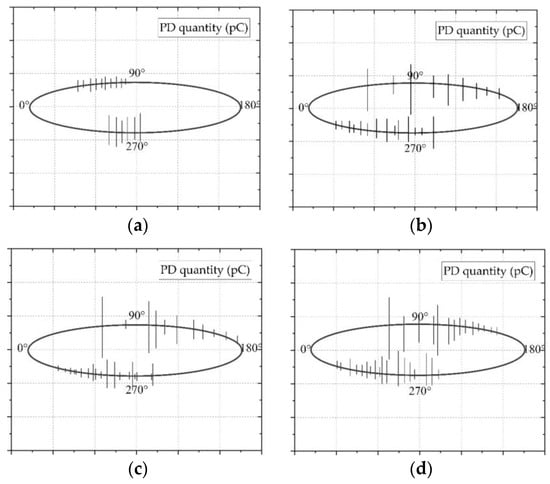
Figure 5.
Phase diagram of sample bushing with foil layer defects at different voltages. (a) φ-q diagram of 30 kV discharge; (b) φ-q diagram of 40 kV discharge; (c) φ-q diagram of 50 kV discharge; (d) φ-q diagram of 60 kV discharge.
According to Figure 6, with the higher voltage, the higher PD occurred and was more concentrated between 90° to 150° and 240° to 330°. The higher discharge quantity was between 60° and 150°, which is a typical characteristic of tip discharge and surface discharge according to the paper [] results. At 40 kV, the discharge reaches 1000–2000 pC and a current sound starts around the bushing. As the voltage rises to 50 kV, it reached to 3600–6000 pC. At 60 kV the discharge starts at 1880–2100 pC. After 15 min of maintenance discharge, it became 20,000–30,000 pC, and then, after 15 min, the discharge went back to 18,000–21,000 pC. It was assumed that the PD increased during the gradual deterioration of the insulated paper and then decreased after the gradual formation of discharge carbonization channels on the insulation paper. Through the voltage–phase diagram, it can be seen that part of the PD signal was also concentrated between 0° and 90°, which is characteristic of air bubble discharge between the metal electrodes. The local overheating of the insulated paper and the high electric field strength are presumed to result in the moisture and gas in the insulating paper forming bubbles and clinging to the surface of the insulating paper, and the PD intensified the oxidation and decomposition of the insulating paper to produce other substances which adhered to the surface of the insulating paper [].
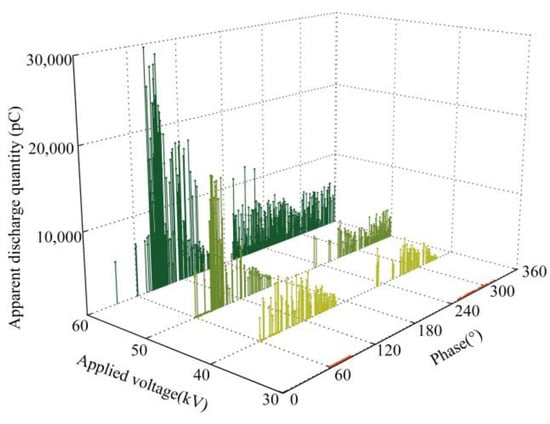
Figure 6.
φ-q-C diagram for sample bushing with foil layer defect.
As shown in Figure 7, the electric capacity was reduced by about 1.5 pF after high partial discharge, indicating partial insulation failure in the insulated paper due to insulation deterioration or even partial breakdown of the insulation paper.
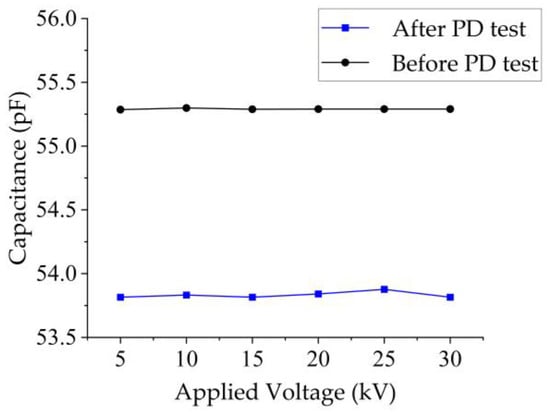
Figure 7.
Change in capacitance after high PD.
3.2. Surface Flashovers Conducting Traces
After high PD at 50 kV and 60 kV, it was found that an obvious discharge carbonization channel on the insulated paper was lower than the foil layer containing the tip defect. At 50 kV, its streamer branches are less numerous, and the carbonization channel is shown in Figure 8a. At 60 kV, with discharges above 20,000 pC in Figure 8b, its discharge carbonization branches are more obvious, consisting of some electrical tree branches, and the main discharge channel is clearer than those at 50 kV.
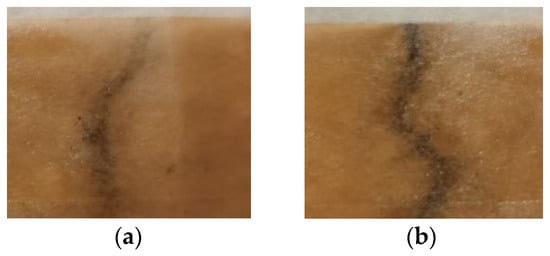
Figure 8.
Carbonization channel on the paper after 30 min high PD. (a) Surface partial discharge carbonization channel at a voltage of 50 kV with a partial discharge of 4000–5000 pC. (b) Surface partial discharge carbonization channel at a voltage of 60 kV with a partial discharge of 1880–30,000 pC.
As a result, the PD channels are longer and contain more branches with higher voltages. There is a clear link between the shape of the streamer and the voltage level [].
4. Simulation Models
Based on the condenser defect schematic diagram in Figure 2, the breaks and folded defective edge of the bushing foil layer had a tip, and the PD occurred along the surface, which can be simplified as a needle-plane surface discharge model in Figure 9. The electron avalanche occurred from the positive foil layer regardless of the applied voltage polarity, and the streamer occurred along the dielectric material. The equivalent model and setup are briefly introduced below. We used Transport of Diluted Species physics of COMSOL Multiphysics 5.6 to simulate the discharge process.
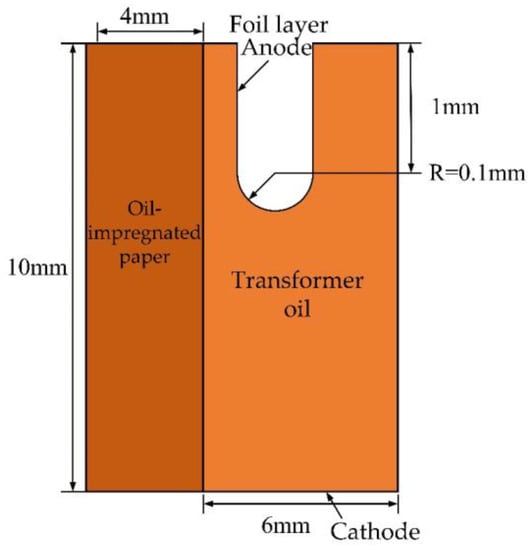
Figure 9.
Diagram of the bushing condenser with foil layer defect simulation model.
ρs is the interfacial charge density, μ is the charge mobility in the transformer oil, and εp is the oil-impregnated paper conductivity.
4.1. Three-Carrier Current Continuum Equation Model
This paper uses a three-carrier current continuum equation model to simulate the charge transport processes in transformer oil by considering the generation, recombination, and dissipation of electrons (e), positive ions (p), and negative ions (n).
where ε, kT, cv and ρ are the permittivity (ε0), thermal conductivity, specific heat, and density of the oil, respectively. Since in the oil gap surface discharge occurs generally between 2 and 3 us, the speed of oil can be negligible; q is the electronic charge quantity and E is the field strength; ρp, ρn, ρe are the charge density of positive ions, negative ions, and electrons, respectively; μp, μn, μe are the mobilities of positive ions, negative ions, and electrons, respectively; Rpn, Rpe are the coefficients of positive ions–negative ions and positive ions–electrons, respectively; τa is the electron attachment time constant.
Equation (5) is Poisson’s equation, which represents the effect of space charge on the electric field.
Equations (2)–(4) are the three-carrier current continuum equations, which satisfy Langevin’s law [], where a is the quotient of the electron decay length and the electron velocity, which is the attachment time constant, and where the electron decay length λA is 1 mm in Equation (7).
On the right side of the Equations (2)–(4) for the theory of ionization in liquids, there are three different mechanisms []: field ionization, impact ionization, and photoionization.
One of the common ionization mechanisms is field ionization. The molecules are in a liquid under a high electric field, whose ionization charge density production rate is denoted by GF. Field ionization has two main components: Onsager’s theory of the formation of free positive and negative ions by neutral molecule pairs in a dielectric liquid with an applied high electric field [], denoted as GFD; and the formation of positive ions and free electrons by neutral molecules in an electrolytic ion, denoted as GFP. The field ionization density production rate is summarized using the Zener model [].
According to the Townsend theory of impact ionization [], the collision of free electrons with neutral molecules at high field strengths is accelerated and results in a surge of electron energy in the neutral molecule, producing another group of positive ions and free electrons, which is also an ionization mechanism. The collisional electron charge density generation rate is expressed by GT
According to the discharge streamer form and the luminous intensity [], the discharge in the transformer oil has photoionization, but the transformer oil is a non-homogeneous mixture. The absorption coefficient and the absorption length parameters are unknown [], so this will be ignored.
4.2. Bipolar Charge Transport Model for Insulating Paper
The insulation structure of the oil-paper interface of the bushing is distributed according to the paper–oil–foil layer structure, with traps uniformly distributed in the paper. Free electrons reaching the solid insulating paper after discharge in the foil layer oil will be captured by the traps in the medium and will also break away from the traps. Free electrons (eμ), trapped electrons (et), free holes (hμ), and trapped holes (ht) are the four carriers in the solid insulating paper composite, and the migrating charge transfer is as follows.
where peμ, phμ, pet, pht are the charge densities of free electrons, trapped electrons, free holes, and trapped holes, respectively; S0, S1, S2, S3 are different complex coefficients, respectively; Be, Bh are free electron and free hole entry coefficients, respectively; De, Dh are trapped electron and trapped hole exit coefficients, respectively.
Free electrons and holes are injected from the oil into the solid insulating paper. The injection current density is related to the temperature of the insulating paper and the electric field strength, which can be described by Schottky thermal ion emission [].
The specific parameters in the formulas are shown in Table 1.

Table 1.
Parameters of the hydrodynamic model and bipolar charge transport model.
5. Simulation Results
In order to investigate the influence of voltage on the discharge process and space charge distribution during the PD of a broken aluminum foil layer defect, the step-up method is used to gradually increase the tip voltage based on the test sequence of 30 kv, 40 kv, 50 kv, and 60 kv. The effect of voltage and space charge density on the discharge process and the discharge in an oil-paper system is also studied.
5.1. Effect of Applied Voltage on PD
The electric field is extremely inhomogeneous at the electrode tip, as shown in Figure 10. The PD pattern of the electrode of the foil layer with time at different voltages obtained from the simulation, where the charge distribution and the maximum and minimum values of the charge density at different moments, is shown in Figure 11.
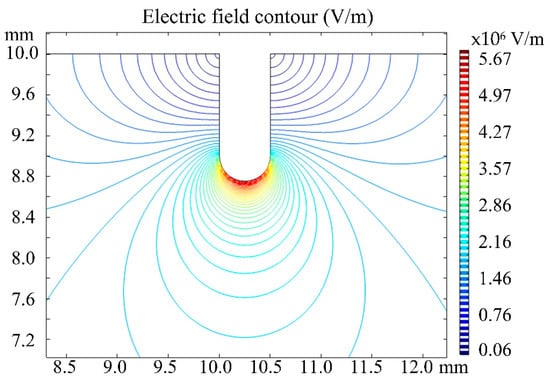
Figure 10.
Voltage contour with unit in V/m distribution at the tip.
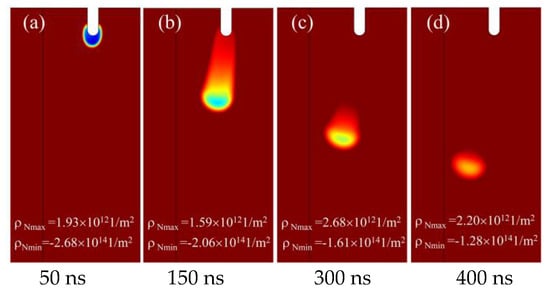
Figure 11.
Discharge process at 30 kV.
Electrostatic attraction is the main mechanism that causes streamers to grow towards the dielectric, and some experiments demonstrated this phenomenon [,]. In Figure 11, the discharge starts as a corona discharge at the tip of the broken foil layer, with the charge concentrated at the high voltage end; as the discharge time increases, the discharge progresses outwards, but does not reach the insulating paper surface and ends. This situation is significantly improved at 40 kV (As shown in Figure 12), where the discharge time is reduced from 400 ns to 325 ns. From Figure 13 and Figure 14, the discharge develops to the oil–paper interface at about 150 ns at 50 kV, and, at 60 kV, the time for the discharge to reach the paper surface of the junction is reduced to about 100 ns, followed by flashover discharge along the surface, as shown in Figure 15, where the total discharge time is reduced to 175 ns.
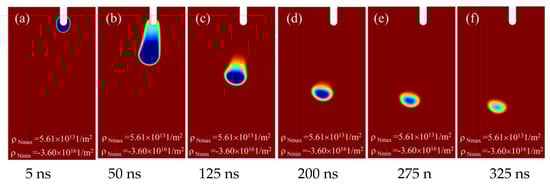
Figure 12.
Discharge process at 40 kV.
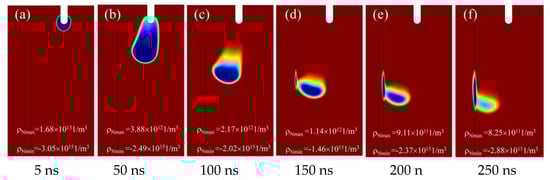
Figure 13.
Discharge process at 50 kV.
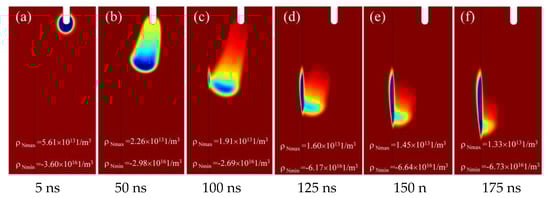
Figure 14.
Discharge process at 60 kV.
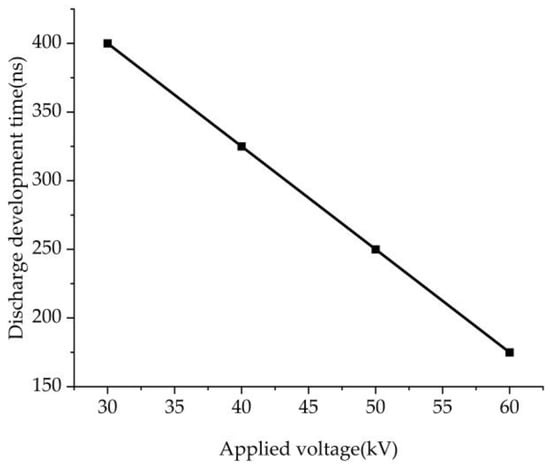
Figure 15.
Development time of discharge at different voltages.
As shown in Figure 11, Figure 12, Figure 13 and Figure 14, with increasing voltage from 30 kV to 60 kV, the PD time decreased from 400 ns to 150 ns.
Based on the simulation diagram of discharge development in Figure 11 and the theory of in-liquid discharge, it is presumed that the partial discharge process at the broken tip of the bushing aluminum foil layer is summarized in three stages: the tip corona discharge stage, the discharge in oil stage, and the discharge along the surface stage [].
The stage 1 tip corona discharge stage, as shown in Figure 11, is at 5 ns when the charge density near the tip is highest; Stage 2 flow injection discharge in the oil stage from the tip corona discharge develops and forms a flow injection that begins the process of discharging outwards in the oil; and Stage 3 discharge along the surface stage flow injection occurs along the oil–paper interface in a flash discharge.
As a result, the higher the voltage level at the tip of the aluminum foil, the faster the bushing foil layer discharges and the more dramatic the morphological changes. At high voltage electrode voltages of 30 kV to 40 kV, only the first and second stages of PD exist; above 50 kV, the third stage of discharge begins to appear.
As shown in Figure 15, with increasing voltage from 30 kV to 60 kV, the PD time decreased from 400 ns to 150 ns.
Based on the simulation diagram of discharge development in Figure 11, Figure 12, Figure 13 and Figure 14 and the theory of in-liquid discharge, it is presumed that the partial discharge process at the broken tip of the bushing aluminum foil layer is summarized in three stages: the tip corona discharge stage, the discharge in oil stage, and the discharge along the surface stage [].
The stage 1 tip corona discharge stage, as shown in Figure 11, Figure 12, Figure 13 and Figure 14, is at 5 ns when the charge density near the tip is highest; Stage 2 flow injection discharge in the oil stage from the tip corona discharge develops and forms a flow injection that begins the process of discharging outwards in the oil; and Stage 3 discharge along the surface stage flow injection occurs along the oil–paper interface in a flash discharge.
As a result, the higher the voltage level at the tip of the aluminum foil, the faster the bushing foil layer discharges and the more dramatic the morphological changes. At high voltage electrode voltages of 30 kV to 40 kV, only the first and second stages of PD exist; above 50 kV, the third stage of discharge begins to appear.
5.2. Space Charge Density Distribution
Figure 16 results show that the steamer did not reach the oil–paper interface; the insulating paper surface free charge was almost zero. At this time, the charge density of the flow injection head is the largest. The flow injection development was close to the insulating paper process, by the needle tip electrode y component, and the electric field strength decreases. As shown in Figure 16, the flow injection speed becomes slower and the charge density decreases. When the streamer touches the oil–paper interface, the large amount of charge at the head of the flow injection is absorbed when it touches the interface; the charge density at the interface begins to increase, and the electric field strength gradually increases along the face.
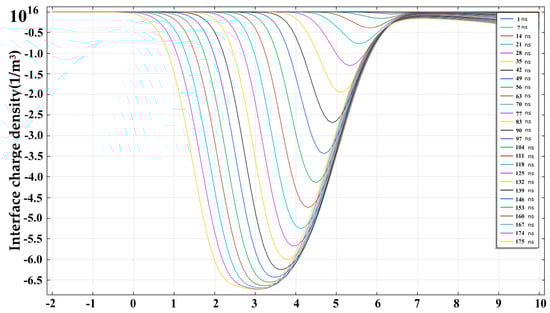
Figure 16.
Oil–paper interface charge density distribution with 60 kV.
6. Analysis and Discussion
The bushing in the AC electric field makes the condenser foil layer electrostatic [], and the role of the electric field at the edge of the foil layer becomes large, especially in the location of the defects, which produces an electric field distortion, thus producing charge migration in the oil and the formation of flow injection discharge. The needle tip defective foil layer is based on the needle plate model for an extremely inhomogeneous electric field, and, at the needle tip part of the high voltage positive pole, the electric field is very large. Collision ionization will occur first in the vicinity of the needle tip, and collision formation of positive ion density increases to form a streamer and negative ions at the tip of the compound. This was also confirmed in the PD test.
Moreover, in the PD experimental results, the inception voltage is 30 kV, which is similar to the PD process simulation. When the applied voltage is the same as the inception voltages of the PD, the simulation shows that corona discharge occurs at the tip of the broken foil layer. When the applied voltage is 40 kV, the corona discharge grows. Therefore, the experimental results are related with the simulation results.
Through experimental verification in needle-plane surface discharge simulation, it can be assumed that the process of PD of the foil layer needle electrode is as follows:
- (1)
- At the first stage of PD, corona discharge at the tip of the foil layer can be observed, as shown in Figure 11, the discharge simulation diagram. At this time, the electric field strength near the tip of the foil layer is the largest, which releases free electrons, and molecular ionization in the transformer oil begins to occur at the tip, resulting in a large number of ions and free electrons, which are accelerated to have collisions with other molecules caused by ionization. However, the collision energy did not reach the electron avalanche. The discharge process has acousto-optical properties [], and, therefore, a sizzling sound begins to appear.
- (2)
- At the second stage of PD, the collisional ionization at the tip of the foil layer acquires sufficient energy to move and develop continuously under the action of the polarization swimming dynamics. According to the voltage–phase diagram and the partial discharge traces, due to the local high temperature and high field strength, the moisture and gas within the insulating oil-paper forms bubbles and adheres to the oil–paper interface. The generation of the PD of the foil layer defects intensifies the aging and oxidative decomposition of the insulating paper, and the gas in its products also adheres to the interface and forms small bridges, leading to the streamer moving towards the paper surface and the breakdown along the surface [].
- (3)
- At the third stage of PD, the streamer transforms into surface discharge while affecting the space charge distribution within the paper. According to the “bridge theory”, the result is a breakdown discharge phenomenon on the paper surface. High temperature and high field strength from the discharge lead to paper insulation failure, resulting in carbonization traces.
7. Conclusions
In this paper, the PD characteristics of a bushing aluminum defective foil layer electrode are studied. A PD simulation model is built to figure out the electric field and charge density of the surface discharge process, and the PD experiment is carried out on the same defective test bushing to mutually verify the needle-plane surface PD development process and discharge pattern. The main conclusions obtained in this paper are as follows:
- (1)
- By using the diffusive drift charge transfer model and the bipolar charge transfer model, the simulation obtains the PD process occurring at the tip formed at the edge of the bushing foil layer, which has three main PD stages: the formation of a corona at the tip at the beginning of the discharge, the discharge streamer under the ionization effect at high electric field at the middle of the discharge, and the surface discharge at the end. The validity of the simulation can be verified by combining the sample bushing experiment with the discharge form and carbonization traces.
- (2)
- Through the streamer carbonization traces and the discharge simulation process, it can be inferred that the voltage level is related to the discharge morphology, speed, and the length of the discharge. At lower voltage levels, only one or two stages of PD are experienced, while, at higher voltage levels, three stages of discharge are experienced along the surface, and the larger the voltage amplitude, the more branches of the electric tree and the shorter the PD time.
- (3)
- According to the PD experiment, when maintaining high surface PD quantity, the oil-paper precipitates air bubbles, which makes the discharge continuously increase. The paper’s insulation deteriorates, and forms a carbonization channel, and the PD quantity decreases again.
Author Contributions
Conceptualization, writing—review and editing, F.Y.; methodology, writing—original draft, software, Y.Z.; resources, supervision, X.W.; resources, validation, J.W. All authors have read and agreed to the published version of the manuscript.
Funding
This research received external funding from the National Key R&D Program of China, grant number 2021YFB2401700 and the Science and Technology Project from the Headquarters of SGCC, grant number 5500-202220136A-1-1-ZN.
Institutional Review Board Statement
Not applicable.
Informed Consent Statement
Not applicable.
Data Availability Statement
No new data were created or analyzed in this study. Data sharing is not applicable to this article.
Acknowledgments
We thank the National Key R&D Program of China (Grant No. 2021YFB2401700) and the Technology Project from the Headquarters of SGCC (Grant No. 5500-202220136A-1-1-ZN) for supporting this research.
Conflicts of Interest
The authors declare no conflict of interest.
References
- Cigre, W.G. Transformer Bushing Reliability; CIGRE: Paris, France, 2019; pp. 1–111. [Google Scholar]
- Equipment Management Department of State Grid Corporation of China. Typical Fault and Defect Cases of Trans-Former Equipment: 2011–2018; China Electric Power Press: Beijing, China, 2019; Volume 321. [Google Scholar]
- Jian, Z.; Hao, J.; Liu, Q.; Liao, R.; Shang, Y.; Liu, Q. Study on the Partial Discharge Difference Character-istics between Semiconductor Paper and Aluminum Foil on Capacitor Structure of Oil-Paper Insulation Bushing. High Volt. Eng. 2022, 48, 4113–4123. [Google Scholar] [CrossRef]
- Li, C.; Yi, Z.; Yan, H. Influence of Insulation Paper Characteristics and Polarity Reversal on Space Charge Ef-fect of Oil-paper Insulation. Proc. CSEE 2020, 40, 4708–4718. [Google Scholar] [CrossRef]
- Liao, R.; Du, Y.; Yang, L.; Gao, J. Quantitative Diagnosis of Moisture Content in Oil-paper Condenser Bush-ing Insulation Based on Frequency Domain Spectroscopy and Polarization and Depolarization Current. IET Gener. Transm. Distrib. 2017, 1, 1751–8695. [Google Scholar] [CrossRef]
- Wang, W.; He, D. Effect of moisture on surface dis-charge in oil. Transformer 1987, 7, 12–17. [Google Scholar] [CrossRef]
- Pan, H.; Yin, Q.; Gao, W. Influence of void dimensions on partial discharge in solid insulation. High Volt. Technol. 2008, 34, 458–461. [Google Scholar] [CrossRef]
- Zhang, S.; Peng, Z.; Liu, P.; Hu, W.; Wang, H.R. Electro-thermal Coupling Model for Computation of Radial Temperature and Electric Field of Resin Impregnated Paper High Voltage Direct Current Bushing. Proc. CSEE 2013, 33, 191–200. [Google Scholar] [CrossRef]
- Moradnouri, A.; Vakilian, M.; Hekmati, A.; Fardmanesh, M. The end part of cryogenic H. V. bushing insulation design in a 230/20 kV HTS transformer. Cryogenics 2020, 108, 103090. [Google Scholar] [CrossRef]
- Yadav, S.; Chamorro, H.R.; Flores, W.C.; Mehta, R.K. Investigation of Improved Thermal Dissipation of ±800 kV Converter Transformer Bushing Employing Nano-Hexagonal Boron Nitride Paper Using FEM. IEEE Access 2021, 9, 149196–149217. [Google Scholar] [CrossRef]
- Akbari, M.; Mostafaei, M.; Rezaei-Zare, A. Estimation of Hot-Spot Heating in OIP Transformer Bushings Due to Geomagnetically Induced Current. IEEE Trans. Power Deliv. 2023, 38, 1277–1285. [Google Scholar] [CrossRef]
- Li, J.; Han, X.; Liu, Z.; Li, Y. Review on Partial Discharge Measurement Technology of Electrical Equip-ment. High Volt. Eng. 2015, 41, 2583–2601. [Google Scholar] [CrossRef]
- Ning, X.; Peng, Z.; Liu, P.; Zhang, H.L.; Feng, H.; Jia, Z.J.; Cao, Y.X.; Zhu, K. An Improved Pulsed Electro-acoustic Setup For Space Charge Measurement at High Temperatures. Proc. CSEE 2017, 37, 1835–1843. [Google Scholar] [CrossRef]
- Georghiou, G.E.; Morrow, R.; Metaxas, A.C. A two-dimensional, finite-element, flux-corrected transport algorithm for the solution of gas discharge problems. J. Phys. D Appl. Phys. 2000, 33, 2453–2466. [Google Scholar] [CrossRef]
- Davies, A.J.; Evans, C.J.; Llewellyn, J.F. Electrical breakdown of gases: The spatio-temporal growth of ionization in fields distorted by space charge. Process. R. Soc. London. Ser. A Math. Phys. Sci. 1964, 281, 164–183. [Google Scholar] [CrossRef]
- Hwang, J.G.; Zahn, M.; Pettersson, L.A.A.; Hjort-stam, O.; Liu, R. Modeling Streamers in Transformer Oil: The Transitional Fast 3rd Mode Streamer. In Proceedings of the 9th International Conference on Properties and Applications of Dielectric Materials, Harbin, China, 19–23 July 2009; pp. 573–578. [Google Scholar] [CrossRef]
- Jadidian, J. Charge Transport and Breakdown Physics in Liquid/Solid Insulation Systems; Massachusetts Institute of Technology: Cambridge, MA, USA, 2013. [Google Scholar]
- IEC. IEC 60641-1 Specification for Pressboard and Presspaper for Electrical Purposes-Part 1: Definitions and General Requirements; IEC: Geneva, Switzerland, 2007. [Google Scholar]
- Wang, H.; Li, C.; He, H.; Li, G.; Yue, H.; Xue, Y.; Tang, Z. Influence of Temperature on Developing Processes of Surface Discharges in Oil-paper Insulation. High Volt. Eng. 2010, 36, 884–890. [Google Scholar] [CrossRef]
- IEC. IEC-60270 High-Voltage Test Techniques: Partial Discharge Measurements; IEC: Geneva, Switzerland, 2015. [Google Scholar]
- Li, J.; Jiang, T.; He, Z.; Cheng, C. Statistical distributions of partial discharges in oil-paper insulation under AC-DC combined voltages. High Volt. Eng. 2012, 38, 1856–1862. [Google Scholar] [CrossRef]
- Du, B.; Zhu, W.; Li, J.; Jiang, J. Research Status of Oil-Paper Insulation for Valve Side Bushing of Converter Transformer. Trans. China Electro-Tech. Soc. 2019, 34, 1300–1309. [Google Scholar]
- Lesaint, O.; Massala, G. Positive streamer propagation in large oil gaps: Experimental characterization of propagation modes. IEEE Trans. Dielectr. Electr. Insul. 2002, 5, 360–370. [Google Scholar] [CrossRef]
- Onsager, L. Deviations from ohm’s law in weak electrolytes. J. Chem. Phys. 1934, 2, 599–615. [Google Scholar] [CrossRef]
- Hwang, J.G.; Zahn, M.; Pettersson, L.A.A. Mechanisms be-hind positive streamers and their distinct propagation modes in transformer oil. IEEE Trans. Dielectr. Electr. Insul. 2012, 19, 162–174. [Google Scholar] [CrossRef]
- O’Sullivan, F.; Hwang, J.G.; Zahn, M.; Hjortstam, O.; Pettersson, L.; Liu, R.; Biller, P. A model for the initiation and propagation of positive streamers in transformer oil. In Proceedings of the Conference Record of the 2008 IEEE International Symposium on Electrical Insulation, Vancouver, Columbia, 9–12 June 2008; pp. 210–214. [Google Scholar] [CrossRef]
- Hwang, J. Elucidating the Mechanisms behind Pre-Breakdown Phenomena in Transformer Oil Systems; Massachusetts Institute of Technology: Cambridge, MA, USA, 2010. [Google Scholar]
- Li, X.; Sun, A.; Zhang, G.; Teunissen, J. A computational study of positive streamers interacting with dielectrics. In Proceedings of the 2020 IEEE International Conference on Plasma Science (ICOPS), Singapore, 6–10 December 2020; p. 219. [Google Scholar] [CrossRef]
- Min, D.; Li, S.; Ohki, Y. Numerical simulation on molecular displacement and DC breakdown of LDPE. IEEE Trans. Dielectr. Electr. Insul. 2016, 23, 507–516. [Google Scholar] [CrossRef]
- Tan, B.H.; Allen, N.L.; Rodrigo, H. Progression of positive corona on cylindrical insulating surfaces. I. Influence of dielectric material. IEEE Trans. 2007, 14, 111–118. [Google Scholar] [CrossRef]
- He, D.; Gong, W.; Liu, H.; Zhao, X.; Li, S.; Li, Q. Simulation Study on Partial Discharge of Oil-paper Insulated in Wedge-shaped Oil Gaps Under DC Electric Field. Proc. CSEE 2021, 41, 5779–5789. [Google Scholar] [CrossRef]
- Li, X.; Sun, A.; Teunissen, J. A Computational Study of Negative Surface Discharges: Characteristics of Surface Streamers and Surface Charges. IEEE Trans. Dielectr. Electr. Insul. 2020, 27, 1178–1186. [Google Scholar] [CrossRef]
- Li, S. Characteristics and Mechanisms of Needle-Plate Partial Discharges in Oil-Pressboard Insulation under the Presence of DC Electric Field Component in Converter Transformer; Shandong University: Jinan, China, 2019. (In Chinese) [Google Scholar]
- Liu, Y.; Dong, M.; Xing, Y.; Hu, Y.; Xi, Y.; Ren, M.; Gao, X. Development Law and Stage Characteristics of Multi-physical Signals of Surface Discharge in Oil-paper Insulation. Proc. CSEE 2023, 43, 1611–1622. [Google Scholar] [CrossRef]
Disclaimer/Publisher’s Note: The statements, opinions and data contained in all publications are solely those of the individual author(s) and contributor(s) and not of MDPI and/or the editor(s). MDPI and/or the editor(s) disclaim responsibility for any injury to people or property resulting from any ideas, methods, instructions or products referred to in the content. |
© 2023 by the authors. Licensee MDPI, Basel, Switzerland. This article is an open access article distributed under the terms and conditions of the Creative Commons Attribution (CC BY) license (https://creativecommons.org/licenses/by/4.0/).