Abstract
An experimental study on natural convection heat transfer from the outer surface of a horizontal array of vertical square tubes in the air is investigated. The array consists of three vertical square tubes at equally different center-to-center distances. Each tube has a square cross-section with a side length of 2.00 cm, 100 cm length, and is filled with sand. Each tube is heated by inserting an internal heating element with a constant heat flux at the center. Five center-to-center separation distance to hydraulic diameter ratios (S/D) are used at different heat flux ranges of 70–360 W/m2. Results show that at small S/D, the Nusselt number of any tube in the array is lower than that of the single tube up to a specific S/D and then increases as the ratio increases. Empirical correlations are obtained for each tube in the array at different S/D using the modified Rayleigh numbers only. General correlations using S/D as a parameter are obtained for each tube, and an overall general correlation using both S/D and the tube number (n) as parameters is obtained. The difference between the predicted and experimental Nusselt numbers is in the reasonable range even at high Rayleigh numbers.
1. Introduction
Natural convection heat transfer from vertical heated objects such as surfaces and cylinders is of great importance; it is relevant to a wide range of engineering applications such as cooling of process piping, cooling of electronic devices, HVAC systems, radiators, oil cooling systems, nuclear reactors, passive heat exchangers, etc. The local natural convection correlation from vertical constant heat flux surfaces was proposed by Vliet and Liu [1] as:
Ali [2] has studied natural convection heat transfer experimentally from vertical uniform surface heat flux tubes with rectangular cross-sections in the air. His empirical correlation for the transition regime was given by
Cylinders, in general, can either have a circular or noncircular cross-section; the noncircular one includes polygonal cross-sections such as square, rectangular, triangular, etc. The natural convection heat transfer from a single vertical cylinder differs from that of a similar cylinder placed in an array due to the effect of other cylinders. Dutton and Welty [3] have experimentally studied the natural convection heat transfer from an array of uniformly heated vertical cylinders in mercury. An equilateral triangular pattern of cylinders was arranged and the data were focused on the center cylinder. Their results indicated a strong natural convection dependence on cylinder spacing but with less dependence on heat flux and the circumference position. Kuriyama et al. [4] experimentally studied the natural convection heat transfer from a line of horizontal cylinders in the air. The effect of cylinder spacing on heat transfer was reported and empirical correlations for the heat transfer were proposed. Corcione [5] numerically investigated the free convection heat transfer from a vertical array of equally spaced horizontal cylinders in the air. Correlations were developed for any individual cylinder in the array and for the whole tube array. Yousefi and Ashjaee [6] experimentally studied natural convection heat transfer from a vertical array of horizontal isothermal elliptic cylinders. It was found that the heat transfer from any cylinder depended on the position of the cylinder in the array, the Rayleigh number, and the separation distance. Empirical correlations were obtained for each cylinder in the array and for the whole array. Ashjaee and Yousefi [7] have experimentally investigated the natural convection heat transfer from vertical and inclined arrays of horizontal cylinders in the air. Correlations were developed for each cylinder in the vertical and inclined arrays and for the whole arrays. Reymond et al. [8] have experimentally studied free convection heat transfer from a vertical array of two horizontal cylinders. It was observed that the heat transfer from the lower cylinder was unaffected by the presence of the upper cylinder; however, the upper cylinder was affected by the rising plume from the lower cylinder. D’Orazio and Fontana [9] have experimentally investigated the natural convection heat transfer from a pair of vertical arrays consisting of equally spaced uniformly heated cylinders in the air. It was found that the Nusselt number of each cylinder either enhanced or degraded, compared to that of a single cylinder, based on the location of the cylinder in the array, the geometry of the array, and the Rayleigh numbers. Reddy et al. [10] have experimentally investigated the free convection from an array of three vertical tubes at different orientations filled with hot mineral oil. Their results showed a temperature increase along the tubes for all inclinations. Liu et al. [11] have numerically studied the natural convection heat transfer from two attached cylinders forming a vertical array in the air. The heat transfer for both cylinders was observed to degrade with respect to the single cylinder. They also proposed correlations for each cylinder and the array. Razzaghpanah et al. [12] numerically studied the natural convection from a row of isothermally heated cylinders immersed in molten solar salt. Empirical correlations were reported for average Nusselt numbers as functions of Rayleigh numbers and dimensionless cylinder-to-cylinder spacing. Ali et al. [13] have studied the effect of tube location in a vertical array consisting of square tubes in the air on natural convection. Their results indicated that the downstream tubes had reduced Nusselt numbers compared to that of a single tube for a small center-to-center separation distance ratio. Local circumference averaged correlations were obtained for each tube in the array and overall correlation was also reported for all the tubes in the array.
As shown earlier, most of the studies and the developed heat transfer correlations were for vertical arrays of circular or non-circular cross-sections. However, a horizontal array of noncircular cross-section tubes has many engineering applications in heat transfer, but to our knowledge, it almost lacks heat transfer data and correlations to cover such a configuration. This motivates the current study to focus on horizontal arrays with vertical noncircular cross-section tubes. This study presents experimental work on the effect of center-to-center separation distance ratio on natural convection heat transfer from a horizontal array of vertical tubes with a square cross-section. Empirical correlation is obtained for each tube in the array using the aspect ratio as a parameter, and also an overall general correlation for all tubes in the array is obtained. The Nusselt number is highly affected by both the separation distance and Rayleigh numbers compared to that of a single tube. These heat transfer correlations will be helpful for any engineering applications that use such array configurations.
2. Experimental Setup
Figure 1 shows a schematic of the setup, which consists of a moving frame holding three vertical tubes of a 20 mm × 20 mm square cross-section forming a horizontal array. The center-to-center distance is S and the side length of the square cross-section is D (equivalent to hydraulic diameter) as shown in Figure 1. The experiment is performed on five S/D of 1.75, 2.75, 3.25, 3.75, and 4.25. Each tube is made from steel (polished mild steel) and filled with sand to insure uniform lateral conduction of heat, while a uniform heat flux heating element (ϕ = 6.6 mm) is inserted at the center of the cross-section of each tube, as shown in Figure 2a. Each tube has a 1.0 m length and is capped with Bakelite insulation with thermal conductivity of 0.15 W/m K [14] to reduce any leakage in the axial heat transfer from each tube. Self-adhesive thermocouples (type K, 30 AWG, 0.01-inch diameter) are used to measure the surface temperature of each tube at three different surfaces; right, left, and the front surface only for similarity. The thermocouples are placed 100 mm apart on each surface, as shown in Figure 2b. Therefore, each tube has 27 thermocouples, 9 at each surface area. The test rig is placed in a 4.4 m × 3.0 m room with no air conditioning or ventilation to ensure that the heat will be transferred from each tube surface only by natural convection. The room has only one entrance covered by a thick curtain. Thermocouples are connected to a data acquisition system, which in turn is connected to a computer, where the surface temperatures are stored for further analysis. A voltage regulator is used to control the input electrical power, which is measured by a Wattmeter and is shared equally between the tubes. It should be mentioned that the electrical power is increased such that the tube surface temperature does not exceed 100 °C.
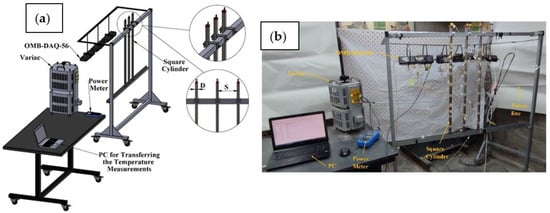
Figure 1.
Experimental setup; (a) schematic and (b) real photo.
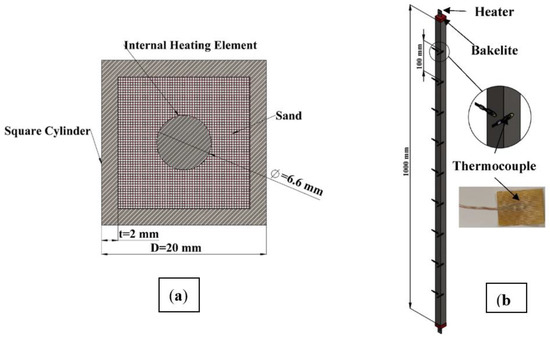
Figure 2.
Specification of each tube; (a) cross-section showing the internal heating element at the center and (b) thermocouple locations along each tube.
2.1. Heat Transfer Analyses
Natural convection heat flux from each tube is determined following the equation
where qc, qr, qb, As, and Ab are the convection heat flux, radiation heat flux, conduction heat flux through the Bakelite insulation capped ends, tube outside surface area, and the Bakelite cross-section area, respectively. The qc is in the range of 77–360 W/m2 and the surrounding medium is air with a Prandtl number (Pr) ≈ 0.72. The heat dissipated by conduction through the Bakelite ends and by radiation is obtained from:
where Tib, Tob, δ, kb are the inside and outside surface temperatures of the Bakelite ends, thickness, and the thermal conductivity of the Bakelite, respectively. Furthermore, stand for the surface emissivity of the tube (0.27 for polished mild steel [15]), the Planks constant, and the shape factor, respectively. It should be noted that is calculated at the overall average surface temperature corresponding to each heat flux. Following [15], the shape factor between two long parallel tubes can be obtained from
where is the shape factor between each tube and the ambient and α = 1 for the right and left tube and 2 for the middle one. It should be mentioned that exchanging radiation between similar tubes is negligibly small; therefore, it will be assumed that neighboring tubes are in radiant balance [16]. Consequently, the net radiant exchange is with the room walls. The circumference average surface temperature at any axial distance along the tube and for each uniform heat flux can be calculated from
where j stands for the thermocouple number in the circumference direction at each axial distance along the tube. The physical properties are calculated at the arithmetic mean temperature as
Following the above temperature distribution, then there are nine , which corresponds to each heat flux for each tube in the array. The axial circumference averaged local heat transfer coefficient can be calculated for each tube as
It should be noted that for each tube there are nine axial values of the circumference averaged local heat transfer coefficient corresponding to each heat flux. Consequently, the non-dimensional Nusselt and the modified Rayleigh numbers can be determined as
It should be noticed that the local Nusselt number Nux and the local modified Rayleigh number are used throughout this study and sometimes the superscript * and the subscript x are dropped out just for simplicity.
2.2. Experimental Uncertainty
The uncertainty estimation is obtained for the results based on the uncertainties in the primary measurements. The error in estimating the emissivity, measuring the temperature, and calculating the surface area is ±0.02, ±0.5 °C, and ±0.003 m2, respectively. The Wattmeter manual provides the accuracy of the voltage as 0.5% of reading ±2 counts with a 0.7 resolution of 0.1 V and 0.7% of reading ± 5 counts + 1 mA with a resolution of 1 mA for the current. It should be noted that at each heat flux, 40 temperature measurement scans were obtained using the data acquisition system, and the average was taken. The method suggested by Kline and McClintock [17] and Moffat [18] was followed in calculating the uncertainty of the results. Table 1 shows the maximum uncertainties of the calculated results.

Table 1.
The maximum percentage uncertainties of the parameters.
3. Results and Discussion
Figure 3 shows the local circumference average normalized temperature profiles along the outer surface of a single square tube at various heat fluxes. The end effect is clear on the temperature profiles at the up and downstream of heat transfer. Therefore, the test section will be focused on the vertical distance between x/L = 0.2–0.8. Other tubes give similar temperature profiles. It should be noted that the temperature reaches a steady state after about 100 min, as shown in Figure 4 at different supplied heating powers.
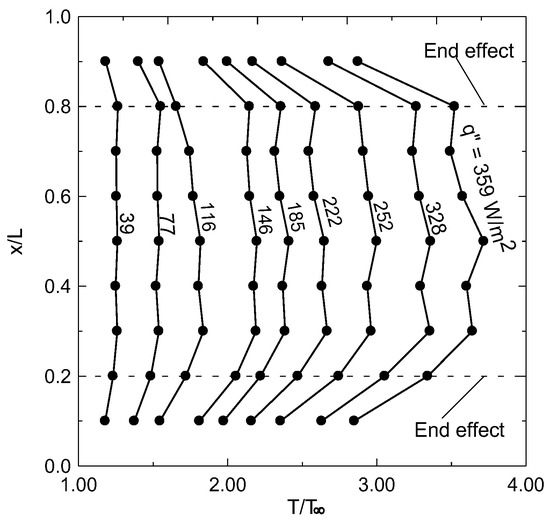
Figure 3.
Local circumference average normalized temperatures along the vertical surface of the tube at different heat fluxes.
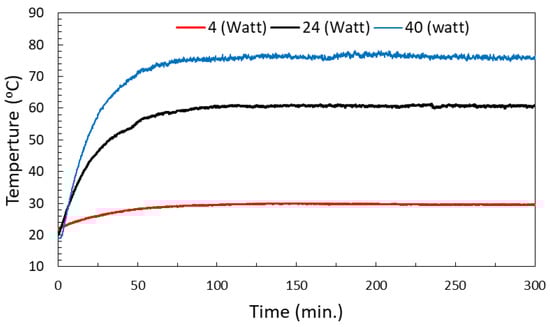
Figure 4.
Steady-state temperature profiles at the outer surface of the tubes at three different supplied powers.
Figure 5a–c shows a sample of the temperature readings in the middle of the tube at the three surfaces, namely: front (F), left (L), and right (R) at three different heat fluxes. Table 2 shows the surface temperature, the mean value, and the standard deviation between the three different readings for each tube. As indicated, as the heat flux increases, the surface temperature increases and the maximum overall standard deviation is 3.30. The percent of overall relative standard deviation is obtained at the three heat fluxes as 2.34, 3.46, and 4.23, as shown in Table 2.
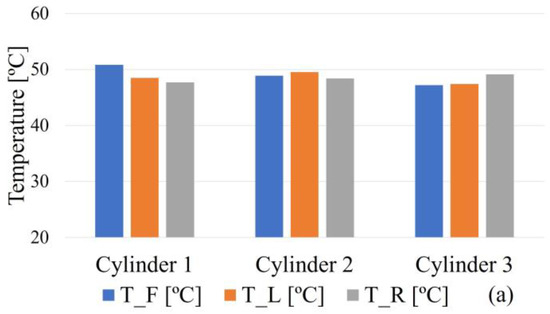
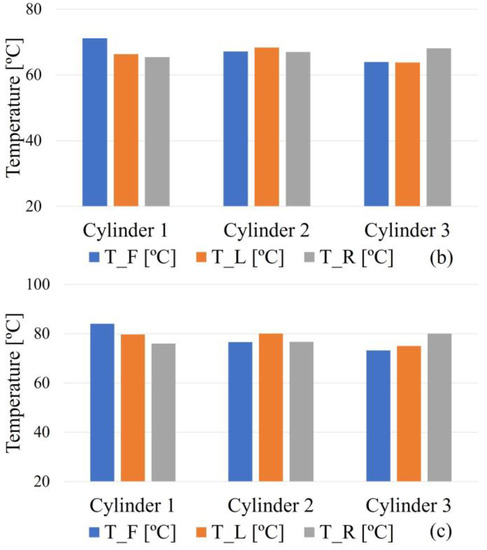
Figure 5.
Temperature measurements in the middle of the tube at different heat fluxes at the three circumference surfaces: front (F), left (L), and right (R); (a) 108.0 W/m2, (b) 221.0 W/m2, and (c) 341.0 W/m2.
Table 2.
Sample of the temperature measurements in the middle of the tubes at the three surfaces.
It should be noted that the thermocouples have been calibrated using a platinum resistance thermometer made by Fluke Corporation (Model: 5609). The thermocouples along with the Fluke thermometer were immersed in a container full of distilled water, which was then heated up to the boiling temperature. Temperature readings were recorded using a data logger. A sample of such measurement/calibration is shown in Figure 6 for seven thermocouples, and the boiling temperature for each thermocouple is shown in Table 3. These results ensure a very good accuracy of the used thermocouples. The boiling temperature corresponds to Riyadh’s atmospheric condition.
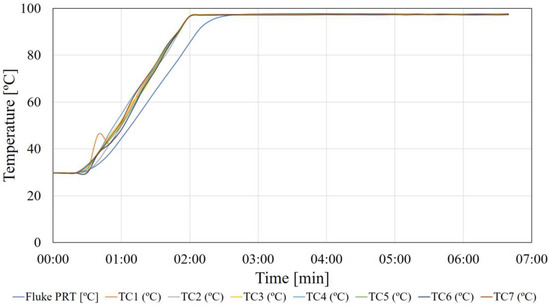
Figure 6.
Thermocouple calibration against a platinum resistance thermometer using samples of seven thermocouples.
Table 3.
Recorded temperatures of the seven thermocouples against the platinum resistance thermometer at boiling state.
Figure 7 shows a comparison between the natural convection heat transfer from the three single tubes and that of Vliet and Liu [1] and Ali [2] for natural convection from vertical plates and vertical square cross-section tubes, respectively. The comparison shows that the current results lie between the envelope of Vliet and Liu [1] and Ali [2], and close to [2] since the current tubes have a square cross-section area similar to that of [2]. Figure 8a,b shows the local circumference averaged Nusselt number versus the modified local Rayleigh number on a logarithmic scale for the left tube (number 1, □) in an array of three tubes compared to that of the single tube ●. The solid and the dashed lines present the curve fitting through the experimental data. Figure 8a shows that for center-to-center distance ratio S/D = 1.75. It is clear that the effect of small S/D is to reduce the Nusselt number at the same . This could be attributed to the existence of small S/D since in general, there is competition between the raising plume due to the buoyancy force, which tends to improve the heat transfer coefficient, and the accumulated thermal boundary layer, which tends to degrade it. This competition depends on the S/D ratio. Therefore, as S/D increases, the velocity effect of the raising plume overcomes that of the accumulated thermal boundary layer, which reduces the difference in between the single tube and that of the array of three tubes, as shown in Figure 8b. Moreover, as S/D increases more, the of the tube in the array approaches that of a single tube and may enhance it over that of a single tube, as shown in Figure 9 for S/D = 4.25. Solid and dashed lines, which appear in Figure 9, present the curve fitting through the experimental data at different S/D ratios. The general correlation of the curve fitting is in the form
where A and B are constants. Table 4 shows these constants and the coefficient of determination R2 of tube number one and the other tubes at different S/D ratios compared to that of a single tube.
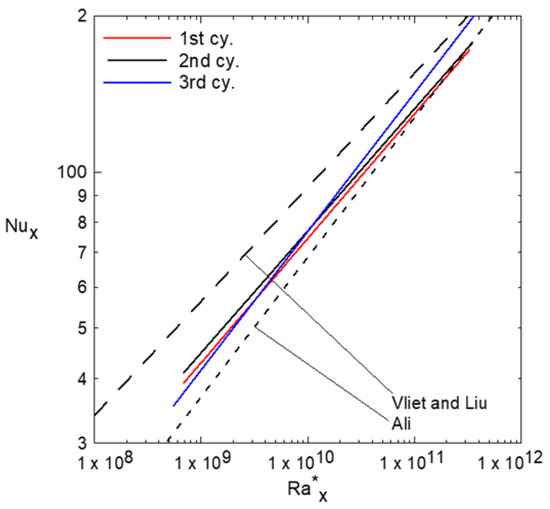
Figure 7.
Comparison of natural convection heat transfer from the used single tubes and that of Vliet and Liu [1] and Ali [2].
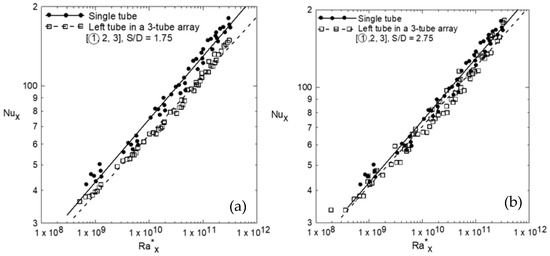
Figure 8.
The effect of a small center-to-center distance ratio on the natural convection heat transfer from the left tube in an array of three tubes; (a) S/D = 1.75 and (b) S/D = 2.75.
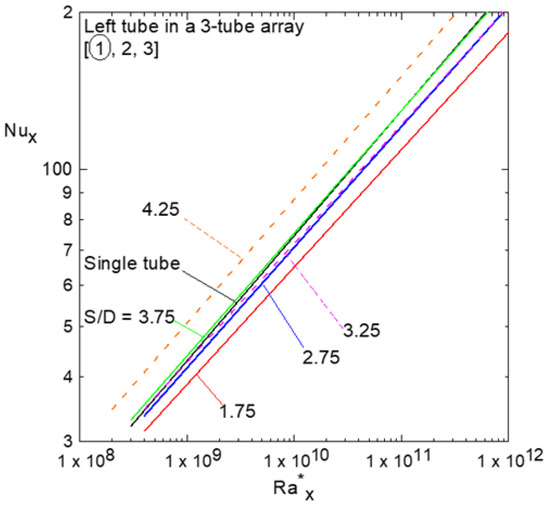
Figure 9.
Local Nusselt numbers versus the modified Rayleigh numbers for different S/D ratios of the left tube in the array of three tubes compared to that of the single tube.
Table 4.
Constants A, B, and R2 appear in the correlation (12) at different S/D ratios for the horizontal array of three vertical tubes compared to that of the single tube.
Figure 10a,b shows the effect of center-to-center distance on natural convection heat transfer, and it is clear that as the S/D increases, the effect of natural convection velocity presented by a rising plume overcomes the degradation effect by the accumulated thermal boundary layer on heat transfer from the tube. Figure 11a–c shows the Nusselt number profiles as a function of the S/D ratio for different Rayleigh numbers for the left tube (#1) in Figure 11a, the middle (#2) in Figure 11b, and the right (#3) in Figure 11c, respectively. These profiles show the initial degradation of Nu at the smaller S/D and then the enhancement starts as the S/D increases, as mentioned earlier due to the velocity effect of the raising plume overcoming that of the accumulated thermal boundary layer. It is also noted that as Rayleigh’s number increases, the Nusselt number profiles increase too, and the minimum degradation and maximum enhancement in Nu occur at S/D = 1.75 and 4.25, respectively. It should be noted that S/D = 0 in Figure 11 corresponds to that of natural convection from a single tube alone, and the rest is related to that of the tube in the array at different S/D. Figure 12a–c shows the percent of degradation and enhancement in local Nux as S/D increases for different Rayleigh numbers compared to that of a single tube (at S/D = 0). These results show that the percent of degradation increases as the Rax increases, as shown for S/D = 1.75; however, Rax has a low effect on Nux at large S/D = 4.25. Table 5 shows the percentage of degradation or enhancement over the single tube for the three tubes in the array at different S/D as shown in Figure 12a–c.
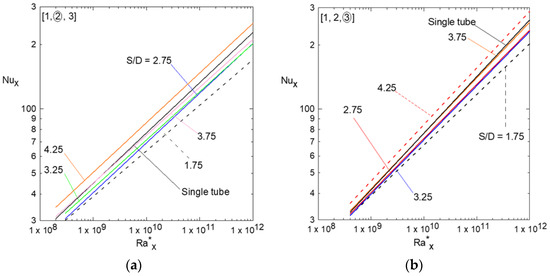
Figure 10.
Local Nusselt numbers versus the modified Rayleigh numbers for different S/D ratios corresponding to the middle and right tube compared to that of a single tube; number 2 in (a), and number 3 in (b).
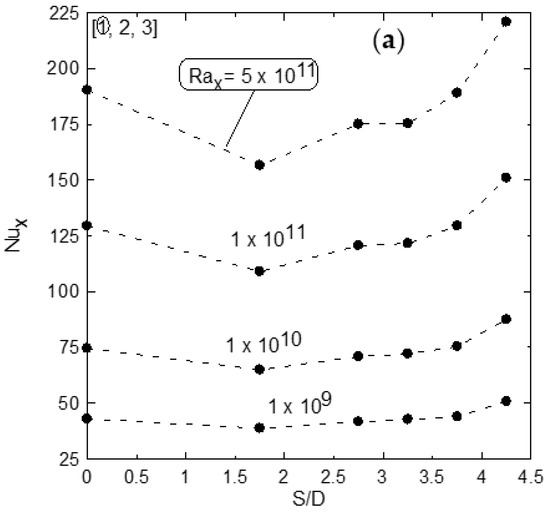
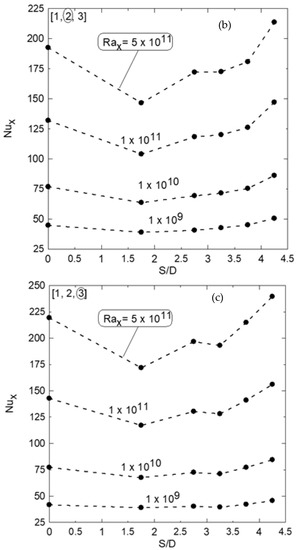
Figure 11.
Local Nusselt numbers versus S/D ratios for different modified Rayleigh numbers; tube number 1 in (a), tube number 2 in (b), and tube number 3 in (c).
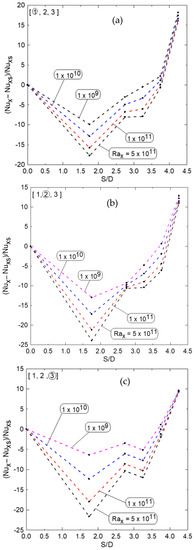
Figure 12.
The percentage of degradation and enhancement of Nux versus S/D for different Rayleigh numbers for the different tubes in the array; (a) tube number 1, (b) tube number 2, and (c) tube number 3.
Table 5.
Percent of degradation or enhancement in Nusselt numbers over that of a single tube at different Rayleigh numbers (Nu x – Nuxs) × 100/Nus.
General correlations for each tube using the aspect ratio S/D as a parameter are obtained in the form:
C1, C2, C3, and the coefficient of determination R2 are shown in Table 6. Figure 13a–c shows differences between the predicted and the experimental Nusselt numbers with S/D as a parameter using a correlation number (13). The maximum deviation, which appears at high Rayleigh numbers, is shown in Table 6. Figure 14 shows a maximum difference of 17.9% between the predicted and the experimental Nusselt numbers using both S/D and the tube’s number (n) as parameters. The overall correlation for the array is obtained as:
Table 6.
Constants appearing in Equation (13) with the corresponding R2 and the maximum deviation appear in Figure 13 according to each tube in the array.
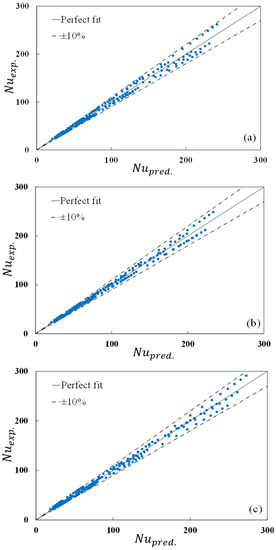
Figure 13.
Differences between the predicted and the experimental Nusselt numbers using S/D as a parameter; (a) tube number 1, (b) tube number 2, and (c) tube number 3.
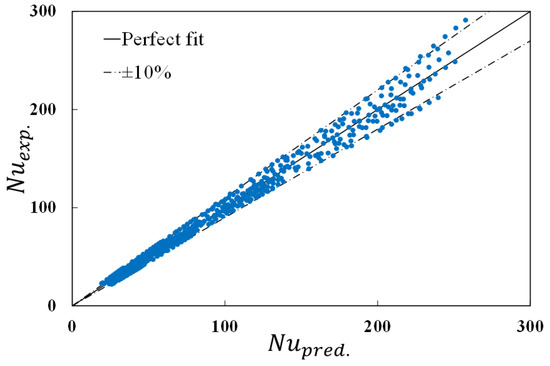
Figure 14.
Differences between the predicted and the experimental Nusselt numbers using S/D and tube number (n) as parameters for the array.
4. Conclusions
Experimental studies on natural convection heat transfer from a horizontal array of vertical tubes with square cross-sections are reported. Results show that the Nusselt number of the tube is highly affected by the existence of the tube in the array compared to that of a single tube. At a small S/D, Nux decreases sharply and then starts to increase until it equals that of the single tube. If the S/D increases, the effect of buoyancy force overcomes the effect of accumulated boundary layers, which leads to an enhancement in Nux over that of the single tubes. If S/D increases more, it would be expected that Nux reached that of the single tubes. Table 5 shows the percent of degradation and enhancement in Nux compared to that of the single tube. Two empirical correlations are obtained for Nux versus only, for Nux, , and S/D as a parameter for each tube in the array. A more general correlation is obtained for all tubes in the array using both S/D and the tube’s number (n) as parameters (Equation (14)). These correlations are necessary for any engineering applications related to such kinds of tubes, which could be used in heat exchangers.
Author Contributions
Conceptualization, Z.A.; Methodology, Z.A. and N.S.S.; Validation, Z.A., M.A. and N.S.S.; Formal analysis, M.A.; Investigation, Z.A. and M.A.; Resources, N.S.S.; Data curation, N.S.S.; Writing—original draft, M.A.; Writing—review & editing, M.A.; Supervision, Z.A. and M.A.; Funding acquisition, Z.A. All authors have read and agreed to the published version of the manuscript.
Funding
This research was funded by the Deputyship for Research and Innovation, Ministry of Education in Saudi Arabia—project number IFKSURG-02-1746.
Data Availability Statement
The data presented in this study are available on request from the corresponding author.
Conflicts of Interest
The authors declare that there is no conflict of interest.
Nomenclature
| Ab | Bakelite cross-section area |
| As | the Tube outside surface area |
| C | Constant |
| D | Tube’s equivalent hydraulic diameter |
| F | Shape factor |
| g | Gravitational acceleration |
| h | Heat transfer coefficient |
| k | Thermal conductivity |
| L | Tube length |
| Nu | Nusselt number |
| n | Tube number |
| qb | Conduction heat flux through the Bakelite insulation capped ends |
| qc | Convection heat flux |
| qr | Radiation heat flux |
| Local modified Rayleigh number | |
| S | Center-to-center distance |
| T | Temperature |
| x | Local length |
| Greek symbols | |
| α | Thermal diffusivity |
| β | Coefficient of thermal expansion |
| δ | Bakelite thickness |
| ε | Surface emissivity |
| θ | Arithmetic mean temperature |
| ϑ | Kinematic viscosity |
| σ | Planks constant |
| Subscripts | |
| s | Single tube |
| x | axial or circumference averaged |
References
- Vliet, G.C.; Liu, C.K. An experimental study of turbulent natural convection boundary layers. J. Heat Transf. 1969, 91, 517–531. [Google Scholar] [CrossRef]
- Ali, M. Natural convection heat transfer along vertical rectangular ducts. Heat Mass Transf. 2000, 46, 255–266. [Google Scholar] [CrossRef]
- Dutton, J.; Welty, J. An Experimental Study of Low Prandtl Number Natural Convection in an Array of Uniformly Heated Vertical Cylinders. J. Heat Transf. 1975, 97, 372–377. [Google Scholar] [CrossRef]
- Kuriyama, M.; Tokanai, H.; Harada, E.; Konno, H. Natural-Convection Heat Transfer around a Horizontal Array of Heated Cylinders in Air. Heat Transf. Jpn. Res. 1996, 25, 410–419. [Google Scholar] [CrossRef]
- Corcione, M. Correlating equations for free convection heat transfer from horizontal isothermal cylinders set in a vertical array. Int. J. Heat Mass Transf. 2005, 48, 3660–3673. [Google Scholar] [CrossRef]
- Yousefi, T.; Ashjaee, M. Experimental study of natural convection heat transfer from vertical array of isothermal horizontal elliptic cylinders. Exp. Therm. Fluid Sci. 2007, 32, 240–248. [Google Scholar] [CrossRef]
- Ashjaee, M.; Yousefi, T. Experimental Study of Free Convection Heat Transfer from Horizontal Isothermal Cylinders Arranged in Vertical and Inclined Arrays. Heat Transf. Eng. 2007, 28, 460–471. [Google Scholar] [CrossRef]
- Reymond, O.; Murray, D.B.; O’Donovan, T.S. Natural convection heat transfer from two horizontal cylinders. Exp. Therm. Fluid Sci. 2008, 32, 1702–1709. [Google Scholar] [CrossRef]
- D’Orazio, A.; Fontana, L. Experimental study of free convection from a pair of vertical arrays of horizontal cylinders at very low Rayleigh numbers. Int. J. Heat Mass Transf. 2010, 53, 3131–3142. [Google Scholar] [CrossRef]
- Reddy, A.S.; Akella, S.; Prasad, A. Experimental study of free convection heat transfer from array of vertical tubes at different inclinations. Int. J. Emerg. Technol. Adv. Eng. 2014, 253–257. [Google Scholar]
- Liu, J.; Liu, H.; Zhen, Q.; Lu, W. Laminar natural convection heat transfer from a pair of attached horizontal cylinders set in a vertical array. Appl. Therm. Eng. 2017, 115, 1004–1019. [Google Scholar] [CrossRef]
- Razzaghpanah, Z.; Sarunac, N.; Javanshir, A.; Khalesi, J. Natural convection heat transfer from a horizontal row of finite number of heated circular cylinders immersed in molten solar salt. J. Energy Storage 2019, 22, 176–187. [Google Scholar] [CrossRef]
- Ali, M.; Nuhait, A.; Almuzaiqer, R. The effect of square tube location in a vertical array of square tubes on natural convection heat transfer. Heat Transf. Eng. 2018, 39, 1036–1051. [Google Scholar] [CrossRef]
- William, D.; Callister, W.D.J. Materials Science and Engineering An Introduction, 6th ed.; John Wiley & Sons: New York, NY, USA, 2003; Chapter 19; p. 660. [Google Scholar]
- Siegel, R.; Howell, J.R. Thermal Radiation Heat Transfer, 3rd ed.; McGraw-Hill: New York, NY, USA, 1992. [Google Scholar]
- Marsters, G.F. Arrays of heated horizontal cylinders in natural convection. Int. J. Heat Mass Transf. 1972, 15, 921–933. [Google Scholar] [CrossRef]
- Kline, S.J.; McClintock, F.A. Describing uncertainties in single-sample experiments. ASME Mech. Eng. 1953, 75, 3–8. [Google Scholar]
- Moffat, R.J. Describing Uncertainties in experimental results. Exp. Therm. Fluid Sci. 1988, 1, 3–7. [Google Scholar] [CrossRef]


Disclaimer/Publisher’s Note: The statements, opinions and data contained in all publications are solely those of the individual author(s) and contributor(s) and not of MDPI and/or the editor(s). MDPI and/or the editor(s) disclaim responsibility for any injury to people or property resulting from any ideas, methods, instructions or products referred to in the content. |
© 2023 by the authors. Licensee MDPI, Basel, Switzerland. This article is an open access article distributed under the terms and conditions of the Creative Commons Attribution (CC BY) license (https://creativecommons.org/licenses/by/4.0/).