Article

Surface Modification of Cellulose Nanocrystals (CNCs) to Form a Biocompatible, Stable, and Hydrophilic Substrate for MRI

1
Department of Applied Physics, Faculty of Science and Technology, Universiti Kebangsaan Malaysia, Bangi 43600, Malaysia
2
Department of Physics, Faculty of Applied Science, Taiz University, Taiz P.O. Box 6803, Yemen
3
Institut Islam Hadhari, Universiti Kebangsaan Malaysia, Bangi 43600, Malaysia
4
College of Engineering, Universiti Tenaga Nasional (UNITEN), Kajang 43000, Malaysia
*
Authors to whom correspondence should be addressed.
Appl. Sci. 2023, 13(10), 6316; https://doi.org/10.3390/app13106316
Submission received: 20 April 2023 / Revised: 16 May 2023 / Accepted: 17 May 2023 / Published: 22 May 2023
(This article belongs to the Section Applied Physics General)

Abstract

:
This study focused on surface modification of cellulose nanocrystals (CNCs) to create a biocompatible, stable, and hydrophilic substrate suitable for use as a coating agent to develop a dual-contrast composite material. The CNCs were prepared using acid hydrolysis. Hydrolysis was completed using 64% sulfuric acid at 45 °C for 1 h, which was combined with polyethylene glycol and sodium hydroxide (PEG/NaOH). The yield of samples exhibited prominent physicochemical properties. Zeta (ζ) potential analysis showed that the CNCs sample had excellent colloidal stability with a highly negative surface charge. Transmission electron microscopy (TEM) analysis confirmed that the CNCs sample had a rod-like morphology. On the other hand, field-emission scanning electron microscopy (FESEM) analysis showed that the acid hydrolysis process caused a significant reduction in particle size and changed surface morphology. In addition, cellulose nanocrystals with polyethylene glycol and sodium hydroxide (CNCs-PEG/NaOH) have many noteworthy properties such as colloidal stability, small hydrodynamic size, and water dispersibility. Furthermore, the MTT assay test on Hep G2 cells demonstrated good biocompatibility of the CNCs-PEG/NaOH and did not exhibit any cytotoxic effects. Hence, CNCs-PEG/NaOH holds the potential to serve as a dual-contrast agent for MRI techniques and other biomedical applications.

1. Introduction

Cellulose is a widely available natural polymer that is renewable, biodegradable, and abundant in sources such as wood, cotton, rice straws, and sugarcane bagasse. It consists of repeated d-glucopyranose units linked by 1,4-β glycosidic bonds, with each glucose monomer having three hydroxyl groups connected through acetal functions between the OH groups of the C4 and the C1 carbon atoms. The lateral size of cellulose chains is approximately 0.3 nm, and the degree of polymerization of native cellulose can range from 1000 to 30,000, corresponding to chain lengths from 500 to 15,000 nm [1,2]. In addition, cellulose possesses a semi-crystalline structure consisting of both ordered (crystalline) and disordered (amorphous-like) regions [1,3]. Despite having three hydroxyl groups per glucose monomer that can interact with water molecules, cellulose is insoluble in water and most organic solvents due to its high molecular weight and long molecular chain, which can exceed 500,000 Da. Cellulose is known for its remarkable mechanical properties, chemical stability, biocompatibility, hydrophilicity, and biodegradability [4].
Nanocellulose or cellulose in nanometers or nano-cellulose, a new bio-based nanomaterial, has been developed in recent years. It consists of cellulose with a size range of 10 nm to 350 nm, known as CNCs. CNCs possess various remarkable properties, such as high crystallinity, high specific surface area, modulated size/morphology, good optical properties, biodegradability, and biocompatibility. In comparison to cellulose, CNCs offer more attractive properties, such as exceptional mechanical properties (high specific strength and modulus), high aspect ratio, environmental benefits, greater malleability, and lower cost. These make CNCs a potentially better alternative to cellulose [5,6,7,8,9]. CNCs have found a wide range of applications in various fields due to their exceptional properties. They are commonly used as reinforcement fillers in polymer matrices, in the production of separation membranes and transparent barrier films, as well as in the fabrication of supercapacitors, biosensors, and coating agents. In addition, CNCs have been explored for their potential applications in biomedicine, such as in drug delivery systems and tissue engineering [10].
Nano-cellulose is typically derived from natural plant resources using methods such as acid hydrolysis, ultrasonic techniques, and enzymatic hydrolysis. Among these, acid hydrolysis is the most commonly used method due to its ease, speed, and desirable properties, such as biocompatibility, biodegradability, sustainability, nontoxicity, hydrophilicity, low cost, large surface area, high mechanical strength, and high stiffness. Previous studies have shown that nano-cellulose produced through acid hydrolysis has a relatively high crystallinity index of around 22.29% compared to other methods. Additionally, nano-cellulose obtained through acid hydrolysis has a smaller diameter/width of 5–10 nm [5,6,11,12,13,14].
Surface modification of cellulose nanocrystals (CNCs) with polyethylene glycol (PEG) is a commonly used technique to improve their biocompatibility and stability in biological environments. PEG is a water-soluble polymer that is widely used in biomedical applications due to its non-toxicity, low immunogenicity, and its ability to reduce protein adsorption and opsonization [15]. The surface modification of CNCs with PEG typically involves the formation of covalent linkages between the hydroxyl groups on the CNCs’ surfaces and the functional groups on the PEG molecules. This can be achieved using various chemical methods, such as carbodiimide-mediated coupling or thiol-ene click chemistry. In the presence of a base, such as NaOH, the hydroxyl groups on the CNCs surface can become more nucleophilic and reactive, which can facilitate the covalent linkage formation with PEG [16]. In the context of this paper, surface modification of CNCs with PEG and NaOH was performed to improve their biocompatibility and hydrophilicity, as well as to potentially enhance their performance as coating agents to develop a dual-contrast composite material [17].
In order to design effective magnetic nanoparticle (MNPs)-based contrast agents for biological applications, it is crucial to produce high-quality nanoparticles with desirable physical properties, size and shape control, good colloidal stability, and low cytotoxicity. Meeting these requirements can enable the synthesized magnetic nanoparticles (MNPs) to exhibit their full potential and optimal performance in MRI applications.
Magnetic resonance imaging (MRI) is a widely used imaging technique in clinical diagnosis due to its nonradioactive and non-invasive nature and high spatial resolution [18]. However, obtaining high sensitivity remains a challenge. Contrast agents (CAs) have been developed to improve image contrast by affecting the relaxation time of water protons during MRI relaxivity measurement, thereby increasing the sensitivity of MRI [19,20]. There are two types of MRI CAs based on the contrast enhancement mechanism: positive (T1) CAs, which reduce longitudinal relaxation time and result in brighter T1-weighted images, and negative (T2) CAs, which shorten transverse relaxation time and lead to darker T2-weighted images [21].
T1 CAs are composed of materials that increase the relaxation of water protons in the spin-lattice direction, resulting in an increased r1 relaxivity value. These agents are commonly made from gadolinium (Gd) and manganese (Mn) ions. In addition, Gd-based complexes have undesirable characteristics such as toxicity, short circulation time, and moderate r1 value, which restrict their use as T1 CAs [22,23]. Conversely, superparamagnetic materials are primarily used as T2 CAs, which accelerate the spin–spin relaxation of water protons and increase the relaxivity (r2) value [24]. However, their use is limited due to drawbacks such as signals from calcification or bleeding and magnetic susceptibility artefacts [25,26].
As previously mentioned, T1 and T2 contrast agents each have their respective limitations, which is why developing a new type of contrast agent that can act as both T1 and T2 agents would be advantageous. Dual-contrast agents provide more comprehensive information for accurate diagnosis. Creating dual agents is challenging, but it can be achieved through factors such as controlling surface coating and nanoparticle size. The modification of nanoparticle surfaces is crucial in determining their colloidal stability, biocompatibility, hydrodynamic volume, and magnetic fluid viscosity. In this study, the acid hydrolysis of MCC was used to synthesize CNCs as MCC is a widely used cellulose source in the food and pharmaceutical industries and for CNCs production. The aim of this study was to characterize CNCs and to explore their potential as a coating agent to develop a dual-contrast composite material. CNCs are prepared using acid hydrolysis and combined with polyethylene glycol and sodium hydroxide (PEG/NaOH) to form a biocompatible, stable, and hydrophilic substrate.

2. Materials and Methods

2.1. Material Procurement

All chemicals, including sulfuric acid (H2SO4) (98%, Mw = 98.080 g mol−1), commercial microcrystalline cellulose (C6H10O5) n (JCPDS No. 00-060-1502, 98%, Mw = 162.1406 g mol−1) polyethylene glycol (C2nH4n + 2On+1) (99%, Mw = 6000 g mol−1) and Sodium hydroxide (NaOH) (>99.9%, Mw = 40 g mol−1), were sourced from Sigma-Aldrich®, Zwijndrecht Netherlands nd used without any purification. Filtered distilled water with a resistivity value of 18.2 MΩ was sourced from Purelab Maxima ELGA and used as a general solvent throughout the study as well as for final nanoparticle washing.

2.2. Method

2.2.1. Preparation of Cellulose Nanocrystals (CNCs) via Sulfuric Acid Hydrolysis

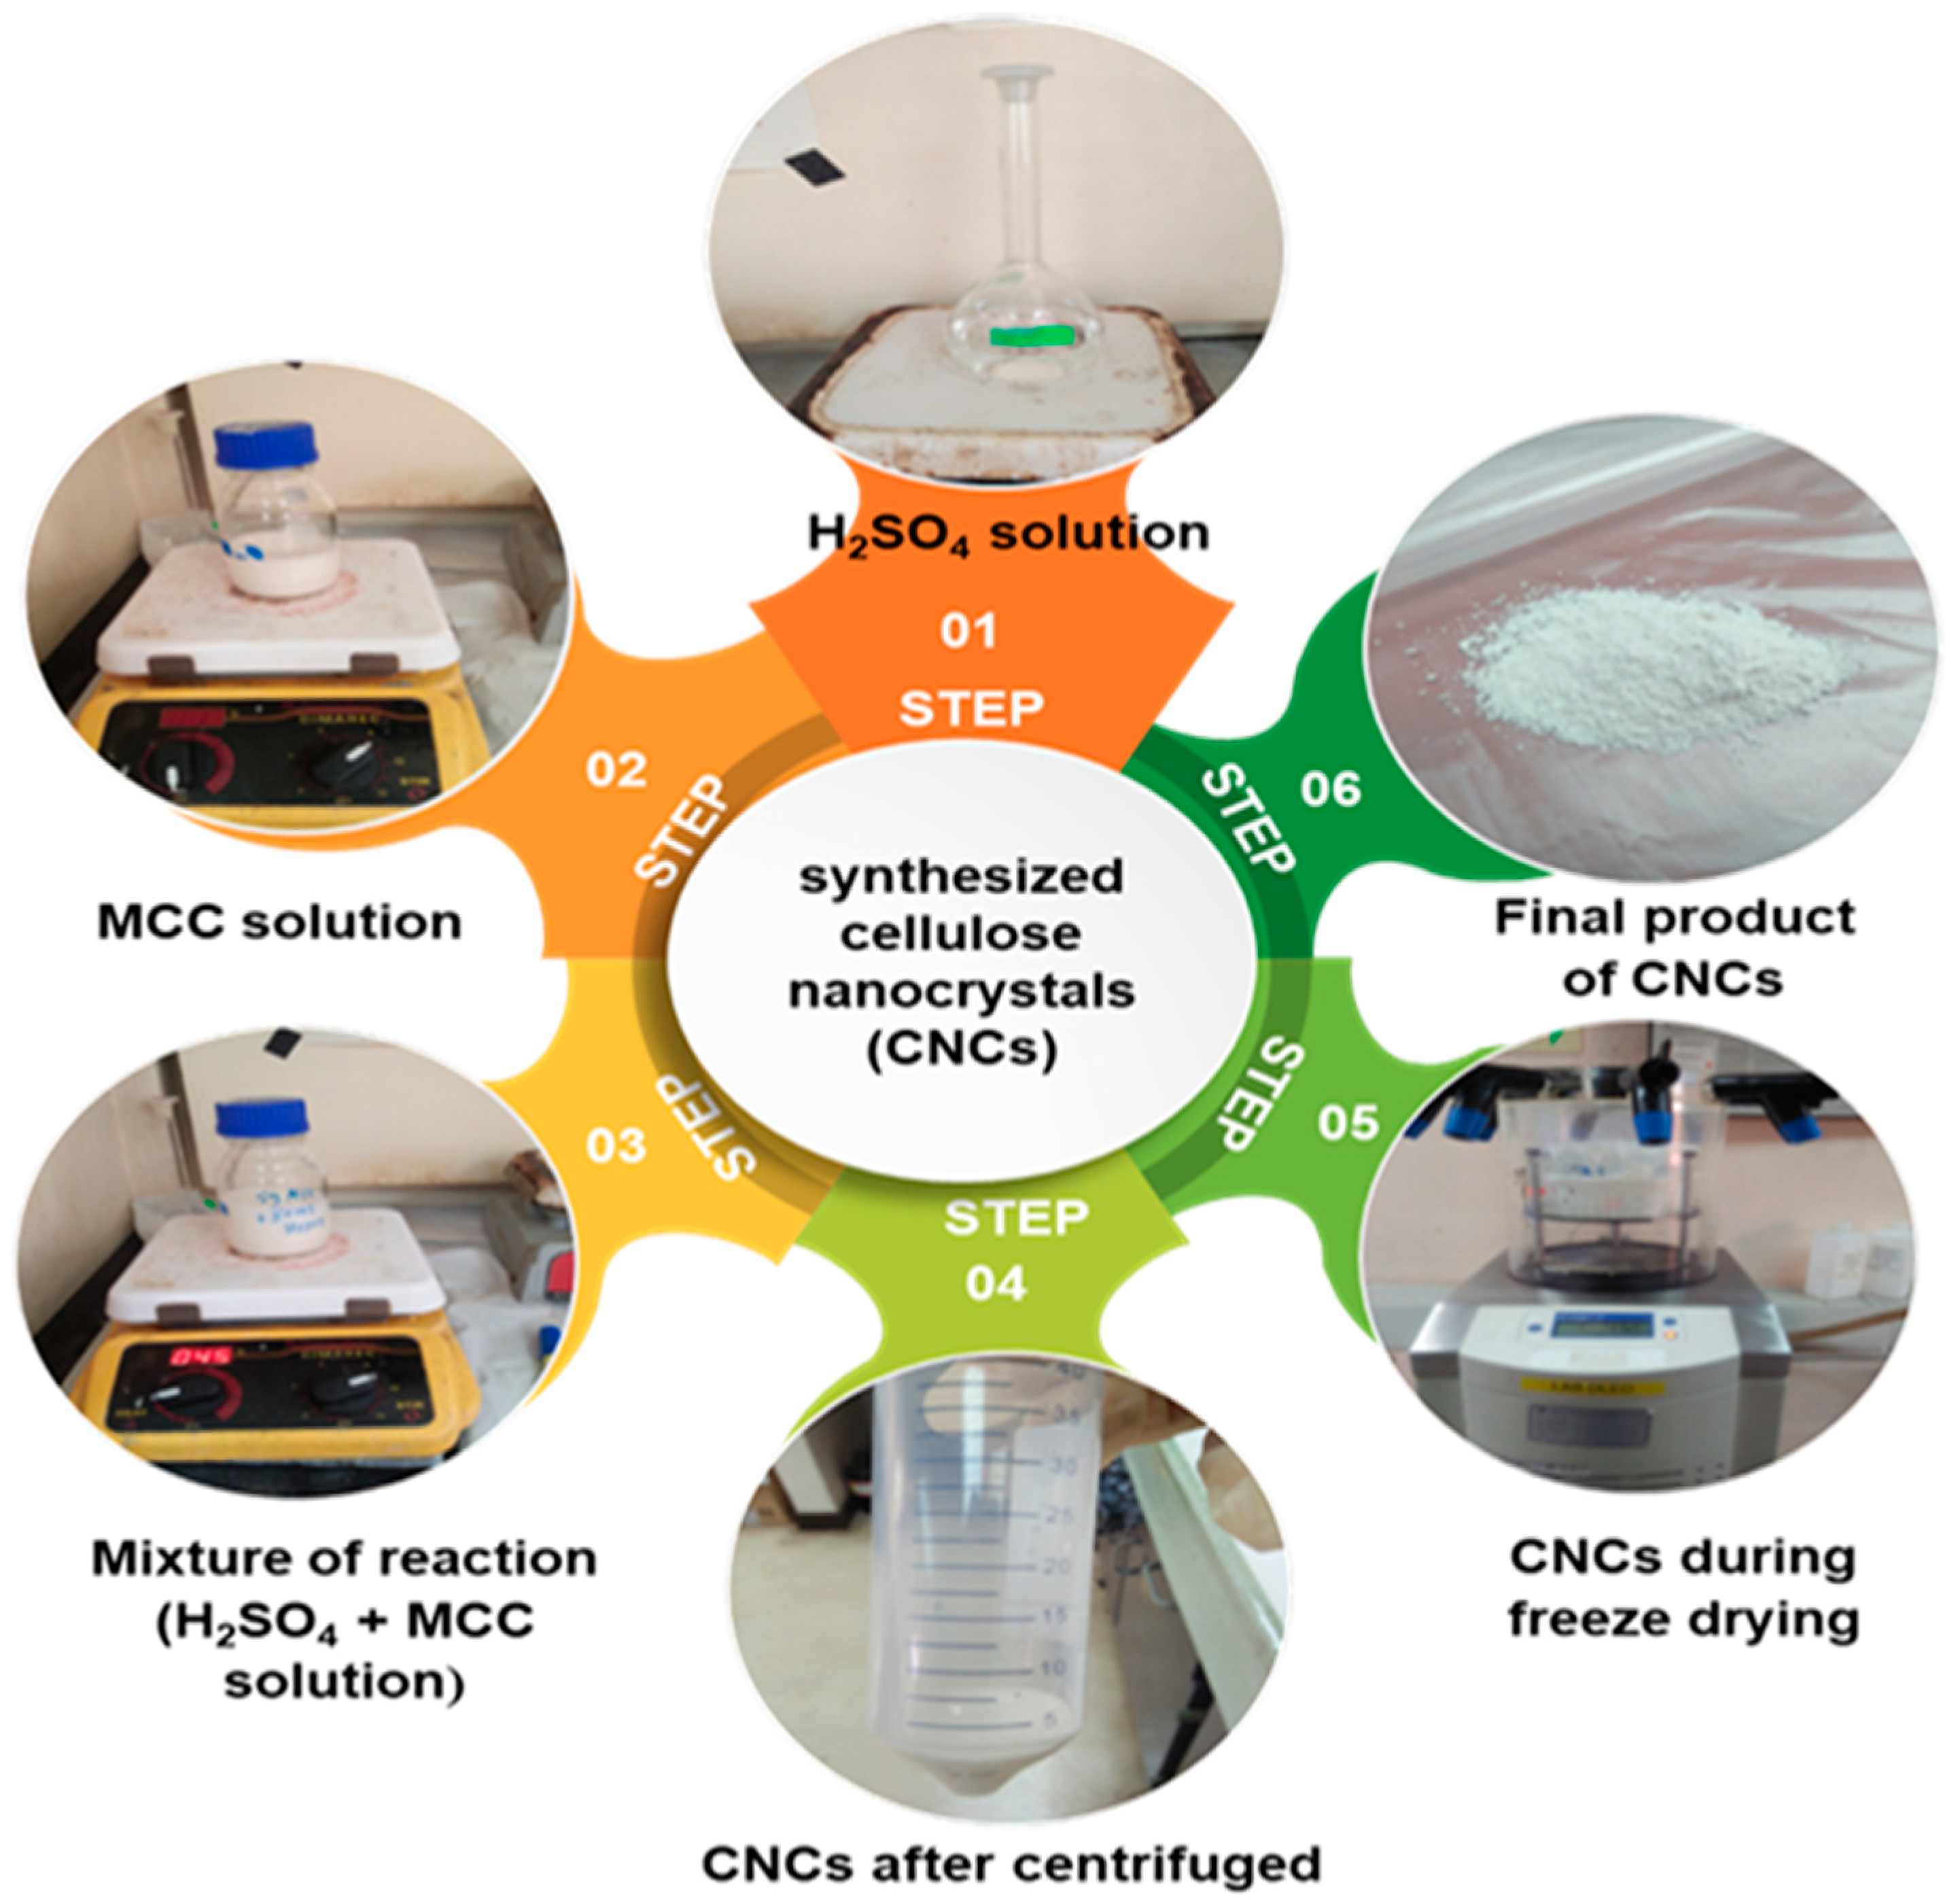
The synthesis of cellulose nanocrystals (CNCs) through acid hydrolysis is controlled by the chemical hydrolysis reaction, as illustrated in Figure 1, as described by Feng and Chen [27]. The acid hydrolysis method was selected to produce CNCs from commercially sourced microcrystalline cellulose (MCC) due to the anticipated high yield with a stable aqueous suspension and high crystallinity index. In this study, a 14 mmol quantity of MCC was dispersed in 100 mL of distilled water and stirred at room temperature for 1 h. In a separate container, 64% (v/v) sulfuric acid (H2SO4) was dissolved in 36 mL of distilled water and stirred for 10 min at room temperature. Then, 50 mL of the acid solution was gradually added to the MCC suspension to achieve a pH of approximately 0.82 and a final concentration of sulfuric acid of 21.3% (v/v). The mixed solution was mechanical stirred and heated at a constant of 45 °C for an hour, after which 200 mL of cold distilled water was added to stop the hydrolysis reaction. A white product, CNCs, was formed and collected by centrifugation at 4020 rpm for 20 min. The product was washed by vortexing in distilled water at 2200 rpm for 2 min and was then centrifuged at 4020 rpm for 20 min to eliminate unreacted precursors, i.e., sulfate ions. This washing step was repeated several times until the pH level of the product reached ~6–7. The final CNC product was freeze-dried at 45 °C for 24 h and crushed into powder using a crucible. Sfiligoj et al. [28] proposed Equation (1) to estimate the yield percentage (%Y) of the prepared sample (Table A1). Synthesis of cellulose nanocrystals (CNCs) is shown in Figure 2.
% Y = W e i g h t   a f t e r   h y d r o l y s i s W e i g h t   i n i t i a l × 100

2.2.2. Synthesis of (CNCs-PEG/NaOH)

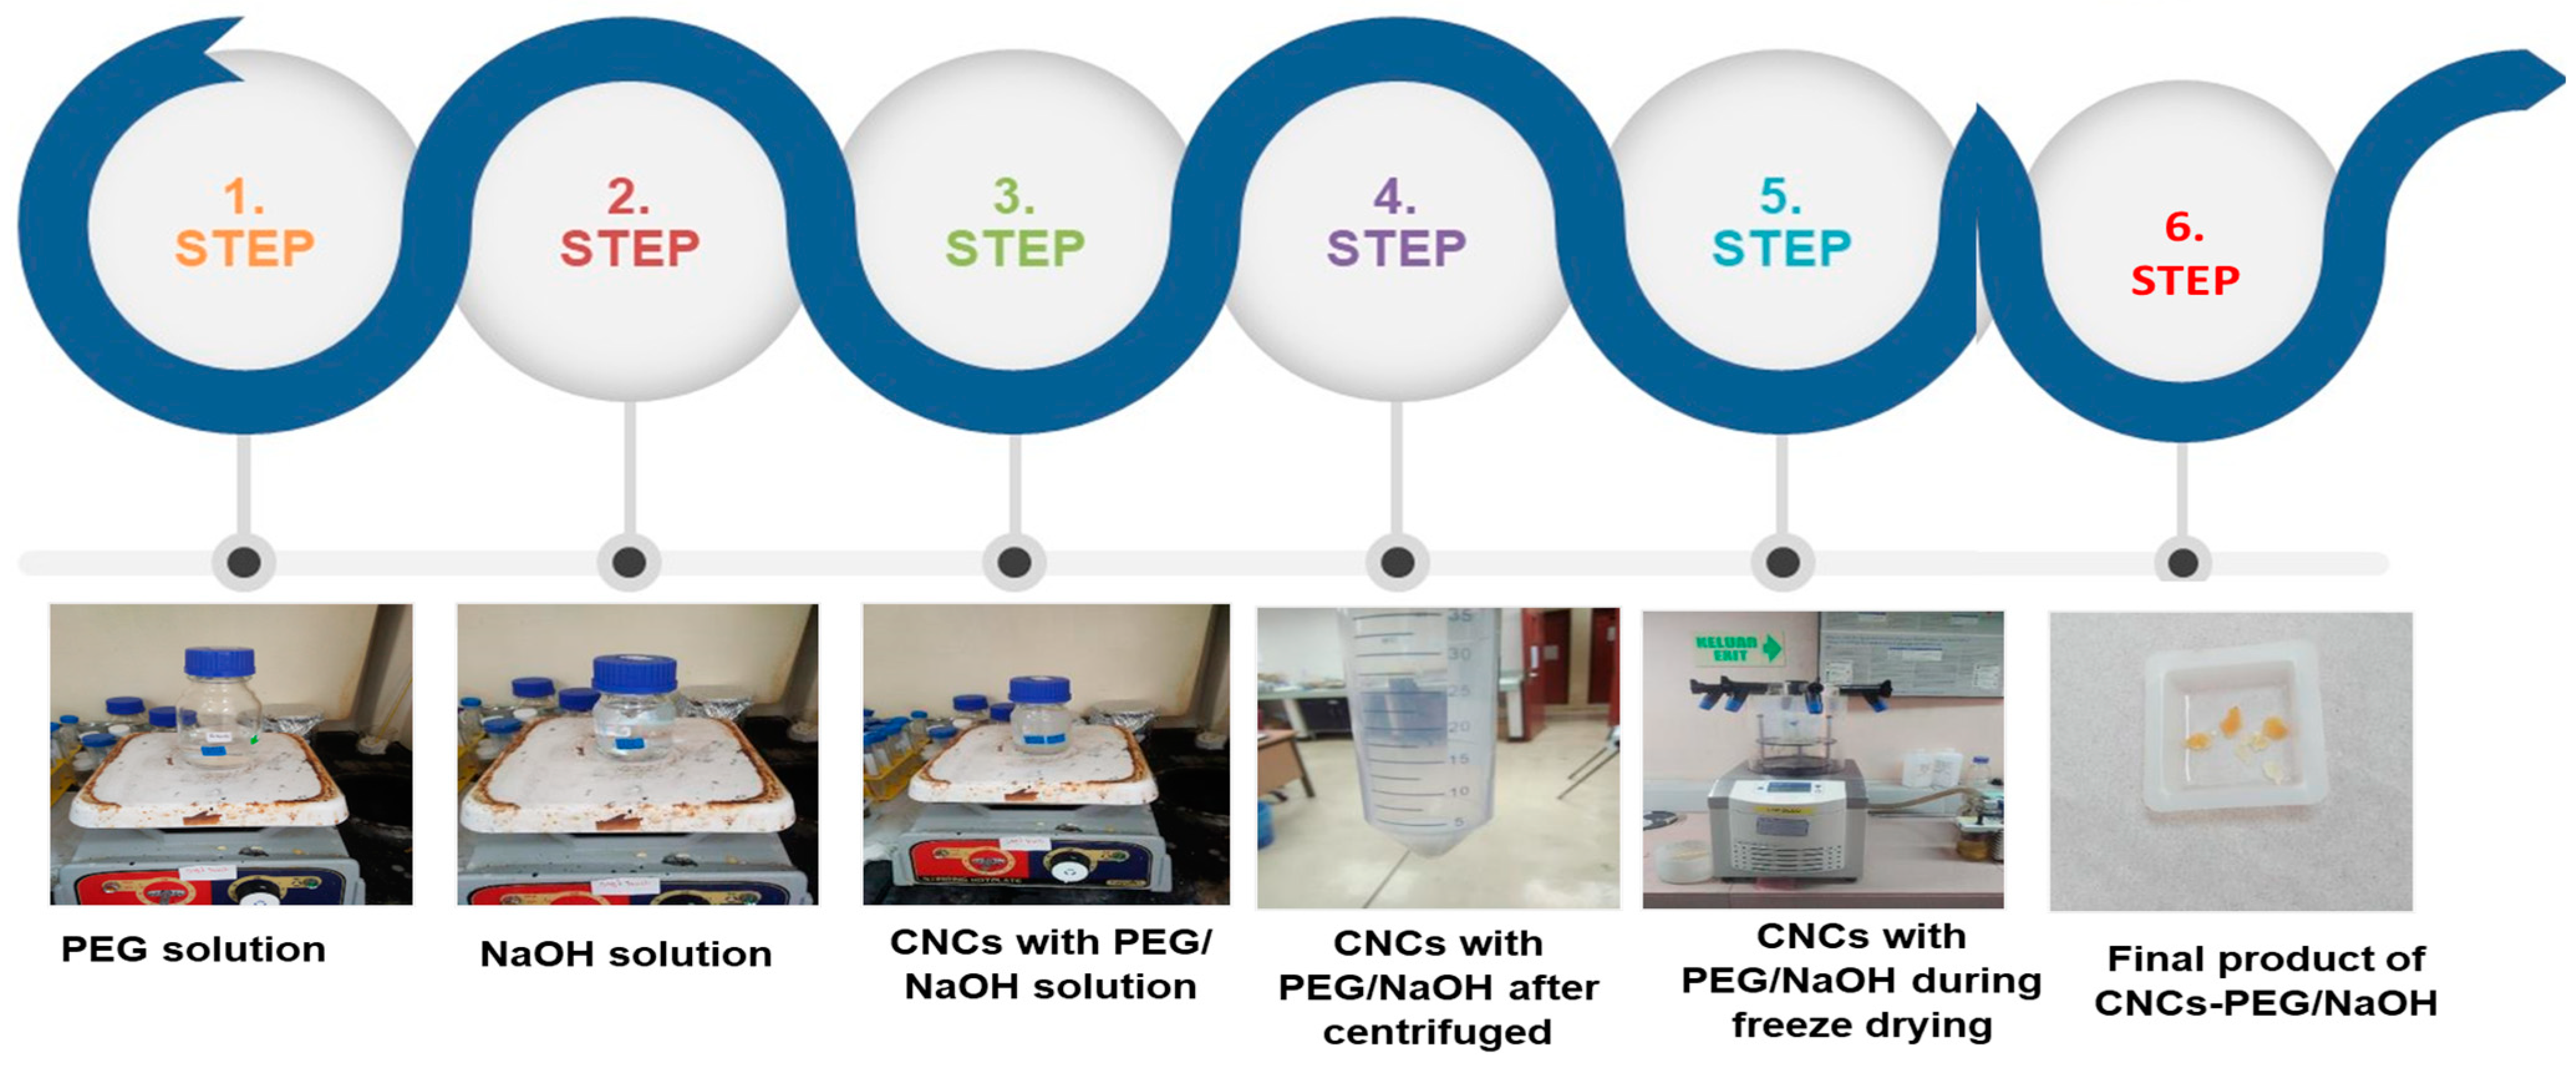
The hydrolysis method was utilized to prepare cellulose nanocrystals (CNCs) with PEG/NaOH. This method was selected due to its ability to produce a stable aqueous suspension of CNCs and high crystallinity index. Figure 3 shows a schematic of the reaction of cellulose nanocrystals surface (CNCs) with PEG in the presence of NaOH. To carry out the method, 4 g of polyethylene glycol (PEG) was dissolved in 100 mL of distilled water and stirred for 10 min at room temperature. In a separate step, 8 g of sodium hydroxide (NaOH) was dissolved in 100 mL of distilled water and stirred for 10 min at room temperature. Then, 20 mL of the previously prepared PEG solution was slowly added to the 80 mL of NaOH solution while stirring for 10 min at room temperature. A 0.5% w/v solution of CNCs was prepared by mixing 0.5 g of CNCs in 100 mL of the PEG/NaOH solution. After one week of stirring, the mixture was subjected to centrifugation at 4020 rpm for 20 min. The resulting white product of (CNCs-PEG/NaOH) was collected and further dried using a freeze-drying method at 45 °C for 24 h. The dried product was stored at 4 °C until further use. Sfiligoj et al. [28] proposed Equation (1) to estimate the yield percentage (%Y) of the prepared sample (Table A1). The final synthesized of (CNCs-PEG/NaOH) is shown in Figure 4.

2.3. CNCs Characterization

2.3.1. Fourier Transform Infrared (FTIR) Spectroscopy

The synthesized samples were first characterized using Fourier transform infrared spectroscopy (Thermo Scientific Nicolet 6700, Waltham, MA, USA) to investigate their molecular conformation in the wavenumber range of 4000 to 400 cm−1 at 4 cm−1 resolutions in which the samples were ground into fine powder using a crucible. A small amount of sample powder was placed into the FTIR spectrometer’s sample holder and was analyzed using the appropriate IR spectrum range.

2.3.2. X-ray Diffraction (XRD) Analysis

XRD (Bruker D8 Advance, Billerica, Massachusetts, MA, USA,) was later used to analyze the MCC and CNCs samples’ crystalline, size, and structural characteristics; specifically, a technique employing Cu Kα (λ = 1.5406 Å) was used to obtain the samples’ structural information in diffraction angle 2θ of 5° to 80° at a step angle of 0.1° with scanning rate of 0.025° s−1. To perform the analysis, a small amount of sample powder was placed into a sample holder and inserted into the XRD instrument, which was equipped with the Cu Kα radiation source.

2.3.3. Thermogravimetric and Derivative Thermogravimetry (TGA/DTG) Analysis

A TGA/DTG (Shimadzu Instruments 50, Caluire-et-Cuire, France) was utilized to investigate the MCC and CNCs samples’ thermal stability, weight loss, and decomposition temperature. An amount of 5–7 mg of each sample was put in an alumina cup and annealed at a heating rate of 10 °C/min between 25 and 600 °C under a nitrogen atmosphere.

2.3.4. Zeta Potential Characterization

The surface charges of the samples’ suspensions were also estimated using the Zeta potential of the aqueous MCC, CNCs, and (CNCs-PEG/NaOH) (Malvern 3000 Zetasizer Nano ZS, USA) at a wavelength of 633 nm and a detecting angle of 173°. A very dilute solution was made by taking (0.02% wt) of the samples in deionized water. Then the solution was sonicated for good dispersion. The samples were kept at a constant temperature of 25 °C for 2 min. The data were analyzed with Malvern Zetasizer software v7.03.

2.3.5. Dynamic Light Scattering (DLS) Analysis

The size of the sample suspensions was estimated in this research using DLS (Malvern 3000 Zetasizer Nano ZS, USA) at a detecting angle of 173° and a wavelength of 633 nm at room temperature. To achieve good dispersion, a small quantity of the sample was dissolved in deionized water and sonicated. The hydrodynamic size measurement was obtained after the samples had been kept at a consistent temperature of 25 °C for two minutes.

2.3.6. Transmission Electron Microscopy (TEM) Analysis

The MCC and CNCs samples’ morphology, size distribution, and average particle diameter were analyzed using transmission electron microscopy (Phillips CM12, thermo scientific, Netherlands) at an accelerating voltage of 120 V. Whereby a small amount of sample (<1 mg) was dissolved in ethanol. Then the solution was sonicated for 15 min. After that, the solution was dropped onto the TEM grid and was allowed to dry at room temperature before characterization. The size of the nanoparticle was measured by the utilization of Image J software v1.8.0 based on extraction from TEM micrographs.

2.3.7. Emission Scanning Electron Microscopy (FE-SEM) Imaging

For surface morphology characterization of samples, images of samples were taken at an accelerating voltage of 15 kV using a field-emission scanning electron microscope (FE-SEM, Carl Zeiss Merlin Compact, Jena, Germany). Whereby, the samples were placed onto an aluminium stub and coated with iridium prior to characterization to avoid the charging effect.

2.3.8. Nuclear Magnetic Resonance (NMR) Spectroscopy Analysis

13C nuclear magnetic resonance (NMR) spectra (Bruker/Advance III HD 400 MHz (Bruker, Rheinstetten, Germany)) were used to confirm the chemical interaction between cellulose nanocrystals with polyethylene glycol and sodium hydroxide and to identify the structure of the samples being studied. However, solid-state NMR spectroscopy was not available at the Centre of Research and Instrumentation Management, Universiti Kebangsaan Malaysia. To compensate for this, the CNCs-PEG/NaOH (30 mg) sample was dissolved in Deuterium (D2O, 0.6 mL) for three hours at RT.

2.3.9. In Vitro Magnetic Resonance Imaging (MRI) Studies

The MR images were obtained using a 3.0 Tesla MRI system (Siemens MAGNETOM Verio, National Cancer Institute, Prairie Village, KS, USA). The following parameters were used in achieving T1 weighted images: field of view (FOV) = 250 mm × 250 mm, echo time (TE) = 10 ms and relaxation time (TR) = 520 ms. T2-weighted was also recorded with a TR value of 2000 ms and TE = 50 ms. The MR image was then analyzed based on the contrast quality in determining qualitatively the potential use of synthesized CNCs-PEG/NaOH as an MRI contrast agent. In verifying the capability of CNCs-PEG/NaOH as an MRI contrast agent, we first prepared a phantom consisting of synthesized CNCs-PEG/NaOH. Briefly, the sample was placed into a petri dish at a volume of 15 mL, which was then embedded in a phantom consisting of tap water for the purpose of obtaining appropriate images. The prepared phantom was then placed in the isocentre of the magnetic resonance modality bore.

2.3.10. Cell Survival Test

Cytotoxicity assays are important tools used in the biomedical field to assess the potential of biochemical molecules as therapeutic agents. These assays measure the ability of substances to cause damage to living cells or tissues. Test cell survival was conducted on Hep G2 Human hepatocellular carcinoma cells (homosapiens, Hep G2, HB-8065™, Manassas, VA, USA) using the MTT assay. The positive control utilized was H2O2 (10 mM), while the negative control was a complete growth medium containing fetal bovine serum.

2.3.11. Cell Culture Preparation

The first stage of the in vitro study began with the seeding of Hep G2 cells in tissue culture flasks using minimum essential medium (MEM) as a growth medium at 37 °C in a humid atmosphere with 5% carbon dioxide and 95% air. Cultures were checked daily to ensure that the cells remained healthy and that any changes in morphology were noted. At this stage, the growth results of Hep G2 cells in monolayer condition were removed using trypsinization (cell separation process using trypsin) and the number of cells was counted. The removed cells were placed in a 96-well plate at a seed density of 20,000 cells/well and incubated at 37 °C for at least 12 h.

3. Results and Discussion

3.1. Fourier Transform Infrared (FTIR) Analysis

Figure 5 displays the results of Fourier transform infrared spectroscopy (FTIR), which compares the chemical compositions of the cellulose nanocrystals (CNCs) sample to that of commercially supplied microcrystalline cellulose (MCC). Similar peaks may be seen in both graphs, suggesting that there is little difference between the chemical structures of CNCs and MCC. Therefore, the cellulose’s fundamental chemical structure was maintained [29]. It is also worth noting that the hydroxyl group -OH peaked at 3344 cm−1 in both plots. In the meantime, we detected vibrations at 2916 cm−1 due to -CH stretching, 1646 cm−1 due to -OH bending of the absorbed water, 1430 cm−1 due to -CH and -OCH in-plane bending, 1317 cm−1 due to -CH deformation, and 1059 cm−1 due to -C-O stretching. COC, -CCO, and -CCH deformation modes and stretching vibrations with C-5 and C-6 atom motions of 898 cm−1, and -C-OH out-of-plane bending mode with motions of 668 cm−1. Both graphs also revealed the cellulose’s primary chemical makeup, which matched the nano-cellulose structures previously reported in the literature via controlled hydrolysis of MCC [30].
The CNCs’ plots also reveal that the peak at 3344 cm−1 was stronger and more distinct than the MCC. This may be because of the increased number of hydrogen bonds inside the CNCs, which resulted from the removal of the amorphous component and consequently improved the crystallinity of the samples. Due to cellulose’s sensitivity to crystal structure at absorbance values around 850 to 1500 cm−1 [31], the crystallinity index was calculated by dividing (Ia) the intensity of the 898 cm−1 band by (Ib) the intensity of the peak 1430 cm−1 band in Figure 5 (Equation (2)).
Further evidence of the success of the hydrolysis processing of MCC into CNCs, the crystallinity indices of the MCC and CNCs were found to be approximately 0.78 and 0.86, respectively, as listed in (Table A2). This clearly indicates the dissolution of the amorphous structure of MCC during hydrolysis. Regarding the impact of reaction time on the crystallinity of the materials, ref. [32] obtained similar findings.
C r y s t a l l i n i t y   i n d e x = I a I b × 100 %

3.2. XRD Analysis

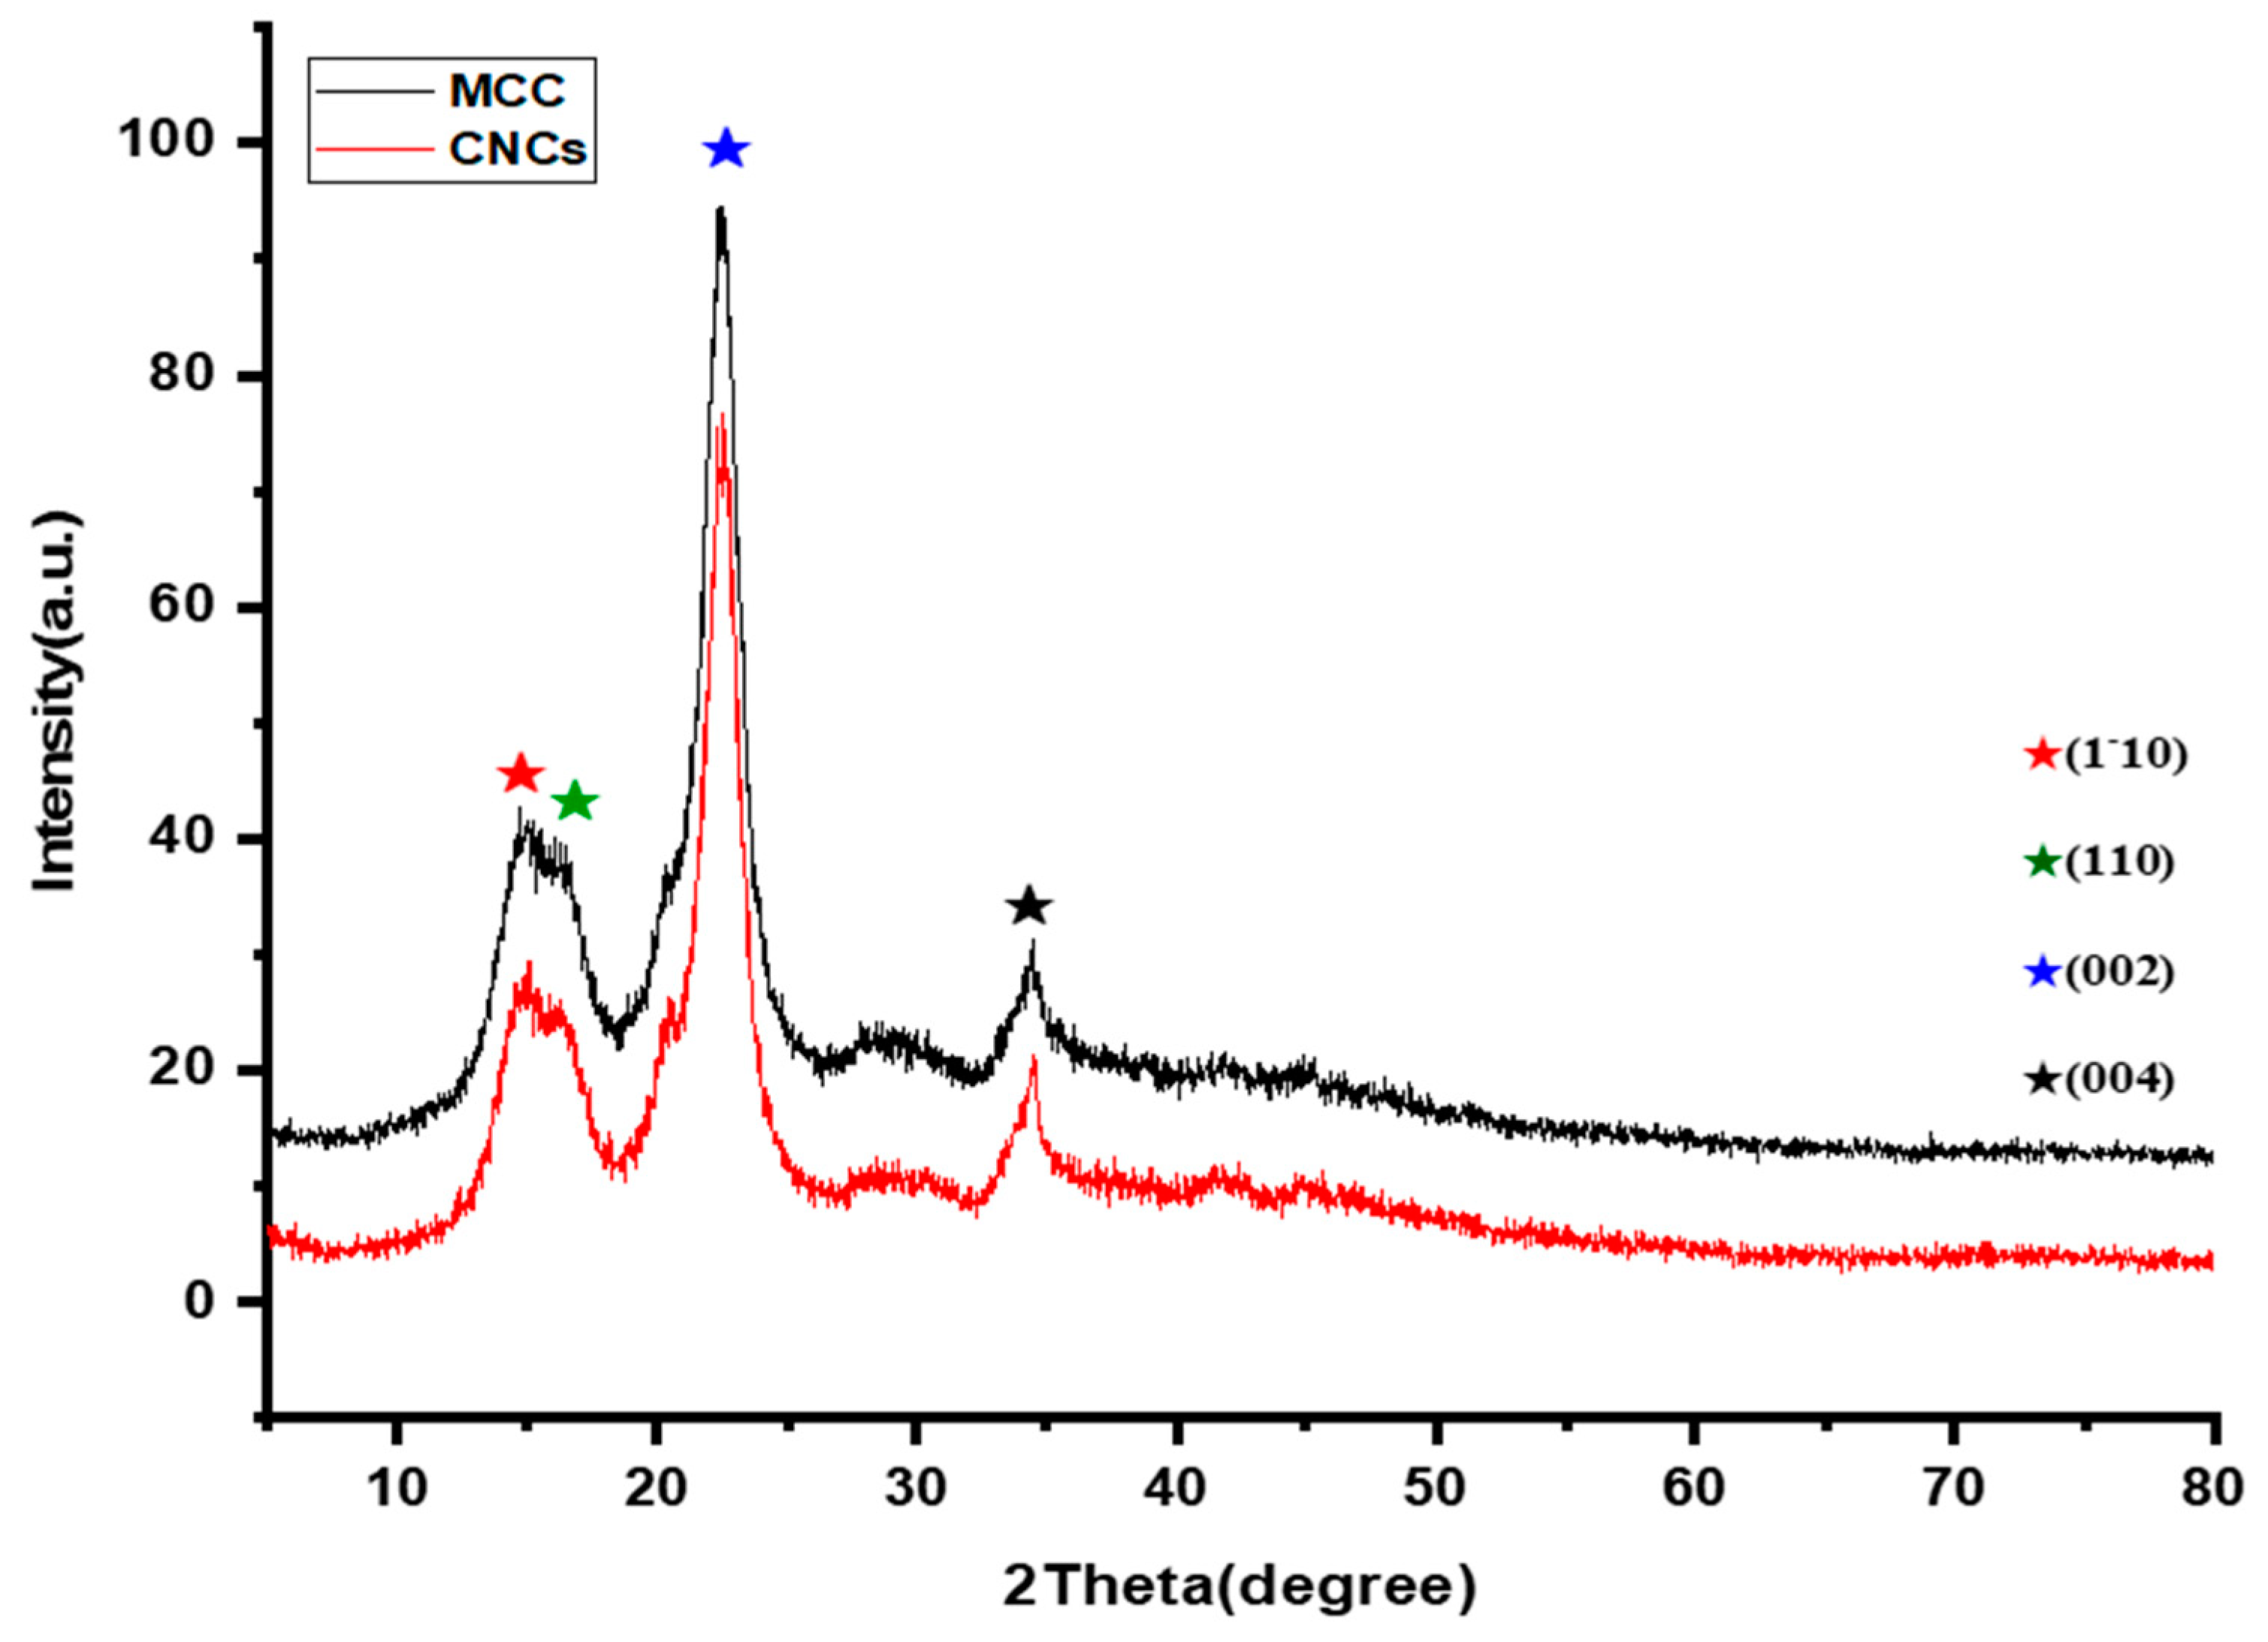
The crystalline structures of the samples were investigated using X-ray diffraction. The XRD spectrum plots of the CNCs sample and the commercially sourced MCC are shown in Figure 6. The two samples’ general X-ray diffraction patterns were similar, with four distinct 2θ diffraction peaks (15°, 16.4°, 22.7°, and 34.5°) that correspond to the (1-10), (110), (002), and (004) crystallographic planes of the monoclinic cellulose lattice [33], in agreement with published reports by Wang, Ding, and Cheng [34]. The crystalline structure of the cellulose is represented by the third prominent diffraction peak (22.7°) for the cellulose structure. The similarity of these patterns indicates that the crystalline structure of the cellulose within the MCC sample was preserved after sulfuric acid hydrolysis [35].
Crystallinity indices for samples are tabulated in (Table A3); these values were calculated using Equation (3) [36], where I002 is the intensity of the 002 peaks (2θ = 22.7°) and Iam is the intensity of the local minima between the 002 and 110 peaks (2θ between 18° and 19°). Although the ultrasonic method and enzymatic hydrolysis were claimed to enhance crystallinity by 22.29%, the crystallinity indices of the MCC and CNCs samples were found to be 74.90% and 83.84%, respectively, representing an appreciable increase of 8.9% in the samples’ crystallinity indices [10,13]. The addition of a strong acid like sulfuric acid (H2SO4) not only serves to break the amorphous area of the cellulose, but also to destroy parts of the crystalline structure; this is why this observation of comparably lesser rise agrees with Wulandari, Rochliadi, and Arcana [9].
X c r y s t a l l i n i t y = I 002 I a m I 022 × 100 %
According to Equation (4), where d is interplanar distance; h, k, and l are crystal indices; a, b, and c are lattice parameters; and β is the angle between the incident X-ray beam and the crystal plane. The interplanar distance (from Bragg’s = 2d sinθ), crystal indices and lattice parameters were utilized to determine the lattice geometry and unit cell volumes [37]. Samples of MCC and CNCs had interplanar distances of 5.20, 4.13, and 1.97, based on their (020), (200), and (004) crystal orientations, respectively. The estimated values for the three constants of the lattice structure are as follows: a = 8.26, b = 10.40, and c = 7.88. The refined unit cell has a volume of 677 Å3. The data is given in Table 1, and it is consistent with previous research that found the unit cell volume to be 685.3 Å3 [35].
1 d 2 = 1 s i n β 2 h 2 a 2 + k 2 s i n β 2 b 2 + l 2 c 2 2 h l c o s β a c
Dislocation strain on the crystal lattice and crystallite size can be evaluated by analyzing the peak broadening in an XRD pattern [38]. Particle size (in nm) of the MCC and CNCs samples was determined concerning the (002) plane using Scherrer Equations (5) and (6) as shown in Table 2.
D h k l = K λ β h k l C o s θ
β h k l = 2 θ x π 180
where Dhkl is particle size in nanometers, λ is radiation wavelength (1.54056 Å for CuKα radiation), k is a constant equal to 0.94, βhkl is peak width at half maximum intensity and θ is peak position.
According to this research (see Table 2), the average crystallite size of the MCC samples was 7.06 nm, and the average crystallite size of the CNCs sample was 5.57 nm. Table 2 also included a summary of the full width at half maximum (FWHM) and the highest peak intensity of the samples. It was easily seen that the crystallite size decreased together with the broadening of the most significant peak [39]. In accordance with previously reported findings, it was also found that the crystallite size of the CNCs sample was noticeably smaller than that of the MCC sample. Specifically, it was found that the crystallite size of the nano-cellulose obtained via acid hydrolysis consistently has a smaller crystallite size than other methods, with a value of 5–10 nm [7].
The distribution of lattice strain due to faults and dislocations in the crystals was measured using Equation (7):
ε = β C o s θ 4
Table 3 displays the estimated strain values of the CNCs sample calculated using Equation (7): (110), (002), and (004) diffraction peaks correspond to strain values of 2.5 × 10⁻³, 6.4 × 10⁻³, and 3.04 × 10⁻³, respectively. Hence, a function of 2θ was found to help distinguish between the impacts of size and strain on the peak broadening, i.e., the Bragg width contribution from the crystallite size is inversely proportional to the crystallite size, as suggested by Equation (7). According to the Bragg width contribution, it was also found that lattice strain reduces with increasing particle size.

3.3. Transmission Electron Microscopy (TEM) Analysis

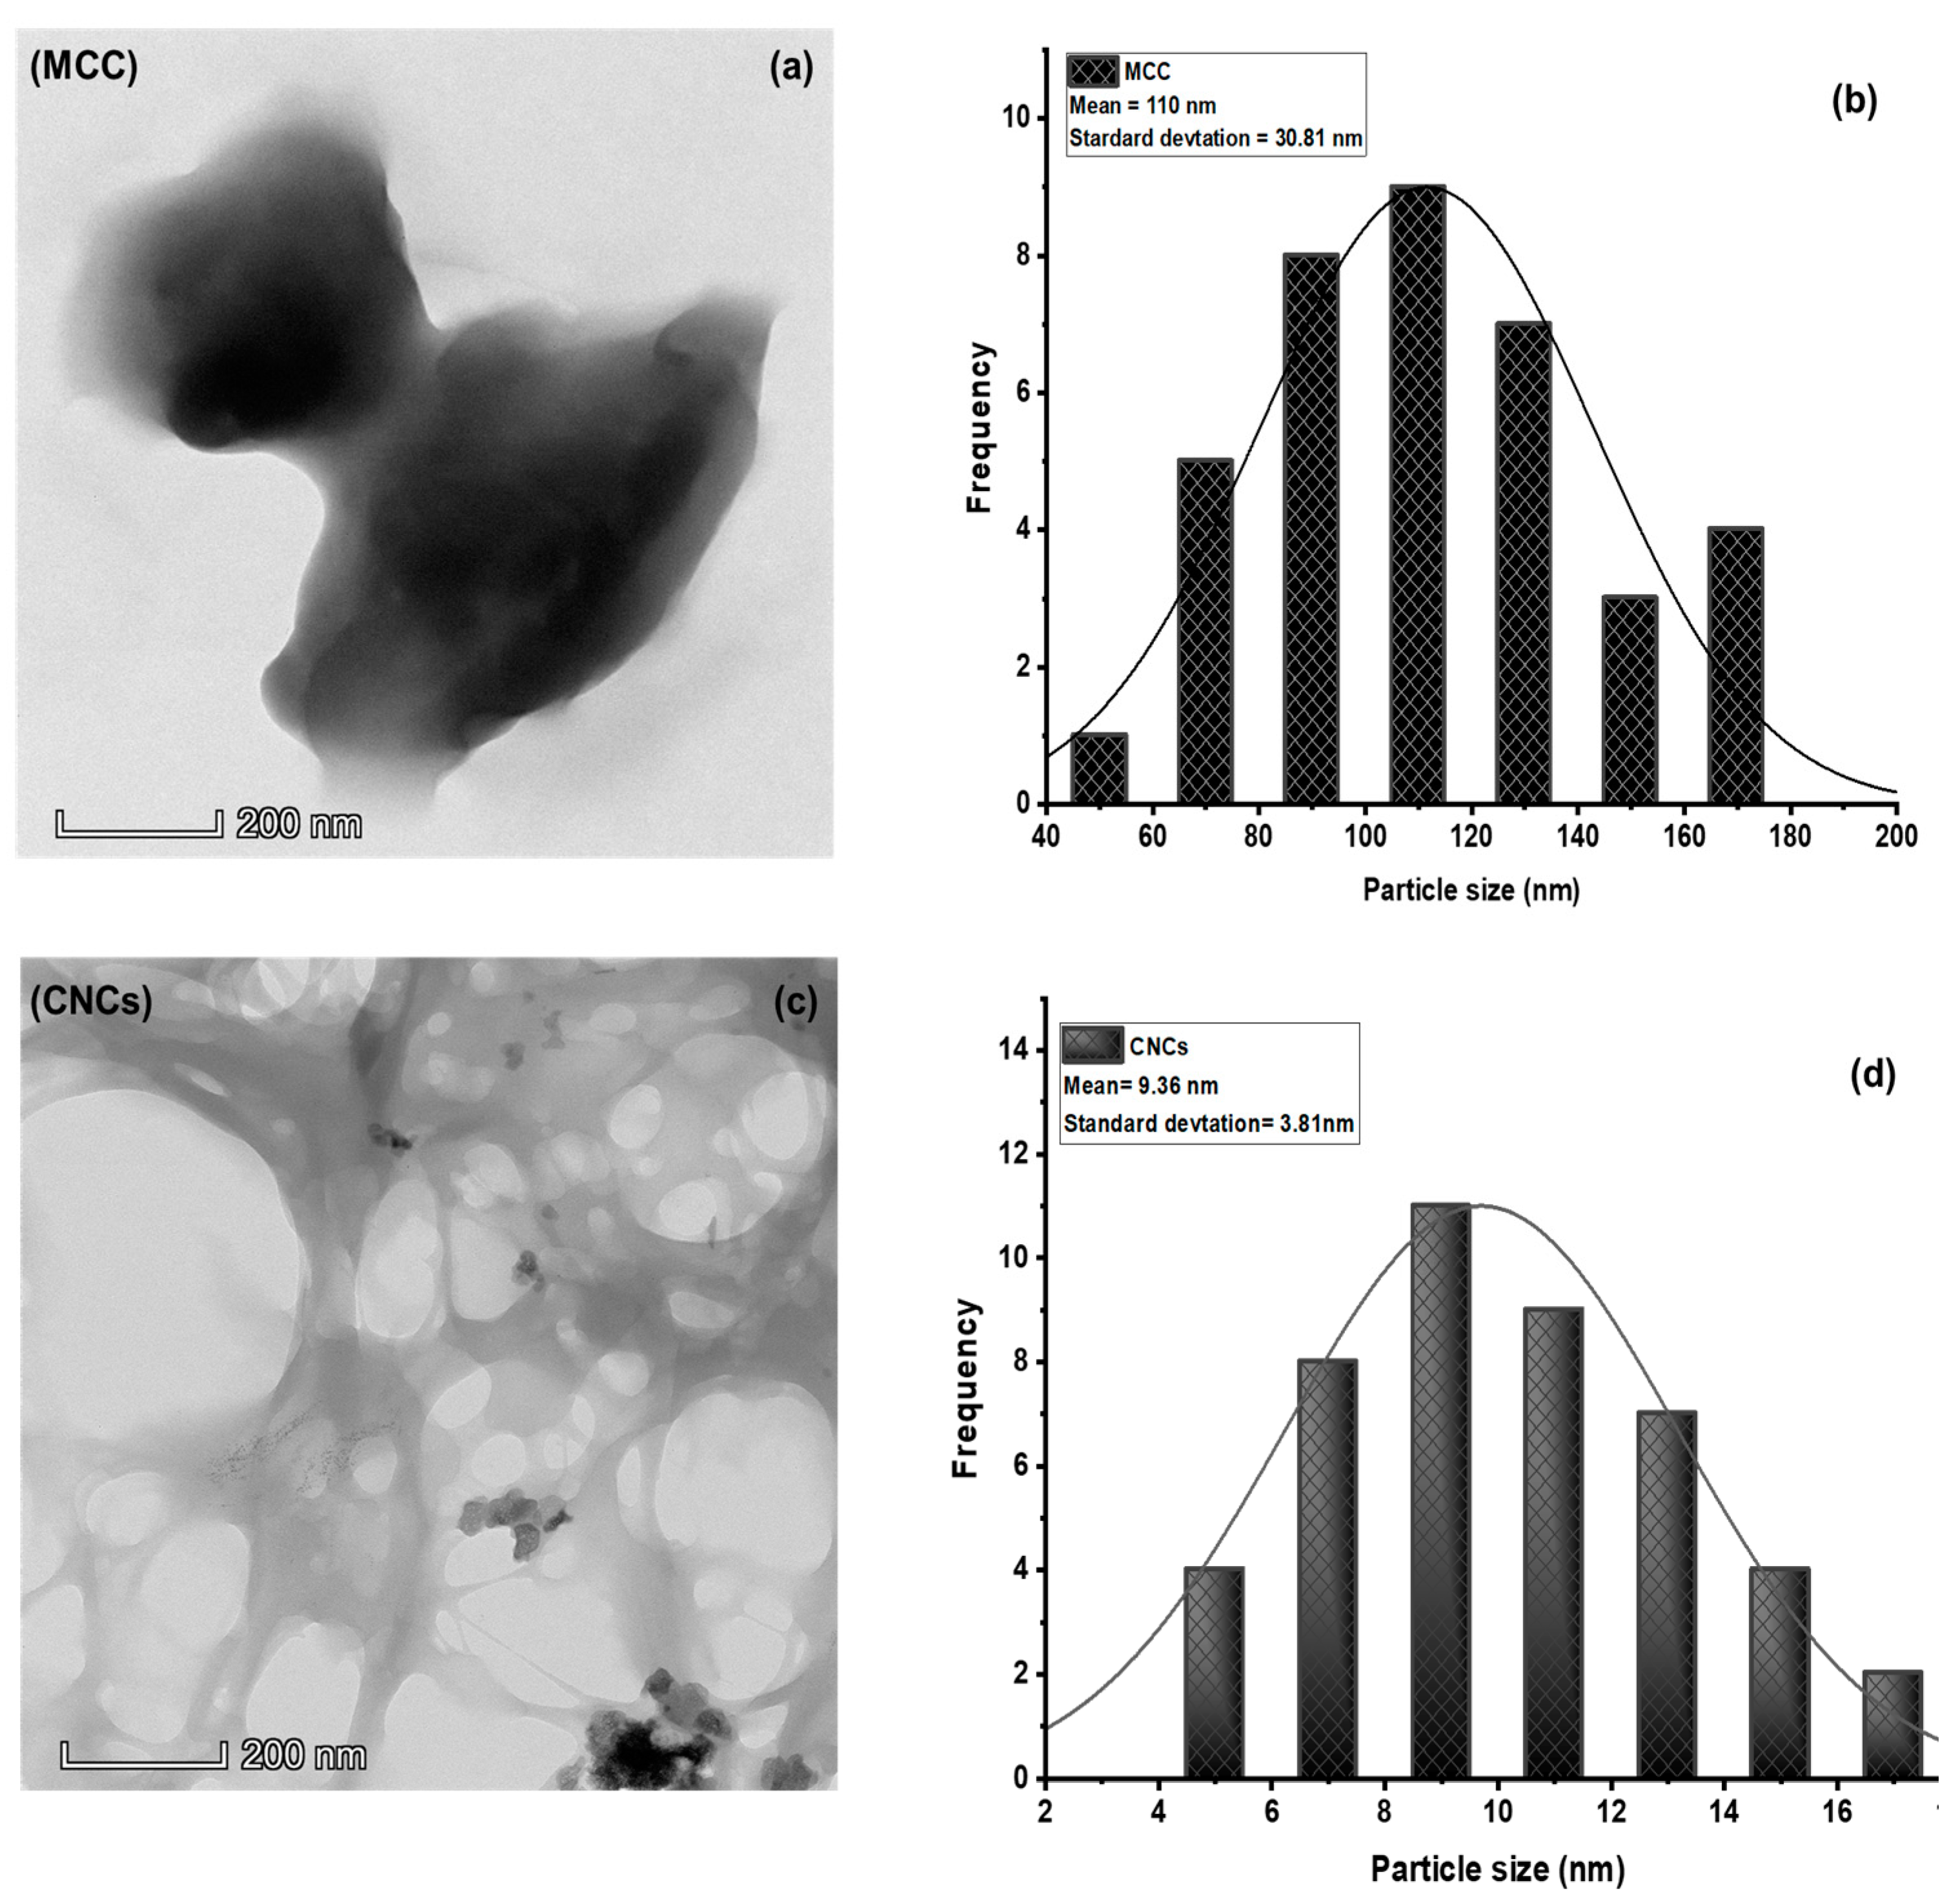
The TEM images of the MCC and CNCs samples are displayed in Figure 7 below. It is evident that processing methods and hydrolysis conditions significantly affect the nano-dimensions of cellulose’s structure. It was also found that the MCC sample was spherical, with particles averaging 110 ± 30.81 nm in size. According to published findings by Isik et al. [3], who recorded the influence of acid concentration on the form of the particle after hydrolysis, the particle size of the MCC sample reduced, and its shape altered significantly following the acid hydrolysis process. The post-hydrolysis CNCs sample also displayed a network-like structure, this time encompassing a rod-like particle that measured 9.36 ± 3.81 nm in size. Self-assembly of the short cellulose rods via interfacial hydrogen bonding led to the formation of rod-shaped nano-cellulose [40]. That is because the cellulose’s natural chemical structure has been maintained.
The net repulsion of the negative surface charges was overcome by the strong H-bonding within the CNCs structure, leading to the development of self-assembled porosity networks [41]. Over irradiation of electron beams throughout TEM observation and the freeze-drying procedure may also account for the CNCs sample network-like structure [42].

3.4. Field-Emission Scanning Electron Microscopy (FESEM) Analysis

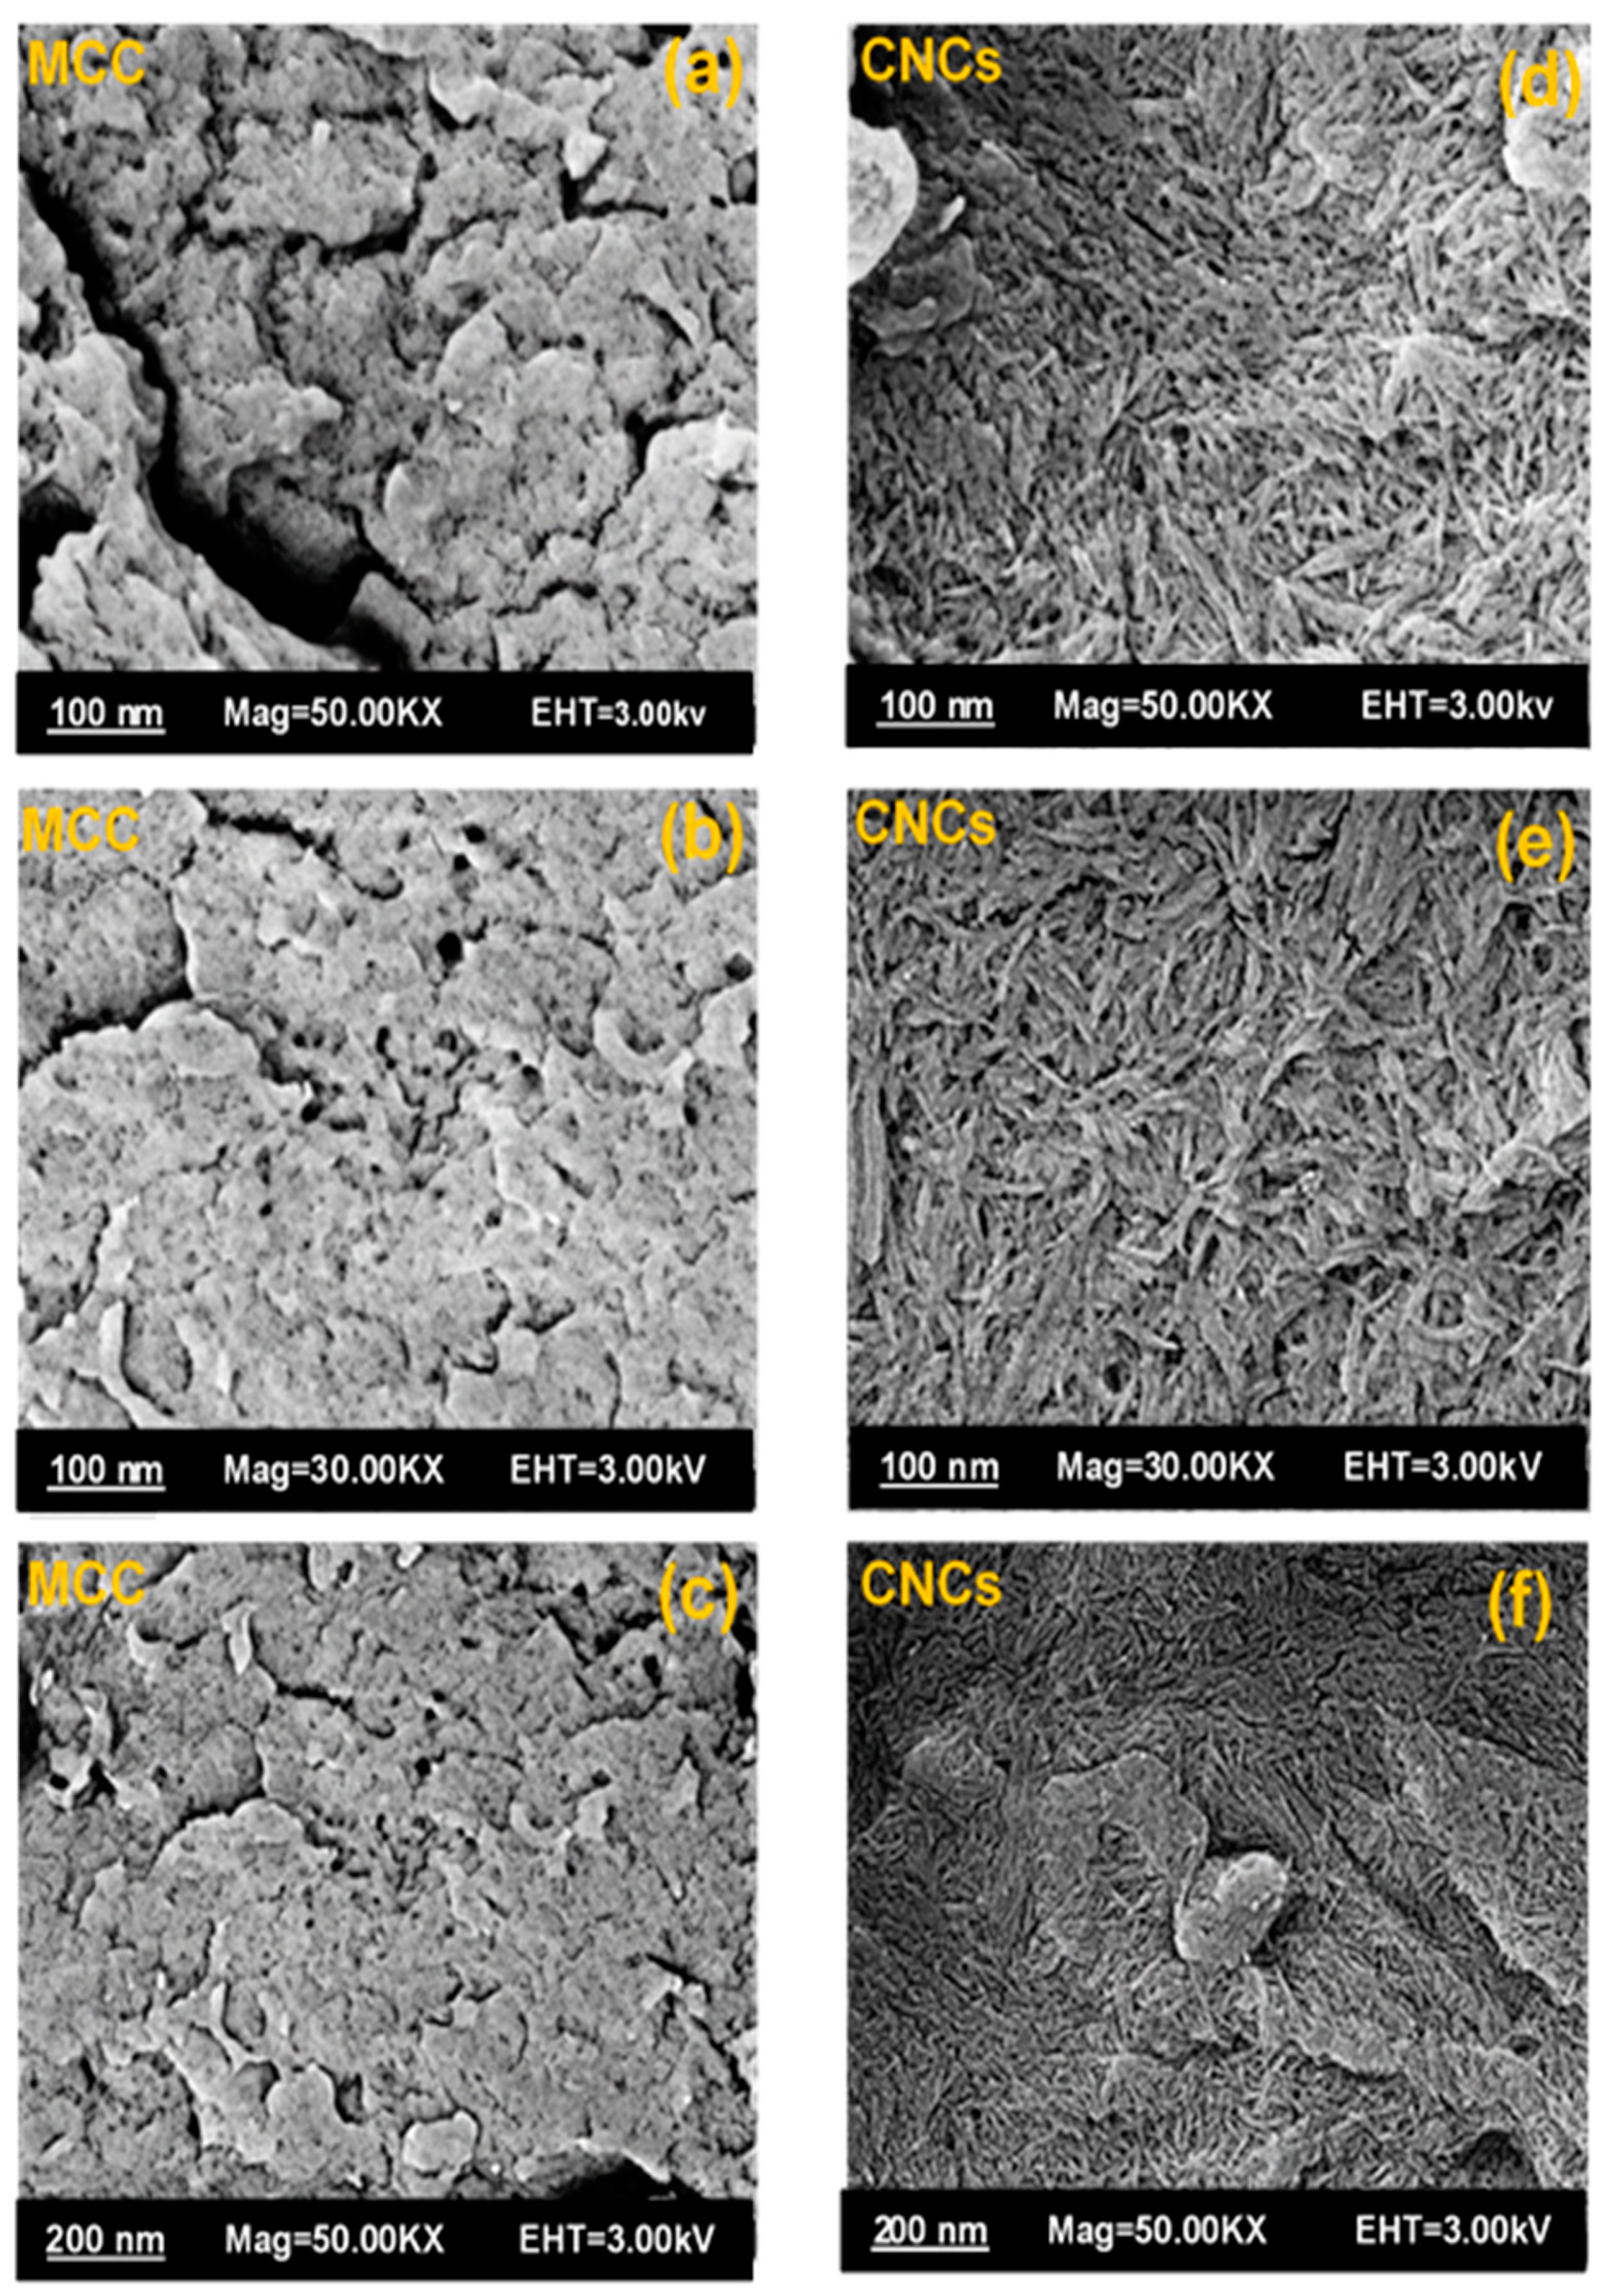
In order to evaluate how the cellulose source and hydrolysis method affected the size and characteristics of the CNCs sample, a morphological analysis was required. This was investigated using scanning electron microscopy characterization tests, the outcomes of which are displayed in the following (Figure 8).
The SEM image of the MCC sample shown in (Figure 8a–c) reveals strongly agglomerated and rough surfaces. (Figure 8d–f), displays the particle size reduction and surface morphological changes that occurred in the CNCs sample after acid hydrolysis. The produced particles had an average diameter of 7.65 ± 2.56 nm. The loss of the amorphous phase after hydrolysis made these morphological adjustments conceivable [43]. This finding corroborates the nanoparticle generation of CNCs and agrees with the XRD results. This agrees with what we saw in our TEM investigation, demonstrating that hydrolysis results in significantly smaller particles due to surface erosion [44]. Strong hydrogen bonding and hydrophilic contact were observed between the CNCs, showing that they were well bonded [45].

3.5. TGA/DTG Analysis

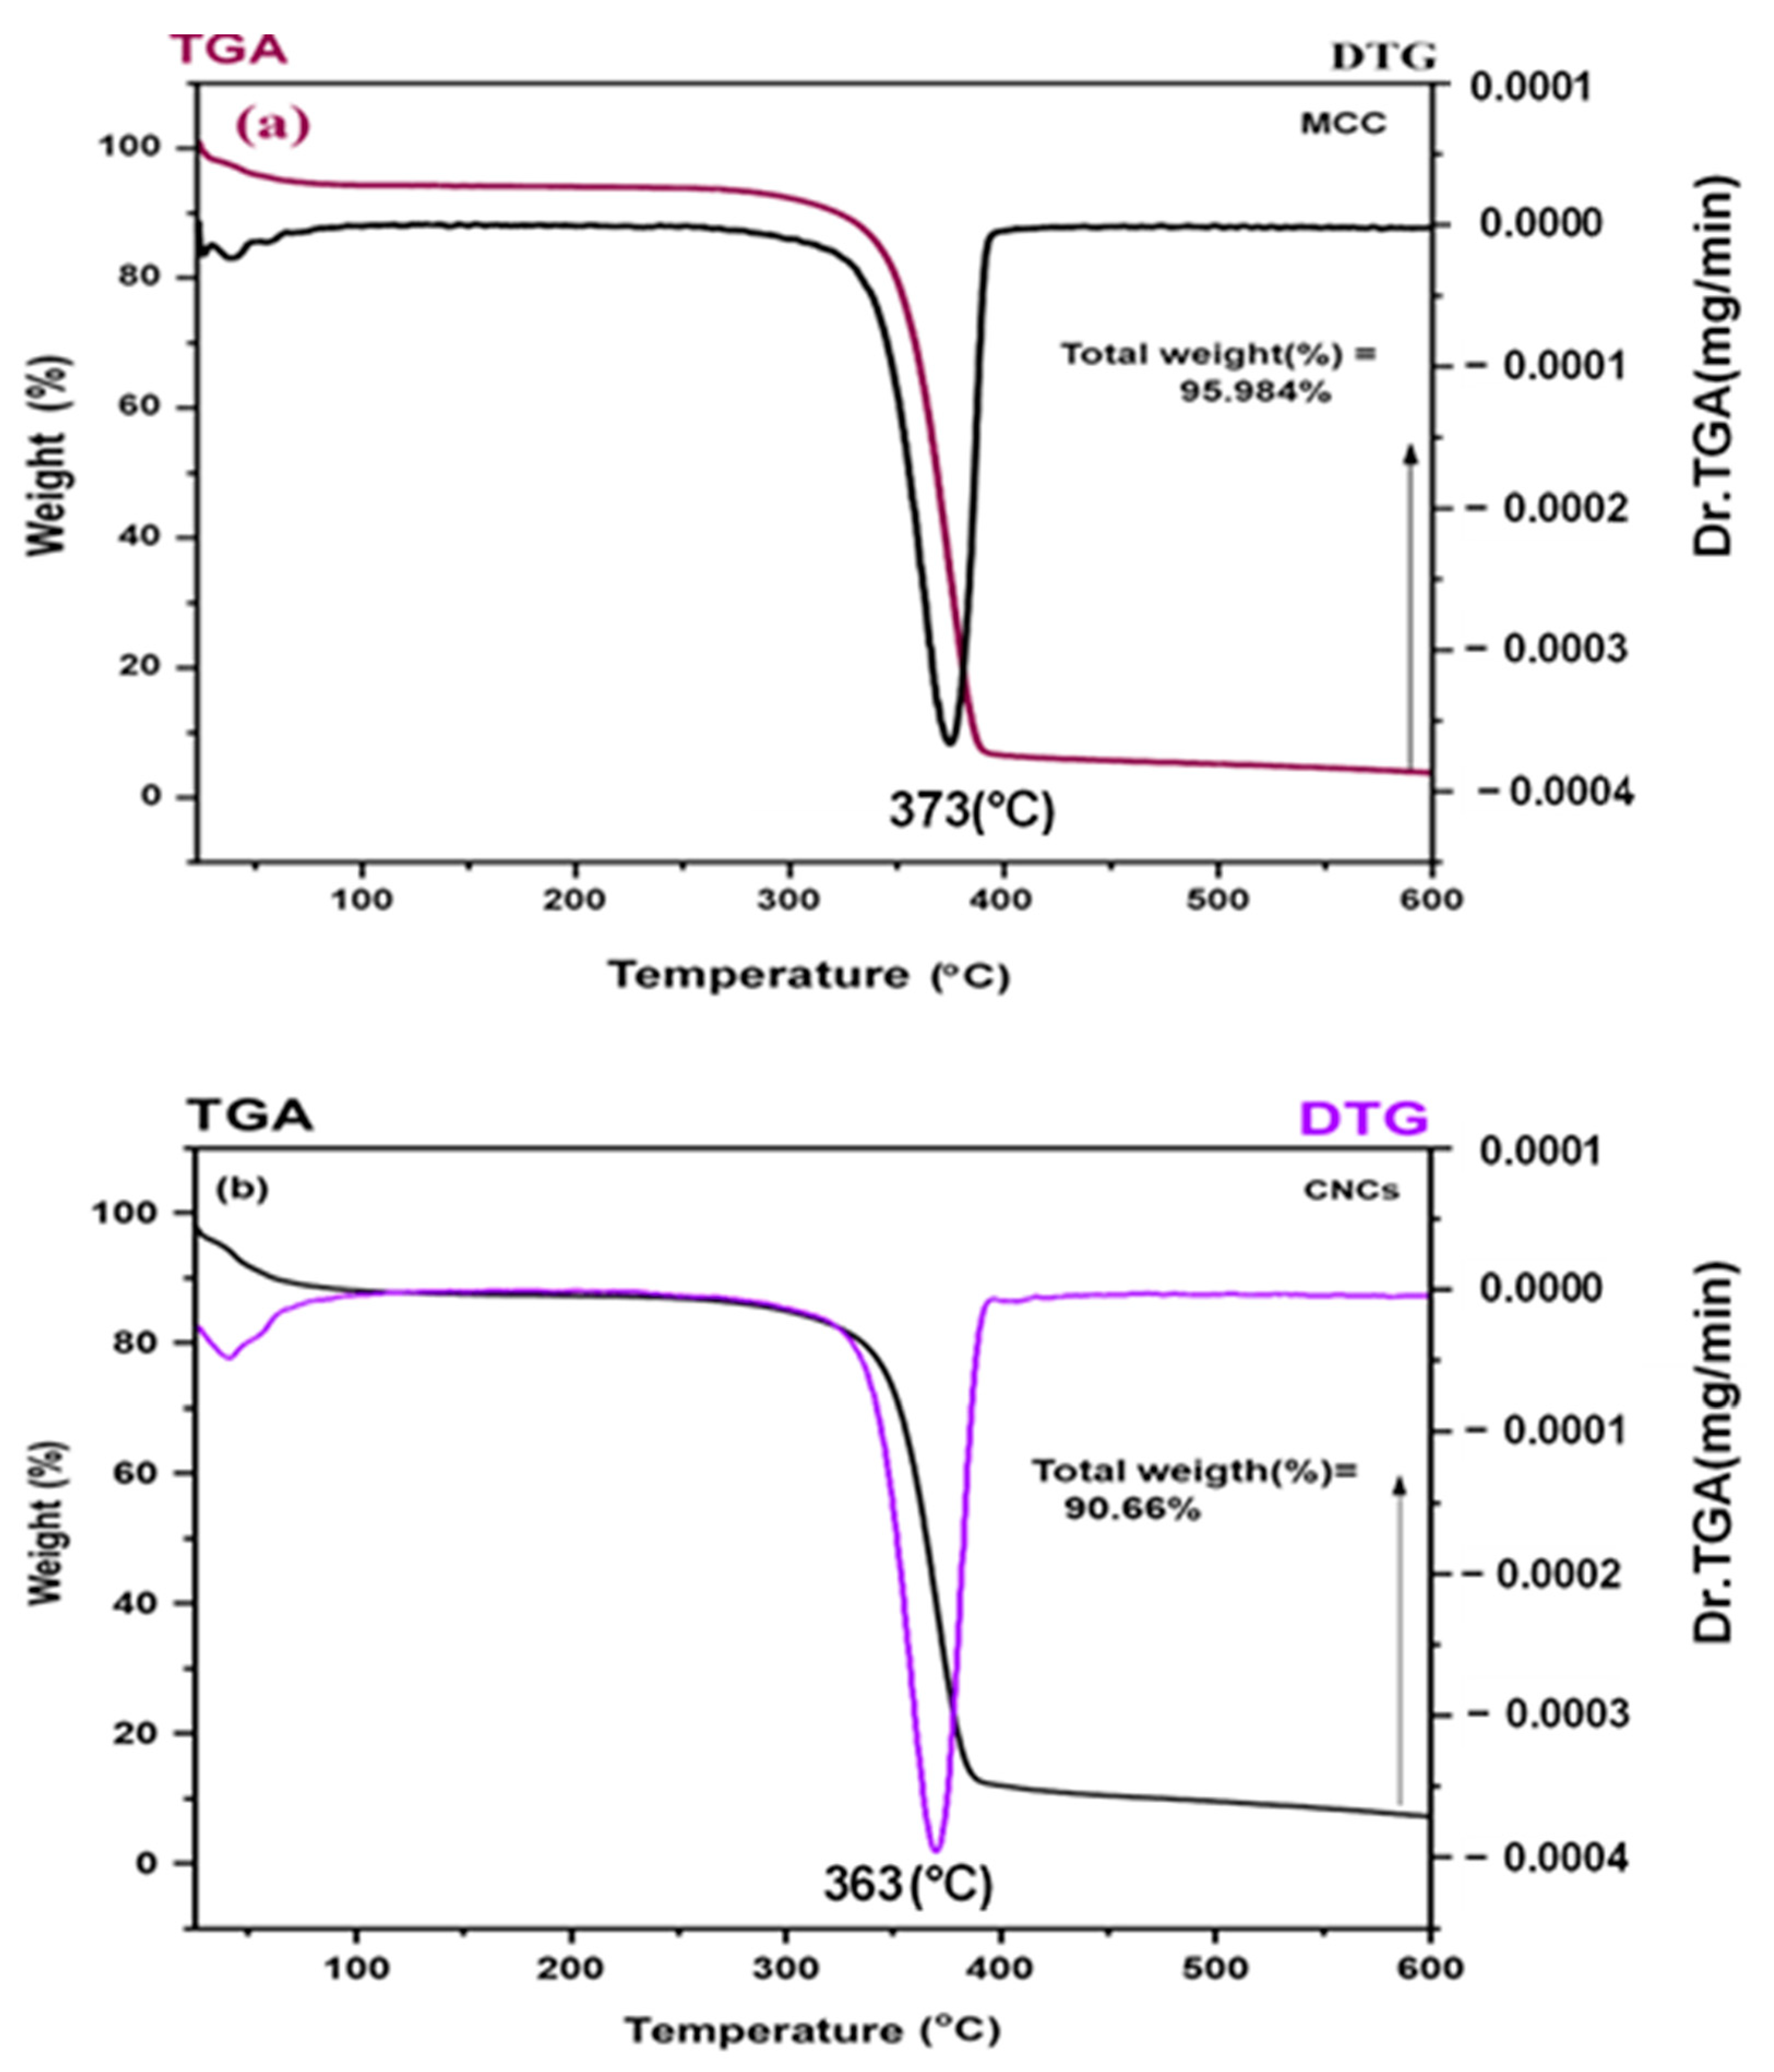
TGA and DTG curves for the MCC and CNCs samples are displayed in (Figure 9a,b) below. Two distinct stages of rapid weight reduction are depicted in the diagram. Due to their hydrophilic nature, MCC and CNCs samples lost the most weight between 25 and 100 degrees Celsius, with respective losses of 6.09% and 4.78% [46]. When compared to MCCs made from raw materials, CNCs lost the least amount of weight due to water. This coincided with the point that the CNC crystal content peaked. This is in accordance with the XRD results we looked at earlier. Between 289 and 388 degrees Celsius, cellulose depolymerization occurred, causing a loss of weight of 89.89% and 85.88%, respectively [47]. This process was responsible for the release of volatile hydrocarbons and CO2 emissions. In keeping with these results, Ting [48] reported that between 289 and 388 degrees Celsius, MCC experienced much greater weight loss than NCC.
Compared to the CNCs sample, which reached its maximum breakdown temperature at 363 °C, the MCC sample reached 373 °C. Sulfate (residual H2SO4) adsorbed on the outer surfaces of cellulose hydroxyl crystals increases the reactivity of the material with increasing temperature, causing the decomposition of CNCs chains at low temperatures, which could account for the lower thermal stability of the CNCs sample compared to the MCC sample [34]. Thus, sulfate content is one of the factors affecting the thermal stability of prepared CNCs.
Figure 9b, displays the DTG curve for the CNCs sample, which reveals two separate deterioration stages: the first, corresponding to moisture evaporation loss, and the second, attributable to cellulose disintegration approximately 310–380 °C. As Lin and Dufresne [49] revealed, sulfate groups on the surface of CNCs sample contribute to the material’s thermal instability, so our finding is in line with their findings.
Meanwhile, residues post-TGA tests were 4.02% and 9.34% for the MCC and CNCs samples, respectively. The greater residue of the CNCs sample may be due to the sulfate groups on the CNCs surface, which tend to promote the CNCs thermal degradation and remain as residue after the thermal analysis under nitrogen [5]. Moreover, the higher residue of CNCs could be due to the higher crystallinity of nanocellulose [50].
The TGA-activation energy (Ea) was quantified using the Horowitz and Metzger connection in Equation (8) in order to investigate the kinetics of the solid-state decomposition of the MCC and CNCs samples [51].
L n l n W O W T = E a θ R T s 2
where Wo is the starting mass, WT is the mass after heating to temperature T, Ts is the temperature at which 37.202% of the mass has been lost, is the difference between T and Ts, and R is the gas constant.
Activation energies for MCC and CNCs samples were calculated to be 101 and 105 kJ/mol, respectively, using Equation (8). Activation energy was seen to rise with decreasing particle size, most likely as a result of the crystalline structural shift that occurs during acid hydrolysis [52]. Moreover, compared to the MCC sample, CNCs are more crystalline. To put it another way, as particle size was reduced to nanometers, surface area was increased, allowing thermal deterioration to occur at lower temperatures [53]. When compared to the XRD pattern, this result is consistent, indicating that crystalline CNCs have indeed formed.

3.6. Zeta (ζ) Potential Characterization

In order to find out how well MCC and CNCs samples would remain suspended in water, zeta (ζ) potential measurements were performed. As can be seen in Figure 10, both the MCC and CNCs samples had negative zeta potentials of around 17.4 ± 5.32 mV and 25.6 ± 8.24 mV, respectively.
Dispersion in water was aided by the negative electrostatic layers formed on the nanocrystals due to the grafting of sulfate groups during sulfuric acid hydrolysis [54]. The sulfate groups that became linked to the CNCs chains during hydrolysis may have been responsible for the relatively larger negative zeta potential observed in the CNCs sample. They can be kept in solution because their zeta potential is less than −30, which is negative [55]. Furthermore, nanoparticles with a negative zeta potential are preferable because they can resist aggregation in a colloidal environment, leading to a wider distribution [9]. When the zeta potential of nano-cellulose is between −15 and 15 mV [56], agglomeration forms because the particles lack the necessary charges to repel each other and instead clump together. Nano-cellulose with zeta potentials between −30 mV and 30 mV [57] or 25 mV (other reports) has been reported to be a stable suspension [58].
Based on our research, we know that the CNCs sample has very negative surface charges, which indicates that there are strong electrostatic repulsive forces between the nanocrystals, which is what ultimately leads to a uniform nano-cellulose suspension. As a result of these findings, nano-cellulose has been proposed as a possible reinforcement.

3.7. Nuclear Magnetic Resonance (NMR) Analysis)

Polyethylene glycol (PEG), cellulose nanocrystals (CNCs), and cellulose solution in the aqueous PEG/NaOH solution (CNCs-PEG/NaOH) were analyzed using carbon nuclear magnetic resonances (13C-NMR). Figure 11 shows the results of the analysis. (Figure 11) displays the 13C-NMR spectrum of (CNCs-PEG/NaOH) (400 MHz, D2O, δ (ppm)).
Figure 11b represents the NMR spectrum of CNCs, and it shows the characteristic peaks of cellulose. The peak at a chemical shift of 62–66 ppm is associated with carbon C6 and is indicative of amorphous cellulose. The peak at a chemical shift of 104–107 ppm corresponds to carbon C1. The chemical shift in the range of 82–90 ppm is attributed to carbon C4, with a value of 84 ppm for amorphous cellulose chains and 89 ppm for crystalline chains. The carbons C2, C3, and C5 are represented by the region between 71–77 ppm. These carbon atoms are not involved in the β (1–4) linkage and could not be distinguished. These signals are consistent with previous studies on cellulose [59,60,61].
In addition, the 13C NMR spectra of the cellulose solution at room temperature revealed similar signals to the CNCs sample but with slight variations in intensity, as shown in (Figure 11c). Notably, new peaks were observed at 52 ppm, 63 ppm, 69.9 ppm, and 89 ppm, which are characteristic of PEG chains, as shown in (Figure 11a). These values were consistent with those reported in previous studies [62,63]. The change in the position of C4 suggested that the hydrogen bonds within the cellulose molecule were disrupted, similar to the case of wood pulp dissolved in LiCl/DMAc (as reported by [64]. Additionally, the peak at 167 ppm was attributed to C*, suggesting that one hydroxyl group converted into a carboxyl group, which was consistent with the results reported by Zheng et al. [65].

3.8. Analysis Using Field-Emission Scanning Electron Microscopy (FESEM)

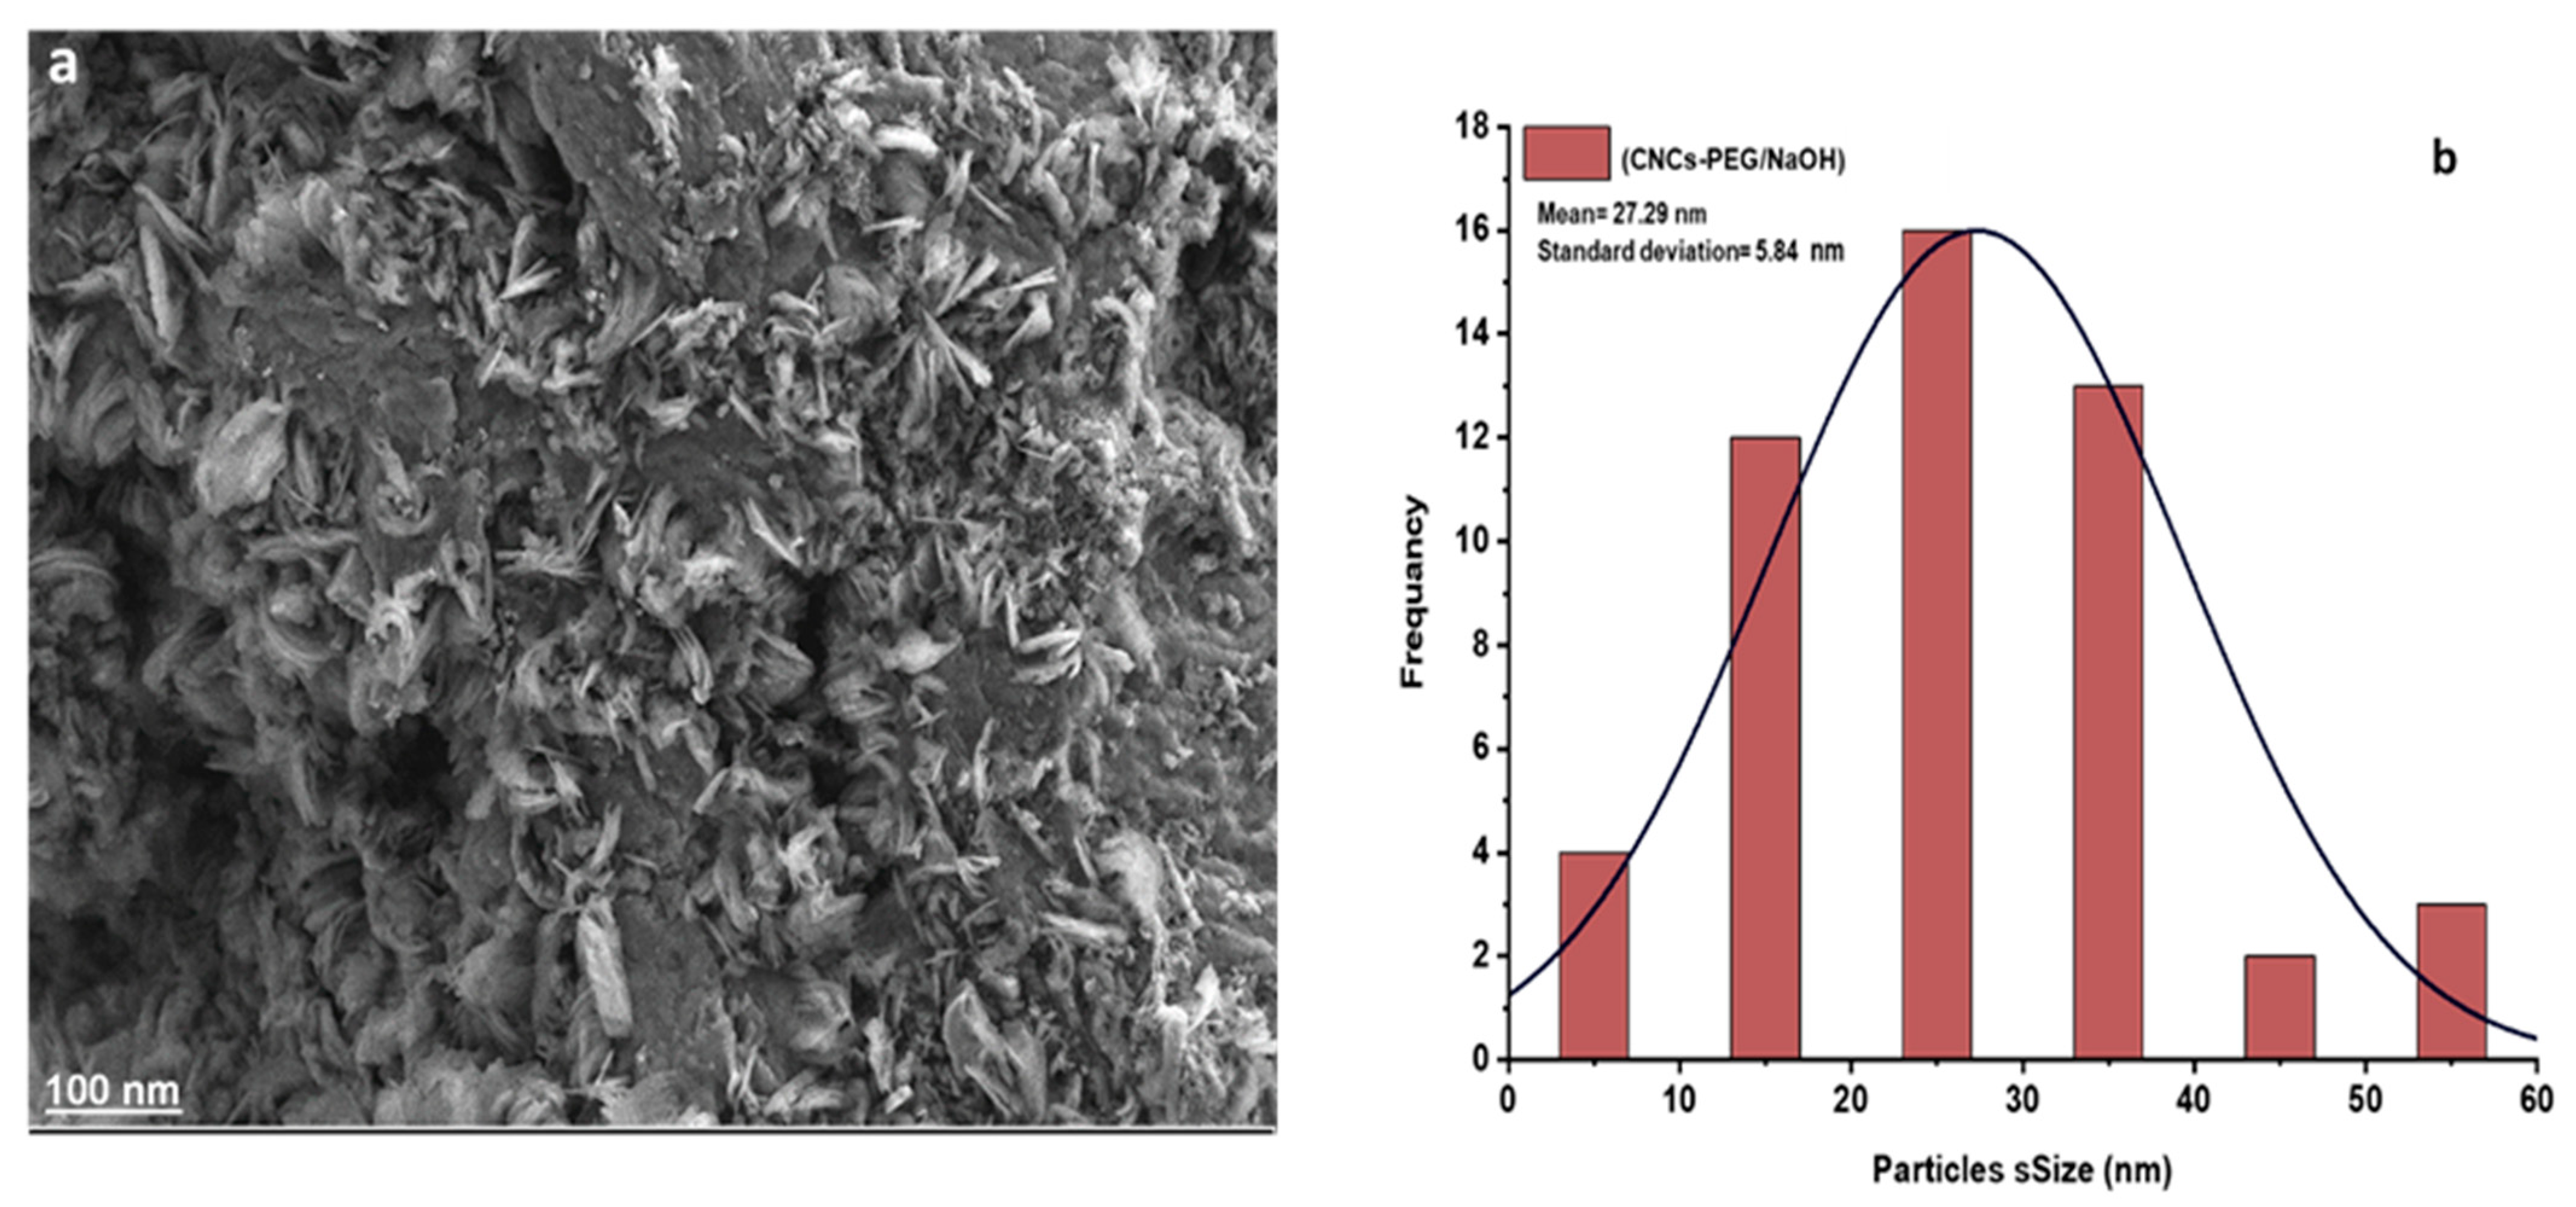
The structural homogeneity and morphology of the prepared nanomaterials were examined using FESEM. Furthermore, the FESEM images in (Figure 12a) The quasi-flower morphology of the (CNCs-PEG/NaOH) was observed with good structural homogeneity. To determine the size of the nanoparticles, Image J software was used to analyze more than 50 randomly selected particles from the FESEM micrographs shown in (Figure 12b). The micrographs revealed that the CNCs-PEG/NaOH assembled with an average diameter of 27.29 ± 5.84 nm.

3.9. Zeta (ζ) Potential Characterization

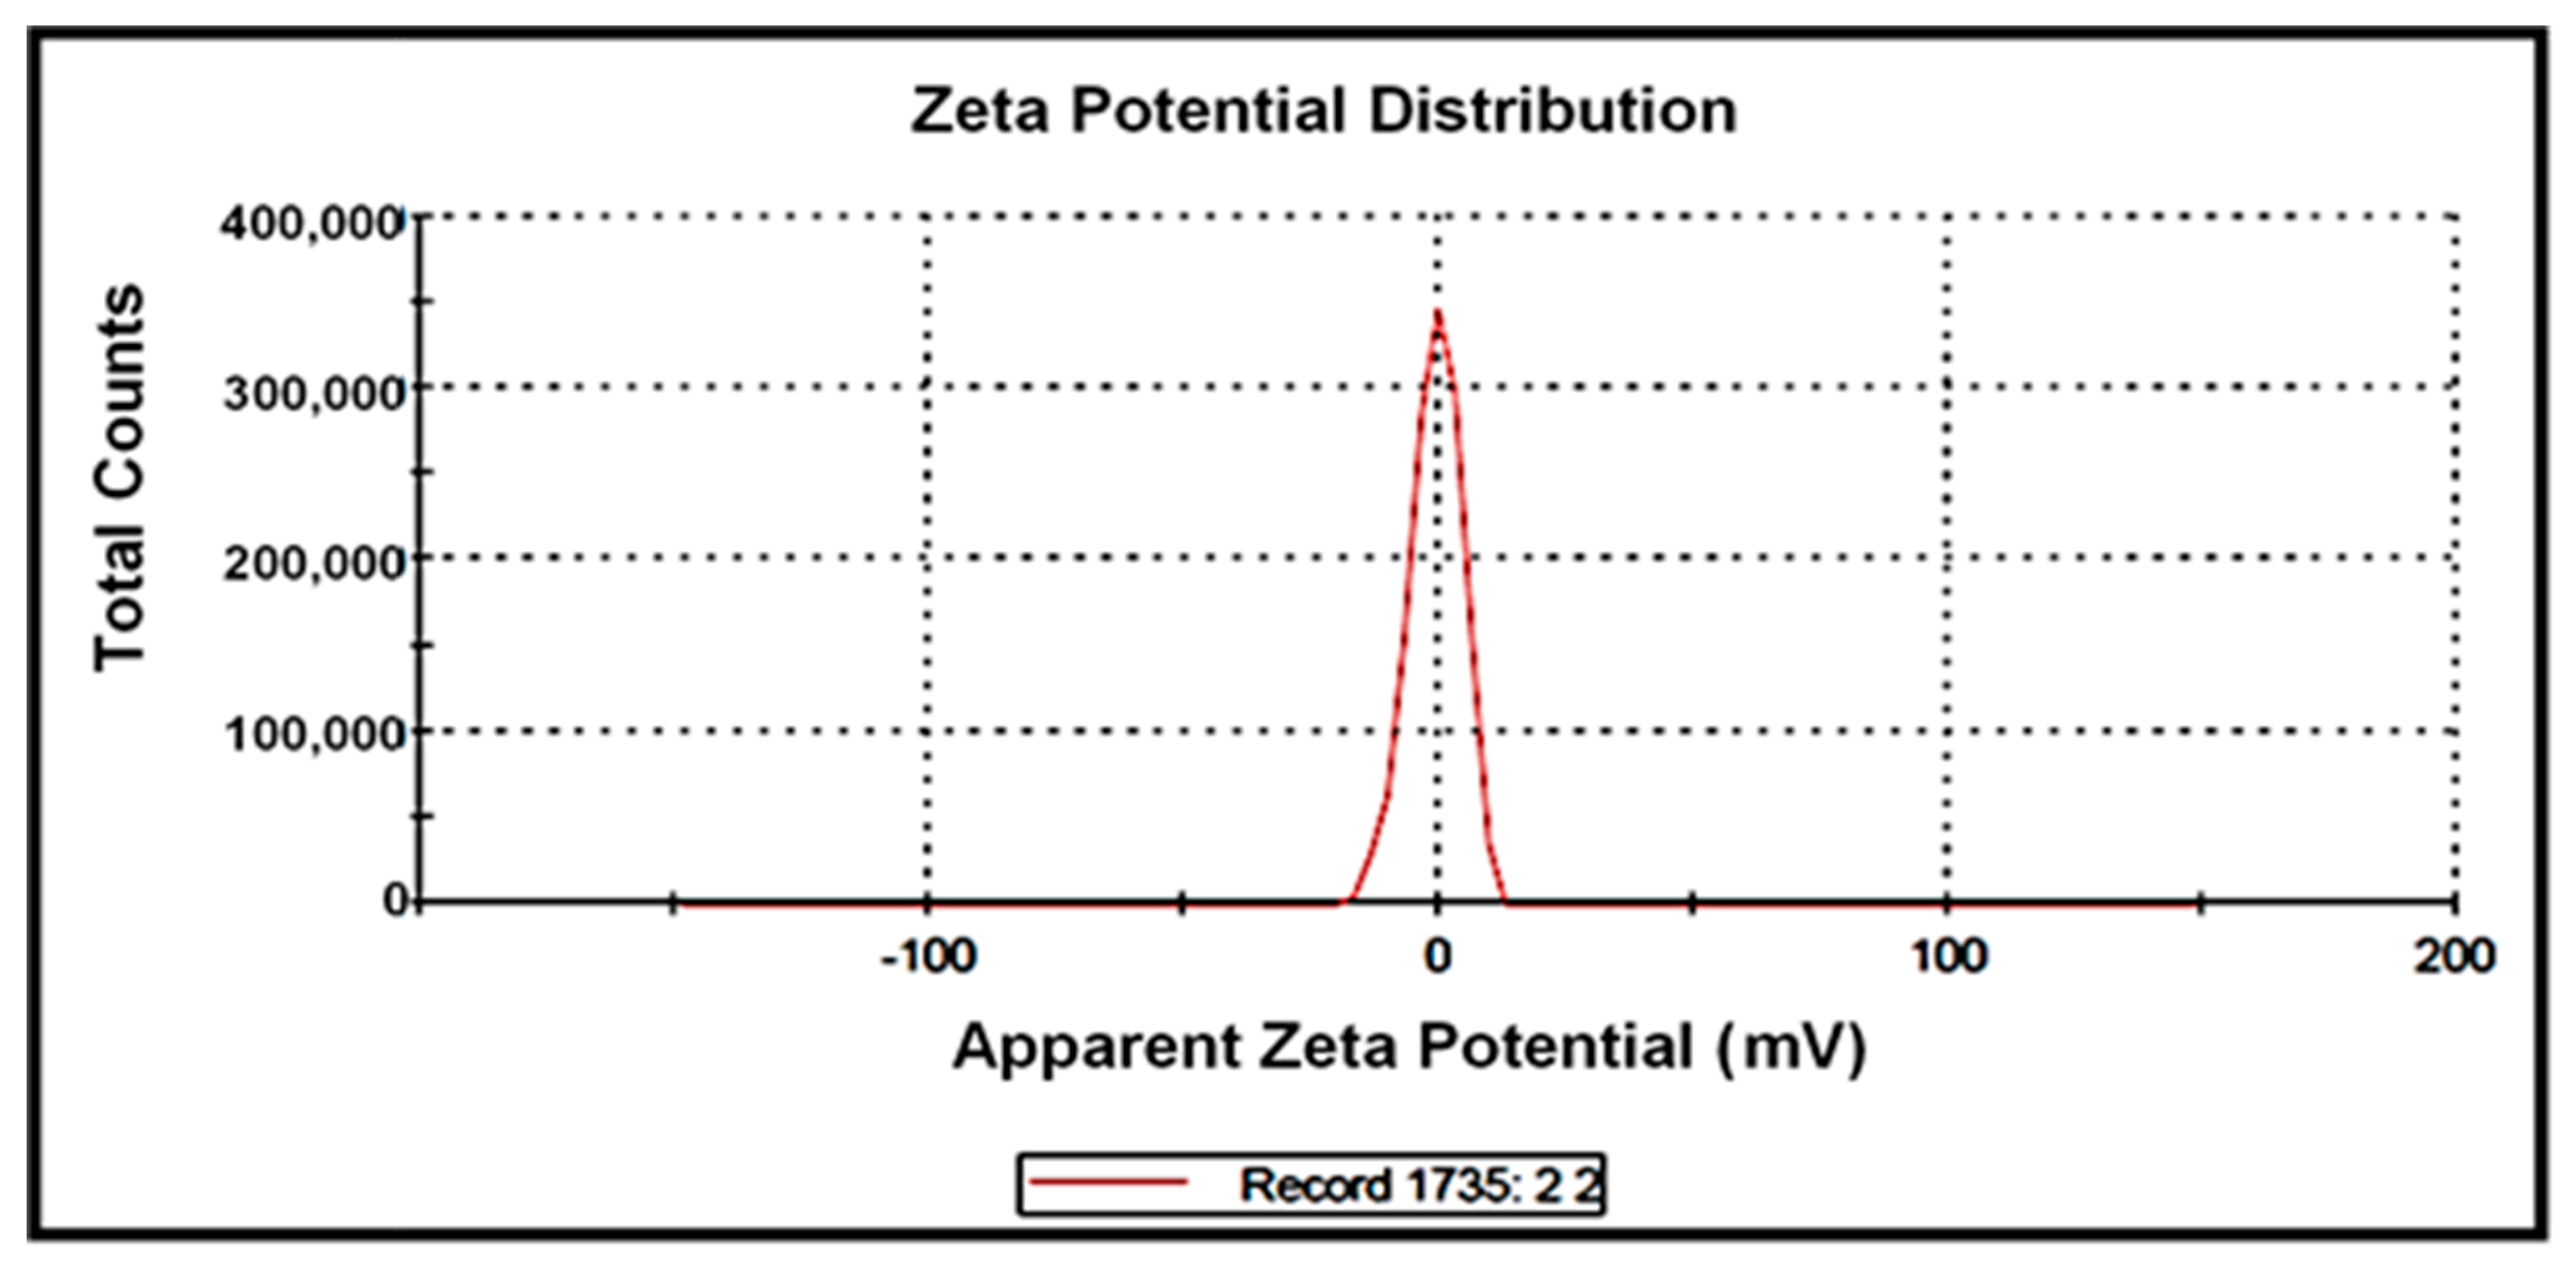
Zeta potential is employed to assess the surface charge and stability of nanoparticles, indicating their capacity to withstand agglomeration and the level of repulsion between particles carrying the same charge in dispersion. The (CNCs-PEG/NaOH sample, as illustrated in Figure 13, revealed a negative zeta potential of approximately −0.552 mV. Therefore, the negatively charged surface of the (CNCs-PEG/NaOH generates electrostatic repulsion between the nanocomposite layers. This characteristic leads to the effective dispersion of the negatively charged surface nanocomposite in a biological solution, which has a crucial impact on the interaction between nanoparticles and cells.

3.10. Dynamic Light Scattering (DLS) Analysis

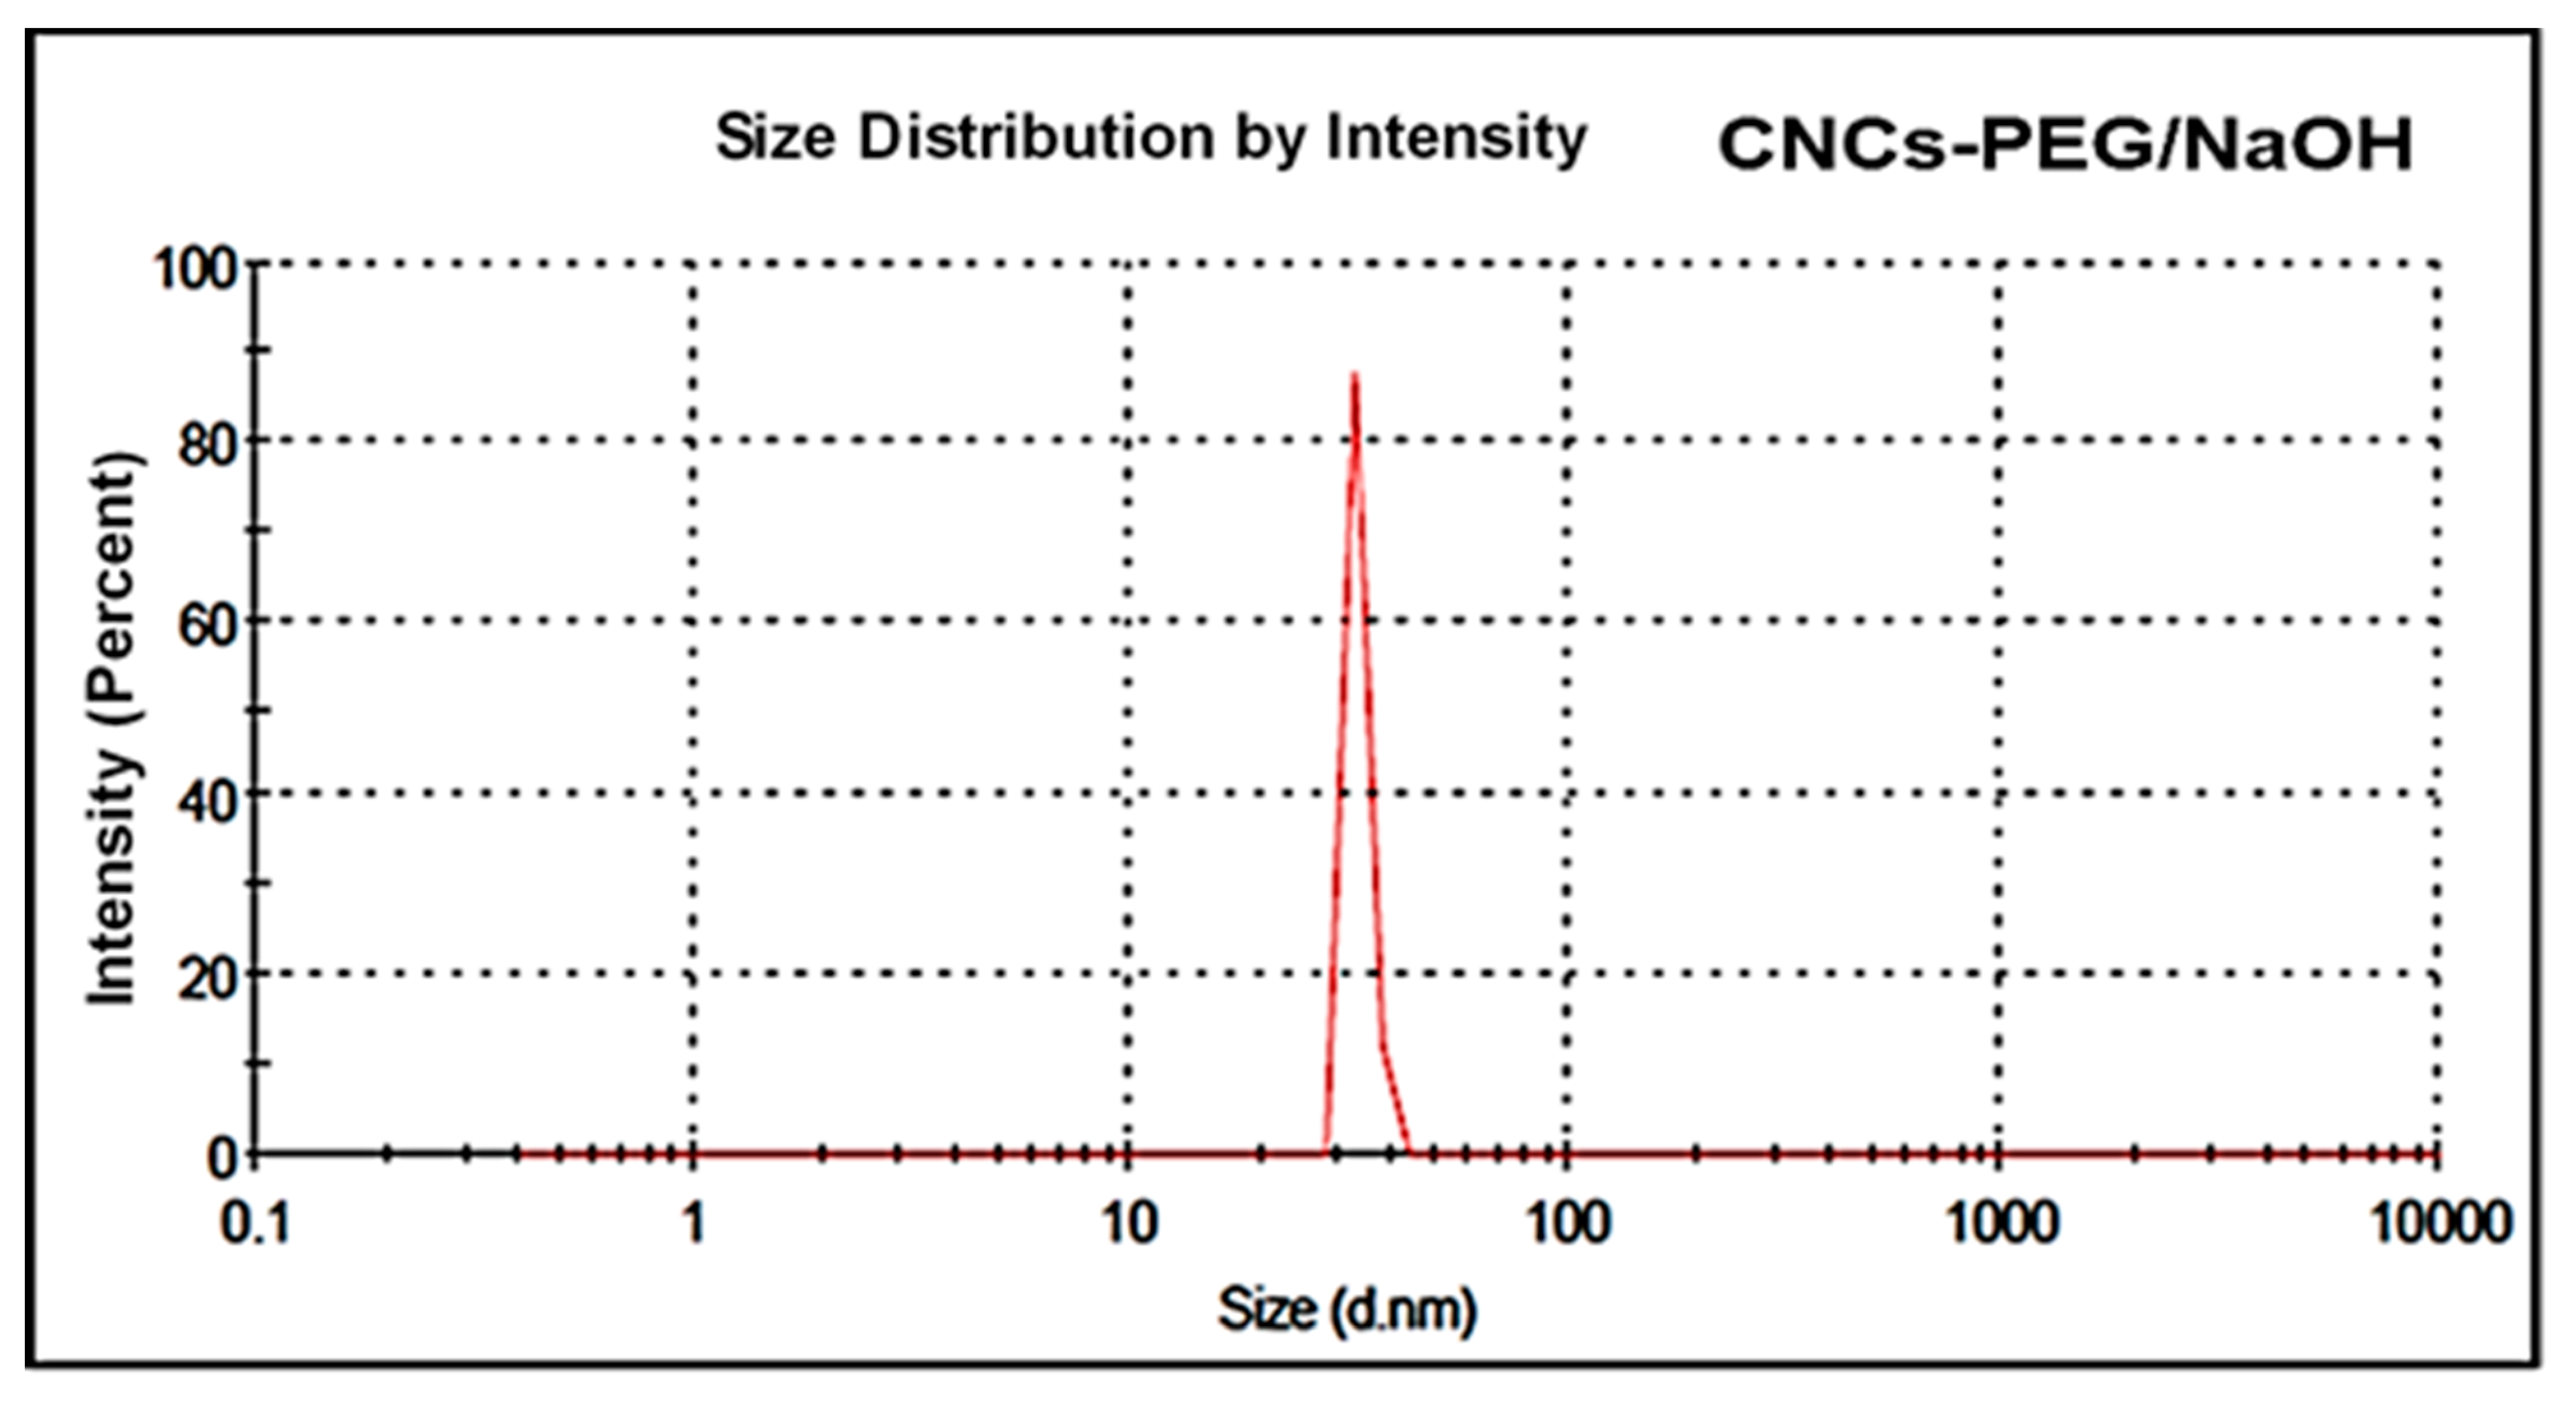
The particle size distribution was determined using dynamic light scattering (DLS). Figure 14 shows that the CNCs-PEG/NaOH had an average hydrodynamic size of 33.31 ± 1.67 nm. The polydispersity index (PDI) for the sample was found to be 1.00, indicating that the particle size distribution was relatively homogeneous.
Moreover, the DLS measurements showed larger particle sizes compared to the TEM results, which can be attributed to particle hydration. These findings are consistent with the previous study by Torkashvand and Sarlak [66].

3.11. T1-Weighted and T2-Weighted MR Images

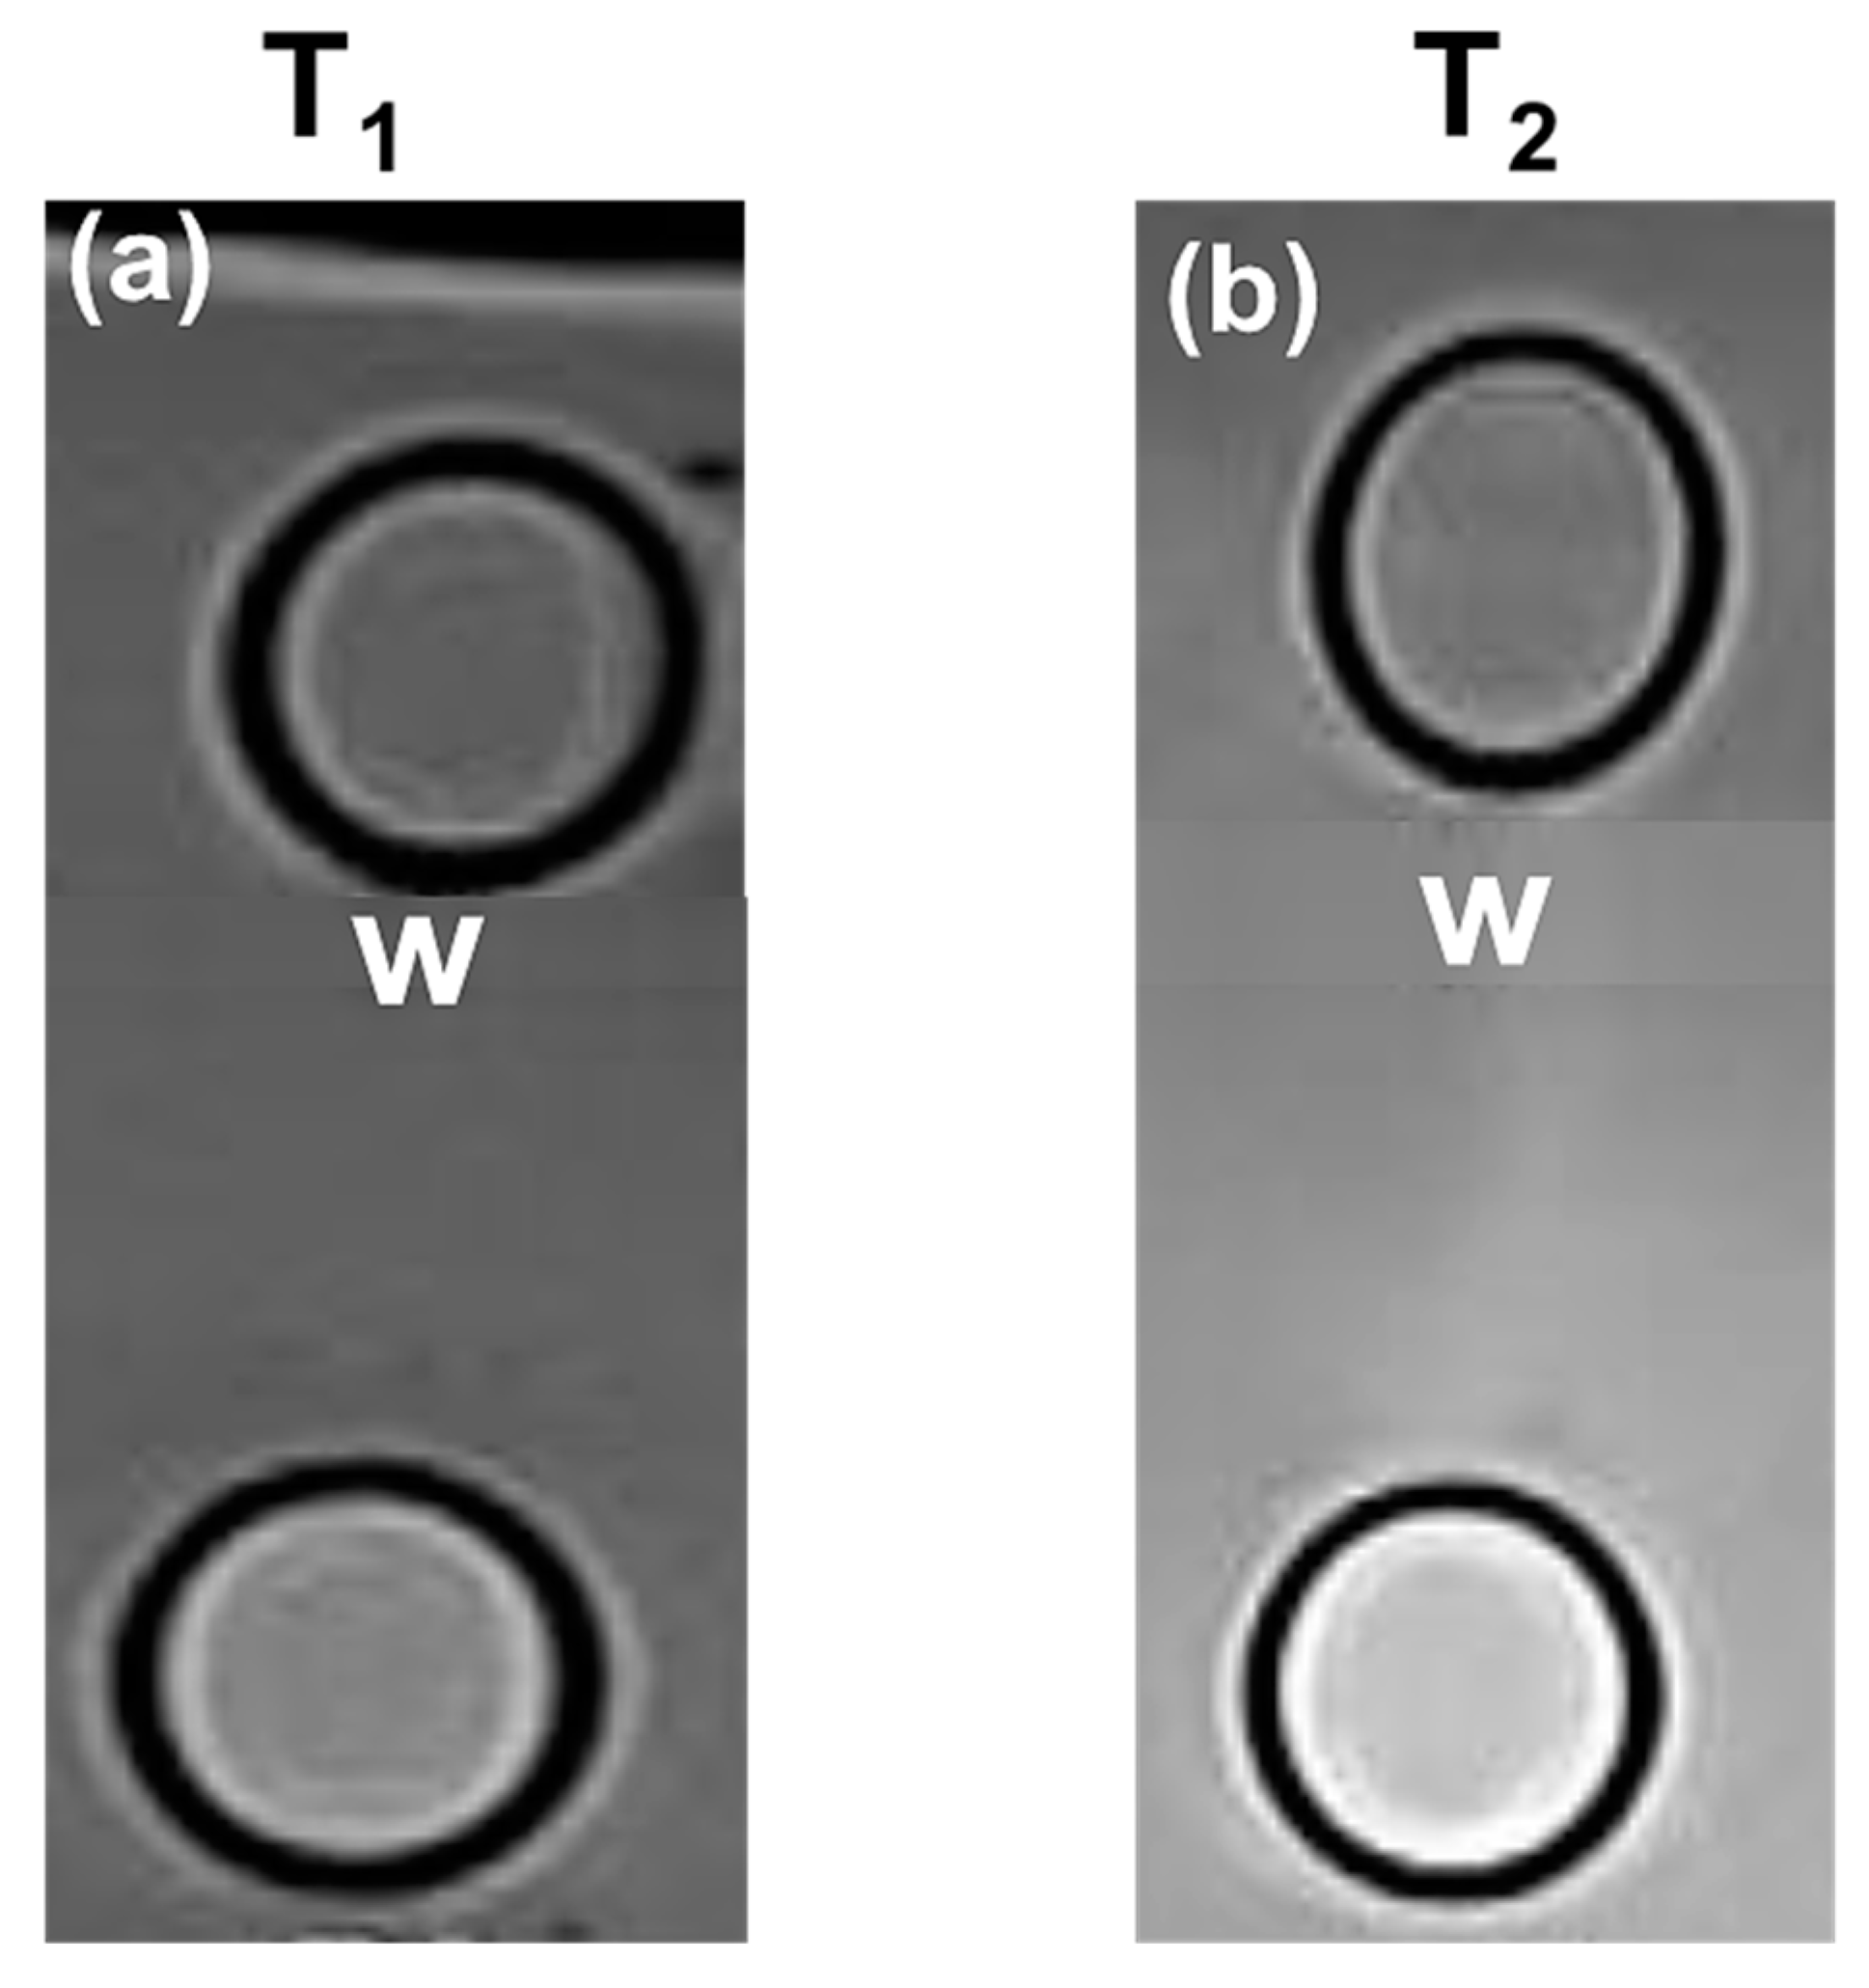
Based on the results displayed in Figure 15a,b, it can be observed that the synthesized (CNCs-PEG/NaOH) composite acts as a contrast agent, producing bright images in comparison to the water background. This is indicative of its ability to enhance T1 relaxation, leading to an increase in signal intensity on T1-weighted and T2-weighted images. These results indicate the potential of (CNCs-PEG/NaOH) as a coating agent to develop a dual-contrast composite material. This is because (CNCs-PEG/NaOH) exhibited prominent physicochemical properties such as good colloidal stability, low cytotoxicity, hydrodynamic volume, and biocompatibility.

3.12. Descriptive Statistics of MTT Assay

MTT solution with a concentration of 5 mg/mL was introduced to the well and then incubated at 37 °C in an environment with 5% carbon dioxide and 95% air humidity for 4 h. The addition of dimethyl sulfoxide (DMSO) helped to dissolve the purple formazan crystals, and a spectrophotometer was used to measure the optical density (OD) at a wavelength of 570 nm. The mean, standard deviation, and cell viability percentage were calculated as shown in (Table A4). To determine the cell viability percentage, the mean OD values of the test substance were divided by the mean OD of the negative control and then multiplied by 100. A reduction of more than 30% in cell viability is considered to be a cytotoxic effect.

3.13. Effects of Concentration of (CNCs-PEG/NaOH) on Hep G2 Cells

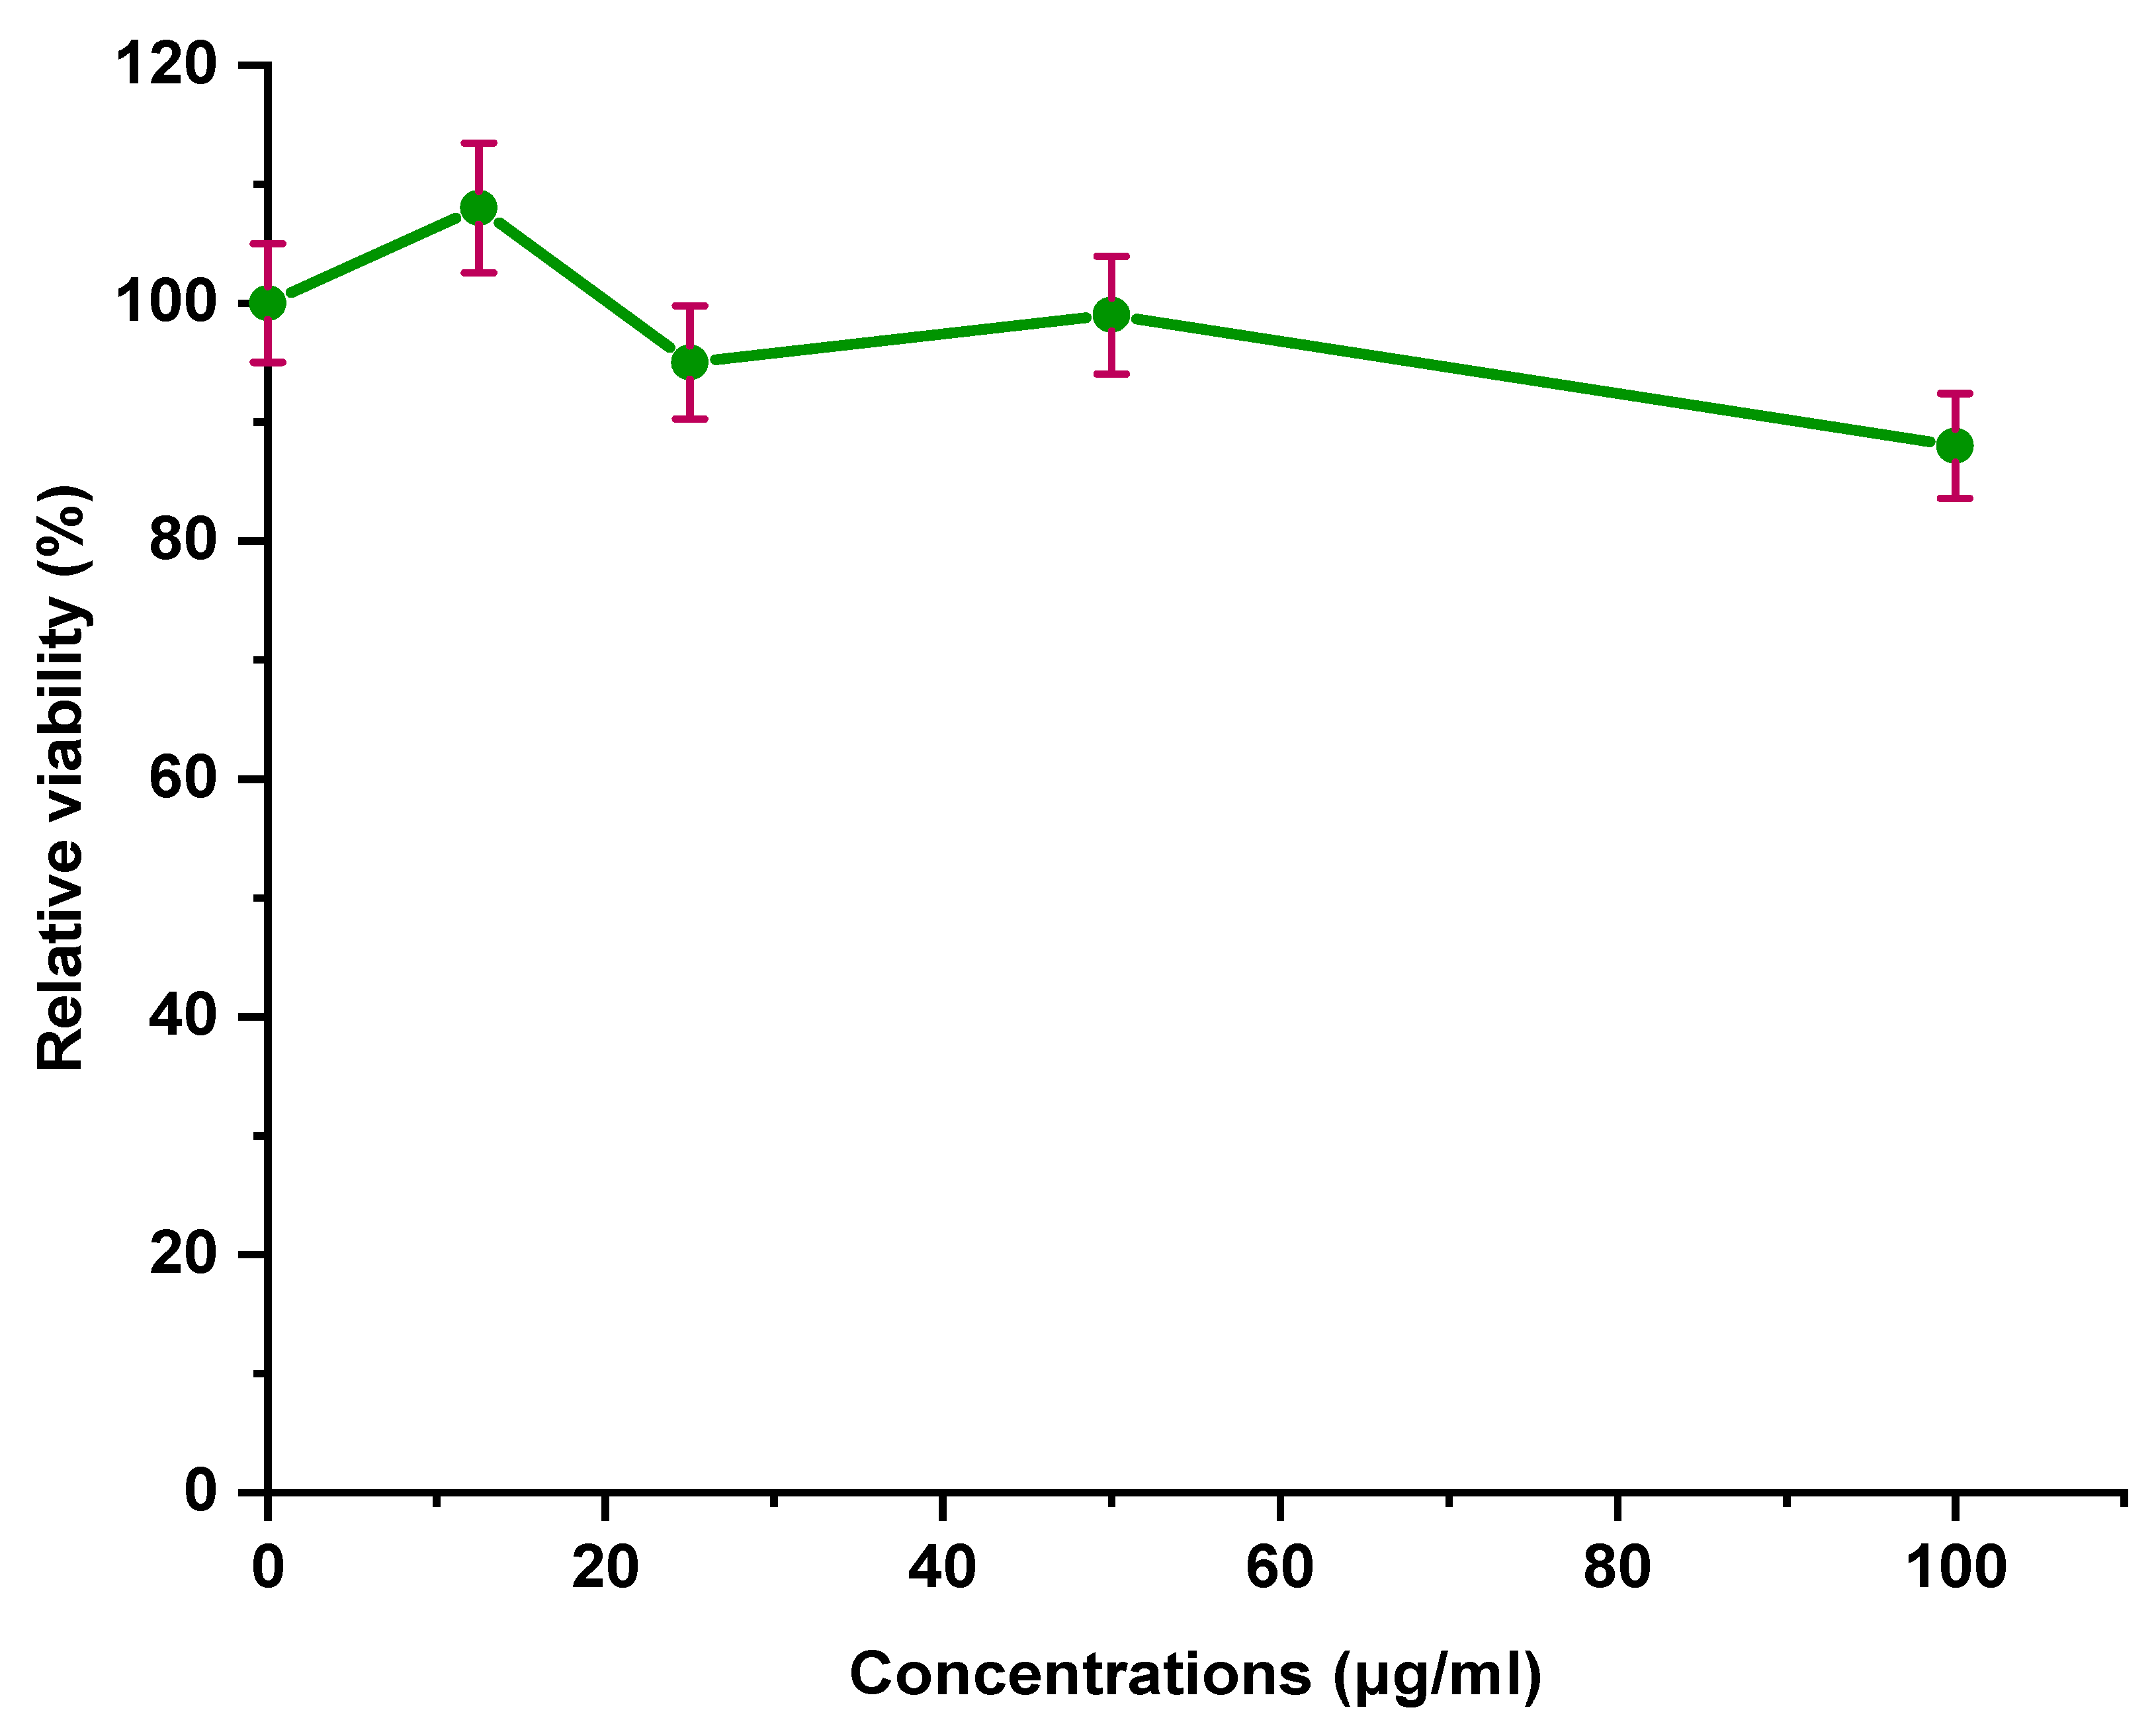
Figure 16 shows the percentage of cell survival on Hep G2 cells at a seeding density of 20,000 cells/well after incubation with (CNCs-PEG/NaOH)/at different concentrations (12.5 μg/mL, 25 μg/mL, 50 μg/mL and 100 μg/mL) [67] for 24 h at 37 °C in a humidified atmosphere consisting of 5% carbon dioxide and 95% air. In addition, if we look at the (CNCs-PEG/NaOH) sample, the survival of Hep G2 cells is decreasing and it is directly proportional to the increase in the concentration of (CNCs-PEG/NaOH) in the range of 12.5 μg/mL–100 μg/mL. Moreover, the survival of Hep G2 cells on the sample of (CNCs-PEG/NaOH) at a concentration of 100 μg/mL showed almost more than 50% cell survival (88 ± 3) less than the control cells as shown in Figure 16. Additionally, the findings indicated that the (CNCs-PEG/NaOH) displayed good biocompatibility and did not exhibit any cytotoxic effects on Hep G2 cells, indicating its suitability as an MR imaging contrast agent.

4. Conclusions

This study aimed to investigate the physicochemical properties of cellulose nanocrystals (CNCs) produced by acid hydrolysis with 64% sulfuric acid at 45 °C for 1 h. The results confirmed that CNCs with high crystallinity and nano-dimension size can be effectively synthesized through this acid hydrolysis process. The surface modification of CNCs using the hydrolysis method was successful, as evidenced by the colloidal stability and negative surface charge observed in the CNCs-PEG/NaOH sample. Moreover, biocompatibility tests on Hep G2 cells revealed that CNCs-PEG/NaOH is a safe and non-toxic material, indicating its potential as an MR imaging contrast agent. The findings of this study suggest that CNCs can be used as a coating agent to create a new dual-contrast composite material for various applications, specifically, the medical industry.

Author Contributions

Methodology, F.W.; Software, F.W.; Formal analysis, F.W. and M.I.I.; Investigation, F.W. and F.M.; Resources, F.M.; Data curation, F.W.; Writing—original draft, F.W.; Writing—review & editing, F.W. and M.S.Y.; Supervision, F.M. and M.I.I.; Funding acquisition, F.M. and M.I.I. All authors have read and agreed to the published version of the manuscript.

Funding

Open Access funding was provided by Universiti Kebangsaan Malaysia. The research was supported by the by Universiti Kebangsaan Malaysia University Research Grant No. GUP-2022-046 and GUP-2020-035.

Institutional Review Board Statement

Not applicable.

Informed Consent Statement

Not applicable.

Data Availability Statement

All authors declare that all data and materials support their published claims and comply with field standards.

Acknowledgments

The authors acknowledge Universiti Kebangsaan Malaysia (UKM) for supporting this project, the Ministry of Higher Education of the Republic of Yemen for its financial assistance, the Faculty of Science and Technology (FST) for the technical support, the Centre for Research, and Instrumentation Management (CRIM) Universiti Kebangsaan Malaysia (UKM) for the facilities, and Radiology Department of National Cancer Institute Malaysia for their provision of laboratory facilities and services in support of this research.

Conflicts of Interest

The authors declare no conflict of interest.

Appendix A

Table A1. Calculated values of samples yield percentage.
SamplesWeight InitialWeight after Hydrolysis% Yield
CNCs0.50.44589%
CNCs-PEG/NaOH12.51188%
Table A2. Calculated values crystallinity index percentage of MCC and CNCs.
SamplesIaIbCrystallinity Index (%)
MCC70900.78
CNCs1201390.86
Table A3. Calculated values of crystallinity (I002) percentage of MCC and CNCs.
SamplesIcrIamCrystallinity (I222) (%)
MCC93.8023.5474.90
CNCs76.6612.3983.84
Table A4. Hep G2 Cells viability obtained after 24 h of CNCs-PEG/NaOH.
Viability (%)ReplicatePositive Control (10 mM)Negative ControlResponses of (CNCs-PEG/NaOH)/(μg/mL)
12.52550100
n = 113100106959885
n = 2100110979989
n = 31001089510090
MeanNA100108959988
Standard Error MeanNA02233
NA: Not Available.

References

  1. Coseri, S. Cellulose: To depolymerize… or not to? Biotechnol. Adv. 2017, 35, 251–266. [Google Scholar] [CrossRef] [PubMed]
  2. Ioelovich, M. Nanoparticles of Amorphous Cellulose and Their Properties. Am. J. Nanosci. Nanotechnol. 2013, 1, 41–45. [Google Scholar] [CrossRef]
  3. Isik, M.; Sardon, H.; Mecerreyes, D. Ionic Liquids and Cellulose: Dissolution, Chemical Modification and Preparation of New Cellulosic Materials. Int. J. Mol. Sci. 2014, 15, 11922–11940. [Google Scholar] [CrossRef]
  4. Chang, C.; Zhang, L.; Zhou, J.; Zhang, L.; Kennedy, J.F. Structure and properties of hydrogels prepared from cellulose in NaOH/urea aqueous solutions. Carbohydr. Polym. 2010, 82, 122–127. [Google Scholar] [CrossRef]
  5. Fatona, A.; Berry, R.M.; Brook, M.A.; Moran-Mirabal, J.M. Versatile Surface Modification of Cellulose Fibers and Cellulose Nanocrystals through Modular Triazinyl Chemistry. Chem. Mater. 2018, 30, 2424–2435. [Google Scholar] [CrossRef]
  6. Grishkewich, N.; Mohammed, N.; Tang, J.; Tam, K.C. Recent advances in the application of cellulose nanocrystals. Curr. Opin. Colloid Interface Sci. 2017, 29, 32–45. [Google Scholar] [CrossRef]
  7. Mandal, A.; Chakrabarty, D. Isolation of nanocellulose from waste sugarcane bagasse (SCB) and its characterization. Carbohydr. Polym. 2011, 86, 1291–1299. [Google Scholar] [CrossRef]
  8. Salas, C.; Nypelö, T.; Rodriguez-Abreu, C.; Carrillo, C.; Rojas, O.J. Nanocellulose properties and applications in colloids and interfaces. Curr. Opin. Colloid Interface Sci. 2014, 19, 383–396. [Google Scholar] [CrossRef]
  9. Wulandari, W.T.; Rochliadi, A.; Arcana, I.M. Nanocellulose prepared by acid hydrolysis of isolated cellulose from sugarcane bagasse. IOP Conf. Ser. Mater. Sci. Eng. 2016, 107, 012045. [Google Scholar] [CrossRef]
  10. Endes, C.; Camarero-Espinosa, S.; Mueller, S.; Foster, E.J.; Petri-Fink, A.; Rothen-Rutishauser, B.; Clift, M.J.D. A critical review of the current knowledge regarding the biological impact of nanocellulose. J. Nanobiotechnol. 2016, 14, 1–14. [Google Scholar] [CrossRef]
  11. Brinchi, L.; Cotana, F.; Fortunati, E.; Kenny, J. Production of nanocrystalline cellulose from lignocellulosic biomass: Technology and applications. Carbohydr. Polym. 2013, 94, 154–169. [Google Scholar] [CrossRef] [PubMed]
  12. Listyanda, R.F.; Wildan, M.W.; Ilman, M.N. Preparation and characterization of cellulose nanocrystal extracted from ramie fibers by sulfuric acid hydrolysis. Heliyon 2020, 6, 05486. [Google Scholar] [CrossRef]
  13. Roman, M. Toxicity of Cellulose Nanocrystals: A Review. Ind. Biotechnol. 2015, 11, 25–33. [Google Scholar] [CrossRef]
  14. Yang, S.; Peng, L.; Liu, E.; He, L.; Guan, Q.; Zhang, J.; Peng, L. Development of a general kinetic model for organic acid-catalyzed hydrolysis of corn stalk. Cellulose 2021, 28, 6935–6952. [Google Scholar] [CrossRef]
  15. Chu, Y.; Song, R.; Zhang, L.; Dai, H.; Wu, W. Water-dispersible, biocompatible and fluorescent poly(ethylene glycol)-grafted cellulose nanocrystals. Int. J. Biol. Macromol. 2020, 153, 46–54. [Google Scholar] [CrossRef]
  16. Ghasemlou, M.; Daver, F.; Ivanova, E.P.; Habibi, Y.; Adhikari, B. Surface modifications of nanocellulose: From synthesis to high-performance nanocomposites. Prog. Polym. Sci. 2021, 119, 101418. [Google Scholar] [CrossRef]
  17. Long, W.; Ouyang, H.; Hu, X.; Liu, M.; Zhang, X.; Feng, Y.; Wei, Y. State-of-art review on preparation, surface functionalization and biomedical applications of cellulose nanocrystals-based materials. Int. J. Biol. Macromol. 2021, 186, 591–615. [Google Scholar] [CrossRef]
  18. Zhang, L.; Liu, Y.; Zhang, Q.; Li, T.; Yang, M.; Yao, Q.; Hu, H.-Y. Gadolinium-Labeled Aminoglycoside and Its Potential Application as a Bacteria-Targeting Magnetic Resonance Imaging Contrast Agent. Anal. Chem. 2018, 90, 1934–1940. [Google Scholar] [CrossRef]
  19. Cao, Y.-B.; Ren, H.-T.; Hu, C.-S.; Meng, Q.-X.; Liu, Q. In-situ formation behavior of NbC-reinforced Fe-based laser cladding coatings. Mater. Lett. 2015, 147, 61–63. [Google Scholar] [CrossRef]
  20. Zhang, M.; Cao, Y.; Chong, Y.; Ma, Y.; Zhang, H.; Deng, Z.; Zhang, Z. Graphene oxide based theranostic platform for T1-weighted magnetic resonance imaging and drug delivery. Appl. Mater. Interfaces 2013, 5, 13325–13332. [Google Scholar] [CrossRef]
  21. Lu, X.; Zhou, H.; Liang, Z.; Feng, J.; Lu, Y.; Huang, L.; Shen, Z. Biodegradable and biocompatible exceedingly small magnetic iron oxide nanoparticles for T1-weighted magnetic resonance imaging of tumors. J. Nanobiotechnol. 2022, 20, 350. [Google Scholar] [CrossRef] [PubMed]
  22. Venkatesha, N.; Poojar, P.; Ashwini, R.; Qurishi, Y.; Geethanath, S.; Srivastava, C. Ultrafine graphene oxide–CoFe2O4 nanoparticle composite as T1 and T2 contrast agent for magnetic resonance imaging. RSC Adv. 2016, 6, 17423–17429. [Google Scholar] [CrossRef]
  23. Zheng, X.-Y.; Zhao, K.; Tang, J.; Wang, X.-Y.; Li, L.-D.; Chen, N.-X.; Wang, Y.-J.; Shi, S.; Zhang, X.; Malaisamy, S.; et al. Gd-dots with strong ligand–water interaction for ultrasensitive magnetic resonance renography. ACS Nano 2017, 11, 3642–3650. [Google Scholar] [CrossRef] [PubMed]
  24. Ittrich, H.; Peldschus, K.; Raabe, N.; Kaul, M.; Adam, G. Superparamagnetic Iron Oxide Nanoparticles in Biomedicine: Applications and Developments in Diagnostics and Therapy. Fortschr. Röntgenstr. 2013, 185, 1149–1166. [Google Scholar] [CrossRef]
  25. Li, Z.; Wang, S.X.; Sun, Q.; Zhao, H.L.; Lei, H.; Lan, M.B.; Cheng, Z.X.; Wang, X.L.; Dou, S.X.; Lu, G.Q. Ultrasmall Manganese Ferrite Nanoparticles as Positive Contrast Agent for Magnetic Resonance Imaging. Adv. Health Mater. 2013, 2, 958–964. [Google Scholar] [CrossRef]
  26. Zhou, Z.; Huang, D.; Bao, J.; Chen, Q.; Liu, G.; Chen, Z.; Gao, J. A Synergistically EnhancedT1-T2Dual-Modal Contrast Agent. Adv. Mater. 2012, 24, 6223–6228. [Google Scholar] [CrossRef]
  27. Feng, L.; Chen, Z.-L. Research progress on dissolution and functional modification of cellulose in ionic liquids. J. Mol. Liq. 2008, 142, 1–5. [Google Scholar] [CrossRef]
  28. Sfiligoj, M.; Hribernik, S.; Kurečič, M.; Urbanek Krajnc, A.; Kreže, T.; Stana Kleinschek, K. Surface Properties of Non-Conventional Cellulose Fibres; Springer International Publishing: Cham, Switzerland, 2019; pp. 61–71. [Google Scholar] [CrossRef]
  29. Song, M.-L.; Yu, H.-Y.; Chen, L.-M.; Zhu, J.-Y.; Wang, Y.-Y.; Yao, J.-M.; Zou, Z.; Tam, K.C. Multibranch Strategy To Decorate Carboxyl Groups on Cellulose Nanocrystals To Prepare Adsorbent/Flocculants and Pickering Emulsions. ACS Sustain. Chem. Eng. 2019, 7, 6969–6980. [Google Scholar] [CrossRef]
  30. Satyamurthy, P.; Vigneshwaran, N. A novel process for synthesis of spherical nanocellulose by controlled hydrolysis of microcrystalline cellulose using anaerobic microbial consortium. Enzym. Microb. Technol. 2013, 52, 20–25. [Google Scholar] [CrossRef]
  31. Spiridon, I.; Teaca, C.A.; Bodîrlău, R. Structural changes evidenced by FTIR spectroscopy in cellulose materials after pre-treatment with ionic liquid and enzymatic hydrolysis. BioResources 2011, 6, 400–413. [Google Scholar] [CrossRef]
  32. Fitriani; Aprilia, N.A.S.; Arahman, N. Properties of nanocrystalline cellulose from pineapple crown leaf waste. IOP Conf. Ser. Mater. Sci. Eng. 2020, 796, 012007. [Google Scholar] [CrossRef]
  33. French, A.D.; Cintron, M.S. Cellulose polymorphy, crystallite size, and the Segal Crystallinity Index. Cellulose 2013, 20, 583–588. [Google Scholar] [CrossRef]
  34. Wang, N.; Ding, E.; Cheng, R. Thermal degradation behaviors of spherical cellulose nanocrystals with sulfate groups. Polymer 2007, 48, 3486–3493. [Google Scholar] [CrossRef]
  35. Kamel, S.; Jahangir, K. Optimization of Carboxymethylation of Starch in Organic Solvents. Int. J. Polym. Mater. Polym. Biomater. 2007, 56, 511–519. [Google Scholar] [CrossRef]
  36. Rahbar Shamskar, K.; Heidari, H.; Rashidi, A. Study on Nanocellulose Properties Processed Using Different Methods and Their Aerogels. J. Polym. Environ. 2019, 27, 1418–1428. [Google Scholar] [CrossRef]
  37. Patterson, A.L. The Scherrer Formula for X-Ray Particle Size Determination. Phys. Rev. 1939, 56, 978–982. [Google Scholar] [CrossRef]
  38. Nishiyama, Y.; Langan, P.; Chanzy, H. Crystal Structure and Hydrogen-Bonding System in Cellulose Iβ from Synchrotron X-ray and Neutron Fiber Diffraction. J. Am. Chem. Soc. 2002, 124, 9074–9082. [Google Scholar] [CrossRef]
  39. Yogamalar, R.; Srinivasan, R.; Vinu, A.; Ariga, K.; Bose, A.C. X-ray peak broadening analysis in ZnO nanoparticles. Solid State Commun. 2009, 149, 1919–1923. [Google Scholar] [CrossRef]
  40. Yousefi, T.; Torab-Mostaedi, M.; Ghasemi, M.; Ghadirifar, A. Synthesis of Gd2O3 nanoparticles: Using bulk Gd2O3 powders as precursor. Rare Met. 2015, 34, 540–545. [Google Scholar] [CrossRef]
  41. Wang, F.; Peng, E.; Zheng, B.; Li, S.F.Y.; Xue, J.M. Synthesis of Water-Dispersible Gd2O3/GO Nanocomposites with Enhanced MRI T1 Relaxivity. J. Phys. Chem. C 2015, 119, 23735–23742. [Google Scholar] [CrossRef]
  42. Van den Berg, O.; Capadona, J.R.; Weder, C. Preparation of Homogeneous Dispersions of Tunicate Cellulose Whiskers in Organic Solvents. Biomacromolecules 2007, 8, 1353–1357. [Google Scholar] [CrossRef] [PubMed]
  43. Lu, P.; Hsieh, Y.-L. Preparation and properties of cellulose nanocrystals: Rods, spheres, and network. Carbohydr. Polym. 2010, 82, 329–336. [Google Scholar] [CrossRef]
  44. Deepa, B.; Abraham, E.; Cordeiro, N.; Mozetic, M.; Mathew, A.P.; Oksman, K.; Pothan, L.A. Utilization of various lignocellulosic biomass for the production of nanocellulose: A comparative study. Cellulose 2015, 22, 1075–1090. [Google Scholar] [CrossRef]
  45. Elanthikkal, S.; Gopalakrishnapanicker, U.; Varghese, S.; Guthrie, J.T. Cellulose microfibres produced from banana plant wastes: Isolation and characterization. Carbohydr. Polym. 2010, 80, 852–859. [Google Scholar] [CrossRef]
  46. Kargarzadeh, H.; Ahmad, I.; Abdullah, I.; Dufresne, A.; Zainudin, S.Y.; Sheltami, R.M. Effects of hydrolysis conditions on the morphology, crystallinity, and thermal stability of cellulose nanocrystals extracted from kenaf bast fibers. Cellulose 2012, 19, 855–866. [Google Scholar] [CrossRef]
  47. Mariano, M.; Cercená, R.; Soldi, V. Thermal characterization of cellulose nanocrystals isolated from sisal fibers using acid hydrolysis. Ind. Crops Prod. 2016, 94, 454–462. [Google Scholar] [CrossRef]
  48. Ting, S.S. Comparative properties analysis between microcrystalline cellulose and cellulose nanocrystals extracted from rice straw. Malays. J. Microsc. 2019, 15, 146–154. [Google Scholar]
  49. Lin, N.; Dufresne, A. Surface chemistry, morphological analysis and properties of cellulose nanocrystals with gradiented sulfation degrees. Nanoscale 2014, 6, 5384–5393. [Google Scholar] [CrossRef] [PubMed]
  50. Phanthong, P.; Reubroycharoen, P.; Hao, X.; Xu, G.; Abudula, A.; Guan, G. Nanocellulose: Extraction and application. Carbon Resour. Convers. 2018, 1, 32–43. [Google Scholar] [CrossRef]
  51. Gul, H.; Shah, A.U.H.A.; Gul, S.; Arjomandi, J.; Bilal, S. Study on the thermal decomposition kinetics and calculation of activation energy of degradation of poly (o-toluidine) using thermogravimetric analysis. Iran. J. Chem. Chem. Eng. 2018, 37, 193–204. [Google Scholar]
  52. Park, J.; Lee, E.; Hwang, N.-M.; Kang, M.; Kim, S.C.; Hwang, Y.; Hyeon, T. One-Nanometer-Scale Size-Controlled Synthesis of Monodisperse Magnetic Iron Oxide Nanoparticles. Angew. Chem. 2005, 117, 2932–2937. [Google Scholar] [CrossRef]
  53. Abraham, E.; Deepa, B.; Pothen, L.; Cintil, J.; Thomas, S.; John, M.; Narine, S. Environmental friendly method for the extraction of coir fibre and isolation of nanofibre. Carbohydr. Polym. 2013, 92, 1477–1483. [Google Scholar] [CrossRef] [PubMed]
  54. Faradilla, R.H.F.; Lee, G.; Rawal, A.; Hutomo, T.; Stenzel, M.H.; Arcot, J. Nanocellulose characteristics from the inner and outer layer of banana pseudo-stem prepared by TEMPO-mediated oxidation. Cellulose 2016, 23, 3023–3037. [Google Scholar] [CrossRef]
  55. Khouri, S. Experimental Characterization and Theoretical Calculations of Responsive Polymeric Systems. Master’s Thesis, University of Waterloo, Waterloo, ON, Canada, 2010. [Google Scholar]
  56. Mohaiyiddin, M.S.; Lin, O.H.; Owi, W.T.; Chan, C.H.; Chia, C.H.; Zakaria, S.; Akil, H.M. Characterization of nanocellulose recovery from Elaeis guineensis frond for sustainable development. Clean Technol. Environ. Policy 2016, 18, 2503–2512. [Google Scholar] [CrossRef]
  57. Morais, J.P.S.; de Freitas Rosa, M.; Nascimento, L.D.; Nascimento, D.M.; Cassales, A.R. Extraction and characterization of nanocellulose structures from raw cotton linter. Carbohydr. Polym. 2013, 91, 229–235. [Google Scholar] [CrossRef]
  58. De Castro, D.O.; Bras, J.; Gandini, A.; Belgacem, N. Surface grafting of cellulose nanocrystals with natural antimicrobial rosin mixture using a green process. Carbohydr. Polym. 2016, 137, 1–8. [Google Scholar] [CrossRef]
  59. Kaboorani, A.; Riedl, B. Surface modification of cellulose nanocrystals (CNC) by a cationic surfactant. Ind. Crops Prod. 2015, 65, 45–55. [Google Scholar] [CrossRef]
  60. Khanjanzadeh, H.; Behrooz, R.; Bahramifar, N.; Gindl-Altmutter, W.; Bacher, M.; Edler, M.; Griesser, T. Surface chemical functionalization of cellulose nanocrystals by 3-aminopropyltriethoxysilane. Int. J. Biol. Macromol. 2018, 106, 1288–1296. [Google Scholar] [CrossRef]
  61. Liu, C.-F.; Ren, J.-L.; Xu, F.; Liu, J.-J.; Sun, J.-X.; Sun, R.-C. Isolation and Characterization of Cellulose Obtained from Ultrasonic Irradiated Sugarcane Bagasse. J. Agric. Food Chem. 2006, 54, 5742–5748. [Google Scholar] [CrossRef]
  62. da Silva, R.; Sierakowski, M.R.; Bassani, H.P.; Zawadzki, S.F.; Pirich, C.L.; Ono, L.; de Freitas, R.A. Hydrophilicity improvement of mercerized bacterial cellulose films by polyethylene glycol graft. Int. J. Biol. Macromol. 2016, 86, 599–605. [Google Scholar] [CrossRef]
  63. Goetz, L.; Foston, M.; Mathew, A.P.; Oksman, K.; Ragauskas, A.J. Poly(methyl vinyl ether-co-maleic acid)−Polyethylene Glycol Nanocomposites Cross-Linked In Situ with Cellulose Nanowhiskers. Biomacromolecules 2010, 11, 2660–2666. [Google Scholar] [CrossRef]
  64. McCormick, D.A.; Connors, B.W.; Lighthall, J.W.; Prince, D.A.; Rule, M.E.; Vargas-Irwin, C.E.; Donoghue, J.P.; Truccolo, W.; Jacob, V.; Mitani, A.; et al. Comparative electrophysiology of pyramidal and sparsely spiny stellate neurons of the neocortex. J. Neurophysiol. 1985, 54, 782–806. [Google Scholar] [CrossRef] [PubMed]
  65. Zheng, K.; Zhang, D.; Zhao, D.; Liu, N.; Shi, F.; Qin, W. Bright white upconversion emission from Yb3+, Er3+, and Tm3+-codoped Gd2O3 nanotubes. Phys. Chem. Chem. Phys. 2010, 12, 7620–7625. [Google Scholar] [CrossRef] [PubMed]
  66. Torkashvand, N.; Sarlak, N. Fabrication of a dual T1 and T2 contrast agent for magnetic resonance imaging using cellulose nanocrystals/Fe3O4 nanocomposite. Eur. Polym. J. 2019, 118, 128–136. [Google Scholar] [CrossRef]
  67. Majeed, S.; Shivashankar, S.A. Rapid, microwave-assisted synthesis of Gd2O3 and Eu: Gd2O3 Nanocrystals: Characterization, magnetic, optical and biological studies. J. Mater. Chem. B 2014, 2, 5585–5593. [Google Scholar] [CrossRef]
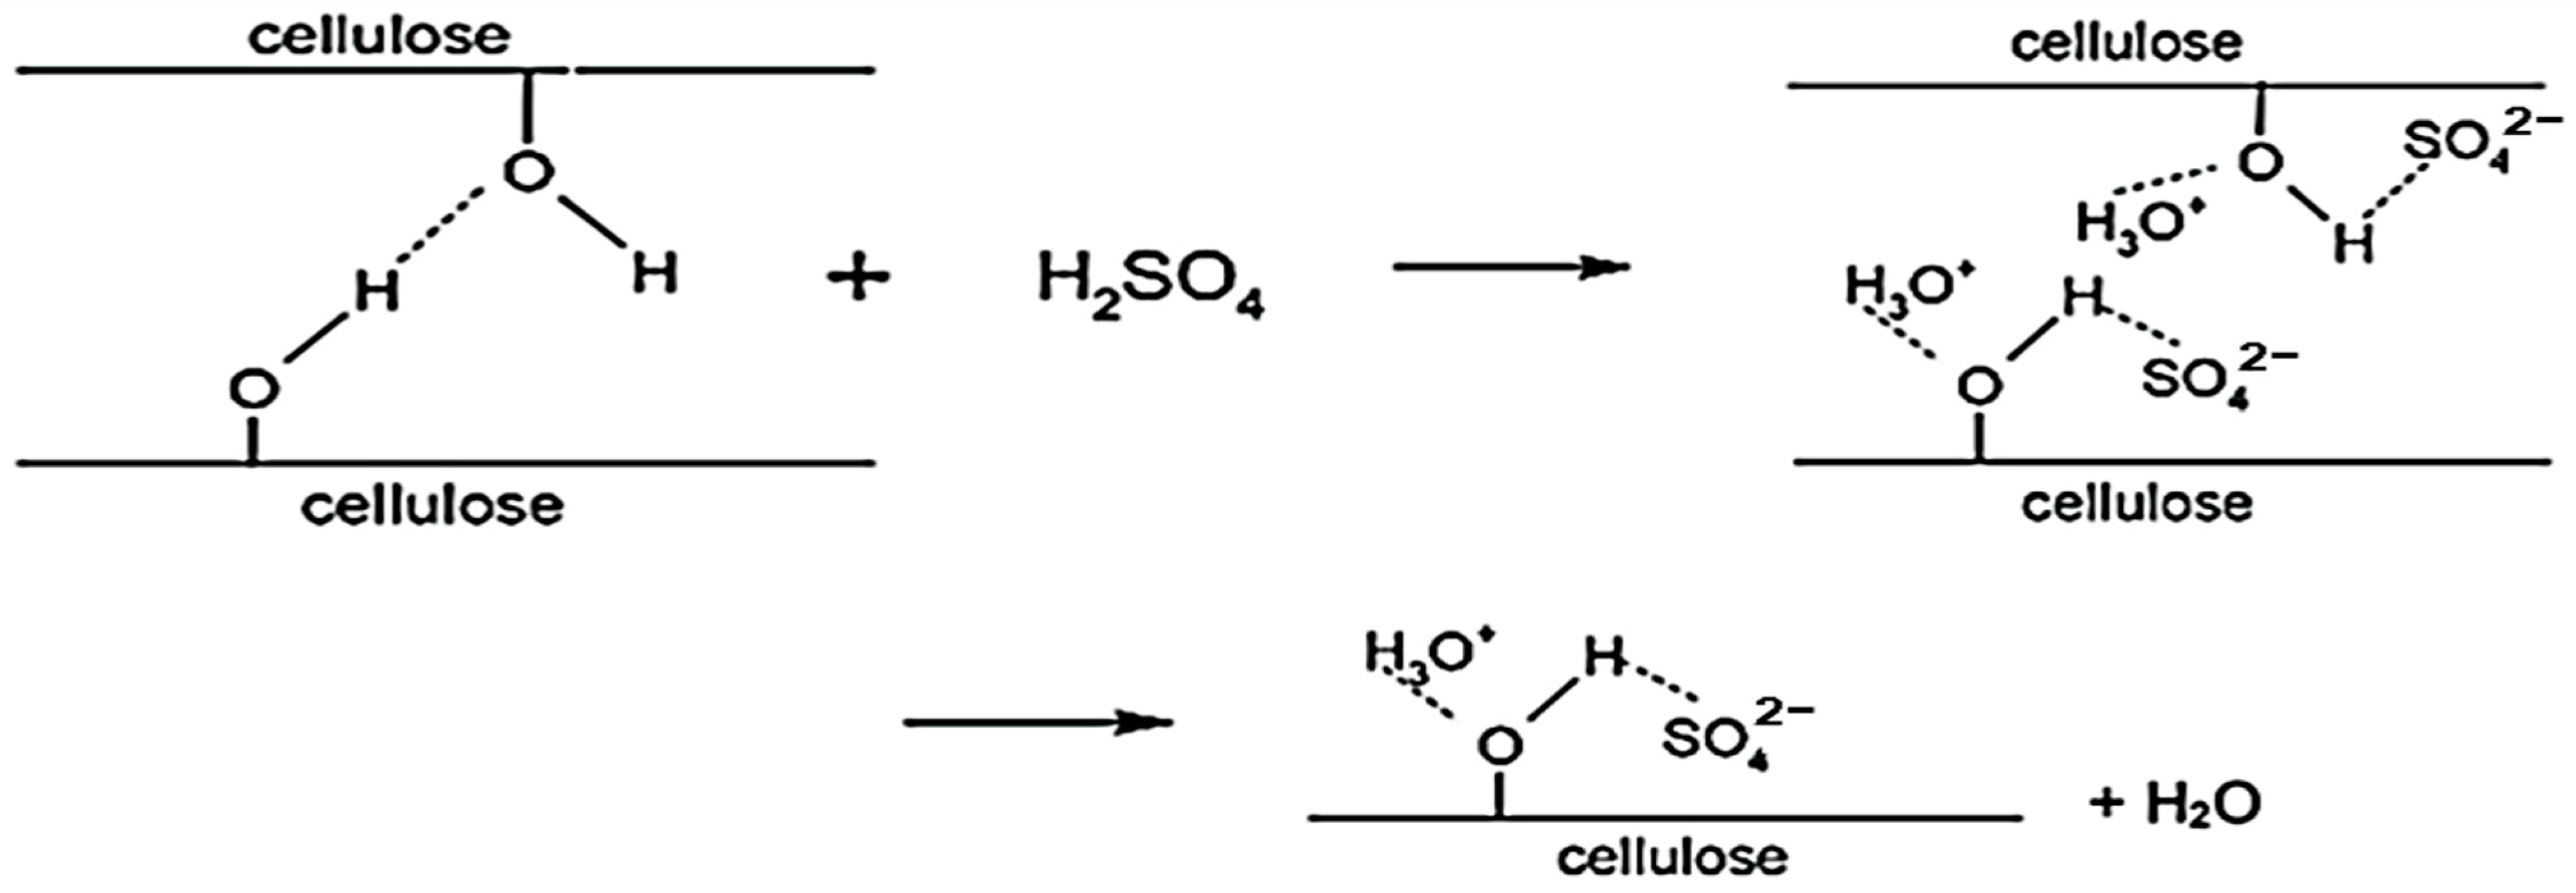
Figure 1. Reaction of cellulose with H2SO4.
Applsci 13 06316 g001
Figure 2. Synthesis of cellulose nanocrystals (CNCs) by sulfuric acid hydrolysis.
Applsci 13 06316 g002
Figure 3. Schematic of reaction of cellulose nanocrystals surface (CNCs) with PEG in the presence of NaOH.
Applsci 13 06316 g003
Figure 4. Synthesis of (CNCs-PEG/NaOH) via hydrolysis method.
Applsci 13 06316 g004
Figure 5. FTIR spectra of cellulose nanocrystals (CNCs) with reference of standard (MCC).
Applsci 13 06316 g005
Figure 6. XRD spectrum of synthesized (CNCs) with reference to the spectrum of standard (MCC) (JCPDS No. 00-060-1502).
Applsci 13 06316 g006
Figure 7. TEM micrographs and size distribution of CNCs (c,d) with reference of standard MCC (a,b).
Applsci 13 06316 g007
Figure 8. FESEM micrographs of CNCs (df) with reference of standard MCC (ac).
Applsci 13 06316 g008
Figure 9. TGA and DTG curves of CNCs (b) with reference of standard MCC (a).
Applsci 13 06316 g009
Figure 10. The zeta potential (ζ) of CNCs suspension with reference of standard MCC.
Applsci 13 06316 g010
Figure 11. 13C-NMR spectra of (a) PEG, (b) CNCs, (c) (CNCs-PEG/NaOH) solution, * New peaks at (52–89 ppm), belong to PEG chain.
Applsci 13 06316 g011
Figure 12. (a) FESEM images and (b) size distribution histogram of CNCs-PEG/NaOH.
Applsci 13 06316 g012
Figure 13. The zeta potential (ζ) of CNCs-PEG/NaOH.
Applsci 13 06316 g013
Figure 14. Size distribution of CNCs-PEG/NaOH sample.
Applsci 13 06316 g014
Figure 15. (a) T1-weighted and (b) T2-weighted MR images of CNCs-PEG/NaOH composite with water background (W) as control.
Applsci 13 06316 g015
Figure 16. Survival of Hep G2 Cells on the test of (CNCs-PEG/NaOH) at a concentration range of 12.5 μg/mL–100 μg/mL.
Applsci 13 06316 g016
Table 1. Calculated values of lattice parameter (a, b and c) of (MCC) and (CNCs).
SamplesPeak
Position, 2θ (o)
Crystal Indices,
(hkl)
Interplanar Distance,
(dhkl)
(Å)
Lattice
Parameter, a ≠ = bc
(Å)
Volume of
the Unit Cell, (Å3)
V = a b c s i n β
a = h 2 d ( 200 ) 2 s i n β 2 b = k 2 d ( 020 ) 2 c = l 2 d ( 004 ) 2 s i n β 2
MCC&
CNCs
17.090205.208.2610.407.88677
22.982004.3
34.540041.97
Table 2. The particle size and grain size range of MCC and CNCs according to the Sherrer method.
SamplesLattice ParametersParticle Size
(nm)
Grain Size Range
(nm)
Intensity
(cps)
Crystal Indices
(hkl)
Peak Position, 2θ
(o)
Peak
Width at Half Maximum
Intensity (FWHM) (o)
Peak Width at Half
Maximum Intensity
(FWHM) (radian)
MCC00222.71.200.0209337.067.06–17.6693.80
00434.50.490.00854717.66
CNCs00222.71.520.0265165.575.57–11.9077.34
00434.50.730.01273411.90
Table 3. Calculated values of strain of MCC and CNCs according to the Sherrer method.
SamplesPeak
Position, 2θ (o)
θ (o)Cos θPeak Width at Half
Maximum
Intensity (FWHM)
(o)
Peak Width at Half
Maximum
Intensity (FWHM)
(Radian)
Sin θ4Sin θβCos θStrain, ε = β C o s θ 4
MCC16.48.200.98980.330.0057670.14260.57050.005711.43 × 10−3
22.711.350.98041.200.0209330.19670.78680.020525.13 × 10−3
34.517.250.95500.490.0085470.29651.18610.008162.04 × 10−3
CNCs16.48.200.98980.600.0104670.14260.57050.010362.5 × 10−3
22.711.350.98041.520.0265160.19670.78680.025996.4 × 10−3
34.517.250.95500.730.0127340.29651.18610.012163.04 × 10−3
Disclaimer/Publisher’s Note: The statements, opinions and data contained in all publications are solely those of the individual author(s) and contributor(s) and not of MDPI and/or the editor(s). MDPI and/or the editor(s) disclaim responsibility for any injury to people or property resulting from any ideas, methods, instructions or products referred to in the content.