Abstract
A new approach is introduced to address the subject dependency problem in P300-based brain-computer interfaces (BCI) by using transfer learning. The occurrence of P300, an event-related potential, is primarily associated with changes in natural neuron activity and elicited in response to infrequent stimuli, which can be monitored non-invasively through an electroencephalogram. However, implementing P300-based BCI in real-time requires many training samples and time-consuming calibration, making it challenging to use in practical applications. To tackle these challenges, the proposed approach harnesses the high-level feature extraction capability of a deep neural network, achieved through fine-tuning. To ensure similar distributions of feature extraction data, the approach of aligning data in Euclidean space is employed, which is then applied to a discriminatively restricted Boltzmann machine with a single layer for P300 detection. The performance of the proposed method on the BCI Competition III dataset II and the BCI competition II dataset II, the state-of-the-art dataset, was evaluated and compared with previous studies. The results showed that robust performance could be achieved using a small number of training samples, demonstrating the effectiveness of the transfer learning approach in P300-based BCI applications.
1. Introduction
Disabled patients who cannot communicate using their muscles benefit from the brain-computer interfaces (BCI) that control external devices by directly reading the electrical signals generated by the human brain [1]. For monitoring brain activity, BCIs typically use magnetoencephalography, electrocorticography, and functional magnetic resonance imaging, as well as electroencephalogram (EEG) [2], which is widely used due to its low cost, non-invasiveness, availability, and high temporal resolution [3].
Among the brain activities that can be recorded with EEG [4], P300 is a positive event-related potential (ERP) that occurs when the brain is stimulated by an unexpected stimulus [5]. The P300 is characterized by latency, which depends on the duration of the stimulus evaluation [6,7], and by amplitude, which seems to reflect the amount of information transmitted by the stimulus. P300 occurs in the brain approximately 300 milliseconds after a person is presented with a rare and significant stimulus [6,7]. It is typically elicited in the parietal and central regions of the brain, with the largest amplitude in the parietal cortex. P300-based ERP has been extensively researched and is widely considered to be a reliable and objective method for studying cognitive processes underlying various behaviors. In the medical sciences, the applications of P300 include the diagnosis of subclinical cognitive disorders. Thus, clinical practice in neurology shows that the latency and amplitude of P300 significantly degrade in patients with thyroid dysfunction, making this ERP in association with magnetic resonance spectroscopy suitable for diagnosis [8]. In addition, ERP, including P300, can be used to evaluate the influence of stress and emotions on the evolution of multiple sclerosis [9].
Besides its application in neurology, P300 is often used in BCI research as a signal to detect the user’s intention or decision-making process. This is completed by presenting a series of stimuli to the subjects, whose brain activity is monitored, to determine if they are focusing on a specific stimulus that corresponds to a particular command or action. Thus, due to the aforementioned reasons and being user-friendly, P300-based tasks are typically used in BCI that helps people with neuro-motor disabilities. The Matrix Speller is the first BCI based on the P300, which can transmit 7.8 characters per minute [10,11]. Following its introduction, the performance of P300-based BCI was significantly improved using different paradigms and powerful algorithms [12,13]. This speller uses a 6 x 6 matrix of letters that are highlighted in a sequence while the subjects focus their attention on the letter they want to communicate.
However, ERP signals are subject-specific and vary according to the individual, meaning samples from different subjects will not be similar. Cross-subject variability refers to the differences observed in the brain activity of different individuals, which can complicate the use of BCIs. So, each subject typically needs to undergo a personalized calibration session, which can be a laborious and infeasible process when aiming for real-time BCI implementation [14,15]. To tackle this problem, the transfer learning (TL) concept has been introduced, whereby pre-trained models or knowledge from other subjects (known as the source dataset) are utilized to improve the performance of a new subject (referred to as the target dataset) [16]. This approach can be helpful when limited data is available for a new subject (target domain) [17]. Various TL methods have been developed, such as domain adaptation and subspace learning [14].
Domain adaptation is the process of adapting a model trained on a source dataset to perform well on a target dataset. One common approach to domain adaptation is fine-tuning, which involves taking a pre-trained model and training it further on a target dataset [18]. Fine-tuning can be seen as a form of domain adaptation because it allows the model to adapt to the new dataset by adjusting its weights and biases. Fine tuning in convolutional neural networks (CNN) refers to the process of taking a pre-trained CNN and adjusting its parameters to fit a new dataset or task. This is completed by freezing the early layers of the network, which have learned general features, and training only the subsequent layers on the new data. In ref. [19] a transfer CNN framework based on VGG-16 is proposed. A pre-trained VGG-16 CNN model is transferred to a target CNN model, and front-layer parameters are frozen while later-layer parameters are fine-tuned with a target MI dataset composed of time-frequency spectrum images of EEG signals. The proposed framework outperforms traditional methods on the BCI competition IV dataset. In [20], the authors pre-trained a multi-scale convolutional neural network (MSCNN) on a large-scale EEG dataset and fine-tuned it on a target dataset. They show the effectiveness of the proposed MSCNN model on two different EEG P300 datasets.
Fine tuning can be a powerful technique for transfer learning, where knowledge gained from the source domain can be applied to the target domain. Additionally, it is useful when we have limited labeled data but want to leverage pre-trained models for our task [2,21]. However, fine-tuning a pre-trained model can result in the loss of specialized knowledge when the target domain has different data characteristics than the source domain, potentially resulting in suboptimal performance [22]. Therefore, subspace learning based-TL is coming to overcome the fine-tune-based TL limitations.
Subspace alignment is a technique that involves mapping data from one domain to another by finding a common subspace between the two domains. By aligning the subspaces, we can transfer knowledge from one domain to another and improve the performance of our model. One advantage of subspace alignment is that it is a simple and effective method.
In ref. [23], the authors focused on the issues of cross-session and cross-subject classification, which refer to the use of data from past sessions or users to initialize the classifier for a calibration-less BCI mode. The study employs spatial covariance matrices of EEG signals, which use Riemannian geometry to represent data on the manifold of Symmetric Positive Definite (SPD) matrices. The study proposes an affine transformation of the covariance matrices for every session/subject to center them with respect to a reference covariance matrix, making them comparable. But Riemannian alignment (RA) has some limitations in that the classifier must be Riemannian only, it needs labels for ERP datasets, and it is also time-consuming. To tackle these limitations, He and Wu [24] proposed an unsupervised and fast approach that is useful in both domains Euclidean and Romanian. It is called the Euclidean alignment (EA) technique, which aligns the feature spaces of the source and target domains to Euclidean space to reduce the distribution shift between the two domains.
In the current study, we propose a new approach based on transfer learning. Due to the subject dependency problem of P300-based ERP signals, it is a significant challenge for real-time P300-based brain-computer interface applications. This issue necessitates extensive calibration and multiple learning training samples, which can be time-consuming. To tackle this issue, we utilize the fine-tuning ability of CNN for extracting high-level features and the EA technique for data alignment. To enhance the efficacy of the transfer learning process, we adopt the fine-tuning technique, which involves retraining the CNN using the source dataset as the initial starting point. This is completed using one-third of the target dataset. Following this, the features that have been extracted by the CNN are implemented in an EA method to enhance similarity between the source and target feature distributions. Finally, classification is accomplished by utilizing the Discriminative Restricted Boltzmann Machine (DRBM). The analysis demonstrates that this innovative hybrid TL method exhibits enhanced performance in comparison to both fine-tuning alone and conventional training approaches. This work improves the analysis of the TL-based method over our preliminary research [25] by adding a new dataset and performing more comparisons with the existing classification methods for the detection of the P300 wave. In addition, we give more details related to the characteristics of the P300 and the utility of this wave in applications.
The subsequent sections of this paper are structured as follows: Section 2 provides the proposed methods, and Section 3 presents the results. Section 4 discusses the practical implications of the research and includes discussions on the findings. Section 5 explores the limitations and suggests future work. Finally, the conclusions are given in Section 6.
2. Materials and Methods
2.1. Dataset
For the evaluation of the proposed algorithm, we utilized two state-of-the-art P300-based datasets. The task used for both datasets is illustrated in Figure 1. The objective for the user is to convey a specific character by focusing on the matrix cell that contains the desired character and counting the number of times it intensifies or flashes. Each row and column of the matrix is intensified in a random sequence, forming an oddball paradigm of 12 intensifications—6 rows and 6 columns.
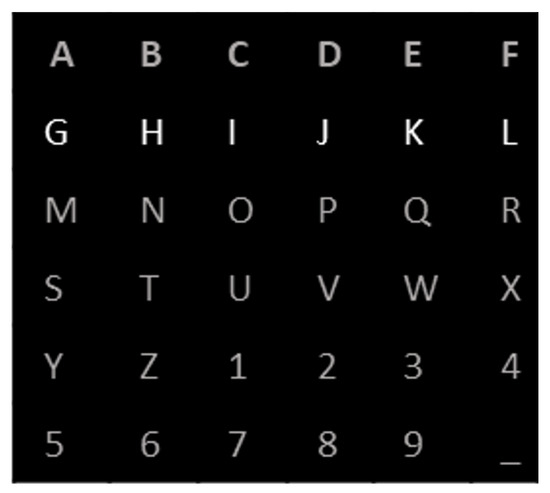
Figure 1.
Schematic illustration of the oddball paradigm.
The rare set consists of the row and column that contain the character to be conveyed (the target), while the other 10 intensifications form the frequent set (the non-targets). If the observer is attentive to the stimulus sequence, the target items (i.e., the target row and column) should elicit a P300 response since each target stimulus intensification constitutes a rare event in comparison to all other intensifications. All analysis was performed using MATLAB R2019b.
2.1.1. BCI Competition III Dataset II
The BCI competition III dataset II, which was described in [12], served as the foundation for this study. EEG signals were gathered from 64 electrodes and filtered with a band-pass of 0.1–60 Hz while being sampled at a rate of 240 Hz. Two healthy participants were recruited for this study, and they participated in both offline and online sessions, which corresponded to the training and testing phases of the speller-based paradigm, respectively. In the training session, the participants were required to spell 85 characters, whereas in the testing session, they were instructed to spell 100 characters.
During both sessions, the participants were presented with a 6 × 6 matrix containing 36 characters and asked to concentrate on prearranged letters. The intensification of each row and column of the matrix occurred randomly for 100 ms, followed by a blanking period of 75 ms. This sequence was repeated a total of 15 times. The aim of this study was to identify the P300 coefficients present in the row and column responses and utilize this information to accurately determine the target characters by locating their intersection [26]. The offline session, where participants spelled 85 characters, yielded 2550 P300 (85 × 2 × 15) and 12750 non-P300 (85 × 10 × 15) samples. A validation set comprising 10 percent of the training data was reserved.
2.1.2. BCI Competition II Dataset II
This dataset represents a complete record of P300 evoked potentials recorded with BCI2000 using a paradigm originally described by Farwell and Donchin [27]. The goal of the experiment was for the user to focus on one of the 36 different characters presented in the matrix. During each trial, rows and columns of the matrix were successively and randomly intensified at a rate of 5.7 Hz. Two out of 12 intensifications of rows or columns contained the desired character, while the rest did not. There are 15 repetitions for each intensification. The P300 responses evoked by the infrequent stimuli that contained the desired character were different from those evoked by the stimuli that did not contain the desired character and were similar to the P300 responses reported in previous studies. The dataset includes recordings from a single subject “C”, with 64 EEG channels and a sampling rate of 240 Hz. The objective of the BCI Competition II using this dataset was to predict the correct characters in one of the two provided sessions. A total of 7560 trials (42 × 12 × 15) and 5580 trials (31 × 12 × 15) were obtained, as 42 and 31 characters were spelled in the offline and online sessions, respectively. A validation set comprising 10 percent of the training data was reserved.
2.2. Preprocessing
Filtering EEG signals is an important step in preparing the data for analysis. Filtering removes unwanted noise and artifacts from the signal, which can affect the accuracy of subsequent analyses. The bandpass filter used in this study is designed to allow frequencies within a specific range to pass through while attenuating frequencies outside of that range. This is because the frequency components of the EEG signal can provide important information about brain activity, and different frequency ranges are associated with different brain processes. For both datasets, a band-pass filter with a range of 0.1–30 Hz was utilized to filter the EEG signals.
The length of the window used for the time dimension in each epoch is an important consideration when analyzing EEG data. In this study, a window length of 160 was chosen based on the sampling rate of 240 Hz and the time interval of interest (667 ms after intensifications). This ensures that the data are sampled at a high enough rate to capture the essential features of the signal while minimizing the amount of data that needs to be processed.
2.3. Feature Extraction
The proposed feature extraction technique is presented in Figure 2, which provides an overview of the process. To begin, the source dataset was used to train the CNN1 network. The starting weights used to train CNN2 (which has the same structure as CNN1) on the target dataset were obtained from CNN1. After training both networks, each CNN was utilized to extract high-level features, creating target and source features.
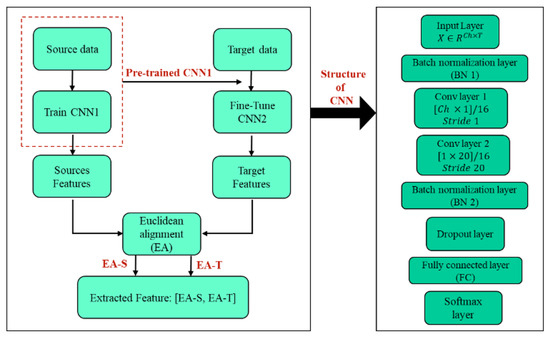
Figure 2.
Graphical representation of the suggested method.
The utilization of a TL-based EA method (Euclidean alignment block) facilitated the alignment of these feature blocks, thereby ensuring that they had similar distributions. Further details regarding the technique are explained in the following sections.
2.3.1. Convolutional Neural Network
ERPs are characterized by non-stationary activity that varies across different sessions and individuals. This variability makes it challenging to extract robust and reliable features for analysis. CNNs have shown great promise in addressing this challenge by leveraging their ability to learn hierarchical representations of the input data [28,29]. The architecture of a CNN is typically composed of multiple convolutional layers and a set of fully connected layers. Feature extraction is completed by applying a series of convolutional filters to the input image or signal in CNN. These filters are designed to detect specific patterns or features in the data. The output of each filter is then passed through a non-linear activation function to introduce non-linearity into the network. This process of convolution is repeated multiple times in the network to extract increasingly complex features from the input image. Once the features have been extracted, they are fed into a fully connected layer that performs classification. Overall, feature extraction is a critical step in CNN that enables it to learn meaningful representations of images and achieve state-of-the-art performance on various tasks.
In this paper, both CNN networks (CNN1 and CNN2) have the same structure as a two-layer CNN network and were trained to extract features from the EEG signal based on the details given in the literature [20]. Each convolutional layer applies a set of kernels to the input data to extract spatial and temporal patterns at different scales, respectively. The size and number of kernels used in each layer are important design choices that affect the quality of the extracted features. In our study, we used a kernel size of [64 × 1] for the first convolutional layers, which has been shown to be effective for capturing local spatial patterns in EEG data. Then we used a kernel size of [1 × 20] for the second convolutional layer, which has been shown to be effective for capturing local temporal patterns in EEG data, and also applied the rectified linear unit (ReLU) activation function after each convolutional operation. ReLU has been shown to be an effective non-linearity for deep neural networks, which sets all negative values in the feature map to zero while passing all positive values unchanged. This helps to create sparse representations that are easier to learn and generalize, allowing for efficient training and avoiding the vanishing gradient problem.
Note that the choice of kernel size and number is problem-specific and depends on the nature of the EEG analysis task. For instance, if the task involves detecting transient events in the EEG signal, such as P300 responses, larger kernel sizes may be more effective for capturing the temporal dynamics of the signal. On the other hand, if the task involves identifying spatial-temporal patterns in the signal, smaller kernel sizes may be more appropriate for capturing local features. Additionally, the number of kernels used in each layer can be increased or decreased depending on the complexity of the task and the amount of available data. A larger number of kernels may result in overfitting if the dataset is small, while a smaller number of kernels may not capture the full complexity of the signal if the dataset is large and diverse. The number of kernels for both convolution layers is set to 16. Finally, the features were extracted from the second layer of the CNN using the ReLU activation function. These extracted features were then used as inputs for subsequent processing and analysis.
- CNN train approach
Fine-tuning is the process of taking a pre-trained neural network, such as a CNN, and training it on a new task or dataset [30]. In the context of CNNs, fine-tuning involves modifying the weights of the pre-trained network to better adapt it to the new task while still preserving the knowledge learned from the original task. The fine-tuning ability of a CNN refers to how easily and effectively it can be adapted to new tasks or datasets through this process. A CNN with high fine-tuning ability is one that has learned robust and general features in its pre-training and can therefore be quickly and accurately adapted to new tasks with a few training examples. In this study, two subjects were considered, one as the source and the other as the target. As described in Section 2.1.1, datasets consist of 85 training characters (15,300 samples), and we consider all these samples of the source dataset for the initial training (pre-training) of the convolutional neural network CNN1. However, based on this study’s aim, we decided to only use 30 characters from the target dataset to retrain the model (CNN2). Thus, we used 5400 samples, which represents one-third of the total training samples. This decision was made to reduce the calibration time by minimizing the number of training iterations needed. A detailed description of the data utilized for pre-training, fine-tuning, and testing is provided in Table 1, which includes details on the specific sources and targets utilized in each dataset, as well as the number of trials and stimuli presented during the training and testing phases.

Table 1.
Detailed description of the data we used for pre-training, fine-tuning, and testing of our language model.
2.3.2. Euclideam Alignment
After extracting features from the second convolutional layer of both CNN1 and CNN2, a data alignment technique was applied to make the two feature matrices more similar and enhance the efficiency of the transfer learning approach. Subspace alignment in transfer learning is an important aspect that needs to be considered while transferring knowledge from one domain to another. Since the model is trained on a source domain and fine-tuned on a target domain, inconsistent data distributions between the two domains may lead to a decline in model performance. To address this issue, data alignment techniques are used to align the data distributions of the source and target domains.
The alignment process involves finding a transformation that maps the source and target features in a new space to make the distributions more similar. This approach is particularly useful when the source and target datasets have different feature distributions or when the target dataset is small and insufficient for training a deep neural network [14]. In [24], a novel unsupervised technique was introduced that utilized covariance to calculate the reference matrix for a subject with N trials data (X) and k dimensions, as indicated by:
Then, the reference matrices for each dataset were then aligned by:
This approach is cost-effective, label-free, and aims to improve distribution similarity. Finally, aligned features were concatenated to feed the classifier.
2.4. Classification
Due to the subject-dependent nature of P300-based ERP signals, a robust classification technique such as Discriminative Restricted Boltzmann Machine (DRBM) is necessary to differentiate P300 signals from non-P300 signals [31,32]. DRBM belongs to the category of generative stochastic neural networks that model the joint distribution of inputs and target classes. In addition, DRBM has a multi-layer architecture, which includes visible and hidden layers. The visible layer represents the input data, while the hidden layers capture the relevant features for classification. In this study, we used a DRBM architecture with a hidden layer containing 10 neurons to classify the input data. To determine the selected character, which involves choosing a row and column from an oddball six-by-six character matrix, the P300 scores corresponding to each character need to be averaged across all repetitions. The character with the highest average score over m repetitions is then selected as the target character [31]. This process is carried out for each of the j characters and m repetitions, and the score S is calculated using Equation (3). The target character is then identified using Equation (4).
3. Results
Initially, to demonstrate the effects of our suggested technique and represent the data distributions, we employed t-Stochastic Neighbor Embedding (t-SNE) as a method to transform the high dimension data into a lower dimension space [33]. In Figure 3a, we plotted the filtered EEG signal of the source and target subjects, which consisted of 85 characters from subject B and 30 characters from subject A, respectively. Blue and red dots represented each trial in the target and source data, respectively. On the other hand, Figure 3b highlights the success of our proposed hybrid transfer learning method by presenting the distribution of features extracted from the data. The blue and red dots in the plot indicated the target and source trials, respectively. This visualization exemplified the ability of our suggested transfer learning technique to align the data distributions between target and source subjects, which is crucial for successful transfer learning. It is apparent that the source and target distributions are similar to each other after EA.
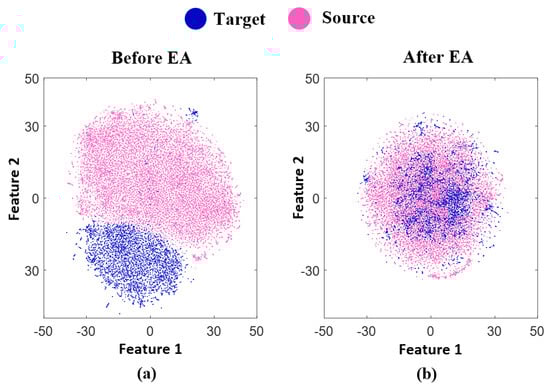
Figure 3.
It presents a t-SNE visualization showcasing the distribution of targets (30 characters of subject A) and sources (85 characters of subject B) from BCI competition III dataset II, both before and after transfer learning (TL) has been applied. The figure is split into two parts: (a) illustrates the distribution before TL, while (b) presents the distribution after TL.
To assess the efficacy of our proposed method in line with reducing calibration time, we conducted several testing sessions using a widely recognized dataset. We evaluated the performance of the proposed approach for various repetitions, including 1, 5, 10, and 15. The results of these sessions are presented in Table 2, which compares the performance of three different training approaches for two subjects.
Table 2.
Character recognition accuracy (%) for subjects “A” and “B” from BCI competition III dataset II using different approach in four repetitions.
The study employed three distinct approaches to investigate the efficacy of transfer learning techniques for character recognition. The first approach, , followed a conventional method and did not integrate transfer learning. This approach relied on 30 target training characters and 100 test characters. The second approach, , utilized a transfer learning technique based on fine-tuning in a CNN but did not incorporate the EA technique. employed 30 target training characters, 85 source characters, and 100 test characters. Finally, in , the study employed a fine-tuning approach in a CNN and incorporated the EA technique. This approach also used 30 target training characters, 85 source characters, and 100 test characters. The findings indicate that the approach of outperforms other methods in character recognition accuracy. Additionally, this approach achieves high accuracy using fewer samples, making it well-suited for real-time implementation. By utilizing only 30 out of the 85 available training characters for target subjects, we have managed to save about 29 min (55 × 180 × 0.175 = 1732.5 s) in calibration time.
In order to highlight the effectiveness of our suggested approach (), we have conducted a comparative analysis of the character recognition outcomes with respect to prior research utilizing the most advanced dataset, as presented in Table 3. Our scheme demonstrates that achieving a strong performance while using fewer training samples requires a balance between accuracy and trade-offs compared with other methodologies.
Table 3.
Character recognition accuracy (%) for subject “A” and “B” from BCI competition III dataset II using different previous studies and our proposed method in four repetitions.
Information transfer rate (ITR) is frequently used to assess the efficiency of a brain-computer interface system. This metric gauges the speed at which data can be transmitted between the brain and an external device, such as a computer. Measured in bits per second, ITR is a critical indicator of the BCI system’s performance. A higher ITR can significantly enhance the speed and accuracy of communication between the brain and external devices, making it a crucial factor in determining the system’s effectiveness.
The ITR formula measures how efficiently a user can communicate with a computer using their brain signals, considering both speed and accuracy. This metric is typically expressed in bits per minute (bpm). The definition of ITR is as follows:
where N is the number of characters present in the BCI paradigm. In the present investigation, N has been determined to be 36. Additionally, the variable P represents character recognition accuracy, while the time taken for character recognition (T) has been explicitly defined as:
where is the number of repetitions, which has been assigned values of 1, 5, 10, and 15 for this investigation. In Figure 4, a comparison is made between the Information Transfer Rate achieved by the proposed method and those reported in earlier studies. The results indicate that the proposed approach yields a higher ITR than the other techniques. Specifically, the proposed method exhibits the highest ITR at all repetitions, as evidenced by the values of 10.9 bpm, 13.7 bpm, 10.7 bpm, and 8.6 bpm for 1, 5, 10, and 15 repetitions, respectively. These findings suggest that the system’s speed and character recognition accuracy are optimized across all repetitions.
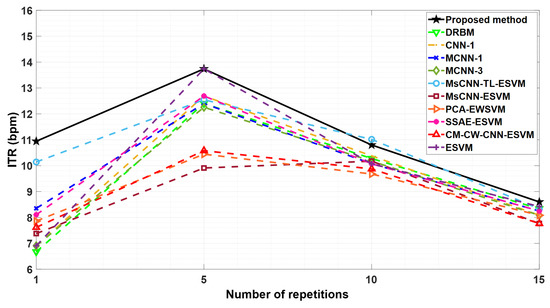
Figure 4.
Information transfer rate comparisons between proposed method and other methods reported in Table 3 based on the average accuracy of two subjects A and B from BCI competition III dataset II.
To utilize the proposed method on the BCI competition II dataset II, this study incorporated 42 training characters from subject C and 85 training characters from subject A to refine and optimize the model.
On the 4th repetition, the proposed technique accomplished a remarkable 100% accuracy rate on the BCI competition II dataset II. The character recognition accuracy for each epoch repetition is presented in Table 4 for reference. For this subject, we showed the effect of transfer learning on improving performance in a situation where all the training data were used. While the reduction in calibration time was not directly proportional to the decrease in the number of training characters, our study has demonstrated higher character recognition accuracy compared with other state-of-the-art methods, as shown in Table 4.
Table 4.
Character recognition accuracy (%) for subject “C” from BCI competition II dataset II using different previous studies and our proposed method in four repetitions.The evaluation involved using different methods from previous studies and our proposed technique.
The proposed method exhibited a commendable 77.4% accuracy in character recognition after the second repetition, indicating its viability for real-time BCI spelling.
4. Discussions
The approach used in this study aims to strike a balance between reducing the calibration time and maintaining high classification accuracy, which is directly linked to the size of the training sample used to train the model. To achieve this goal, we propose a novel transfer learning approach. To evaluate the effectiveness of our method, we utilize two state-of-the-art P300 speller-based datasets. This is because P300-based event-related potentials are subject-dependent [39,40] and are commonly used in neuromuscular patient studies [6,41,42]. Therefore, reducing calibration time is a crucial factor in these cases, and our approach offers practical implications for the development and application of P300 speller-based BCI systems.
Table 3 is a critical component of our study as it demonstrates our achievements. Conventional techniques such as CNN-1, MCNN-1, MCNN-3 [34], ESVM [35], and DRBM [36] are used for comparison purposes. Note that their results were obtained using all 85 training characters, yet they exhibit lower character recognition accuracy than our proposed method. The MsCNN-TL-ESVM, PCA-EWSVM, PCA-EWSVM, PCA-EWSVM, and CM-CW-CNN-ESVM [20] methods, which are demonstrated in Table 3, employ 45 training characters out of 85 available characters for model training. However, their performance is hindered by a limited training dataset, which often leads to overfitting of the model. To mitigate this issue, the TL technique involves training a pre-existing model on many training datasets, which helps avoid over-fitting, followed by fine-tuning with a smaller training dataset. While MsCNN-TL-ESVM uses the fine-tuning-based TL approach in their analysis, our proposed TL method achieves higher performance with a smaller number of training samples (30 training characters) due to the effectiveness of EA in the TL approach.
To further evaluate, we performed a statistical significance comparison based on a t-test between the character recognition performances of our proposed method and the MsCNN-TL-ESVM technique (results on 15 repetitions) for two subjects. The results reveal that our method achieves significantly improved performance compared with the MsCNN-TL-ESVM technique (p < 0.001). This suggests that our proposed TL method can be more effective in character recognition tasks, even with a limited training dataset. Furthermore, our proposed method achieves the highest ITR for the BCI competition III dataset II at the first and fifth epochs compared with other methods as demonstrated in Figure 4, whereas the MsCNN-TL-ESVM method demonstrates a comparable ITR at the tenth and fifteenth epochs. This indicates that our proposed method attains a higher speed than MsCNN-TL-ESVM with fewer epochs.
5. Limitations and Future Work
Although our proposed transfer learning method effectively reduces calibration time, a major limitation of our approach is that it requires a small number of training samples from target subjects to train the model. This limitation can restrict the applicability of our approach in real-world settings, where it is often challenging to obtain a sufficient number of training samples from target subjects. In this direction, future work could investigate alternative methods, such as developing a zero-training transfer learning approach that can reduce or eliminate the reliance on target subject data to train the model.
Another potential area for future research is the use of synthetic data generation techniques to enhance the training dataset. These techniques could be used to augment the existing target data or to simulate new data that can improve the model’s performance. Such an approach could help overcome the limitation of the small number of target subject data samples.
It is also essential to note that not all source samples may be suitable for the target data, which can lead to negative transfer. Therefore, future research should focus on developing effective methods for selecting appropriate source samples for the transfer learning algorithm. An efficient source sample selection strategy can significantly improve the performance of transfer learning and is an important research area to explore.
Overall, the proposed research has highlighted some significant limitations and potential areas for future research in transfer learning for BCI systems. Addressing these limitations can help improve the effectiveness and applicability of transfer learning approaches in P300-based BCI systems, ultimately improving the quality of life for people with disabilities.
6. Conclusions
After conducting our study, we can confidently conclude that our proposed method of using transfer learning in conjunction with fine-tuning the CNN and Euclidean alignment can efficiently reduce calibration time while maintaining high accuracy. Our approach achieved higher accuracy rates with fewer training samples, indicating that it is suitable for real-time implementation in P300 speller-based BCI systems. The results’ findings have important implications for the development of efficient and accurate character recognition systems, particularly in situations where calibration time is a critical factor. Furthermore, the findings of our study suggest that transfer learning can be a useful tool for improving the accuracy and efficiency of character recognition systems. This is particularly relevant in scenarios where large amounts of data are not readily available or when the data has high inter-subject variability. We believe our findings will be useful for researchers and practitioners working in computer vision and machine learning and that they will contribute to the development of more efficient and accurate character recognition systems.
Author Contributions
S.K.: Designed the method and implemented the method; prepared the primary version of the manuscript; discussed the results; reviewed the final manuscript. S.N.A.: Implemented the method; prepared the primary version of the manuscript; discussed the results; reviewed the final manuscript. M.H.: Prepared the primary version of the manuscript; reviewed several versions of the manuscript. All authors have read and agreed to the published version of the manuscript.
Funding
This work was supported by COST Action 19111 NEWFOCUS.
Institutional Review Board Statement
Not applicable.
Informed Consent Statement
Not applicable.
Data Availability Statement
Not applicable.
Conflicts of Interest
The authors declare no conflict of interest.
References
- Ramadan, R.A.; Vasilakos, A.V. Brain computer interface: Control signals review. Neurocomputing 2017, 223, 26–44. [Google Scholar] [CrossRef]
- Paszkiel, S.; Pawu, D. BCI Wheelchair Control Using Expert System Classifying EEG Signals Based on Power Spectrum Estimation and Nervous Tics Detection. Appl. Sci. 2022, 12, 10385. [Google Scholar] [CrossRef]
- Nicolas-Alonso, L.F.; Gomez-Gil, J. Brain computer interfaces, a review. Sensors 2012, 12, 1211–1279. [Google Scholar] [CrossRef] [PubMed]
- Kamhi, S.; Zhang, S.; Amou, M.A.; Mouhafid, M.; Javaid, I.; Ahmad, I.S.; El Kader, I.A.; Kulsum, U. Multi-Classification of Motor Imagery EEG Signals Using Bayesian Optimization-Based Average Ensemble Approach. Appl. Sci. 2022, 12, 5807. [Google Scholar] [CrossRef]
- Dinteren, R.; Arns, M.; Jongsma, M.L.A.; Kessels, R.P.C. P300 development across the lifespan: A systematic review and meta-analysis. PLoS ONE 2014, 9, e87347. [Google Scholar] [CrossRef] [PubMed]
- Gannouni, S.; Belwafi, K.; Alangari, N.; AboAlsamh, H.; Belghith, A. Classification Strategies for P300-Based BCI-Spellers Adopting the Row Column Paradigm. Sensors 2022, 22, 9159. [Google Scholar] [CrossRef]
- Taejun, L.; Kim, M.; Kim, S.P. Improvement of P300-based brain-computer interfaces for home appliances control by data balancing techniques. Sensors 2020, 20, 5576. [Google Scholar] [CrossRef]
- Waliszewska Prosół, M.; Bladowska, J.; Budrewicz, S.; Sąsiadek, M.; Dziadkowiak, E.; Ejma, M. The evaluation of Hashimoto’s thyroiditis with event related potentials and magnetic resonance spectroscopy and its relation to cognitive function. Sci. Rep. 2021, 11, 2480. [Google Scholar] [CrossRef]
- Waliszewska-Prosół, M.; Nowakowska-Kotas, M.; Kotas, R.; Bańkowski, T.; Pokryszko-Dragan, A.; Podemski, R. The relationship between event-related potentials, stress perception and personality type in patients with multiple sclerosis without cognitive impairment: A pilot study. Adv. Clin. Exp. Med. 2018, 27, 787–794. [Google Scholar] [CrossRef]
- Onishi, A.; Takano, K.; Kawase, T.; Ora, H.; Kansaku, K. Affective Stimuli for an Auditory P300 Brain-Computer Interface. Front. Neurosci. 2017, 11, 522. [Google Scholar] [CrossRef]
- Chen, X.; Wang, Y.; Nakanishi, M.; Gao, X.; Jung, T.-P.; Gao, S. High-speed spelling with a noninvasive brain-computer interface. Proc. Natl. Acad. Sci. USA 2015, 112, E6058–E6067. [Google Scholar] [CrossRef] [PubMed]
- Abiri, R.; Borhani, S.; Sellers, E.W.; Jiang, Y.; Zhao, X. A comprehensive review of EEG-based brain-computer interface paradigms. J. Neural Eng. 2019, 16, 011001. [Google Scholar] [CrossRef] [PubMed]
- Lotte, F.; Bougrain, L.; Cichocki, A.; Clerc, M.; Congedo, M.; Rakotomamonjy, A.; Yger, F. A review of classification algorithms for EEG-based brain-computer interfaces: A 10 year update. J. Neural Eng. 2018, 15, 031005. [Google Scholar] [CrossRef] [PubMed]
- Wan, Z.; Yang, R.; Huang, M.; Zeng, N.; Liu, X. A review on transfer learning in EEG signal analysis. Neurocomputing 2021, 421, 1–14. [Google Scholar] [CrossRef]
- Wu, D.; Xu, Y.; Lu, B.L. Transfer Learning for EEG-Based Brain-Computer Interfaces: A Review of Progress Made Since 2016. IEEE Trans. Cogn. Dev. Syst. 2020, 14, 4–19. [Google Scholar] [CrossRef]
- Panigrahi, S.; Nanda, A.; Swarnkar, T. A Survey on Transfer Learning. Smart Innov. Syst. Technol. 2021, 194, 781–789. [Google Scholar]
- Tan, C.; Sun, F.; Kong, T.; Zhang, W.; Yang, C.; Liu, C. A Survey on Deep Transfer Learning Chuanqi. In Proceedings of the 27th International Conference on Artificial Neural Networks, Rhodes, Greece, 4–7 October 2018; p. 11141. [Google Scholar]
- Ganin YLempitsky, V. Unsupervised Domain Adaptation by Backpropagation. In Proceedings of the 32nd International Conference on Machine Learning, Lille, France, 6–11 July 2015; Volume 37, pp. 1180–1189. [Google Scholar]
- Xu, G.; Shen, X.; Chen, S.; Zong, Y.; Zhang, C.; Yue, H.; Liu, M.; Chen, F.; Che, W. A Deep Transfer Convolutional Neural Network Framework for EEG Signal Classification. IEEE Access 2019, 7, 112767–112776. [Google Scholar] [CrossRef]
- Kundu, S.; Ari, S. P300 based character recognition using convolutional neural network and support vector machine. Biomed. Signal Process. Control 2020, 55, 101645. [Google Scholar] [CrossRef]
- Wang, Y.X.; Ramanan, D.; Hebert, M. Growing a brain: Fine-tuning by increasing model capacity. In Proceedings of the 30th IEEE Conference on Computer Vision and Pattern Recognition (CVPR 2017), Honolulu, HI, USA, 21–26 July 2017; pp. 3029–3038. [Google Scholar]
- Cetinic, E.; Lipic, T.; Grgic, S. Fine-tuning Convolutional Neural Networks for Fine Art Classification. Expert Syst. Appl. 2018, 114, 107–118. [Google Scholar] [CrossRef]
- Zanini, P.; Congedo, M.; Jutten, C.; Said, S.; Berthoumieu, Y. Transfer learning: A Riemannian geometry framework with applications to Brain-Computer Interfaces. IEEE Trans. Biomed. Eng. 2017, 65, 1107–1116. [Google Scholar] [CrossRef]
- He, H.; Wu, D. Transfer Learning for Brain-Computer Interfaces: A Euclidean Space Data Alignment Approach. IEEE Trans. Biomed. Eng. 2020, 67, 399–410. [Google Scholar] [CrossRef] [PubMed]
- Kilani, S.; Kordmahale, S.N.A.; Ghassemlooy, Z.; Hulea, M.; Wu, Q. Reducing calibration time using novel hybrid transfer-learning for P300-based BCI applications. In Proceedings of the 13th International Symposium on Communication Systems, Networks and Digital Signal Processing (CSNDSP), Porto, Portugal, 20–22 July 2022; pp. 401–405. [Google Scholar]
- Rezeika, A.; Benda, M.; Stawicki, P.; Gembler, F.; Saboor, A.; Volosyak, I. Brain-computer interface spellers: A review. Brain Sci. 2018, 8, 57. [Google Scholar] [CrossRef] [PubMed]
- Blankertz, O.B. Documentation Wadsworth BCI Dataset (P300 Evoked Potentials). BCI Classif. Contest 2002, 1–9. Available online: https://www.bbci.de/competition/ii/albany_desc/albany_desc_ii.pdf (accessed on 5 April 2023).
- Lawhern, V.J.; Solon, A.J.; Waytowich, N.R.; Gordon, S.M.; Hung, C.P.; Lance, B.J. EEGNet: A compact convolutional neural network for EEG-based brain-computer interfaces. J. Neural Eng. 2018, 15, 1–30. [Google Scholar] [CrossRef]
- Liu, M.; Wu, W.; Gu, Z.; Yu, Z.; Qi, F.; Li, Y. Neurocomputing Deep learning based on Batch Normalization for P300 signal detection. Neurocomputing 2018, 275, 288–297. [Google Scholar] [CrossRef]
- Yosinski, J.; Clune, J.; Bengio, Y.; Lipson, H. How transferable are features in deep neural networks? Adv. Neural Inf. Process. Syst. 2014, 4, 3320–3328. [Google Scholar]
- Aghili, S.N.; Kilani, S.; Khushaba, R.; Rouhani, E. A spatial-temporal linear feature learning algorithm for P300-based brain-computer interfaces. Heliyon 2023, 9, e15380. [Google Scholar] [CrossRef]
- Li, J.; Yu, Z.L.; Gu, Z.; Tan, M.; Wang, Y.; Li, Y. Spatial-Temporal Discriminative Restricted Boltzmann Machine for Event-related Potential Detection and Analysis. IEEE Trans. Neural Syst. Rehabil. Eng. 2019, 27, 139–151. [Google Scholar] [CrossRef]
- García-Alonso, C.R.; Pérez-Naranjo, L.M.; Fernández-Caballero, J.C. Multiobjective evolutionary algorithms to identify highly autocorrelated areas: The case of spatial distribution in financially compromised farms. Ann. Oper. Res. 2014, 219, 187–202. [Google Scholar] [CrossRef]
- Cecotti, H.; Gräser, A. Convolutional neural networks for P300 detection with application to brain-computer interfaces. IEEE Trans. Pattern Anal. Mach. Intell. 2011, 33, 433–445. [Google Scholar] [CrossRef]
- Rakotomamonjy, A.; Guigue, V. BCI competition III: Dataset II-ensemble of SVMs for BCI P300 speller. IEEE Trans. Biomed. Eng. 2008, 55, 1147–1154. [Google Scholar] [CrossRef] [PubMed]
- Varsamou, M.; Antonakopoulos, T. Classification using discriminative restricted boltzmann machines on spark. In Proceedings of the 2019 International Conference on Software, Telecommunications and Computer Networks, SoftCOM 2019, Split, Croatia, 19–21 September 2019; pp. 536–543. [Google Scholar]
- Kaper, M.; Meinicke, P.; Grossekathoefer, U.; Lingner, T.; Ritter, H. BCI competition 2003—Data set IIb: Support vector machines for the P300 speller paradigm. IEEE Trans. Biomed. Eng. 2004, 51, 1073–1076. [Google Scholar] [CrossRef] [PubMed]
- Yu, T.; Yu, Z.; Gu, Z.; Li, Y. Grouped Automatic Relevance Determination and Its Application in Channel Selection for P300 BCIs. IEEE Trans. Neural Syst. Rehabil. Eng. 2015, 23, 1068–1077. [Google Scholar] [CrossRef] [PubMed]
- Mussabayeva, A.; Jamwal, P.K.; Akhtar, M.T. Ensemble Voting-Based Multichannel EEG Classification in a Subject-Independent P300 Speller. Appl. Sci. 2021, 11, 11252. [Google Scholar] [CrossRef]
- Velasco-Álvarez, F.; Fernández-Rodríguez, Á.; Vizcaíno-Martín, F.-J.; Díaz-Estrella, A.; RRon-Angevin, R. Brain-computer interface (BCI) control of a virtual assistant in a smartphone to manage messaging applications. Sensors 2021, 21, 3716. [Google Scholar] [CrossRef]
- Mezzina, G.; Annese, V.F.; De Venuto, D. A Cybersecure P300-Based Brain-to-Computer Interface against Noise-Based and Fake P300 Cyberattacks. Sensors 2021, 21, 8280. [Google Scholar] [CrossRef]
- Li, M.; Li, F.; Pan, J.; Zhang, D.; Zhao, S.; Li, J.; Wang, F. The MindGomoku: An Online P300 BCI Game Based on Bayesian Deep Learning. Sensors 2021, 21, 1613. [Google Scholar] [CrossRef]
Disclaimer/Publisher’s Note: The statements, opinions and data contained in all publications are solely those of the individual author(s) and contributor(s) and not of MDPI and/or the editor(s). MDPI and/or the editor(s) disclaim responsibility for any injury to people or property resulting from any ideas, methods, instructions or products referred to in the content. |
© 2023 by the authors. Licensee MDPI, Basel, Switzerland. This article is an open access article distributed under the terms and conditions of the Creative Commons Attribution (CC BY) license (https://creativecommons.org/licenses/by/4.0/).